Patel et al. / IJDFR volume 3 and issue 3, May-June, 2012 Available online at www.ordonearresearchlibrary.org
ISSN 2229-5054
Research Article
INTERNATIONAL JOURNAL OF DRUG FORMULATION AND RESEARCH
DEVELOPMENT AND VALIDATION OF SPECTROPHOTOMETRIC METHOD FOR SIMULTANEOUS DETERMINATION OF AMLODIPINE BESYLATE AND INDAPAMIDE IN THEIR COMBINED DOSAGE FORMULATION BY ABSORBANCE CORRECTION METHOD. Aanal B.Patel1*, C. N. Patel1 1*- Department of Quality Assurance, Shri Sarvajanik Pharmacy College, Mehsana, Gujarat. Received: 20 May. 2012; Revised: 8 June 2012; Accepted: 26 June. 2012; Available online: 5 July.. 2012
ABSTRACT A simple, accurate and precise spectrophotometric method has been developed for simultaneous estimation of Amlodipine Besylate And Indapamide In combined dosage form. Simultaneous equation method is employed for simultaneous determination of Amlodipine Besylate And Indapamide in tablet dosage forms. In this method, the absorbance was measured at 360 nm for Amlodipine Besylate and 242 nm for Indapamide. Linearity were observed in range of 10-60 μg/ml and 3-15 μg/ml for Amlodipine Besylate And Indapamide respectively. Recovery studies confirmed the accuracy of proposed method and results were validated as per ICH guidelines. The method can be used for routine quality control of pharmaceutical formulation containing Amlodipine Besylate And Indapamide. Key words Amlodipine Besylate, Indapamide, Simultaneous estimation, UV spectrophotometry
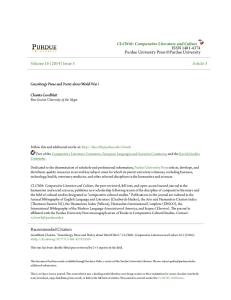
INTRODUCTION Amlodipine Besylate (AMBL) is a calcium channel blocker. Amlodipine is a dihydropyridine calcium antagonist, with a long duration of action, used for the treatment of hypertension and is 3-Ethyl 5-methyl (4RS)-2-[(2-aminoethoxy)
methyl]-4-(2-chlor
6-
methyl-1,4
dihydropyridine-3,5-dicarboxylate
benzenesulphonate. [Figure-1] with molecular formula of C20H25ClN2O5.C6H5SO3H and molecular weight of 567.1 g/mol. . Indapamide is a non-thiazide sulphonamide diuretic drug. A benzamide-sulfonamide-indole. It is called a thiazide-like diuretic but structure is different enough (lacking the thiazo-ring) and 4-chloro-N-(2-methyl-2,3dihydroindol-1-yl)- 3-sulfamoyl-benzamide [Figure-2] with molecular formula of C16H16ClN3O3S. and molecular weight of 365.8 g/mol.
90
Patel et al. / IJDFR volume 3 and issue 3, May-June, 2012
Patel et al. / IJDFR volume 3 and issue 3, May-June, 2012 The literature reveals that several spectrometric methods available for individual AMLB and INDA [1, 2, 3, 4, 5, 6]. A number of HPTLC and HPLC method are reported for AMLB and INDA determination [7, 8, 9, 10,11]. but no method has been reported for their simultaneous estimation of AMLB and INDA in combined tablet dosage form by UV method. MATERIALS AND METHODS Apparatus A shimadzu model 1700(Japan) double beam UV/Visible spectrophotometer with spectral width of 2 nm, wavelength accuracy of 0.5 nm and a pair of 10 mm matched quartz cell was used to measure absorbance of all the solutions. Spectra were automatically obtained by UV-Probe system software (UV Probe version 2.31). An Electronic analytical balance (Acculab) and an ultrasonic bath were used in the study. Reagents and Materials Reference standard of AMLB and INDA were obtained from Zydus pharmaceutical respectively as a gift sample, whereas their formulation obtained from local market. Analytical grade Methanol obtained from Finar Chemicals (Mumbai, India).
Preparation of standard stock solution An accurately weighed quantity of AMLB (10 mg) and INDA (10 mg) were transferred to a separate 10 ml volumetric flask and dissolved and diluted to the mark with methanol. Take 1 ml of above solution into 10 ml volumetric flask and dilute the mark with methanol to obtain standard solution having concentration of AMLB (100 μg/ml) and INDA (100 μg/ml). This solution was used as working standard solution. Method Ten tablets were weighed. They were triturated in glass mortar. Average weight was calculated. The tablet powder equivalent to 5 mg of Amlodipine besylate and 1.5 mg of Indapamide was transferred in 50 ml volumetric flask, dissolved and diluted up to mark with methanol. The solution was sonicated for 15minutes. Filter the solution through Whatman filter paper no.42 and discard first few drops of filtrate. Pipette out 1ml of the above solution in 10ml volumetric flask and diluted to mark with methanol. Absorbance of the resulting 91
Patel et al. / IJDFR volume 3 and issue 3, May-June, 2012
Patel et al. / IJDFR volume 3 and issue 3, May-June, 2012 solution was measured at 360.0 nm and 242.0 nm against methanol.The proposed Absorbance correction method was successfully applied for determination of AMLB and INDA from Pharmaceutical formulation. The percentage of AMLB and INDA was found to be satisfactory, which is comparable with the corresponding claim amount. The concentration of AMLB and INDA can be obtained as =
×
=
……………………………… (1) ……………..…………..…… (2)
Where, A1 and A2 are the absorbances of mixture at 360.0 nm and 242.0 nm respectively, ax1 and ax2 are absorptivities of AMLB at 360.0 nm and 242.0 nm respectively, ay1 and ay2 are absorptivities of INDA at 242.0 nm and 360.0 nm respectively.
VALIDATION OF PROPOSED METHOD Linearity The calibration curves were plotted over a concentration range of 10-60 μg/ml for AMLB and 3-15 μg/ml INDA. Accurately measured standard stock solutions of each AMLB (1, 2, 3, 4, 5, 6 ml) and INDA (0.3, 0.6, 0.9, 1.2, 1.5 ml) were transferred to a series of 10 ml volumetric flask separately and diluted up to the mark with methanol. The absorbance of solution was then measured at 360 nm and 242 nm. The calibration curves were constructed by plotting absorbance versus concentration and the regression equations were calculated. Precision Intraday Precision Mixed solutions containing 20-40 µg/ml AMLB and 6-12 µg/ml INDA was analyzed 3 times on the same day and % RSD was calculated. Interday Precision 92
Patel et al. / IJDFR volume 3 and issue 3, May-June, 2012
Patel et al. / IJDFR volume 3 and issue 3, May-June, 2012 Mixed solutions containing 20-40 µg/ml AMLB and 6-12 µg/ml INDA was analyzed on 3 different day and % RSD was calculated. Accuracy The accuracy of the method was determined by calculating recoveries of AMLB and INDA in mixture by the standard addition method. Known amount of standard solutions of AMLB (0, 16, 20 and 24 µg/ml) and INDA (0, 4.8, 6.0 and 7.2 µg/mL) were added to a pre-quantified sample solution of 20 µg/ml AMLB and 6 µg/ml INDA mixtures. The absorbance of AMLB and INDA were recorded at λ1 and λ2. The percentage recovery was calculated by measuring the absorbance of both drug at their absorbance maxima and fitting these values into simultaneous equation. Each response was average of three determinations. Limit of detection and Limit of quantization The limit of detection (LOD) and the limit of quantization (LOQ) of the drug were derived by calculating the signal-to-noise ratio (S/N, i.e., 0.16 for LOD and 0.2 for LOQ) using the following equations designated by International Conference on Harmonization (ICH) guidelines [12]. LOD = 3.3 × σ/S
LOQ = 10 × σ/S Where, σ = the standard deviation of the response and S = slope of the calibration curve. Analysis of MS and OLM in combined tablet Take 10 tablets and weighed. Find out average weight. Take tablet powder equivalent to 5 mg of AMLB and 1.5 mg of INDA was transferred in 100 ml volumetric flask, dissolved and diluted up to mark with methanol. The solution was sonicated for 30 minutes. Filter the solution through Whatman filter paper no.42 and discard first few drops of filtrate. Pipette out 1ml of the above solution in 10ml volumetric flask and diluted to mark with simple methanol. Absorbance of the resulting solution was measured at 360.0 nm and 242.0 nm against methanol, relative concentration of two drugs in the sample was calculated using above equation (1) and (2).
93
Patel et al. / IJDFR volume 3 and issue 3, May-June, 2012
Patel et al. / IJDFR volume 3 and issue 3, May-June, 2012 a
RSD = Relative standard deviation. bLOD = Limit of detection. cLOQ = Limit of quantitation
d
SD is Standard deviation and n is number of replicates.
RESULT AND DISCUSSION In simultaneous equation method, the primary requirement for developing a method for analysis is that the entire spectra should follow the Beer’s law at all the wavelength, which was fulfilled in case of both these drugs. The two wavelengths were used for the analysis of the drugs were 360 nm (λmax of AMLB) and 242 nm (λmax of INDA) at which the calibration curves were prepared for both the drugs. The overlain UV absorption spectra of AMLB (360 nm) and INDA (242 nm) in methanol is shown in Figure 3. The validation parameters were studied at all the wavelengths for the proposed method. Accuracy was determined by calculating the recovery and the mean was determined Table 2. The method was successfully used to determine the amounts of AMLB and INDA present in the tablet dosage forms. The results obtained were in good agreement with the corresponding labeled amount Table 3. Precision was calculated as repeatability and intra and inter day variations (% RSD) for both the drugs. CONCLUSION The developed simultaneous equation method is found to be simple, sensitive, accurate and precise and can be used for routine analysis of AMLB and INDA. The developed method was validated as per ICH guidelines [12]. Statistical analysis proved that the method is repeatable and selective for the analysis of AMLB and INDA in their combined pharmaceutical formulations. ACKNOWLEDGEMENT The authors are thankful to Zydus Pharmaceuticals, Ahemdabad, and Gujarat, India for providing gift sample of AMLB and INDA for research. The authors are highly thankful to Shri Sarvajanik Pharmacy College, Mehsana, and Gujarat, India for providing all the facilities to carry out the work.
94
Patel et al. / IJDFR volume 3 and issue 3, May-June, 2012
Patel et al. / IJDFR volume 3 and issue 3, May-June, 2012
References [1] Garg G, Saraf S, Saraf S, Trends in Applied sciences research, 2008, 3(3), 278-284. [2] Chitlange SS, Imran Md, Wankhede SB, and Sakarkar DM, Research Journal of Pharmacy and Technology, 2008, 1(2), 80. [3] Kakde RB, Kotak VH, Barsagade AG, Chaudhary NK, and Kale DL, Research J. Pharm. and Tech., 2008,1(4), 513-515. [4] Kasture AV, Ramteke M, Indian journal of Pharmaceutical science, 2006, 68 (3), 394-396. [5] Kadi Sarva Vishwavidyalaya, International Journal of Pharm Tech Research Jan-Mar 2009 Vo2, No.1, pp 411-416. [6] P.V.Pawar et al. International Journal Of Pharmacy &Technology
2010, vol1.
[7] Malesuik MD, Cardos SG, Bajerski L, Lanzanova FA, Journal of AOAC international, 2006,89(2), 359-364. [8] Chitlange SS, Bagri K, and Sakarkar DM, Asian J. Research Chem., 2008,1(1), 15-18. [9] Neha Manish Munot et al, Journal of Pharmacy Research 2010, 3(12),2941-2943. [10] Indian Pharmacopoeia, Volume 2, Ghaziabad: Govt. of India Ministry of
Health
& Family welfare, The Controller of Publication, 2007,714-716, 749-752, A-84. [11] Pandya KK, Satia M, Gandhi TP, Modi I, Modi RI, Chakravarthy BK, layer C, J Chromatogr B Biomed Appl., 1995,667, 315-20. [12] ICH Guideline Q2 (R1), Validation of Analytical Procedures: Text and
Methodology, ICH,
Geneva, 2005.
95
Patel et al. / IJDFR volume 3 and issue 3, May-June, 2012
Patel et al. / IJDFR volume 3 and issue 3, May-June, 2012
Table 1: Regression Analysis Data and Summary of Validation Parameters for the Proposed Method Sr. Parameters
AMLB
INDA
1
Wavelength range (nm)
360
242
2
Beer’s law limit (μg/ml)
10-60
3-15
3
Regression equation (y = mx + c)
y = 0.0125x + 0.0033
y = 0.0584x + 0.0419
4
Slope
0.0125
0.0584
5
Intercept
0.0033
0.0419
6
Correlation Coefficient (r2)
0.9996
0.9992
1.Intraday Precision(n = 3)
0.04-0.33%
0.03-0.14%
2.Interday Precision(n = 3)
0.32-0.57%
0.17-0.38%
8
Accuracy (% recovery) (n = 3)
97.67-99.00%
98.05-100.90%
9
LODb (μg/ml)
0.22
0.39
10
LOQc (μg/ml)
0.68
1.30
11
Assay (±S.D.)d (n = 3)
99.03 ± 0.84
100.02 ± 1.47
No
System Precision (%R.S.D)a 7
96
Patel et al. / IJDFR volume 3 and issue 3, May-June, 2012
Patel et al. / IJDFR volume 3 and issue 3, May-June, 2012
Table 2: Recovery Data of Proposed Method % Mean Amount taken
Amount
Amount
(μg/ml)
added (μg/ml)
added (%)
recovery
Drug
(±S.D) (n = 3) 20
00
0
00
20
16
80
97.67 ±0.007
20
20
100
96.04 ±0.004
20
24
120
99.99±0.005
8
00
0
00
6
4.8
80
98.05 ±0.010
6
6.0
100
99.60 ±0.007
6
7.2
120
100.90 ±0.005
AMLB
INDA
Table 3: Analysis of AMLB and INDA by Proposed Method % Label claim Formulation
Labeled claim (mg) (±S. D.) (n = 3) AMLB
INDA
5.0
1.5
AMLB
INDA
Amlodac-D
97
99.03 ±0.64 100.02 ± 1.07
Patel et al. / IJDFR volume 3 and issue 3, May-June, 2012
Patel et al. / IJDFR volume 3 and issue 3, May-June, 2012
Figure 1: The chemical structure of Amlodipine Besylate
Figure 2: The chemical structure of Olmesartan Medoxomil
Figure 3: Overlain absorption spectra of AMLB (360 nm) and INDA (242 nm) in methanol
98
Patel et al. / IJDFR volume 3 and issue 3, May-June, 2012