CRIME DOES NOT CAUSE PUNISHMENT The impact of sentencing policy on levels of crime1 Michael Tonry Professor of Law and Public Policy, University of Minnesota
[email protected]
If countries can learn from one another, South Africa can learn from the experiences of other countries that have re-organised their sentencing systems in recent decades. South Africa’s correctional system has many similarities to America’s – seriously overcrowded prisons, sentences that are too long, stark disparities, and therefore injustices, in sentences received for comparable crimes. American solutions – mandatory minimums, prison terms measured in decades not years – have neither reduced crime rates nor made streets safer. Nor will they in South Africa. Comparisons of countries with very different sentencing policies and punishment practices – Canada versus the United States, Finland versus the rest of Scandinavia, England versus Scotland – show that sentencing and punishment have little discernible effect on crime trends and patterns. Crime trends and patterns in most developed countries move in broad parallel, irrespective of national punishment policies.
C
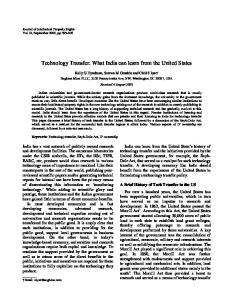
rime and imprisonment statistics from a number of First World countries over a 30year period support Mark Mauer’s (2006) proposition that ‘crime does not cause punishment’ – that incarceration rates are a matter of policy, and do not have significant effects on levels of crime. Over the period 1960–1993, violent crime in the US went up four to five times and the incarceration rate went up three to four times, but the murder rate stayed fairly static (Figure 1). In Germany over a similar period (1961–1992), violent crime went up 3.5 times, the murder rate stayed at the same level, but imprisonment went down in the 1960s and stayed flat for 30 years (Figure 2). In Finland over the period 1965–1994, violent crime went
SA CRIME QUARTERLY No 20 • JUNE 2007
up, murder rose substantially, but imprisonment went down (Figure 3). In France (Figure 4), the number of people in prison per 100 000 population zigzagged because there is a fundamentally different political culture and philosophy about crime and punishment. In that country, you are primarily a citizen. Everybody celebrates national events, and large numbers of prisoners are released every time there is a French presidential inauguration or a significant national event. During the period 1950–2000, the incarceration rates in Denmark, Norway and Sweden were similar, and the imprisonment rate in Finland dramatically dropped over the period to a level similar to that of its neighbours (Figure 5). This is
13
Figure 1: Imprisonment, violent crime and murder rates in the US per 100 000 population 1960–19932
800
Prisoners per 100 000 inhabitants
700 600 500 400 300 200 100
1960
1965
1970
1975
Violent crime
1980 Prisoners
1985
1990
1993
Murder (x 10)
Figure 2: Imprisonment, violent crime and murder rates in Germany per 100 000 population 1961–1992
Prisoners per 100 000 inhabitants
250
200
150
100
50
0 1961
1964
1968
1972 Violent crime
14 TONRY
1976
1980
Prisoners
1984
1988
1992
Murder (x 10)
SA CRIME QUARTERLY No 20 • JUNE 2007
what the Finns wanted. They had been under Russian domination from the early 1800s to the mid-1900s, and had similar incarceration rates to the Soviet Union. By 1950, Finland decided it did not want to be eastern; it decided to look west instead, and wanted to demonstrate how Scandinavian it was by taking a deliberate policy decision to reduce the rate at which it incarcerated
people. There was an enormous outbreak of crime in Finland when this decision was taken. However, if you look at comparative crime statistics across the four Nordic countries for the period 1960–2000 (assuming these are actual crime rates – crime definitions vary from one country to another), the curves are almost exactly the same.
Figure 3: Imprisonment, violent crime and murder rates in Finland per 100 000 population 1965–1994
Prisoners per 100 000 inhabitants
450 400 350 300 250 200 150 100 50 0 1965
1970
1975
1980
Violent crime
1985
Prisoners
1990
1994
Murder (x 10)
Figure 4: Incarceration rates in France per 100 000 population 1965–2005
90 80
50 40 30 20 1965
1970
1975
1980
SA CRIME QUARTERLY No 20 • JUNE 2007
Bastille Fall pardon
60
Presidential pardon
70
Presidential pardon
Prisoners per 100 000 inhabitants
100
1985
1990
1995
2000
2005
TONRY 15
Figure 5: Incarceration rates in four Scandinavian countries 1950–2000 per 100 000 population 200 180 160 140 120 100 80 60 40 20 0 1950
1954
1958
1962
1966
Denmark
1970
1974
1978
Finland
1982
1986
Norway
1990
1994
1998
Sweden
Figure 6: Offences against the criminal code in four Scandinavian countries 1960–2000 per 100 000 population 14 000 12 000 10 000 8 000 6 000 4 000 2 000 0 1950
1954
1958
1962 Denmark
16 TONRY
1966
1970
1974
Finland
1978
1982 Norway
1986
1990
1994
1998
Sweden
SA CRIME QUARTERLY No 20 • JUNE 2007
The US imprisonment rate has skyrocketed to about 4.5 times the Canadian rate, which has remained at about 100 per 100 000 since the 1950s (Figure 7). The homicide rates in the US over 40 years are far higher than those of Canada (Figure 8). But if one looks at the relative change in homicide rates in the US and Canada (with the rates standardised at 1), it is clear that the trends are very similar (Figure 9).
Again, this backs up the assertion that countries choose the rate at which their residents are incarcerated. France chooses from year to year what proportion of its people should be in prison. The US chose to increase its incarceration rate, but this has not affected its crime levels. The experience of Norway, Denmark, Sweden and Finland shows the level of imprisonment makes no difference to the
Figure 7: Violent crime and imprisonment rates for the US and Canada 1980–2000 per 100 000 population
800 700 600 500 400 300 200 100
19 80 19 81 19 82 19 83 19 84 19 85 19 86 19 87 19 88 19 89 19 90 19 91 19 92 19 93 19 94 19 95 19 96 19 97 19 98 19 99 20 00
0
US homicide rate (x5)
US robbery rate
US imprisonment rate
Canadian homicide rate (x5)
Canadian robbery rate
Canadian imprisonment rate
Figure 8: Homicide rates in the US and Canada 1961–2003 per 100 000 population 12 10 8 6 4 2
19 61 19 63 19 65 19 67 19 69 19 71 19 73 19 75 19 77 19 79 19 81 19 83 19 85 19 87 19 89 19 91 19 93 19 95 19 97 19 99 20 01 20 03
0
Canada
SA CRIME QUARTERLY No 20 • JUNE 2007
USA
TONRY 17
level of crime – the Finns decided to stabilise their imprisonment rate and steadily drop it to the level of their neighbours as a matter of policy, but their crime rate curves were the same as those of their neighbours. Are minimum and mandatory penalties doing the job? The advocates of minimum and mandatory sentences claim that they act as a deterrent, and that they promote consistency in sentencing, but this is not supported by available evidence. Studies show judges and juries tend to avoid having to impose minimum/ mandatory sentences, that such penalties have no deterrent effect (or a temporary one), and that sentences are not consistently applied. There are also cases where these sentences have led to profound injustices. In 18th and 19th century England the death penalty was mandatory for about 150 crimes in the belief that this would reduce crime. Pick-pocketing was one such crime, but no deterrent effect was apparent – rampant pick-pocketing was reported at public executions of pick-pockets. Anybody found guilty of the theft of property worth more than £20 had to be executed. This was later reduced to theft of only £5. In practice, when judges and juries felt uncomfortable about having to impose such a harsh
sentence, they worked hard to evade minimum sentencing by finding thieves guilty of stealing only £4 and 19 shillings. Some thieves were pardoned. The pleading rules for a valid prosecution became increasingly technical to make it more difficult for this kind of whole-scale evasion to take place, but with little effect. The belief that minimum/ mandatory sentencing would promote consistency in sentencing was also shown to be false. There was enormous inconsistency in what happened to individual thieves at that time. Some were convicted of stealing £4 and 19 shillings, some were executed, some were convicted and pardoned, and some convictions were overturned on technical grounds. Mandatory penalties proliferated in the US over a long period of time for such offences as drug crimes, also motivated by the belief that this would act as a deterrent. The US experience indicates that these measures have no deterrent effect, and that large-scale evasion of having to impose such penalties has taken place. There have been cases where offenders have been imprisoned for 20 years on drug charges in circumstances where judges did not believe these sentences were appropriate. Several judges resigned in protest, including two from the Federal Bench.
Figure 9: Change in homicide rates in the US and Canada per 100 000 population
Relative change from 1961
2.5 2 1.5 1 0.5
19 61 19 63 19 65 19 67 19 69 19 71 19 73 19 75 19 77 19 79 19 81 19 83 19 85 19 87 19 89 19 91 19 93 19 95 19 97 19 99 20 01 20 03
0
Canada rate: base 1961=1.00
18 TONRY
US rate: base 1961=1
SA CRIME QUARTERLY No 20 • JUNE 2007
The evasion finding is pretty consistent, as is the finding that minimum sentencing has no deterrent effect, or that any short-term deterrent effect tends to wither away over time. Reducing particular crimes is a valid public objective, but minimum sentencing is not the way to achieve this goal.
the guidelines left the bench, and sitting judges influenced new judges. Presumptive guidelines, as applied in Minnesota, Washington, and Oregon, seem to increase the consistency of sentencing in general, and particularly in relation to race, gender, and geographical disparities.
Sentencing policy: a need for consistency, accountability and transparency There have been five or six ways that countries have reorganised their sentencing systems over the last 30 years to achieve systems that are more just – consistent, accountable and transparent. Some work, some do not. The best evidence points in one direction for South Africa.
Mandatory guidelines for sentencing have been part of the US Federal Court system for about 20 years. For example, robbery would receive more and more serious penalties if, for instance, there was a firearm involved, if the firearm was fired, and so on. The official policy of the US Sentencing Commission was that judges ought to impose a very specific sentence. This meant that a number of potentially mitigating circumstances, such as a convicted person having family responsibilities, being a drug user, having a deprived childhood or making a contribution to the community, were not ordinarily regarded as factors in sentencing.
Finland and Sweden have radically changed their sentencing laws in the last 30 years. They have sentencing principles that provide judges with guidance on most of the questions they are likely to be faced with, including the weight that should be accorded to a prior record; the extent to which a person is dangerous or can be changed through rehabilitation; and what difference it makes if a person is not really an adult (in Sweden anyone below 15 is legally incapable of committing a crime). Verbal statements of principle seem to produce a system that is highly consistent and they provoke stimulating debates about exactly how to apply a principle in a certain kind of case. In those countries, sentencing guidelines seem to make a difference. In the UK, and to some extent in Canada and Australia, high courts may issue guideline judgments, but the jury is still out on whether this makes any difference to sentencing practice. There is no empirical evidence that this has an influence on what judges actually do in the UK. In some US states there are very detailed voluntary guidelines that tend to indicate sentences for every crime and every combination of prior record. Conscientious judges will look at these when considering a sentence. The evidence is that these have no demonstrable effect, although a major exception is in Delaware, where there are only 14 felony court judges, most of whom were involved in drafting the guidelines. Judges who disagreed with
SA CRIME QUARTERLY No 20 • JUNE 2007
Sentencing became progressively harsher, frequently driven by the prosecution. The judiciary resisted this set of guidelines for the entire period that they were in force, until 2004, when they were declared unconstitutional. The guidelines are now voluntary. Judges may impose what they consider to be an appropriate sentence, provided they give reasons for their decision. The Finnish and Swedish systems of sentencing principles tend to recommend very short periods of imprisonment – rarely more than a year, and often only for a week or two. The number of prisoners in those countries sentenced to more than three years is a fraction of 1%. The maximum sentence for most crimes is 14 years. This means the potential for inconsistency and disparity is very small. Those countries have a high-prestige career judiciary – a cadre of highly talented professionals with a strong ethos about their duty to exercise justice. Students who want to be prosecutors or judges select their direction in law school (although they may move back and forth between the two professions). The prosecution sees itself as a semi-judicial institution. The judiciary therefore puts strong professional and cultural norms into practice to
TONRY 19
preserve just sentencing principles. No US state could adopt Scandinavian principles because the political character of the US courts is so strong. But voluntary guidelines in US state courts can make a huge difference when there is a professional cadre of prosecutors and judges who share a professional ethos.
25-26 October 2006 in Cape Town. The address was first published by the OSF-SA in 2006 in the conference report entitled Sentencing in South Africa: Conference Report, available at www.osf.org.za. The opinions expressed in this article are those of the author and not those of OSFSA.
Conclusion Crime does not cause punishment. There is nothing inherent in South Africa that suggests its incarceration rate should be 350–400 people per 100 000. Imprisonment rates are chosen by politicians, they are not the result of increased crime. The transitional character of South African politics makes it different from Sweden or Finland, but there is no reason to think that it is any different to any one of the countries where it has been shown that the level of imprisonment makes no difference to crime.
References Mauer, M 2006. Sentencing in South Africa: Lessons from the United States. Sentencing in SA: Conference Report. Cape Town: Open Society Foundation.
There is no evidence for the claim that mandatory/ minimum sentencing has any impact on consistency of sentencing or levels of crime. The primary function of such sentences is for governments to symbolically say ‘we are doing something about crime’. This does not seem to fool anybody. The percentage of people who say they are fearful to go out at night before and after the imposition of mandatory sentencing does not seem to change. The proposal of the South African Law Reform Commission for a structured approach is probably the only way to achieve reasonable consistency, predictability and transparency in sentencing. This also provides a potential mechanism for holding judges accountable i.e. to ensure they apply a sentence appropriate to the offender rather than reflecting the personal attitudes of the judge.
Van Zyl Smit, D 2006. Notes on a new sentencing framework for South. Sentencing in SA: Conference Report. Cape Town: Open Society Foundation. Endnote 1 This is the second article in a series on sentencing published by the SACQ. See Redpath, J & O’Donovan, M 2007. The impact of minimum sentencing. SA Crime Quarterly (19). Pretoria: Institute for Security Studies. 2 All graphs taken from M Tonry 2006. ‘Conference on Sentencing in South Africa: Keynote Address,’ in Sentencing in South Africa: Conference Report. Newlands, South Africa: Open Society Foundation: 4-9.
It is suggested that South Africa should decide to reduce imprisonment rates by 50%, persuade Parliament not to renew the minimum sentencing legislation, and follow Dirk van Zyl Smit’s (2006) lead on a structured approach to sentencing. Acknowledgement This article is based on a keynote address delivered by the author at the Open Society Foundation SA’s conference on sentencing in South Africa held from
20 TONRY
SA CRIME QUARTERLY No 20 • JUNE 2007