Cancer Informatics
Methodology
Open Access Full open access to this and thousands of other papers at http://www.la-press.com.
Identification of Predictive Pathways for Non-Hodgkin Lymphoma Prognosis Xuesong Han1, Yang Li2, Jian Huang3, Yawei Zhang2, Theodore Holford2, Qing Lan4, Nathaniel Rothman4, Tongzhang Zheng2, Michael R. Kosorok5 and Shuangge Ma2,6 Department of Nutrition, University of North Carolina at Chapel Hill, Chapel Hill, NC 27599, USA. 2School of Public Health, Yale University, New Haven CT 06520, USA. 3Departments of Statistics and Actuarial Science, and Biostatistics, University of Iowa, Iowa City, IA 52242-1409, USA. 4Division of Cancer Epidemiology and Genetics, National Cancer Institute, NIH, Bethesda, MD 20892-7232, USA. 5Department of Biostatistics, University of North Carolina at Chapel Hill, Chapel Hill, NC 27599, USA. 6Clinical Epidemiology Research Center, VA Connecticut Health Care System, West Haven, CT 06516, USA. Corresponding author email:
[email protected] 1
Abstract: Despite decades of intensive research, NHL (non-Hodgkin lymphoma) still remains poorly understood and is largely incurable. Recent molecular studies suggest that genomic variants measured with SNPs (single nucleotide polymorphisms) in genes may have additional predictive power for NHL prognosis beyond clinical risk factors. We analyzed a genetic association study. The prognostic cohort consisted of 346 patients, among whom 138 had DLBCL (diffuse large B-cell lymphoma) and 101 had FL (follicular lymphoma). For DLBCL, we analyzed 1229 SNPs which represented 122 KEGG pathways. For FL, we analyzed 1228 SNPs which represented 122 KEGG pathways. Unlike in existing studies, we targeted at identifying pathways with significant additional predictive power beyond clinical factors. In addition, we accounted for the joint effects of multiple SNPs within pathways, whereas some existing studies drew pathway-level conclusions based on separate analysis of individual SNPs. For DLBCL, we identified four pathways, which, combined with the clinical factors, had medians of the prediction logrank statistics as 2.535, 2.220, 2.094, 2.453, and 2.512, respectively. As a comparison, the clinical factors had a median of the prediction logrank statistics around 0.552. For FL, we identified two pathways, which, combined with the clinical factors, had medians of the prediction logrank statistics as 4.320 and 3.532, respectively. As a comparison, the clinical factors had a median of the prediction logrank statistics around 1.212. For NHL overall, we identified three pathways, which, combined with the clinical factors, had medians of the prediction logrank statistics as 5.722, 5.314, and 5.441, respective. As a comparison, the clinical factors had a median of the prediction logrank statistics around 4.411. The identified pathways have sound biological bases. In addition, they are different from those identified using existing approaches. They may provide further insights into the biological mechanisms underlying the prognosis of NHL. Keywords: pathway analysis, NHL prognosis, prediction, SNP data
Cancer Informatics 2010:9 281–292 doi: 10.4137/CIN.S6315 This article is available from http://www.la-press.com. © the author(s), publisher and licensee Libertas Academica Ltd. This is an open access article. Unrestricted non-commercial use is permitted provided the original work is properly cited. Cancer Informatics 2010:9
281
Han et al
Introduction
NHL (non-Hodgkin Lymphoma) represents a hetero geneous group of lymphocytic disorders ranging in aggressiveness from very indolent cellular proliferation to highly aggressive and rapidly proliferative processes. Although it is the fifth cause of cancer incidence and mortality in the US, NHL remains poorly understood and is largely incurable.1 In clinic, established adverse prognostic factors for NHL include older age at diagnosis, higher tumor stage, poorer performance score, extranodal involvement, abovenormal lactate dehydrogenase, and B-symptom presence.2,3 Recent molecular studies suggest that, beyond clinical and environmental factors, the prognosis of NHL is also affected by genomic variations which can be measured using SNPs (single nucleotide polymorphisms).4–6 In this article, when referring to “prognosis”, we limit ourselves to overall survival. Disease-free and other types of survival have different patterns and different genomic bases and should be investigated separately. The ultimate goal of NHL genomic studies is to identify markers that can be used to construct predictive models for prognosis. In this article, we analyze a genetic association study on NHL prognosis. Our particular goal is to identify gene pathways with significant additional predictive power beyond clinical factors. More specifically, consider two types of models. The first is constructed using both gene pathways and clinical risk factors, whereas the second is constructed using only clinical risk factors. With a specific pathway, if the predictive power of the first type of model is significantly larger than that of the second type of model, we conclude that this pathway has significant additional predictive power. Although there are many existing statistical methods for the analysis of genetic association data, they are not directly applicable to our study, as our goal is fundamentally different from that in existing studies. More specifically, many existing methods are single-marker based and consist of the following steps. First, for each SNP, a model (eg, Cox proportional hazards model) with the survival outcome as response and “SNP + clinical risk factors” as covariates is constructed. Second, for each SNP, its estimation significance, measured with the P-value from (eg,) the likelihood ratio test, is computed. Third, SNPs with P-values below a threshold are declared 282
as significant. These methods analyze one SNP at a time, that is, the marginal effects of SNPs. They are proper for simple Mendelian diseases. Lymphoma is a multiple-factor complex disease, resulting from the interplay of multiple genetic and environmental factors. Single-marker analysis may miss SNPs with weak marginal but strong joint effects. In addition, single-marker analysis cannot effectively incorporate prior biological information of genes, which has been accumulated over time from a large number of independent studies.7 Our analysis is pathwaybased. Pathway is a way of describing the interplay among genes, where pathways are composed of multiple genes (SNPs) with related biological functions. “Pathway analysis is a promising tool to identify the mechanisms that underlie diseases, adaptive physiological compensatory responses, and new avenues for investigation”.8 Compared with single marker-based analysis, pathway-based analysis has led to results that are more reproducible and more interpretable.7,9,10 Our pathway analysis approach is also fundamentally different from existing ones. More specifically, many existing pathway analysis methods analyze one SNP at a time and then combine SNP-level analyses to make pathway-level conclusions. Such methods, including the GSEA (gene set enrichment analysis)10,11 and maxmean approach,12 are suitable for answering “which pathways are enriched with SNPs marginally associated with disease”. But they cannot quantify the joint effects or coordination of multiple SNPs within the same pathways. In addition, many pathway analysis methods focus on the model estimation aspect as opposed to prediction. To further elaborate, we consider a Cox model for the survival time T. This model postulates that λ(t | X,Z) = λ0(t) exp(αX + βZ), where λ(t | X,Z) is the conditional hazard function, λ0(t) is the unknown baseline hazard, X and Z are the clinical factors and SNPs respectively, and α and β are the unknown regression coefficients. It is possible to construct an example where the estimate of β is statistically significant and the magnitude of αX is much larger than that of βZ. Existing methods focus on the significance of model estimation and may conclude the significance of SNPs. However, since the magnitude of βZ is relatively small, predictions with and without SNPs may have ignorable differences. That is, adding the SNPs to the model with clinical factors does not significantly improve prediction. Cancer Informatics 2010:9
NHL prognosis pathways
Thus, we may conclude the insignificance of SNPs in terms of additional predictive power. In this article, we study the genomic basis of NHL prognosis. As pathway analysis is conducted, this study may provide additional insights beyond individual-marker based analysis. Unlike in existing studies, we target the predictive power directly. Thus, the models constructed using identified pathways are expected to have better prediction performance than those using pathways identified with alternative approaches.
Methods Association study of NHL prognosis
Study design We described the patient selection procedure in Figure 1. In this study, cases were histologically confirmed, incident NHL patients diagnosed in Connecticut between 1996 and 2000. Subjects were restricted to women who were 21–84 years old at diagnosis, had no previous diagnosis of cancer except nonmelanoma skin cancer, and were alive at the time of 1122 potential female cases (167 died before interview; 123 excluded)
interview. This study was limited to female patients only, as men and women may have different etiology factors and this restriction was to prevent confounding by gender. Cases were identified through the Yale Comprehensive Cancer Center’s Rapid Case Ascertainment Shared Resource (RCA), a component of the Connecticut Tumor Registry (CTR). All licensed hospitals and clinical laboratories in Connecticut are required by public health legislation to report diagnosed cancer cases. Information on cases identified in the field is sent regularly to RCA, where the case information is entered, verified, and screened against the CTR database. 1122 potential cases were identified. Among them, 167 died before they could be interviewed and 123 were excluded because of doctor refusal, previous diagnosis of cancer, or inability to speak English. Out of the 832 eligible cases, 601 completed an in-person interview. Of the 601 cases, 13 could not be identified in the CTR system, and 13 were found to have a history of cancer prior to the diagnosis of NHL, leading to a prognostic cohort of 575 NHL patients. Among the 575 patients,
A total of 1764 SNPs Remove SNPs with >20% missing
832 eligible cases
601 completed interview (13 could not be identified; 13 had cancer history)
DLBCL: 1730 SNPs; FL: 1729 SNPs Find pathway information DLBCL: 122 pathways (1229 SNPs) FL: 122 pathways (1228 SNPs)
575 NHL patients, among whom 496 had SNP measurements available
155 DLBCL, 117 FL, 57 CLL/SLL, 34 MZBL, 37 T/NK-cell, 96 other [cohort 1, size 496] Remove subjects with >20% SNPs missing 138 DLBCL, 101 FL, 50 CLL/SLL, 29 MZBL, 28 T/NK-cell [cohort 2, size 346] Figure 1. Flowcharts of patient and SNP selection.
Cancer Informatics 2010:9
283
Han et al
496 donated either blood or buccal cell samples. All cases were histologically confirmed by two study pathologists and classified into NHL subtypes according to the World Health Organization classification system. Specifically, 155 had diffuse large B-cell lymphoma (DLBCL), 117 had Follicular lymphoma (FL), 57 had chronic lymphocytic leukemia/small lymphocytic lymphoma (CLL/SLL), 34 had marginal zone B-cell lymphoma (MZBL), 37 had T/NK-cell lymphoma, and 96 had other subtypes. Vital status was abstracted from the CTR in 2008. Written consents were obtained from all patients. The study was approved by the Human Subjects Research Review Committee at Yale University and the Connecticut Department of Health. DNA extraction and genotyping was performed at the Core Genotyping Facility of National Cancer Institute.13 DNA was extracted from blood clots using the Puregene Autopure DNA extraction kits (Gentra Systems, Minneapolis, MN) and from buccal cell samples using the phenol-chloroform extraction methods.14 A total of 1462 tag SNPs from 210 candidate genes related to immune response were genotyped using a custom-designed GoldenGate assay.15 The tag SNPs were chosen from the designable set of common SNPs (minor allele frequency .5%) genotyped in the Caucasian (CEU) population sample of the HapMap Project (Data Release 20/Phase II, NCBI Build 35 assembly, dpSNPb125) using the software Tagzilla.16 For each gene, SNPs within the region 20kb 5′ of the ATG-translation initiation codon and 10kb 3′ of the end of the last exon were binned using a binning threshold of r2 . 0.80. When there were multiple transcripts available for genes, the primary transcript was assessed. Duplicate samples and replicate samples were genotyped for quality control and blinded to laboratory personnel. The concordance rates were 99%–100% for all assays. We also included 302 SNPs in 143 candidate genes previously genotyped by Taqman assay.17 There were a total of 1764 SNPs measured. The list of SNPs and genes profiled is provided in Appendix 1. Data processing We removed patients with more than 20% SNPs missing and then removed SNPs with more than 20% measurements missing. The genotyping data was missing 284
for the following reasons: the amount of DNA was too low, samples failed to amplify, samples amplified but their genotype could not be determined due to ambiguous results, or the DNA quality was poor. We then imputed missing SNP measurements.18 As shown in Figure 1, for DLBCL, 138 patients passed this screening. Among them, 61 died, with survival times ranging from 0.47 to 10.46 years (mean = 4.16 years). For the 77 censored patients, the follow up time ranged from 5.58 to 11.45 years (mean = 9.08 years). 1730 SNPs passed the screening. For FL, 101 patients passed the screening. Among them, 33 died, with survival time ranging from 0.91 to 10.23 years (mean = 4.64 years). For the 68 censored patients, the follow up time ranged from 4.96 to 11.39 years (mean = 8.83 years). 1729 SNPs passed the screening. The following demographic and clinical factors were also measured: age (rescaled to mean 0 and variance 1 in analysis for better comparability among covariates), education (level 1 = high school or less; level 2 = some college; level 3 = college graduate or more), tumor stage (level 1–4 and unknown), B-symptom presence (no; yes; unknown), and initial treatment (none; radiation only; chemotherapy-based therapy; other). They included all widely accepted prognostic factors.19 Summary statistics for the whole cohort and selected subsets were presented in Table 1. Pathway construction For each gene, we searched KEGG20 for available pathway information. For DLBCL, there were 1229 SNPs belonging to 122 KEGG pathways, with pathway sizes ranging from 1 to 240 with median 12. For FL, there were 1228 SNPs belonging to 122 KEGG pathways, with pathway sizes ranging from 1 to 240 with median 12.
Statistical methods
Detecting pathways with significant additional predictive power involves comparing models with and without SNPs. When measuring the predictive power, ideally, independent training and testing datasets are needed. As we do not have access to independent data under comparable settings, we use random partition to generate training and testing datasets. The logrank statistic is chosen as the measure of predictive power.21 To avoid an extreme partition, multiple
Cancer Informatics 2010:9
NHL prognosis pathways Table 1. Patient characteristics. Variables Age Education Tumor stage
B-symptom presence Initial treatment
Level 1 Level 2 Level 3 Level 1 Level 2 Level 3 Level 4 Unknown No Yes Unknown None Radiation Chemotherapy Other
Cohort 1 (n = 496)
Cohort 2 (n = 346)
DLBCL (n = 138)
FL (n = 101)
61.62 206 168 122 238 61 28 158 11 71 29 396 173 63 253 7
61.14 135 120 91 177 42 23 98 6 51 20 275 123 52 167 4
59.36 53 54 31 72 23 9 31 3 28 12 98 21 18 99 0
60.02 35 36 30 55 12 10 23 1 13 4 84 44 19 38 0
Note: Age: mean; other variables: count.
partitions are conducted, leading to the distribution of the prediction logrank statistics. Finally, the FDR (false discovery rate) approach is used to control for multiple comparisons.
Algorithm
1. Data processing. Measurements with severe missingness are removed from analysis. Measurements with light missingness are imputed. In this study, 20% missing rate is used as the cutoff. 2. Pathway construction using databases such as KEGG. SNPs without pathway information are removed from downstream analysis. 3. For each pathway a. Compute the prediction index PIC+G, which measures the combined predictive power of clinical factors and SNPs. Here the subscript “C+G” stands for “clinical + genomic”. b. Compute the prediction index PIC, which measures the predictive power of clinical factors alone. Here the subscript “C” stands for “clinical”. c. Compare PIC+G with PIC, evaluate the significance of difference, and quantify the additional predictive power provided by SNPs. 4. Employ the FDR approach. In the following subsections, we provide detailed descriptions of Steps 3 and 4.
Cancer Informatics 2010:9
Quantification of additional predictive power of a single pathway Consider a pathway with m SNPs. Denote Z as the length-m vector of measurements. Denote X as the length-l vector of clinical factors. Denote T and C as the death and censoring time. Under right censoring, one observes (U = min(T,C), ∆ = I(T # C), X,Z. Consider the following Cox proportional hazards models: (M1): λ(t | X,Z) = λ0(t) exp(αX + βZ), and (M2): λ(t | X,Z) = λ0(t) exp(αX). The Cox model has been extensively adopted in survival analysis. It is semiparametric and can be much more flexible than parametric models. A unique advantage of the Cox model is that the profile likelihood function does not involve the baseline hazard. Thus, the estimation only involves maximization over a small number of parametric parameters. Model (M1) consists of both clinical and genomic factors, whereas model (M2) consists of clinical factors only. In “classic” NHL prognosis studies, genomic factors are ignored and (M2) is adopted. In recent genomic studies, both types of risk factors are considered and model (M1) is the preferred model. Statistically speaking, the validity of models depends on the unknown underlying data generating mechanisms. There is a vast amount of research on the statistical 285
Han et al
In Step 1, we randomly partition the data into training and testing sets. The specific way of partitioning makes the sizes of the testing set and each piece of the 286
Controlling the FDR Denote N as the number of pathways, and p1 … pN as the P-values generated from the Wilcoxon tests. a) Set 0.30 0.35
1. Randomly partition data into a training set and a testing set with sizes 3:1; 2. Under (M1), compute the ridge estimate of α,β using the training set only. λn is selected using 3-fold cross validation. For subjects in the testing set, compute the predictive risk scores αˆ X + βˆ Z . Dichotomize the scores at the median and create two risk groups. Compute the logrank statistic that measures the difference of survival between the two groups; 3. Repeat Step 2, with (M1) replaced by (M2); 4. Repeat Steps 1–3 B (eg, 200) times; 5. PIC+G consists of the B logrank statistics generated under (M1); PIC consists of the B logrank statistics generated under (M2); 6. Conduct a paired Wilcoxon test of PIC+G versus PIC. The resulted P-value quantifies the significance of additional predictive power.
0.20 0.25
where λn is the tuning parameter, and αj, βj are the j-th components of α,β, respectively. We use the R package penalized to compute the ridge estimates. For a specific pathway, its additional predictive power is evaluated as follows:
Density
l 2 m 2 2 ˆ ˆ (α , β ) = arg max Rn (α , β ) - λn ∑ α j + ∑ β j , j =1 j =1
0.10 0.15
j
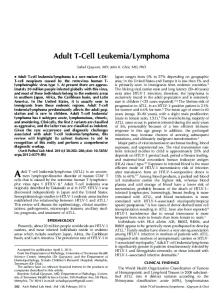
cross validation set equal. In Step 2, we use the ridge approach to estimate the regression coefficients under (M1) and then quantify the combined predictive power of clinical and genomic factors. The logrank statistic has been extensively used as a measure of predictive power.21,23 The significance of logrank statistics generated in Step 2 can be easily obtained. However, the significance of these logrank statistics does not indicate a significant contribution of the SNPs. It is possible that the significance simply comes from the predictive power of clinical factors. Thus, to discriminate the predictive power of SNPs from that of clinical factors, we compute PIC in Step 3. In Step 4, instead of a single logrank statistic, we generate its distribution via multiple partitions. By doing so, we can avoid the risk of an extreme partition. In Step 6, if the comparison of PIC+G versus PIC yields a significant result, we conclude that SNPs within this pathway have significant additional predictive power. Representative plots of PIC+G and PIC are shown in Figure 2. For FL, two pathways are used as examples: the Endometrial cancer pathway which has significant additional predictive power, and the Glycerolipid metabolism pathway which does not. For a better view, only the estimated densities of the logrank statistics are plotted. It is easy to see that, for a predictive pathway, the estimated densities of PIC + G and PIC are well separated. However, for a pathway without predictive power, the estimated densities are almost completely overlapped.
0.00 0.05
properties of Cox models and their estimates, and will not be repeated here. Comparing the predictive power of (M1) versus that of (M2) can reveal the additional predictive power of SNPs. Assume n iid observations (Ui, δi, Xi, Zi), i = 1 … n. Denote rj = {k: Uk $ Uj} as the at-risk set at Uj. Under (M1), the log-partial likelihood function is Rn(α,β ) = Σnj=1 δ j{(α Xj + b Zj) - log(Σk∈r exp (α Xk + b Zk))}. In a similar manner, we can define the log-partial likelihood function Rn(α) under (M2). In association studies, the sizes of some pathways may be comparable to or even larger than the sample sizes. Direct maximization of the likelihood functions may lead to unreliable maximizers. We propose using the ridge penalization to regularize the estimates.22 Under (M1), the ridge estimates of α,β are
0
5
10
15
Logrank statistic
Figure 2. Densities of PIC (blue dashed line) and PIC+G for a predictive pathway (black dash-dotted line) and a non-predictive pathway (green solid line).
Cancer Informatics 2010:9
NHL prognosis pathways
the target FDR to q = 0.2; b) Order the P-values p(1) # … # p(N ); c) Let r be the largest i such that p(i) # i/N × q/c(N ); d) Pathways corresponding to p(1) … p(r) are concluded as having significant additional predictive power. Different pathways may share common genes/SNPs. To account for the possible correlations among P-values caused by overlapping N pathways, we set c( N ) = ∑ 1 / i.24 i =1
Remarks (M2) is a submodel of (M1). A seemingly natural way of discriminating the two models is to conduct hypothesis testing within the ANOVA framework. However, such an approach still quantifies model estimation as opposed to prediction. When the number of covariates is much smaller than the sample size, estimation can be a reasonable proxy of prediction. Under the present setup, with the number of covariates considerably large, it is not clear how well estimation can represent prediction. Thus, we choose the proposed approach and assess prediction directly. The proposed approach shares some similarities with but differs significantly from the one in.25 In this study, we analyze association data, which is binary and represents two genotypes. In contrast, Ma and Kosorok25 analyzes continuous microarray gene expression measurements. We are interested in quantifying the additional predictive power of genomic factors beyond clinical factors, whereas in,25 the interest lies in quantifying the absolute predictive power of all factors. More importantly, since we are only interested in generating consistent estimates and using them for predictions, we use the ridge penalization. In contrast, Ma and Kosorok25 is interested in variable selection. Thus, the bridge penalization, which is capable of selection but has significantly higher computational cost, is adopted. We describe the proposed method for data with a censored survival outcome. It can be extended to other types of outcomes. Specifically, with continuous outcomes, the Cox model can be replaced with a linear model and the logrank statistic can be replaced with the mean squared error. With categorical outcomes, generalized linear models and the classification error can be used. Once statistical models and prediction statistics are determined, the proposed method can be applied. In our prognosis models, additive covariate Cancer Informatics 2010:9
effects are assumed. In principal, more complicated models, for example those including interaction terms, can be adopted. We note that unlike singlemarker analysis, the proposed method investigates all SNPs within the same pathways using a single model. Thus, considering complicated models may dramatically increase the number of unknown parameters and reduce power. We use the Wilcoxon test to compare the prediction indexes. This test is nonparametric and relies on weak assumptions. We have experimented with other tests and concluded the same significant pathways.
Results
To better understand NHL prognosis, we first fit Cox proportional hazards models using only the clinical risk factors. Detailed results were presented in Appendix 2. The main findings were consistent with the literature.3,19
Pathway identification
We focused on DLBCL and FL due to a sample size consideration. We also analyzed all subtypes combined to investigate if there are pathways predictive for NHL overall. The identified pathways were shown in Table 2. We found that incorporating SNPs could increase the predictive power by a considerable amount. Specifically, for DLBCL, PIC+G for the identified pathways had medians 2.535, 2.220, 2.094, 2.453, and 2.512, respectively. In contrast, PIC had medians around 0.552; For FL, PIC+G for the identified pathways had medians 4.320 and 3.532, respectively. In contrast, PIC s had medians around 1.212; For NHL overall, PIC+G s for the identified pathways had medians 5.722, 5.314, and 5.441, respectively. In contrast, PIC s had medians around 4.411.
Biological implications
Given the limited genetic association studies on NHL survival, there are very few reproduced findings for most of the positive SNPs we identified. However, the links between these SNPs and NHL risk by previous etiology studies confirmed their biological significance in lymphomagenesis. Five metabolic pathways were found to be predictive: selenoamino acid metabolism pathway and glycine, serine and threonine metabolism pathway for DLBCL, cytochrome P450 drug metabolism 287
Han et al Table 2. Pathways with additional predictive power. DLBCL
FL All
Pathway
Size
P-value
Gene
Selenoamino acid metabolism Type II diabetes mellitus Glycine, serine and threonine metabolism TGF-beta signaling pathway Insulin signaling pathway Endometrial cancer Melanogenesis Drug metabolism—other enzymes Drug metabolism—cytochrome P450
4 19 7
0.000009 0.00012 0.00018
CBS SOCS1, SOCS2, SOCS3, SOCS4, TNF BHMT, CBS, SHMT1
13 15 10 5 35 7
0.00018 0.0013 0.00013 0.00002 0.00024 0.00044
Caffeine metabolism
36
0.00056
CDKN2A, IFNG, MYC, TGFB1, TGFBR1, TNF SOCS1, SOCS2, SOCS3, SOCS4 CASP9, CCND1, MLH1, MYC, TP53, CTNNB1 MC1R, CTNNB1 NAT1, NAT2, XDH CYP1A2, CYP2C9, CYP2E1, GSTM3, GSTP1, GSTT1 CYP1A2, NAT1, NAT2, XDH
Note: Size: number of SNPs within pathways; P-value: unadjusted P-values from Wilcoxon tests.
p athway, other enzymes drug metabolism pathway, and caffeine metabolism pathway for NHL overall. Metabolic pathway enzymes are involved in activation and detoxification of environmental carcinogens as well as drug metabolism, and the related genes may play important roles in the susceptibility to toxic effects of chemicals and may also influence tumor response to drugs used in NHL treatments. Studies have linked the risk of NHL and its subtypes with genetic variations in various metabolic pathways such as BHMT, CBS, SHMT1,26 CYP2C9,27 CYP2E1,28 GSTP1,29 GSTT1,29–31 NAT1 and NAT2.32 Moreover, low expressions of GPX1 are associated with better survival of DLBCL patients,33 and genetic variations in CYP2E1, GSTP1, GSTT1 and NAT1 are associated with NHL survival.19 In line with the previous studies, our results from this pathway analysis suggested that metabolic pathway genes are one of the most influential ones that affect lymphoma prognosis. The type II diabetes mellitus pathway and the insulin signaling pathway were found to be predictive for DLBCL survival. With their immune functions altered, people with diabetes are more prone to NHL. A recent meta-analysis of five cohort studies and ten case-controls studies identified an association between diabetes and increased risk of NHL.34 Moreover, studies have shown that insulin and IGF-I play a key role in cell proliferation, apoptosis, and metastasis, thus may be actively involved in tumor formation and progression.35 Studies have found that SOCS1 mutation is frequent in lymphoma cells, and SOCS3 overexpression is associated with decreased survival of FL patients.36 TNF is one of the most noteworthy genes 288
to date, whose variations are reported as NHL risk alleles. Several studies, including a recent pooledanalysis of nine case-control studies by InterLymph Consortium, have reported that mutations in TNF, especially TNF-308G . A, are associated with NHL risk.5,6,37 Moreover, TNF-308G . A has been identified as a predictor of survival in DLBCL patients.38 The TGF-beta signaling pathway was found to be predictive for DLBCL survival. TGF-beta, a secreted multifunctional cytokine, is one of the few known classes of proteins that can inhibit cell growth. It normally functions as a tumor suppressor during early stages of tumorigenesis, whereas at later stages the genetic and epigenetic events convert TGF-beta to a tumor promoter aiding in cell growth, invasion and metastasis.39 TGF-beta signaling pathway regulates a wide range of cellular processes including proliferation, differentiation, apoptosis, migration and cellular homeostasis. The knowledge of TGF-beta signaling pathway and cancer is evolving. To our knowledge, no SNP of TGF-beta signaling pathway genes except TNF has been associated with prognosis and survival of NHL. However, the high TGF-beta levels were identified as independent predictors of improved outcome in FL patients,40 and MYC gene rearrangements were found to be associated with a poor prognosis in DLBCL patients.41 The endometrial cancer pathway was found to be predictive for FL survival. Studies have found that women with a diagnosis history of endometriosis are at an increased risk of NHL.42 In addition, there are strong evidences showing that all genes in this pathway play important roles in single or multiple stages of tumor Cancer Informatics 2010:9
NHL prognosis pathways
growth and tumor progression. For example, CASP9 encodes a member of caspase family which plays a central role in apoptosis; Mutations, amplification and overexpression of CCND1 alter cell cycle progression; MLH1 is involved in DNA repair and cell cycle; The protein encoded by MYC plays a role in cell cycle progression, apoptosis and cellular transformation; TP53 regulates target genes that induce cell cycle arrest, apoptosis, senescence and DNA repair; and CTNNB1 plays a role in tumor cell metastasis.43 Studies have observed associations between genetic variants in CASP9,17,44 CCND1 and MYC32 and risk of NHL overall and different subtypes. TP53 mutations are found to be predictive for poor survival in DLBCL and FL.45 In addition, the melanogenesis pathway was identified as predictive for FL survival. The consistent observation of melanoma and NHL occurring in the same patients, the similar temporal trends of incidences of melanoma and NHL, and the observed association of UV radiation and NHL risk all strongly suggest a linkage between melanogenesis and lymphomagenesis.46,47
Alternative analysis
We also analyzed the data using the following alternative pathway-based approaches. Gene set enrichment analysis The GSEA is perhaps the most popular pathway analysis method.10,11 For each SNP, we fit a Cox model with the “clinical factors + SNP” as covariates and used the SNP’s standardized regression coefficient as the statistic. The remaining steps followed.10 We used the same FDR control as for the proposed approach. For DLBCL, the GSEA identified 53 pathways. The Selenoamino acid metabolism pathway, TGF-beta signaling pathway, and Insulin signaling pathway were identified. For FL, the GSEA identified 56 pathways but had no overlap with the proposed approach. For all subtypes combined, the GSEA identified 54 pathways. The Drug metabolism-cytochrome P450 pathway was identified. Maxmean approach This approach was proposed in.12 It shares similar spirits but differs from the GSEA. For DLBCL, FL, and NHL overall, the maxmean approach did not identify any significant pathways. Cancer Informatics 2010:9
Global test The global test was proposed in.48 For DLBCL and FL, this approach did not identify any significant pathway. For NHL overall, 10 pathways were identified. However, there was no overlap with the pathways identified using the proposed approach. Remarks We compared PIC+G s of pathways identified using the GSEA and global test versus those not identified, and found no significant difference. That is, the pathways identified using those approaches do not have more predictive power than those not identified. The above analysis showed the dramatic differences between the pathways identified using different approaches. Such differences are reasonable considering that the three alternative approaches focus on the estimation significance as opposed to predictive power. Similar phenomenon has been observed in.25 Of note, there are many other alternative approaches. A complete comparison is almost impossible to achieve. Thus, we focused on the above three, which are perhaps more extensively used than other existing approaches.
Discussion
This study may have the following limitations. First, the prognosis study included only female NHL patients. This restriction was to avoid possible confounding by gender. In addition, all patients were recruited in Connecticut, a state in the northeast US. It is not clear whether the results can be generalized to male patients. There is a very small possibility that the results cannot be generalized to patients from other geographic locations. Second, in the profiling, a candidate-gene approach (as opposed to whole genome scan) was adopted. Genes and SNPs profiled were manually selected. With a total of 1764 SNPs (333 genes), this study was not able to provide a full coverage of the genome. Particularly, the SNPs (genes) profiled might not sufficiently cover all pathways involved. A few pathways had a small number of SNPs. Additional whole-genome studies will be needed to identify more NHL susceptibility SNPs. Third, this study was also limited by the availability of data. In this study, patients were recruited in Connecticut during 1996 and 2000. The prognostic cohort analyzed consisted of 346 patients. Larger-scale, more 289
Han et al
powerful studies will be needed to obtain more conclusive results. Fourth, the reliability of our analysis results might also be limited by the quality of data, including for example the low call rate. Fifth, the pathway information was extracted from KEGG. It has been recognized that our knowledge of the biological functions of genes and their pathway information is still partial. The pathway information might be refined by using more databases such as BioCarta or updated in the future. Last, the results are obtained from the analysis of a single dataset. Independent validation studies, for example in vitro cell culture studies, are needed to further validate the identify pathways and understand their biological mechanisms. Despite the aforementioned limitations, this study still has considerable merits. Our literature review suggested the scarcity of genetic association studies on NHL prognosis. The research on NHL genomic markers is still in the early exploration, as opposed to the late confirmation, stage. The pathways and SNPs identified in this study may contribute to our understanding of NHL and serve as basis for future confirmation studies.
Conclusion
NHL is largely incurable and its genetic basis is not well understood. This has motivated researchers to search for genetic variants that have additional predictive power beyond clinical and demographic factors. In this study, pathway-based analysis is conducted. For DLBCL, FL and all subtypes combined, we employ a new approach and identify five, two, and three pathways with significant additional predictive power. We find that there are strong evidences of connections between identified pathways, their genes and NHL prognosis. Although some identified genes have been previously discovered, this can be the first time they are identified in the context of pathway analysis. The identified pathways differ from those identified using alternative approaches, and may provide further insights into mechanisms underlying NHL prognosis.
Acknowledgements
We would like to thank the editor and reviewers for careful review and insightful comments. This study has been supported by NIH grants LM009754, CA120988, CA62006, CA142538 and CA142774; 290
NSF grants DMS-0805670, DMS-0904184 and DMS-0904181; the Intramural Research Program of the NIH; an Argall and Anna Hull Cancer Research Award; and Research of Longitudinal Data Analysis Methodology and Its Application (2009JJD910002) from Key Research Institute of Humanities and Social Sciences Program, China.
Disclosure
This manuscript has been read and approved by all authors. This paper is unique and is not under consideration by any other publication and has not been published elsewhere. The authors and peer reviewers of this paper report no conflicts of interest. The authors confirm that they have permission to reproduce any copyrighted material.
References
1. American Cancer Society. Cancer Facts and Figures; 2009. 2. The international non-Hodgkin’s lymphoma Prognostic Factors Project. A predictive model for aggressive non-Hodgkin lymphoma. New England Journal of Medicine. 1993;329:987–94. 3. Han X, Kilfoy B, Zheng T, et al. Lymphoma survival patterns by WHO subtype in the United States, 1973–2003. Cancer Causes and Control. 2008;19: 841–58. 4. Cerhan JR, Wang S, Maurer MJ, et al. Prognostic significance of host immune gene polymorphisms in follicular lymphoma survival. Blood. 2007; 109:5439–46. 5. Wang SS, Maurer MJ, Morton LM, et al. Polymorphisms in DNA repair and one-carbon metabolism genes and overall survival in diffuse large B-cell lymphoma and follicular lymphoma. Leukemia. 2009;23:596–602. 6. Wang SS, Purdue MP, Cerhan JR, et al. Common gene variants in the tumor necrosis factor (TNF) and TNF receptor superfamilies and NF-kB transcription factors and non-Hodgkin lymphoma risk. PLoS ONE. 2009;4:e5360. 7. Peng G, Luo L, Siu H, et al. Gene and pathway-based second-wave analysis of genome-wide association studies. European Journal of Human Genetics. 2010;18:111–7. 8. Curtis RK, Oresic M, Vidal-Puiq A. Pathways to the analysis of microarray data. Trends in Biotechnology. 2005;23:429–35. 9. Wang K, Li M, Bucan M. Pathway-based approaches for analysis of genome wide association studies. American Journal of Human Genetics. 2007;81:1278–83. 10. Holden M, Deng S, Wojnowski L, Kulle B. GSEA-SNP. applying gene set enrichment analysis to SNP data from genome-wide association studies. Bioinformatics. 2008;24:2784–5. 11. Subramanian A, Tamayo P, Mootha VK, et al. Gene set enrichment analysis. a knowledge-based approach for interpreting genome-wide expression profiles. PNAS. 2005;102:15545–50. 12. Efron B, Tibshirani R. On testing the significance of sets of genes. Annals of Applied Statistics. 2007;1:107–29. 13. NCI [http://snp500cancer.nci.nih.gov]. 14. Garcia-Closas M, Egan KM, Abruzzo J, et al. Collection of genomic DNA from adults in epidemiological studies by buccal cytobrush and mouthwash. Cancer Epidemiology Biomarkers and Prevention. 2001;10:687–96. 15. Illumina [http://www.illumina.com]. 16. Tagzilla [http://tagzilla.nci.nih.gov]. 17. Lan Q, Zheng T, Chanock S, et al. Genetic variants in caspase genes and susceptibility to non-Hodgkin lymphoma. Carcinogenesis. 2007;28:823–7. 18. Ayers KL, Lange K. Penalized estimation of haplotype frequencies. Bioinformatics. 2008;24:1596–602.
Cancer Informatics 2010:9
NHL prognosis pathways 19. Han X, Zheng T, Foss FM, et al. Genetic polymorphisms in the metablolic pathway and non-Hodgkin lymphoma survival. American Journal of Hematology. 2010;85:51–6. 20. KEGG [http://www.genome.ad.jp/kegg/]. 21. Ma S, Huang J, Shi M, Li Y, Shia B. Semiparametric prognosis models in genomic studies. Briefings in Bioinformatics. 2010;11:385–93. 22. Hoerl AE, Kennard RW. Ridge regression. biased estimation for nonorthogonal problems. Technometrics. 1970;12:55–67. 23. Fleming TR, Harrington DP. Counting Processes and Survival Analysis. New York: Wiley; 1991. 24. Benjamini Y, Yekutieli D. The control of the false discovery rate in multiple testing under dependency. Annals of Statistics. 2001;29:1165–88. 25. Ma S, Kosorok MR. Detection of gene pathways with predictive power for breast cancer prognosis. BMC Bioinformatics. 2010;11:1. 26. Lim U, Wang SS, Hartge P, et al. Gene-nutrient interactions among determinants of folate and one-carbon metabolism on the risk of non-Hodgkin lymphoma: NCI-SEER case-control study. Blood. 2007;109:3050–9. 27. Gra OA, Glotov AS, Nikitin EA, et al. Polymorphisms in xenobioticmetabolizing genes and the risk of chronic lymphocytic leukemia and non-Hodgkin’s lymphoma in adult Russian patients. American Journal of Hematology. 2008;83:279–87. 28. De Roos AJ, Gold LS, Wang S, et al. Metabolic gene variants and risk of non-Hodgkin’s lymphoma. Cancer Epidemiology Biomarkers Prevention. 2006;15:1647–53. 29. Al-Dayel F, Al-Rasheed M, Ibrahim M, et al. Polymorphisms of drugmetabolizing enzymes CYP1A1, GSTT and GSTP contribute to the development of diffuse large B-cell lymphoma risk in the Saudi Arabian population. Leukemia Lymphoma. 2008;49:122–29. 30. Kerridge I, Lincz L, Scorgie F, Hickey D, Granter N, Spencer A. Association between xenobiotic gene polymorphisms and non-Hodgkin’s lymphoma risk. British Journal of Hematology. 2002;118:477–81. 31. Wu MS, Shun CT, Huang SP, Cheng AL, Chen LT, Lin JT. Effect of interleukin-1beta and glutathione S-transferase genotypes on the development of gastric mucosa-associated lymphoid tissue lymphoma. Haematologica. 2004;89:1015–7. 32. Morton LM, Purdue MP, Zheng T, et al. Risk of non-Hodgkin lymphoma associated with germline variation in genes that regulate the cell cycle, apoptosis, and lymphocyte development. Cancer Epidemiology Biomarkers Prevention. 2009;18:1259–70. 33. Andreadis C, Gimotty PA, Wahl P, et al. Members of the glutathione and ABC-transporter families are associated with clinical outcome in patients with diffuse large B-cell lymphoma. Blood. 2007;109:3409–16. 34. Mitri J, Castillo J, Pittas AG. Diabetes and risk of Non-Hodgkin’s lymphoma: a meta-analysis of observational studies. Diabetes Care. 2008;31:2391–7.
Cancer Informatics 2010:9
35. Frasca F, Pandini G, Sciacca L, et al. The role of insulin receptors and IGF-I receptors in cancer and other diseases. Archives of Physiology and Biochemistry. 2008;114:23–37. 36. Weniger MA, Melzner I, Menz CK, et al. Mutations of the tumor suppressor gene SOCS-1 in classical Hodgkin lymphoma are frequent and associated with nuclear phospho-STAT5 accumulation. Oncogene. 2006;25:2679–84. 37. Cerhan JR, Liu-Mares W, Fredericksen ZS, et al. Genetic variation in tumor necrosis factor and the nuclear factor-kappaB canonical pathway and risk of non-Hodgkin’s lymphoma. Cancer Epidemiology Biomarkers Prevention. 2008;17:3161–9. 38. Habermann TM, Wang SS, Maurer MJ, et al. Host immune gene polymorphisms in combination with clinical and demographic factors predict late survival in diffuse large B-cell lymphoma patients in the pre-rituximab era. Blood. 2008;112:2694–702. 39. Chaudhury A, Howe PH. The tale of transforming growth factor-beta (TGFbeta) signaling: a soigne enigma. IUBMB Life. 2009;61:929–39. 40. Labidi SI, Menetrier-Caux C, Chabaud S, et al. Serum cytokines in follicular lymphoma. Correlation of TGF-beta and VEGF with survival. Annals of Hematology. 2009; in press. 41. Savage KJ, Johnson NA, Ben-Neriah S, et al. MYC gene rearrangements are associated with a poor prognosis in diffuse large B-cell lymphoma patients treated with R-CHOP chemotherapy. Blood. 2009;114:3533–7. 42. Olson JE, Cerhan JR, Janney CA, Anderson KE, Vachon CM, Sellers TA. Postmenopausal cancer risk after self-reported endometriosis diagnosis in the Iowa Women’s Health Study. Cancer. 2002;94:1612–8. 43. NCBI. Entrez Gene [http://www.ncbi.nlm.nih.gov/gene]. 44. Lan Q, Morton LM, Armstrong B, et al. Genetic variation in caspase genes and risk of non-Hodgkin lymphoma: a pooled analysis of three populationbased case-control studies. Blood. 2009;114:264–7. 45. Zainuddin N, Berglund M, Wanders A, et al. TP53 mutations predict for poor survival in de novo diffuse large B-cell lymphoma of germinal center subtype. Leukemia Research. 2009;33:60–6. 46. Lens MB, Newton-Bishop JA. An association between cutaneous melanoma and non-Hodgkin’s lymphoma: pooled analysis of published data with a review. Annals of Oncology. 2005;16:460–5. 47. Kricker A, Armstrong BK, Hughes AM, et al. Personal sun exposure and risk of non Hodgkin lymphoma: a pooled analysis from the Interlymph Consortium. International Journal of Cancer. 2008;122:144–54. 48. Goeman JJ, van de Geer S, de Kort F, van Houwelingen HC. A global test for groups of genes: testing association with a clinical outcome. Bioinformatics. 2004;20:93–9.
291
Han et al
Appendix
Appendix 1 – List of SNPs (genes) genotyped. Appendix 2 – Regression analysis using only clinical risk factors.
Publish with Libertas Academica and every scientist working in your field can read your article “I would like to say that this is the most author-friendly editing process I have experienced in over 150 publications. Thank you most sincerely.” “The communication between your staff and me has been terrific. Whenever progress is made with the manuscript, I receive notice. Quite honestly, I’ve never had such complete communication with a journal.” “LA is different, and hopefully represents a kind of scientific publication machinery that removes the hurdles from free flow of scientific thought.”
Your paper will be: • Available to your entire community free of charge • Fairly and quickly peer reviewed • Yours! You retain copyright http://www.la-press.com
292
Cancer Informatics 2010:9