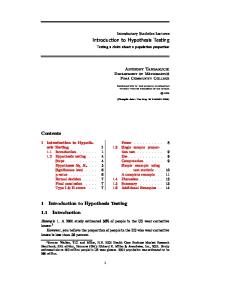
Hypothesis Testing Flow Chart Truth
Plan the Study Research Question
Random Variable(s)
Design: α n
Ho & Ha
Perform Study, obtain the Sample (Data)
Decision Ho Ha Rej Ho Type 1 Power α 1−β Not Rej Type 2 β
Sex Age(yr) M 18 F 17 F 19 M 19 F 18
Computer Organize and Summarize, obtaining descriptive statistics, test statistic, and P-value Value of P-value Test Stat (__< P α
Decision: Reject Ho.
Decision: NOT Reject Ho.
Characterize: Results statistically significant.
Characterize: Results NOT statistically significant.
Conclude: There is significant statistical
Conclude: There is NOT significant
evidence that [Ha] ( __< P < __ ).
If Ho true, P{Rej Ho} = α = Type 1 error rate.
statistical evidence that [Ha] ( __< P < __ ).
If Ho true, P{Not Rej Ho} = (1 − α).
If Ha true, P{Rej Ho} = (1 − β) = Power.
If Ha true, P{Not Rej Ho} = β = Type 2 error rate.
If n and (1−β) large, then a small, unimportant difference can be statistically significant but not practically important.
If n and (1−β) small, then a large, important difference can be NOT stat sig, yet practically important.
So check magnitude of result, i.e., of difference between sample and hypothetical value.
Example A: Utts 2001, Chapter 22, Exercise 7. Suppose you wanted to see whether a training program helped raise students’ scores on a standardized test. You administer the test to a random sample of students, give them the training program, and then re-administer the test. For each student, you record the increase (or decrease) in the test scores on a standardized test from one time to the next. 1. Research question: Has the training program helped raise students’ scores on a standardized test? 2. Random variable(s): the random variables observed were the score on the standardized test before training, the score on the standardized test after training, and the random variable of interest change, where change = after − before (subtracting before from after implies that a positive difference is an increase and a negative difference is a decrease.) Knowing the random variable of interest tells us a. The type of variable is measurement, therefore b. the parameter of interest will be the population mean, i.e., the mean change in standardized test score for all students in the training program. Thus, the null and alternative hypotheses will be statements about the population mean. c. The sample (data) will be tabulated as shown in Table A-2. 3. Hypotheses H0: population mean change in score = 0 (no change) HA: population mean change in score > 0 (an increase) Knowing the hypotheses lets us know
Table A-2. Change in test score
a. what the possible conclusions will are: i. If the decision is to reject the null hypothesis, then the conclusion will be “There is significant statistical evidence that the mean standardized test score increases (__< P .10). A physician reading such a study should be concerned about 5. Type 1 Error. 6. Type 2 Error. 7. Too much power. 8. All of the above.