Gray Matter Alterations in Adults with Attention-Deficit/Hyperactivity Disorder Identified by Voxel Based Morphometry Larry J. Seidman, Joseph Biederman, Lichen Liang, Eve M. Valera, Michael C. Monuteaux, Ariel Brown, Jonathan Kaiser, Thomas Spencer, Stephen V. Faraone, and Nikos Makris Background: Gray and white matter volume deficits have been reported in many structural magnetic resonance imaging (MRI) studies of children with attention-deficit/hyperactivity disorder (ADHD); however, there is a paucity of structural MRI studies of adults with ADHD. This study used voxel based morphometry and applied an a priori region of interest approach based on our previous work, as well as from well-developed neuroanatomical theories of ADHD. Methods: Seventy-four adults with DSM-IV ADHD and 54 healthy control subjects comparable on age, sex, race, handedness, IQ, reading achievement, frequency of learning disabilities, and whole brain volume had an MRI on a 1.5T Siemens scanner. A priori region of interest hypotheses focused on reduced volumes in ADHD in dorsolateral prefrontal cortex, anterior cingulate cortex, caudate, putamen, inferior parietal lobule, and cerebellum. Analyses were carried out by FSL-VBM 1.1. Results: Relative to control subjects, ADHD adults had significantly smaller gray matter volumes in parts of six of these regions at p ! .01, whereas parts of the dorsolateral prefrontal cortex and inferior parietal lobule were significantly larger in ADHD at this threshold. However, a number of other regions were smaller and larger in ADHD (especially fronto-orbital cortex) at this threshold. Only the caudate remained significantly smaller at the family-wise error rate. Conclusions: Adults with ADHD have subtle volume reductions in the caudate and possibly other brain regions involved in attention and executive control supporting frontostriatal models of ADHD. Modest group brain volume differences are discussed in the context of the nature of the samples studied and voxel based morphometry methodology. Key Words: Attention-deficit/hyperactivity disorder, caudate, cerebellum, prefrontal cortex, structural MRI, voxel based morphometry
A
ttention-deficit/hyperactivity disorder (ADHD) in adults has gradually become recognized as a valid and reliable disorder, sharing many features with the childhood syndrome (1). A substantial percentage of individuals diagnosed with ADHD in youth have symptoms persisting into adulthood (2,3) and epidemiologic data indicate that approximately 4% of adults in the United States suffer from ADHD (4,5). Adults with ADHD share similar clin-
From the Department of Psychiatry (LJS, JB, EMV, MCM, AB, TS, SVF, NM), Harvard Medical School, Massachusetts General Hospital, Boston; Massachusetts Mental Health Center Public Psychiatry Division (LJS), Beth Israel Deaconess Medical Center, Boston; Neuroimaging Program (LJS, JB, EMV, MCM, AB, TS, SVF, NM), Clinical and Research Programs in Pediatric Psychopharmacology and Adult Attention-Deficit/Hyperactivity Disorder, Massachusetts General Hospital, Boston; Martinos Center for Biomedical Imaging (LJS, EMV, NM), (Massachusetts Institute of Technology, Harvard Medical School, and Massachusetts General Hospital), Charlestown; Departments of Neurology and Radiology Services (LL, JK, NM), Harvard Medical School, Center for Morphometric Analysis, Massachusetts General Hospital, Boston; and Department of Brain and Cognitive Sciences (AB), Massachusetts Institute of Technology, Cambridge, Massachusetts; and Departments of Psychiatry and of Neuroscience and Physiology (SFV), The State University of New York Upstate Medical University, Syracuse, New York. Address correspondence to Larry J. Seidman, Ph.D., Massachusetts General Hospital, Clinical and Research Program in Pediatric Psychopharmacology, Fruit Street, Warren 7, Boston, MA 02114; E-mail: lseidman@bidmc. harvard.edu. Received Mar 22, 2010; revised Aug 10, 2010; accepted Sep 29, 2010.
0006-3223/$36.00 doi:10.1016/j.biopsych.2010.09.053
ical features, comorbidities (6,7), neuropsychological dysfunctions (8 –10), and functional impairment with ADHD children (1,11–15). The persistence of ADHD into adulthood in two thirds of childhood cases (16) supports the hypothesis that structural brain abnormalities present in childhood will persist to adulthood (17,18). Little is known about the neuroanatomy of adult ADHD (19,20). Whereas there are more than two dozen quantitative reports of structural neuroimaging using magnetic resonance imaging (MRI) in ADHD children from more than a dozen research groups (reviewed in [17]) and summarized in two meta-analyses (21,22), there are only a few structural imaging studies of adults with ADHD: two articles from one research group (23,24), an article by another group (25), and a number of articles from our group (18,26 –28). Hesslinger et al. (23) and Perlov et al. (24) reported a significant reduction of the left fronto-orbital cortex (FOC) (23) in a small sample, and after specifically testing for hippocampus and amygdala volume differences in a subsequent analysis with a larger sample, they reported a null finding compared with control subjects (24), similar to our negative results (18). Frodl et al. (25) reported no significant differences in hippocampus but found a bilateral reduction in amygdala compared with healthy control subjects. We found significant gray matter volume reductions in ADHD in dorsolateral prefrontal cortex (DLPFC), the anterior cingulate cortex (ACC), and the cerebellum (18,28) compared with healthy control subjects. We also found significant cortical thinning in ADHD involving the inferior parietal lobule (IPL), DLPFC, and ACC in the sample (26) used in the Seidman et al. (18) volumetric study. We evaluated the structural connectivity network underlying attention and executive functions (EFs), demonstrating white matter abnormalities measured by fractional anisotropy in the cingulum bundle and the superior longitudinal fasciculus II in a completely independent sample of ADHD adults (27). These findings largely emphasize cortical circuits (DLPFC, ACC, and IPL) and subcortical circuits with BIOL PSYCHIATRY 2011;69:857– 866 © 2011 Society of Biological Psychiatry
858 BIOL PSYCHIATRY 2011;69:857– 866 reciprocal connections to DLPFC, including the caudate, putamen, and cerebellum (29). Our empirical work has been guided by a conceptual model of the core neurocognitive deficits in ADHD, including attention and EFs (30), and the functional neuroanatomy of neural circuits hypothesized to underlie these functions (17,18,26 –29,31). The likely persistence of structural abnormalities is supported by the continued deficits in attention and EFs in adults with ADHD, reflected in many neuropsychological studies (8 –11,32,33) and growing numbers of functional MRI studies in ADHD adults showing abnormalities in prefrontal cortex, ACC, and other regions of the network for attention and EFs (34 –36). Thus, many investigators have conceptualized the neurobiology of ADHD as involving structural and functional brain abnormalities in frontal-striatal circuitry that governs attention and EFs (37– 42), and we have utilized this model to guide our work. One of the most replicated alterations in ADHD in childhood is a significantly smaller volume in the caudate (43– 45) and a smaller putamen-pallidum region, identified by voxel based morphometry (VBM) meta-analysis (22). The caudate, along with the putamen, and globus pallidus are part of discrete, somatotopically distributed circuits essential for EFs, including prefrontal– basal ganglia–thalamic loops (46). Damage to the striatum has been hypothesized to be associated with ADHD (47). Striatal lesions in animals produce hyperactivity and poor working memory and response inhibition performance (46), and the striatum has one of the highest densities of dopaminergic synapses in the brain (48). Finally, stimulant medications, commonly used to treat ADHD, increase synaptic dopamine by blocking the dopamine transporter in striatum (49). Because Castellanos et al. (45) demonstrated that significant differences in caudate volume between children with ADHD and control subjects diminished by the oldest age studied (19 years), it is possible that this region normalizes over time. It is also possible that the absence of caudate differences in our sample of 24 adults with ADHD compared with 18 control subjects (18) was due to small samples sizes. This suggests that larger studies of ADHD adults are needed to determine whether there are persistent caudate or other striatal alterations. Finally, we addressed the cerebellum, given its involvement in a number of cognitive and affective processes beyond simple motor functions (50). Middleton and Strick (51) demonstrated cerebellarcortical connections that provide an anatomical substrate for a possible cerebellar-prefrontal dysfunction in ADHD (17,52). Many researchers studying the cerebellum in ADHD children have observed structural abnormalities, including volume reduction in specific regions of the vermis. For example, reductions in the posterior inferior lobules, VIII to X, of the cerebellar vermis have been found for ADHD boys (43– 45,53–56). Durston et al. (56) found smaller overall right cerebellar volumes in a group of 30 ADHD children. In a study of 152 children and adolescents with ADHD and 139 control subjects, after adjusting for total cerebral volume, only the difference for the cerebellar volume remained significant (45). Thus, cerebellar gray matter is hypothesized to be an important part of the brain affected in ADHD. Based on this prior work and conceptual model, we hypothesized that ADHD adults would have smaller volumes in DLPFC, IPL, ACC, caudate, putamen, and cerebellar gray matter. Because these a priori regions of interest (ROIs) have strong theoretical and empirical support, they are appropriate for directional hypothesis testing. Second, we conducted exploratory analyses on these ROIs to assess whether any of these regions were significantly larger in ADHD and on other ROIs not specifically predicted to be part of ADHD. To the www.sobp.org/journal
L.J. Seidman et al. best of our knowledge, this is the first VBM study of the brain in adults with ADHD.
Methods and Materials Subjects Male and female subjects between the ages of 18 and 59 participated in the study. Attention-deficit/hyperactivity disorder (n ! 74) and control (n ! 54) adults were group matched to be comparable on age, sex, handedness, and race. A preliminary imaging study of 32.8% of these subjects (24 ADHD, 18 control subjects) has been previously published (18,26) utilizing volumetric and cortical thickness analyses, respectively, and a slightly larger (38.3%) subsample (26 ADHD, 23 control subjects), including all those in the original sample, was used in a volumetric analysis of the effects of comorbidity of bipolar disorder and ADHD (28). This is the first report of the complete dataset of adults 18 or older, using subjects in which we extend matching of cases and control subjects on the same characteristics as in the first sample by Seidman et al. (18) and excluding subjects with bipolar disorder comorbidity previously reported (28). Exclusion criteria were deafness, blindness, psychosis, neurological disorder, sensorimotor handicaps, inadequate command of the English language, current alcohol or substance abuse or dependence defined by DSM-IV or a chronic history of abuse or dependence as defined by clinician review, or a full-scale IQ less than 80 as measured by the Wechsler Adult Intelligence Scale-Third Edition (57). Socioeconomic status was assessed with the Hollingshead Four Factor Index of Social Status scale (58). Regarding lifetime medication history for ADHD participants, 23 had never been prescribed psychotropic medications, 22 had received stimulants, 17 had received stimulants and antidepressants, 3 had received antidepressants only, and 9 had received a combination of other psychotropic medications. For control participants, 47 had never been prescribed psychotropic medications, 5 had been prescribed antidepressants, 1 had received both stimulants and antidepressants, and 1 had received other psychotropic medications. Patients with ADHD who were currently being treated with stimulants underwent a 24-hour washout period before scanning (n ! 21). We recruited ADHD subjects from referrals to psychiatric clinics at the Massachusetts General Hospital (MGH) and advertisements in the greater Boston area and control subjects through advertisements in the same geographic areas. After a complete description of the study, written informed consent was obtained, and all participants received an honorarium for participating. The study was approved by the MGH Human Subjects committee. Clinical Assessment Attention-deficit/hyperactivity disorder adults were included if they met full criteria for ADHD according to the DSM-IV, with childhood onset and persistence into adulthood. We conducted direct interviews with all subjects. Trained, lay interviewers, blind to ascertainment status, interviewed all adults with the Structured Clinical Interview for DSM-IV (59) supplemented with modules from the Schedule for Affective Disorders and Schizophrenia for School-Age Children Epidemiological Version (60) to cover ADHD and other childhood disorders. Throughout the study, they were supervised in weekly meetings by board-certified child and adolescent psychiatrists and experienced licensed psychologists, who formed the Diagnostic Committee. During the study, all interviews were audiotaped for random quality control assessments. The interviewers’ data were reviewed by the Diagnostic Committee so that a DSM-IV consensus diagnosis (61) could be made.
BIOL PSYCHIATRY 2011;69:857– 866 859
L.J. Seidman et al. The Diagnostic Committee was blind to the subject’s ascertainment group, all data collected from other family members, and all nondiagnostic (e.g., brain imaging) data. Diagnoses were made for two points in time: lifetime and the month before the interview. We computed kappa coefficients of diagnostic agreement by having experienced, board-certified child and adult psychiatrists diagnose subjects from audiotaped interviews. Based on 500 assessments from interviews of children and adults, the median kappa coefficient was .98. Kappa coefficients for individual diagnoses included: ADHD (.88), conduct disorder (1.0), major depression (1.0), and multiple anxiety disorders (separation anxiety [1.0], agoraphobia [1.0], and panic disorder [.95]). For this article, we include estimates of IQ and academic achievement tests to demonstrate comparability of the two groups on overall intellectual potential and achievement. The IQ was estimated from the block design and vocabulary subtests of the Wechsler Adult Intelligence Scale-Third Edition (57). Academic achievement was assessed with the reading and arithmetic tests of the Wide Range Achievement Test-Third Edition (WRAT-III) (62). Learning disability (LD) was defined by a score less than or equal to 85 on the WRAT-III reading and/or arithmetic scaled scores. MRI Protocol Whole-brain magnetic resonance images were collected on a Siemens 1.5 Tesla scanner (Siemens Medical Systems, Erlangen, Germany) at the MGH Martinos Center (Charlestown, Massachusetts). A sagittal localizer scan was performed for placement of slices, followed by a coronal T2-weighted sequence to rule out unexpected neuropathology. Two sagittal three-dimensional magnetization-prepared rapid gradient-echo imaging (T1-weighted, nonselective inversion-prepared spoiled gradient echo pulse) sequences were collected (repetition time/echo time/T1/flip ! 2.73 sec/ 3.39 msec/1.0 sec/7, bandwidth ! 190 Hz/pixel, sampling matrix ! 256 " 192 pixels, field of view ! 256 " 256 mm, effective slice thickness ! 1.33 mm on a 170 mm slab of 128 partitions) and used for analyses conducted at the MGH Center for Morphometric Analysis (CMA). Data Analyses We compared the ADHD and control groups on demographic, psychiatric, and cognitive factors, using the chi-square test and t test for categorical and dimensional variables, respectively. VBM Methods. Structural scans were transferred to the CMA and coded and catalogued for blind analysis using VBM. Structural data were resampled to 2 * 2 * 2 mm and were analyzed with FSL-VBM 1.1 (http://www.fmrib.ox.ac.uk/fsl/fslvbm/index.html; Oxford University, Oxford, United Kingdom), a VBM style analysis (63,64) carried out with FSL tools (65). First, structural images were brain-extracted using the Brain Extraction Tool (66). Next, tissuetype segmentation was carried out using FAST4 (67). The resulting gray-matter partial volume images were then aligned to Montreal Neurological Institute (MNI) 152 standard space using the affine registration tool FLIRT (68,69). The resulting images were averaged to create a study-specific template, to which the native gray matter images were then nonlinearly reregistered using FNIRT (70,71), which uses a B-spline representation of the registration warp field (72). The registered partial volume images were then modulated, to correct for local expansion or contraction, by dividing the Jacobian of the warp field. The modulated segmented images were then smoothed with an isotropic Gaussian kernel with a sigma of 3 mm (full width at half-maximum ! 7.05 mm). Voxelwise general linear model was applied using permutationbased nonparametric testing (5000 permutations). We also used
analysis of covariance with the total intracranial volume (TIV), gender, and presence/absence of lifetime psychotropic medications as covariates. Total intracranial volume was calculated as the sum of gray matter, white matter, and cerebrospinal fluid volumes, from FSL Brain Extraction Tool segmentations. As we did not see a difference between the two models (t test vs. analysis of covariance), only t test results are reported. After whole-brain analysis, we performed ROI VBM analysis by creating a mask for each of the six a priori ROIs, based on the CMA adaptation of the MNI atlases. The mask was then inserted as an explicit mask into VBM analysis. The ROI VBM is more sensitive than the whole-brain VBM used for testing a priori hypotheses. Voxel-based thresholding, both uncorrected and corrected, for multiple comparisons was adopted. The significance level with the familywise error (FWE) corrected was set at p # .05 for both whole brain and six ROI analyses and the uncorrected significance level was set at p # .01, for preliminary identification of gray matter volume reductions or increases. Statistical maps were thresholded at p # .01 (uncorrected) using a minimum cluster size of three or more voxels. Threshold free cluster enhancement (73) was used to control FWE. Anatomical localization was defined by the CMA parcellation unit system for cortex (74) and cerebellum (75). A priori ROI predictions for VBM included volume reductions in: 1) DLPFC—Brodmann areas (BAs) 8, 9, and 46, represented by parcellation units F1 (superior frontal gyrus; BA 8, 9), F2 (middle frontal gyrus; BA 9), and F3 (inferior frontal gyrus; BA 46); 2) the ACC (anterior cingulate cortex, BA 24) and paracingulate gyri (paracingulate cortex, BA 32); 3) the IPL, comprising the angular (angular gyrus, BA 39) and supramarginal (supramarginal gyrus, BA 40) gyri; 4) the caudate— head and body of the caudate nucleus; 5) the putamen; and 6) the cerebellum. The clusters of significance were localized using a CMA adaptation of the MNI and Talairach atlases and reviewed by N.M. (26).
Results Demographic Characteristics, Intellectual Functioning and Symptoms As Table 1 shows, adults with ADHD were not significantly different than control subjects on the matching variables of age, sex distribution, handedness, or race. They were also statistically comparable on IQ, reading achievement, rates of LDs, and whole brain volume. Both groups had above average IQ. The only significant differences were in social class, which is consistent with the ADHD association with underachievement (76), Global Assessment of Functioning scores, and on the WRAT-III arithmetic test, which is commonly abnormal in ADHD and considered to be an effect of the disorder (77,78). There were no significant differences between groups on rates of major depressive, anxiety, combined substance use, or antisocial disorders; the rates of these comorbidities were very low in both groups at the most recent interview. VBM Results in A Priori ROIs In all six ROIs, compared with control subjects, adults with ADHD had at least one area of significantly smaller gray matter volumes (Table 2, and Figures 1, 3, and 4). These smaller regions included the 1) DLPFC—an area corresponding to lateral BA 8 in the left and right hemispheres; 2) ACC—an area corresponding to BA 24/32 in the right hemisphere; 3) IPL—an area in the left hemisphere corresponding to BA 40 (supramarginal gyrus); 4) caudate—an area involving the head and body in the left hemisphere; 5) putamen—left hemisphere; and 6) cerebellum—areas in the left cerebellum corresponding to regions culmen superior, culmen inferior, simplex, www.sobp.org/journal
860 BIOL PSYCHIATRY 2011;69:857– 866
L.J. Seidman et al.
Table 1. Demographic Characteristics of Adults with ADHD and Control Subjects
Demographic Characteristics Age (in years) SESa ADHD Symptoms Current GAF Whole Brain Volume–Voxels/cm3 Full Scale IQ Estimateb WRAT-III Reading SSc WRAT-III Arithmetic SSc Gender (Male) Handedness (Right) Race (Caucasian) Learning Disabilityd Major Depressione Multiple (" 2) Anxiety Disordere Antisocial Personality Disordere Substance Use Disorderse
Control Subjects n ! 54 Mean (SD) or Percentage
ADHD n ! 74 Mean (SD) or Percentage
Test Statistic (t, df), p Value, and $2 and p Value
34.3 (11.3) 1.7 (.5) 1.0 (1.7) 68.0 (5.0) 186947.7/1485 115.8 (12.1) 109.4 (7.5) 107.5 (11.8) 25 (46%) 48 (89%) 54 (100%) 3 (6%) 1 (2%) 0 (0%) 0 (0%) 0 (0%)
37.3 (12.6) 2.0 (1.0) 13.6 (2.9) 60.5 (5.9) 187656.6/1501 116.0 (12.6) 107.4 (9.3) 101.5 (11.7) 38 (51%) 65 (88%) 74 (100%) 9 (12%) 6 (8%) 0 (0%) 0 (0%) 0 (0%)
t ! %1.4 df ! 126, p ! .161 t ! %2.2 df ! 123, p ! .033 t ! %28.1 df ! 126, p ! .000 t ! 7.63, df ! 126, p # .001 t ! %.24 df ! 126, p ! .817 t ! %.1 df ! 124, p ! .925 t ! .2 df ! 126, p ! .186 t ! 2.9 df ! 124, p ! .005 $2 ! .319, p ! .572 $2 ! .033, p ! .855 ns $2 ! 1.585, p ! .208 $2 ! 2.364, p ! .124 ns ns ns
ADHD, attention-deficit/hyperactivity disorder; GAF, Global Assessment of Functioning; IQ, intelligence quotient; ns, nonsignificant; SES, socioeconomic status; SS, scaled score; WRAT-III, Wide Range Achievement Test, 3rd Edition. a Socioeconomic status (58). b Intelligence quotient, measured by Vocabulary and Block Design subtests of the Wechsler Adult Intelligence Scale, Third Edition (57). c Wide Range Achievement Test, 3rd Edition, Reading Scaled Score and Arithmetic Scaled Score (62). d Learning disability is defined by a score less than or equal to 85 on the Wide Range Achievement Test, 3rd Edition, Reading Scaled Scores and/or Arithmetic Scaled Scores. e Rates of disorders at most recent interview.
hemispheric zone of lobule X (X-h), biventer (pars paraflocculus dorsalis), and tonsil (Makris et al. [75]) and areas in the right cerebellum corresponding to culmen superior, superior semilunar lobule, biventer (pars paraflocculus dorsalis), and tonsil. No significant differences were identified at the FWE correction in these ROIs or the rest of the brain when the FWE correction (p # .05) was applied to the whole brain. Using ROI-VBM for the six regions individually, a t test was significant at the FWE for the caudate (Table 3). Results did not change when covarying sex, TIV, and presence/absence of medications; nor were there significant differences between ADHD individuals with versus without lifetime psychotropic medication exposure. In two of the six ROIs, there were differences between ADHD and control groups in which the ADHD group had larger gray matter volumes at p ! .01 (DLPFC and IPL) (Table 2 and Figure 2). VBM Exploratory Results Here, we report any nonpredicted findings in which there was smaller or larger gray matter in ADHD than control subjects in other ROIs at p ! .001. A number of areas in the left and right frontal lobe, left hippocampus/parahippocampus, right temporal cortex, left and right occipital cortex, and right thalamus were significantly smaller in ADHD at this threshold (Table S1 in Supplement 1). A number of areas were larger in ADHD than control subjects at this threshold, including a large area in FOC bilaterally and a large area in the left temporal cortex and anterior parahippocampus. Some areas of left and right occipital cortex were also larger in ADHD than control subjects (Table S1 in Supplement 1). No statistically significant differences were found at the FWE at the whole brain.
Discussion This VBM study of brain structure in ADHD adults partially supported the hypothesis that ADHD adults have subtle brain volume reductions in a priori predicted ROIs (DLPFC, ACC, IPL, caudate, www.sobp.org/journal
putamen, and cerebellum), a network of structures involved in attention and EFs (cf. 29). However, the results were only robust with respect to the caudate, the only ROI that met FWE threshold for significance using ROI-VBM. Results were not significantly influenced by sex, TIV, or medication status. These results extend to adults with ADHD the previously reported findings in the literature on children with ADHD. They provide support for the validity of ADHD in adults and for the syndromic continuity into adult life of biological features found in ADHD children. It is notable that brain differences were detectable in the absence of significant differences in demographic, psychiatric, or cognitive variables used to group match. Both groups were highly educated and were above average in general intellectual ability. Moreover, there were no meaningful differences between groups on rates of mood, anxiety, substance or antisocial disorders, or learning disabilities, comorbidities that are typically significantly more common in adult ADHD than control subjects (20). The differences in social class, a variable comprised of occupation and education of the participants (not of the family of origin), the Global Assessment of Functioning, and WRAT-III arithmetic are strongly associated with the disorder and were not matching variables. Thus, the significant structural reduction in the ADHD group can be attributed to having ADHD and not to co-occurring current psychiatric or cognitive comorbidity or medications. The larger FOC observed in our study is notable in that Hesslinger et al. (23) used an ROI analysis to examine the FOC and found a significant volume reduction of the left FOC. In contrast, our initial morphometric ROI analysis (18) found no FOC volume reductions in adult ADHD and in prior work found volumetric reductions in FOC in a study of adults with comorbid ADHD and bipolar disorder (28), suggesting that reductions of FOC may be a correlate of comorbidity with mood disorders rather than a correlate of ADHD. More work is needed to clarify these differences, as the studies differ substantially in sample size and methods. Moreover, the role of the FOC in
BIOL PSYCHIATRY 2011;69:857– 866 861
L.J. Seidman et al.
Table 2. Voxel Based Morphometric Differences Between Adults with ADHD and Control Subjects in Six ROIs Region of Interest CMA PU – BA Volume Reduction in ADHD DLPFC - Left Hemisphere F1/F2 - BA 8/LAT F2 - BA 9 DLPFC - Right Hemisphere F2 - BA 8 F1 - BA 9/LAT FP/BA 9/LAT ACC - Right Hemisphere Ant mACC - BA 24/32 ACC - Left Hemisphere ACC/BA 24 IPL - Left Hemisphere SGp – BA 40 SGp – BA 40 PO - BA 40/S-II/SGa/BA 40 AG/BA 39 Caudate - Left Hemisphere Putamen - Left Hemisphere Cerebellum – Left VIIA_crusl-m IV-m, V-m VI-m, X-h IV-m, V-m IX-m VIIIB-m Cerebellum – Right IV-m V-m, VI-m, VIIB-m VIIA_crusl-m VIIA_crusl-m VIIA_crusl-m VIIIA-m VIIIB-m VI-m IX–m/VIIIB-m Region of Interest CMA PU - BA Volume Increase in ADHD DLPFC - Right Hemisphere F1 BA 8/LAT IPL - Right Hemisphere AG/BA 39
Clusters of Three Voxels or Larger at Statistical Threshold for Control Subject & ADHD (Uncorrected)a MNI Coordinates (x,y,z)
p ! .01
p ! .005
p ! .001
%16, 28, 38 %46, 16, 24
52 27
34 —
12 —
26, 26, 32 16, 38, 40 28, 42, 38
30 10 6
17 — —
— — —
14, 20, 32
74
43
—
%12, %22, 38
3
%64, %48, 36 %58, 50, 50 %60, %26, 20 %66, %56, 16 %16, 4, 12 %20, 6, 12
7 20 122 9 334 8
3 12 60 — 215
— — — — 44
%32, %82, %16 %26, %32, %40 %26, %32, %40 %14, %54, %8 %14, %44, %56 %14, %44, %56
52 96 (96) 30 262 (262)
— 51 (51) — 132 (132)
— — 17 — — 24
20, %34, %24 26, %36, %36 56, %68, %32 38, %86, 36 44, %80, %30 20, %44, %54 20, %44, %54 6, %74, %20 6, %60, %58
30 36 56 18 41 74 (74) 5 89
3 — 28 — 17 — 21 — 17
— — —
— — — —
Clusters of Three Voxels or Larger at Statistical Threshold for ADHD & Control Subject (Uncorrected)b MNI Coordinates (x,y,z)
p ! .01
p ! .005
p ! .001
6, 30, 64
12
—
—
44, %62, 18
26
—
—
FSL-voxel based morphometry results comparing differences in gray matter volume thresholded to a probability of p ! .01, .005, and .001 (uncorrected). Local maxima are reported, including cluster size and anatomical region. Locations for statistical findings are reported in the standard Montreal Neurological Institute coordinate space (x, y, z). Some clusters border on more than one region—those clusters are reported more than once with cluster size in parentheses (see also Figure 1). Parcellation units are regions of interest defined by the Center for Morphometric Analysis as in Caviness et al. (74) for the cortex and Makris et al. (75) for the cerebellum. ACC, anterior cingulate cortex, ADHD, attention-deficit/hyperactivity disorder; AG, angular gyrus; Ant mACC, anterior middle cingulate cortex; BA, Brodmann area; CMA, Center for Morphometric Analysis; DLPFC, dorsolateral prefrontal cortex; F1, superior frontal gyrus; F2, middle frontal gyrus; FP, frontal pole; IPL, inferior parietal lobule; LAT, lateral; m, medial; MNI, Montreal Neurological Institute; PO, parietal operculum; PU, parcellation units; ROI, region of interest; S-II, somatosensory area - II; SGa, supramarginal gyrus anterior; SGp, supramarginal gyrus posterior. Cerebellar areas: IV-m, culmen superior; IX-m, tonsil; V-m, culmen inferior; VI-m, simplex; VIIA_crusI-m, superior semilunar lobule; VIIB-m, paramedian/gracilis; VIIIA-m, biventer (pars copularis); VIIIB-m, biventer (pars paraflocculus dorsalis); X-h, hemispheric zone of lobule X; X-m, flocculus (see also Figures 3 and 4). a All results are in the direction of smaller volumes in the ADHD group than in control subjects. b All results are in the direction of larger volumes in the ADHD group than in control subjects.
ADHD needs to be clarified, as its dysfunction in ADHD has been hypothesized by a number of investigators (30) due to its importance in task coordination and control of emotional behavior. The larger volumes of FOC and of other ROIs in our sample were not
predicted, require further study, and must be viewed cautiously until replicated. Our ROI findings are generally consistent with the pediatric literature (17,20 –22) with one major exception: our adult data indiwww.sobp.org/journal
862 BIOL PSYCHIATRY 2011;69:857– 866 cate comparability of overall cerebral volume, whereas the pediatric literature consistently reports smaller overall brain volume in ADHD than control subjects. One possible explanation for this difference is that our adult ADHD sample is relatively high functioning (mean IQ of 116) with few comorbidities, either psychiatric or LDs, and thus, a higher functioning subgroup of the distribution of cases than those typically seen in pediatric samples. Moreover, there were no meaningful sociodemographic and cognitive differences from control subjects. The ADHD samples typically have lower IQs (on average by about nine points, Cohen’s d ! %.61), as reflected in a meta-analysis of 137 studies (79) and in frequency of comorbid LD (77,78), whereas this adult ADHD sample did not. While the ADHD features of high IQ patients parallel those seen in lower IQ patients for both children (80) and adults (81) with the disorder, it is possible that higher IQ in ADHD is associated with fewer structural brain differences from control subjects. Another explanation is that developmental differences that are present in childhood diminish in adulthood, a hypothesis that has some traction based on results by Shaw et al. (82). Their work demonstrated a developmental lag in cortical thickness of between 3 and 5 years, depending on the ROI, in children entering their early teen years. In contrast, our sample ranges from ages 18 to 59, with means of approximately 35 years of age in the two groups. This issue can only be resolved by long-term follow-up study of children diagnosed with ADHD in childhood who retain their ADHD diagnoses and receive brain imaging in their adult years. Another possibility requiring further research is that stimulant medications may have normalized brain volumes in ADHD (83).
L.J. Seidman et al.
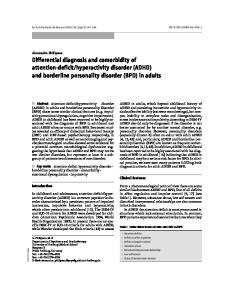
Figure 2. Voxel based morphometry control subjects # attention-deficit/hyperactivity disorder (ADHD): cortical regions that are larger in ADHD compared with control subjects. Labels with arrows are those regions that are larger in ADHD (p # .01) and correspond to those described in Table 2 for predicted regions of interest. Note those regions that are larger at this threshold, which are considered exploratory findings, outside of the predicted regions of interest are in Table S1 in Supplement 1. Significant differences are displayed on the inflated surface of the Montreal Neurological Institute brain. ACC, anterior cingulate cortex; AG, angular gyrus; BA, Brodmann area; CGp, posterior cingulate gyrus; CN, cuneus; F1, superior frontal gyrus; F3orb, inferior frontal gyrus, pars orbitalis; FOC, fronto-orbital cortex; FP, frontal pole; Lat, lateral; Li, lateral inferior; LS, lateral superior; OLi, lateral occipital area, inferior part; OLs, lateral occipital area, superior part; PHa, anterior parahippocampal gyrus; PO, parietal operculum; PP, planum polare; PRG, precentral gyrus; SCLC, supracalcarine cortex; TP, temporal pole; VBM, voxel based morphometry; VMPF, ventromedial prefrontal cortex.
Limitations This study has a number of limitations. We conducted a number of statistical tests on six ROIs that vary in size, and thus we are vulnerable to making a type I error, given the nonsignificant find-
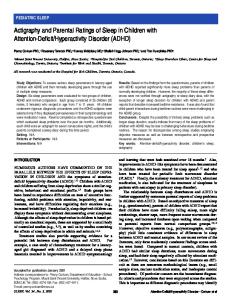
Figure 1. Voxel based morphometry control subjects & attention-deficit/ hyperactivity disorder (ADHD): cortical regions that are smaller in ADHD compared with control subjects. Labels with arrows are those regions that are smaller in ADHD (p # .01) and correspond to those described in Table 2 for predicted regions of interest. Note those regions that are smaller at this threshold, which are considered exploratory findings outside of the predicted regions of interest, are in Table S1 in Supplement 1. Significant differences are displayed on the inflated surface of the Montreal Neurological Institute brain. AG, angular gyrus; Ant mACC, anterior middle cingulate cortex; BA, Brodmann area; CALC, calcarine area; CGp, posterior cingulate gyrus; F1, superior frontal gyrus; F2, middle frontal gyrus; F3o, inferior frontal gyrus, pars opercularis; FP, frontal pole; Lat, lateral; LG, lingual gyrus; OP, occipital pole; PHp, posterior parahippocampal gyrus; PO, parietal operculum; PP, planum polare; S-II, somatosensory area - II; SGa, anterior supramarginal gyrus; SGp, posterior supramarginal gyrus; SMC, supplementary motor cortex; VBM, voxel based morphometry.
www.sobp.org/journal
Figure 3. Cerebellar regions that are smaller in attention-deficit/hyperactivity disorder compared with control subjects on a flattened brain. Labels with arrows are smaller in attention-deficit/hyperactivity disorder (p # .01) and correspond to those described in Table 2. Significant differences are displayed on the flattened cerebellar surface of the Montreal Neurological Institute brain. ADHD, attention-deficit/hyperactivity disorder; IV-m, culmen superior; IX-m, tonsil; V-m, culmen inferior; VI-m, simplex; VIIA_crusI-m, superior semilunar lobule; VIIB-m, paramedian/gracilis; VIIIA-m, biventer (pars copularis); VIIIB-m, biventer (pars paraflocculus dorsalis); X-h, hemispheric zone of lobule X; X-m, flocculus; VBM, voxel based morphometry.
BIOL PSYCHIATRY 2011;69:857– 866 863
L.J. Seidman et al. ings at the FWE threshold for the whole brain. However, our main findings were in the predicted direction, were consistent with a priori hypotheses and with the bulk of the literature in children with ADHD, and were robust in the caudate at the a priori hypothesis testing FWE. Moreover, there were no significant differences in the opposite direction in these ROIs. These results were observed in the context of a very tightly matched control group and an ADHD group with relatively high IQs, few LDs, and few psychiatric comorbidities. Thus, this study may have been less likely to find significant results than many in the literature, assuming that brain volume differences are associated with IQ, LDs, and psychiatric comorbidities. Because our sample was referred for ADHD, our results cannot be generalized to nonreferred samples. The diagnoses of adult ADHD relied entirely on the self-report of adult subjects. Thus, these findings may not generalize to diagnoses defined using data from informants. Another limitation to the generalizability of our results is that our sample was not representative of lower socioeconomic or all IQ strata and only included Caucasian participants. Although we had a relatively high IQ sample, we have shown elsewhere that ADHD features in high IQ ADHD adults parallel those seen in other adults with ADHD (81). While generalizability is limited until we learn whether these results are robust across samples, the relatively homogeneous nature of
Table 3. Familywise Error Corrected p Values for Models Using Regions of Interest Hypothesized to be Significantly Smaller in ADHD Than Control Subjects Regions of Interest DLPFC IPL ACC Putamen Cerebellum Caudatea
Group
Group, Sex, Total Brain Volume
Group, Medication Status
Group, Sex, Total Brain Volume, and Medication
.6510 .5160 .1580 .4300 .1300 .0130
.7510 .5250 .1650 .4230 .1110 .0130
.6464 .2094 .4112 .3186 .2240 .0292
.7352 .2426 .4404 .2816 .1500 .0394
ACC, anterior cingulate cortex; ADHD, attention-deficit/hyperactivity disorder; DLPFC, dorsolateral prefrontal cortex; IPL, inferior parietal lobule. a Statistically significant at familywise error rate at p # .05.
our sample and its tight matching with control subjects suggests that our findings do not result from these confounds. Finally, the effects on the brain of diverse medication histories are unknown, although presence or absence of lifetime medications did not significantly influence the results. We used VBM, in part, to eliminate rater effects arising from manual morphometry, as this study was carried out over a 5-year period and involved a large sample. While VBM allows a large number of brains to be measured without the influence of raters, it suffers from its own intrinsic limitations (84,85), as do other automated measures, particularly the problem of co-registration, as we noted in detail in Makris et al. ([26] page 1372). Despite these limitations, the current methods of registration employed in this study represent state of the art technology in this domain. Finally, we identified a number of unpredicted results, and further work will be needed to replicate these findings (e.g., significantly larger FOC). Conclusions and Future Directions Despite these limitations, the results provide partial support for the hypothesis that some structural brain abnormalities persist into adulthood in ADHD, complementing studies demonstrating persistent neuropsychological and functional brain dysfunctions. Replication of these findings in adults is necessary to establish that the particular structures found to be abnormal are core components of the neurobiology of ADHD in adults. Moreover, future studies should address these questions by studying psychotropically naïve individuals and studying the effects of substance use and medications on the brain in ADHD individuals.
Figure 4. Cerebellar regions that are smaller in attention-deficit/hyperactivity disorder compared with control subjects as seen on an inflated brain. Labels with arrows are smaller in attention-deficit/hyperactivity disorder (p # .01) and correspond to those described in Table 2. Significant differences are displayed on the inflated cerebellar surface of the Montreal Neurological Institute brain. ADHD, attention-deficit/hyperactivity disorder; IV-m, culmen superior; IX-m, tonsil; V-m, culmen inferior; VI-m, simplex; VIIA_crusI-m, superior semilunar lobule; VIIB-m, paramedian/gracilis; VIIIA-m, biventer (pars copularis); VIIIB-m, biventer (pars paraflocculus dorsalis); X-h, hemispheric zone of lobule X; X-m, flocculus; VBM, voxel based morphometry.
This work was supported in part by National Institute of Mental Health (NIMH) MH/HD 62152, the March of Dimes Foundation, the Mental Illness and Neuroscience Discovery Institute, and the Commonwealth Research Center of the Massachusetts Department of Mental Health (to LJS); National Research Service Award (NIMH F32 MH065040-01A1), Peter Livingston Fellowship through the Harvard Medical School Department of Psychiatry, and the Clinical Research Training Program Fellowship in Biological and Social Psychiatry MH 16259 and MH 071535 (to EMV); NIMH MH 57934 (to SVF); the National Alliance for Research on Schizophrenia and Depression Distinguished Investigator Award and the Johnson and Johnson Center for the Study of Psychopathology (to JB); and The National Center for Research Resources (P41RR14075). These funders had no role in the design and conduct of the study; collection, management, analysis, and interpretation of the data; and preparation, review, or approval of the manuscript. www.sobp.org/journal
864 BIOL PSYCHIATRY 2011;69:857– 866 We thank the individuals who served as research participants. We also thank Sharmila Bandyopadhyay, Denise Boriel, Katherine Crum, Dr. Alysa Doyle, Dr. Ronna Fried, Steve Hodge, Kalika Kelkar, Alexandra Lomedico, Dr. Eric Mick, Nicole Peace, John Schlerf, Michael Schiller, Michael Vitulano, and Dr. Timothy Wilens for their contributions. Dr. Larry J. Seidman reports no financial disclosures or conflicts of interest for the past 2 years. He has been a speaker for Shire Pharmaceuticals and received an unrestricted educational grant from Janssen Pharmaceuticals in the past 5 years. Dr. Joseph Biederman is currently receiving research support from the following sources: Alza, AstraZeneca, Bristol-Myers Squibb, Eli Lilly and Co., Janssen Pharmaceuticals Inc., McNeil, Merck, Organon, Otsuka, Shire, NIMH, and National Institute of Child Health and Human Development. In 2009, Dr. Joseph Biederman received a speaker’s fee from the following sources: Fundacion Areces, Medice Pharmaceuticals, and the Spanish Child Psychiatry Association. In previous years, Dr. Joseph Biederman received research support, consultation fees, or speaker’s fees for/from the following additional sources: Abbott, AstraZeneca, Celltech, Cephalon, Eli Lilly and Co., Eisai, Forest, Glaxo, Gliatech, Janssen, McNeil, National Alliance for Research on Schizophrenia and Depression, National Institute on Drug Abuse, New River, Novartis, Noven, Neurosearch, Pfizer, Pharmacia, The Prechter Foundation, Shire, The Stanley Foundation, UCB Pharma Inc., and Wyeth. Dr. Eve M. Valera has received travel support and honoraria from Shire Pharmaceuticals and the McNeil and Janssen divisions of Ortho-McNeil-Janssen Pharmaceuticals. Dr. Thomas Spencer has received research support from, has been a speaker on a speaker bureau, or has been on an advisory board of the following sources: Shire Laboratories Inc., Eli Lilly and Company, GlaxoSmithKline, Janssen Pharmaceutical, McNeil Pharmaceutical, Novartis Pharmaceuticals, Cephalon, Pfizer, and the National Institute of Mental Health. In the past year, Dr. Stephen Faraone has received consulting fees and has been on advisory boards for Eli Lilly, McNeil, and Shire and has received research support from Eli Lilly, Pfizer, Shire, and the National Institutes of Health. In previous years, Dr. Faraone has received consulting fees, has been on advisory boards, or has been a speaker for the following sources: Shire, McNeil, Janssen, Novartis, Pfizer, and Eli Lilly. In previous years, he has received research support from Eli Lilly, Shire, Pfizer, and the National Institutes of Health. All other authors report no biomedical financial interests or potential conflicts of interest. Supplementary material cited in this article is available online. 1. Faraone SV, Biederman J, Spencer T, Wilens T, Seidman LJ, Mick E, Doyle A (2000): Attention deficit hyperactivity disorder in adults: An overview. Biol Psychiatry 48:9 –20. 2. Biederman J (1998): Attention-deficit/hyperactivity disorder: A life span perspective. J Clin Psychiatry 59:4 –16. 3. Biederman J, Mick E, Faraone SV (2000): Age-dependent decline of symptoms of attention deficit hyperactivity disorder: Impact of remission definition and symptom type. Am J Psychiatry 157:816 – 818. 4. Kessler RC, Adler L, Barkley R, Biederman J, Conners CK, Demler O, et al. (2006): The prevalence and correlates of adult ADHD in the United States: Results from the national comorbidity survey replication. Am J Psychiatry 163:716 –723. 5. Faraone SV, Biederman J (2005): What is the prevalence of adult ADHD? Results of a population screen of 966 adults. J Atten Disord 9:384 –391. 6. Faraone S, Biederman J, Mick E (2006): The age dependent decline of attention-deficit/hyperactivity disorder: A meta-analysis of follow-up studies. Psychol Med 36:159 –165. 7. Biederman J, Faraone SV, Monuteaux MC, Bober M, Cadogen E (2004): Gender effects on attention-deficit/hyperactivity disorder in adults, revisited. Biol Psychiatry 55:692–700. 8. Faraone SV, Biederman J, Doyle A, Murray K, Petty C, Adamson J, Seidman L (2006): Neuropsychological studies of late onset and subthreshold diagnoses of adult ADHD. Biol Psychiatry 60:1081–1087.
www.sobp.org/journal
L.J. Seidman et al. 9. Biederman J, Petty C, Fried R, Fontanella J, Doyle AE, Seidman LJ, Faraone SV (2006): Impact of psychometrically defined executive function deficits in adults with ADHD. Am J Psychiatry 163:1730 –1738. 10. Biederman J, Petty C, Fried R, Doyle AE, Spencer T, Seidman L, et al. (2007): Stability of executive function deficits into young adult years: A prospective longitudinal follow-up study of grown up youth with ADHD. Acta Psychiatr Scand 116:129 –136. 11. Barkley RA, Murphy KR, Fischer M (2008): ADHD in Adults: What the Science Says. New York: Guilford. 12. Biederman J, Faraone SV, Spencer TJ, Mick E, Monuteaux MC, Aleardi M (2006): Functional impairments in adults with self-reports of diagnosed ADHD: A controlled study of 1001 adults in the community. J Clin Psychiatry 67:524 –540. 13. Biederman J, Faraone SV (2006): The effects of attention-deficit/hyperactivity disorder on employment and household income. MedGenMed 8:12. 14. Mannuzza S, Klein RG, Bessler A, Malloy P, LaPadula M (1993): Adult outcome of hyperactive boys. Educational achievement, occupational rank, and psychiatric status. Arch Gen Psychiatry 50:565–576. 15. Faraone SV, Biederman J, Spencer TJ, Mick E, Murray K, Petty C, et al. (2006): Diagnosing adult attention deficit hyperactivity disorder: Are late onset and subthreshold diagnoses valid? Am J Psychiatry 163:1720 – 1729. 16. Biederman J, Monuteaux M, Mick E, Spencer T, Wilens T, Silva J, et al. (2006): Young adult outcome of attention deficit hyperactivity disorder: A controlled 10 year prospective follow-up study. Psychol Med 36:167– 179. 17. Seidman LJ, Valera EM, Makris N (2005): Structural brain imaging of adult ADHD. Biol Psychiatry 57:1263–1272. 18. Seidman LJ, Valera EM, Makris N, Monuteaux MC, Boriel DL, Kelkar K, et al. (2006): Dorsolateral prefrontal and anterior cingulate cortex volumetric abnormalities in adults with attention-deficit/hyperactivity disorder identified by magnetic resonance imaging. Biol Psychiatry 60: 1071–1080. 19. Faraone SV (2004): Etiology and pathophysiology of adult attention deficit hyperactivity disorder. Prim Psychiatry 11:28 – 40. 20. Cubillo A, Rubia K (2010): Structural and functional brain imaging in adult attention-deficit/hyperactivity disorder. Expert Rev Neurother 10: 603– 620. 21. Valera EM, Faraone SV, Murray KE, Seidman LJ (2007): Meta-analysis of structural imaging findings in ADHD. Biol Psychiatry 61:1361–1369. 22. Ellison-Wright I, Ellison-Wright Z, Bullmore E (2008): Structural brain change in attention deficit hyperactivity disorder identified by metaanalysis. BMC Psychiatry 8:51. 23. Hesslinger B, Tebartz van Elst L, Thiel T, Haegele K, Hennig J, Ebert D (2002): Frontoorbital volume reductions in adult patients with attention deficit hyperactivity disorder. Neurosci Lett 328:319 –321. 24. Perlov E, Philipsen A, Tebartz van Elst L, Ebert D, Henning J, Maier S, et al. (2008): Hippocamapus and amygdala morphology in adults with attention-deficit hyperactivity disorder. J Psychiatry Neurosci 33:509 –515. 25. Frodl TJ, Stauber , Schaaff N, Koutsouleris N, Scheuerecker J, Ewers M, et al. (2010): Amygdala reduction in patients with ADHD compared with major depression and healthy volunteers. Acta Psychiatr Scand 121:111– 118. 26. Makris NM, Biederman J, Valera EM, Bush G, Kaiser JR, Kennedy DN, et al. (2007): Cortical thinning of the attention and executive function networks in adults with attention-deficit/hyperactivity disorder. Cereb Cortex 17:1364 –1375. 27. Makris NM, Buka SL, Biederman J, Papadimitriou GM, Hodge SM, Valera EM, et al. (2008): Attention and executive systems abnormalities in adults with childhood ADHD: A DT-MRI study of connections. Cereb Cortex 18:1210 –1220. 28. Biederman J, Makris N, Valera EM, Monuteaux MC, Goldstein JM, Buka S, et al. (2008): Towards further understanding of the comorbidity between attention deficit hyperactivity disorder and bipolar disorder: An MRI study of brain volumes. Psychol Med 38:1045–1056. 29. Makris N, Biederman J, Monuteaux MC, Seidman LJ (2009): Towards conceptualizing a neural systems-based anatomy of attention-deficit/ hyperactivity disorder. Dev Neurosci 21:36 – 49. 30. Barkley RA (1997): Behavioral inhibition, sustained attention, and executive functions: Constructing a unifying theory of ADHD. Psychol Bull 121:65–94.
L.J. Seidman et al. 31. Seidman LJ, Valera EM, Bush G (2004): Brain function and structure in adults with attention-deficit/hyperactivity disorder. Psychiatr Clin North Am 27:323–347. 32. Hervey AS, Epstein J, Curry JF (2004): Neuropsychology of adults with attention-deficit/hyperactivity disorder: A meta-analytic review. Neuropsychology 18:485–503. 33. Seidman LJ (2006): Neuropsychological function in people with ADHD across the lifespan. Clin Psychol Rev 26:466 – 485. 34. Bush G, Spencer TJ, Holmes J, Shin LM, Valera EM, Seidman LJ, et al. (2008): Functional magnetic resonance imaging of methylphenidate and placebo in attention-deficit/hyperactivity disorder during the multi-source interference task. Arch Gen Psychiatry 65:102–114. 35. Dickstein SG, Bannon K, Castellanos FX, Milham MP (2006): The neural correlates of attention deficit hyperactivity disorder: An ALE meta-analysis. J Child Psychol Psychiatry 47:1051–1062. 36. Valera EM, Brown A, Biederman J, Faraone SV, Makris N, Monuteaux MC, et al. (2010): Sex differences in the functional neuroanatomy of working memory in adults with ADHD. Am J Psychiatry 167:86 –94. 37. Castellanos FX (1997): Toward a pathophysiology of attention-deficit/ hyperactivity disorder. Clin Pediatr (Phila) 36:381–393. 38. Tannock R (1998): Attention deficit hyperactivity disorder: Advances in cognitive, neurobiological, and genetic research. J Child Psychol Psychiatry 39:65–99. 39. Durston S (2003): A review of the biological bases of ADHD: What have we learned from imaging studies? Ment Retard Dev Disabil Res Rev 9:184 –195. 40. Bush G, Luu P, Posner MI (2000): Cognitive and emotional influences in anterior cingulate cortex. Trends Cogn Sci 4:215–222. 41. Bush G, Valera EM, Seidman LJ (2005): Functional neuroimaging of attention-deficit/hyperactivity disorder: A review and suggested future directions. Biol Psychiatry 57:1273–1284. 42. Bush G (2010): Attention-deficit/hyperactivity disorder and attention networks. Neuropsychopharmacology 35:278 –300. 43. Castellanos FX, Giedd J, Marsh W, Hamburger S, Vaituzis A, Dickstein D, et al. (1996): Quantitative brain magnetic resonance imaging in attention deficit hyperactivity disorder. Arch Gen Psychiatry 53:607– 616. 44. Castellanos FX, Giedd JN, Berquin PC, Walter JM, Sharp W, Tran T, et al. (2001): Quantitative brain magnetic resonance imaging in girls with attention-deficit/hyperactivity disorder. Arch Gen Psychiatry 58: 289 –295. 45. Castellanos FX, Lee PP, Sharp W, Jeffries NO, Greenstein DK, Clasen LS, et al. (2002): Developmental trajectories of brain volume abnormalities in children and adolescents with attention-deficit/hyperactivity disorder. JAMA 288:1740 –1748. 46. Alexander GE, DeLong MR, Strick PL (1986): Parallel organization of functionally segregated circuits linking basal ganglia and cortex. Annu Rev Neurosci 9:357–381. 47. Lou H (1996): Etiology and pathogenesis of attention-deficit hyperactivity disorder (ADHD); significance of prematurity and perinatal hypoxichaemodynamic encephalopathy. Acta Paediatr 85:1266 –1271. 48. Dougherty DD, Bonab AA, Spencer TJ, Rauch SL, Madras BK, Fischman AJ (1999): Dopamine transporter density is elevated in patients with ADHD. Lancet 354:2132–2133. 49. Volkow ND, Fowler JS, Wang GJ, Ding YS, Gatley SJ (2002): Role of dopamine in the therapeutic and reinforcing effects of methylphenidate in humans: Results from imaging studies. Eur Neuropsychopharmacol 12:557–566. 50. Schmahmann JD, Sherman JC (1998): The cerebellar cognitive affective syndrome. Brain 121:561–579. 51. Middleton FA, Strick PL (2001): Cerebellar projections to the prefrontal cortex of the primate. J Neurosci 21:700 –712. 52. Valera EM, Faraone SV, Biederman J, Poldrack RA, Seidman LJ (2005): Functional neuroanatomy of working memory in adults with attentiondeficit/hyperactivity disorder. Biol Psychiatry 57:439 – 447. 53. Berquin PC, Giedd JN, Jacobsen LK, Hamburger SD, Krain AL, Rapoport JL, Castellanos FX (1998): Cerebellum in attention-deficit hyperactivity disorder: A morphometric MRI study. Neurology 50:1087–1093. 54. Hill DE, Yeo RA, Campbell RA, Hart B, Vigil J, Brooks W (2003): Magnetic resonance imaging correlates of attention-deficit/hyperactivity disorder in children. Neuropsychology 17:496 –506. 55. Mostofsky SH, Reiss AL, Lockhart P, Denckla MB (1998): Evaluation of cerebellar size in attention-deficit hyperactivity disorder. J Child Neurol 13:434 – 439.
BIOL PSYCHIATRY 2011;69:857– 866 865 56. Durston S, Hulshoff Pol HE, Schnack HG, Buitelaar JK, Steenhuis MP, Minderaa RB, et al. (2004): Magnetic resonance imaging of boys with attention-deficit/hyperactivity disorder and their unaffected siblings. J Am Acad Child Adolesc Psychiatry 43:332–340. 57. Wechsler D (1997): Wechsler Adult Intelligence Scale, 3rd ed. San Antonio, TX: Psychological Corporation. 58. Hollingshead AB (1975): Four Factor Index of Social status. New Haven, CT: Yale University Department of Sociology. 59. First M, Spitzer R, Gibbon M, Williams J (1997): Structured Clinical Interview For DSM-IV Axis I Disorders. Washington, DC: American Psychiatric Publishing. 60. Orvaschel H (1994): Schedule for Affective Disorder and Schizophrenia for School-Age Children Epidemiologic Version, 5th ed. Ft. Lauderdale, FL: Nova Southeastern University, Center for Psychological Studies. 61. Leckman J, Sholomskas D, Thompson D, Belanger A, Weissman M (1982): Best estimate of lifetime psychiatric diagnosis: A methodological study. Arch Gen Psychiatry 39:879 – 883. 62. Wilkinson GS (1993): The Wide Range Achievement Test, Administration Manual, 3rd ed. Wilmington, DE: Wide Range, Inc. 63. Ashburner J, Friston KJ (2000): Voxel-based morphometry-the methods. Neuroimage 11:805– 821. 64. Good CD, Johnsrude IS, Ashburner J, Henson RN, Friston KJ, Frackowiak RS (2001): A voxel-based morphometric study of ageing in 465 normal adult human brain. Neuroimage 14:21–36. 65. Smith SM, Jenkinson M, Woolrich MW, Beckmann CF, Behrens TE, JohansenBerg H, et al. (2004): Advances in functional and structural MR image analysis and implementation as FSL. Neuroimage 23(suppl 1):S208–S219. 66. Smith SM (2002): Fast robust automated brain extraction. Hum Brain Mapp 17:143–155. 67. Zhang Y, Brady M, Smith SM (2001): Segmentation of brain MR images through a hidden Markov random field model and the expectation– maximization algorithm. IEEE Trans Med Imaging 20:45–57. 68. Jenkinson M, Smith SM (2001): A global optimisation method for robust affine registration of brain images. Med Image Anal 5:143–156. 69. Jenkinson M, Bannister PR, Brady JM, Smith SM (2002): Improved optimization for the robust and accurate linear registration and motion correction of brain image. Neuroimage 17:825– 841. 70. Andersson JLR, Jenkinson M, Smith SM (2007): Non-linear optimization. FMRIB Technical Report TR07JA1. Available at: http://www.fmrib.ox. ac.uk/analysis/techrep. 71. Andersson JLR, Jenkinson M, Smith SM (2007): Non-linear registration, aka spatial normalization. FMRIB Technical Report TR07JA2. Available at: http://www.fmrib.ox.ac.uk/analysis/techrep. 72. Rueckert D, Sonoda LI, Hayes C, Hill DLG, Leach MO, Hawkes DJ (1999): Nonrigid registration using free-form deformations: Application to breast MR images. IEEE Trans Med Imaging 18:712–721. 73. Smith SM, Nichols TE (2009): Threshold-free cluster enhancement: Addressing problems of smoothing, threshold dependence and localisation in cluster inference. Neuroimage 44:83–98. 74. Caviness VS Jr, Meyer J, Makris N, Kennedy DN (1996): MRI-based topographic parcellation of human neocortex: An anatomically specified method with estimate reliability. J Cogn Neurosci 8:566 –587. 75. Makris N, Schlerf JE, Hodge SM, Haselgrove C, Albaugh MD, Seidman LJ, et al. (2005): MRI-based surface-assisted parcellation of human cerebellar cortex: An anatomically specified method with estimate of reliability. Neuroimage 25:1146 –1160. 76. Biederman J, Petty CR, Fried R, Kaiser R, Dolan CR, Schoenfeld S, et al. (2008): Educational and occupational underattainment in adults with attention-deficit/hyperactivity disorder: A controlled study. J Clin Psychiatry 69:1217–1222. 77. Seidman LJ, Biederman J, Monuteaux MC, Doyle AE, Faraone SV (2001): Learning disabilities and executive dysfunction in boys with attention deficit hyperactivity disorder. Neuropsychology 15:544 –556. 78. Seidman LJ, Biederman J, Valera EM, Monuteaux MC, Doyle AE, Faraone SV (2006): Neuropsychological functioning in girls with attention-deficit/hyperactivity disorder with and without learning disabilities. Neuropsychology 20:166 –177. 79. Frazier TW, Demaree HA, Youngstrom EA (2004): Meta-analysis of intellectual and neuropsychological test performance in attention-deficit/ hyperactivity disorder. Neuropsychology 18:543–555. 80. Antshel KM, Faraone SV, Stallone K, Nave A, Kaufmann FA, Doyle AE, et al. (2007): Is attention deficit hyperactivity disorder a valid diagnosis
www.sobp.org/journal
866 BIOL PSYCHIATRY 2011;69:857– 866 in the presence of high IQ? Results from the MGH Longitudinal Family Studies of ADHD. J Child Psychol Psychiatry 48:687– 694. 81. Antshel KM, Faraone SV, Maglione K, Doyle A, Fried R, Seidman L, Biederman J (2009): Is adult attention deficit hyperactivity disorder a valid diagnosis in the presence of high IQ? Psychol Med 39:1325–1335. 82. Shaw P, Eckstrand K, Sharp W, Blumenthal J, Lerch J, Greenstein D, et al. (2007): Attention-deficit/hyperactivity disorder is characterized by a delay in cortical maturation. Proc Natl Acad Sci U S A 104:19649 –19654. 83. Sobel LJ, Bansal R, Maia TV, Sanchez J, Mazzone L, Durkin K, et al. (2010): Basal ganglia surface morphology and the effects of stimulant medica-
www.sobp.org/journal
L.J. Seidman et al. tions in youth with attention deficit hyperactivity disorder. Am J Psychiatry 167:977–986. 84. Bergouignan L, Chupin M, Czechowska Y, Kinkingnehun S, Lemogne C, Le Bastard G, et al. (2009): Can voxel based morphometry, manual segmentation and automated segmentation equally detect hippocampal volume differences in acute depression? Neuroimage 45:29 –37. 85. Henley SM, Ridgway GR, Scahill RI, Kloppel S, Tabrize SJ, Fox NC, et al. (2010): Pitfalls in the use of voxel-based morphometry as a biomarker: Examples from Huntington disease. AJNR Am J Neuroradiol 31:711–719.