Human Behavior Prediction for Smart Homes Using Deep Learning Sungjoon Choi, Eunwoo Kim, and Songhwai Oh
Abstract— There is a growing interest in smart homes and predicting behaviors of inhabitants is a key element for the success of smart home services. In this paper, we propose two algorithms, DBN-ANN and DBN-R, based on the deep learning framework for predicting various activities in a home. We also address drawbacks of contrastive divergence, a widely used learning method for restricted Boltzmann machines, and propose an efficient online learning algorithm based on bootstrapping. From experiments using home activity datasets, we show that our proposed prediction algorithms outperform existing methods, such as a nonlinear SVM and k-means, in terms of prediction accuracy of newly activated sensors. In particular, DBN-R shows an accuracy of 43.9% (51.8%) for predicting newly activated sensors based on MIT home dataset 1 (dataset 2), while previous work based on the n-gram algorithm has shown an accuracy of 39% (43%) on the same dataset.
I. I NTRODUCTION The aged dependency ratio, a ratio of the number of persons aged over 65 to the number of persons aged between 15 to 64, is projected to rise significantly due to low fertility rates [1]. Especially, in Japan, the current aged dependency ratio is about 0.25 and it is expected to increase to 0.71 by the year 2050. Because of this demographic shift, the need for smart homes which can assist occupants for maintaining independent lifestyles and increase the quality of life is emphasized [2], [3]. In this context, a number of research groups, and corporations have conducted studies of pervasive computing technologies for smart homes [4], [5], [6], [7], [8]. A number of existing studies have focused on passive sensing of recognizing inhabitants’ activities or detecting abnormal behaviors based on sensory data [2], [7], [9]. However, in order to provide intelligent services, the system needs to understand human behavior and intention. An ability to provide a service to the users when it is needed without the user intervention is crucial for the success of smart homes [6]. In other words, the smart home system needs an ability to learn human intention and make predictions about human behaviors. For this objective, several studies on human behavior prediction have been conducted [5], [6], [10]. Aipperspach et al. [5] applied the n-gram algorithm, which is developed for natural language processing, to model and predict human behavior for smart homes. Kubota et al. [10] proposed a human behavior prediction algorithm for a partner robot. Spiking neurons are used for extracting temporal patterns of human behavior and the prediction of the next Sungjoon Choi, Eunwoo Kim, and Songhwai Oh are with the Department of Electrical and Computer Engineering and ASRI, Seoul National University, Seoul 151-744, Korea (e-mail: {samchoi7, kewoo15, songhwai}@snu.ac.kr).
behavior is performed based on the inferred pattern. In [6], Mozer et al. applied Q-learning, a reinforcement learning algorithm, to predict when lights in a home will be turned on or off in order to schedule activations of lights in a home to conserve energy. We believe that two terms “intention” and “prediction” are deeply intertwined, and in order to predict human behavior successfully, it is required to understand inherent intention. However, the majority of the aforementioned work have been focused on making predictions based on outward behaviors, not inferring intention behind the behavior [5], [6], [10]. Although humans have an inherent ability to understand other people’s intention from their actions [11], it is difficult to extract relationship between actions and intentions in a structured way. The present paper attempts to extract the relationship between past actions and the future action using deep learning. Recently, deep learning, such as a deep neural network, has gained its popularity as a powerful tool for learning complex and large-scale problems [12]. The model for deep learning is typically constructed by cascading multiple restricted Boltzmann machines (RBMs) [13]. This deep architecture has been successfully used as a feature extractor for text, image, and sound data and as a good initial training step for deep architectures [14], [15]. The parameters of an RBM model can be learned using contrastive divergence (CD) [16] by approximating the model distribution using Gibbs sampling. However, this approximation scheme sometimes provides unsatisfactory results and a better learning method is needed for more complex problems [17], [18]. In this paper, we propose novel human behavior prediction algorithms using the deep learning architecture as an alternative to existing shallow architectures, such as a support vector machine (SVM) [19]. After discussing difficulties of using CD for training the human behavior model discussed in this paper, we propose an improved sampling method which can approximate the model (target) distribution more accurately using bootstrapping and selective learning. We first compare the proposed learning method against other conventional methods on a classification problem [20]. The performance of the proposed prediction method is demonstrated using the MIT home activity dataset [2] (see Figure 1). The proposed prediction method achieves an accuracy of 43.9% (51.8%) for predicting newly activated sensors based on MIT home dataset 1 (dataset 2), while previous work based on the ngram algorithm has shown an accuracy of 39% (43%) on the same dataset. The proposed human behavior prediction framework for smart homes is quite general and it can be easily extended to predict diverse human behaviors.
Fig. 2.
Restricted Boltzmann machine (RBM)
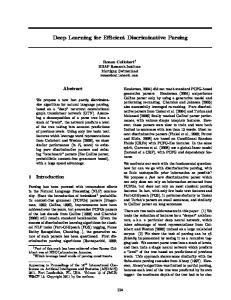
Fig. 1. Representative photos of the installation of “tape-and-forget” data collection sensors used in the MIT home dataset [2].
The remainder of this paper is organized as follows. In Section II, we briefly explain deep learning. The proposed training and prediction methods using deep learning are presented in Section III. In Section IV, experimental results of the UCI dataset [20] and MIT home dataset [2] are presented.
Fig. 3. Reconstruction results using an RBM. The first and second row indicate the reference MNIST digit data [21] and 20 % salt and pepper noised data, respectively. The third row is the reconstruction of the second row as an input using a pre-trained RBM.
X p(vi = 1|h) = g Wij hj + bi ,
(3)
j
II. D EEP L EARNING In this section, we briefly review deep learning or deep belief network (DBN) [4]. The cascaded structure used in deep learning is sometimes called a deep architecture. DBN consists of multiple restricted Boltzmann machines (RBM), which are energy-based unsupervised learning models. The most widely used learning method for an RBM is contrastive divergence (CD) [16]. A. Restricted Boltzmann Machine A restricted Boltzmann machine (RBM) [13] is a particular type of a Markov random field which has two layers. One layer of an RBM consists of visible input units, v ∈ {0, 1}D , which are connected to the other layer of hidden stochastic units h ∈ {0, 1}F . Figure 2 shows the basic structure of an RBM. The distribution of state {v, h} of an RBM is specified by the following energy function: E(v, h|θ) = −
D X F X
wij vi hj −
i=1 j=1
D X i=1
bi v i −
F X
aj hj , (1)
j=1
where W represents visible-to-hidden weight matrix consisting of weights wij of connections between neurons vi and hj , b represents a visible bias vector, and a represents a hidden bias vector. A set of all parameters is denoted by θ = {W, b, a}. The conditional distribution of the hidden vector h given the visible vector v can be derived from (1) using p(x|θ) = exp[−E(x|θ)]/Z(θ) as follows: ! X p(hj = 1|v) = g Wij vi + aj , (2) i
where g(x) P = 1/(1 + exp(−x)) is a logistic function and Z(θ) = x exp[−E(x|θ)] is a normalizing constant. Some attractive characteristics of an RBM include an ability to denoise corrupted data by capturing intrinsic shapes of training samples. Figure 3 shows the denoising result using an RBM on the MNIST digit dataset [21]. The first and second rows indicate reference data and 20% salt and pepper noised data, respectively, and the last row is the denoised data using a pre-trained RBM. B. Contrastive Divergence Learning The maximum likelihood estimate of parameter θ = {W, b, a} of an RBM can be obtained iteratively using a gradient-based update rule with learning rate η as follows: wij ← wij + η[hvi hj idata − hvi hj imodel ],
(4)
bi ← bi + η[hvi idata − hvi imodel ],
(5)
aj ← aj + η[hhj idata − hhj imodel ],
(6)
where h·idata denotes the expectation over the data distribution or positive phase distribution, P (h|{v(t) }, θ). Similarly, h·imodel denotes the expectation over the model or negative phase distribution, P (v, h|θ). The computation of the true gradient over P (v, h|θ) has the computational complexity of O(2D+Q ), where D and Q are numbers of nodes in a visible and hidden layer, respectively. To overcome this computational hurdle, [16] proposed the contrastive divergence (CD) learning method which approximates the model distribution using Gibbs sampling with the probability distribution of input samples as
follows: hvi hj idata − hvi hj imodel ≈ hvi hj idata − hvi hj iGc ,
(7)
n
hvi hj idata =
1 X (t) (t) v P (hj |v (t) , θ), n t=1 i
hvi hj iGc ≈
1 X (t) (t) v P (hj |v (t) , θ), n t=1 i
(8)
n
(9)
where Gc denotes the approximated distribution of the c-th iteration of Gibbs sampling and n is the number of samples, and vi is a negative phase visible unit from Gibbs sampling. The direction of the approximated gradient, however, is not identical to the true gradient and CD learning is also known to be biased [22]. Thus, in order to overcome these disadvantages, we propose a new learning method to better represent the model distribution in Section III-A. III. P REDICTION U SING D EEP L EARNING
Algorithm 1 Efficient online learning of an RBM using bootstrapping 1: Input : v j ∈ RD , j = 1, ..., n, r is the number of maximum iterations, and θ = {W , b, a} 2: Initialize W to small random values and b, a to all zeros + 3: v j ← v j for all j 4: for i = 1 : r 5: for j = 1 : n + 6: Calculate h+ j = P (h|v j , θ) T + + 7: Calculate positive phase gradient gjj = v+ j hj + − 8: Sample v j from P (v j |hj , θ) 9: for k = max(j − m, 1) : j − 10: Calculate the reconstruction error of v + j − vk 11: end 12: Select l samples having lowest errors 13: Calculate negative gradient Pphase j − 1 −T − 14: gjj = min(j,l) r=max(j−l,1) (v r hr ) + − 15: Calculate the full gradient gjj = gjj − gjj . 16: Update W , b, a using (4), (5), and (6). 17: end 18: end
This section describes learning and prediction methods using the deep learning architecture. B. Deep Architectures for Prediction A. Efficient Online Learning Using Bootstrapping As mentioned in the Section II-B, the conventional CD learning has several disadvantages such as an inaccurate approximation of the model distribution and biased estimates. Here, we propose a new learning algorithm to supplement the drawback and improve the existing CD learning method. In the proposed method, we use the idea of bootstrapping to calculate the target distribution more efficiently in the Gibbs sampling step. Because the problem of learning is only focused on the approximation of the negative phase or the model distribution, we only consider the computation of the negative phase distribution hvi hj imodel . Thus, in order to approximate the model distribution more efficiently, we use the previous negative samples as well as the current negative sample by accumulating these samples. Since the computational burden is increased when the number of iterations is increased, we only use the m previous adjacent samples in the proposed method. If the number of iterations t is lower than m (t ≤ m) in the early stage of the learning, we only use t samples. Furthermore, in order to remove noisy samples from the accumulated samples, we select l samples having lower errors in the m collected samples based on the reconstruction error between the current positive phase sample and each collected sample in the negative phase. The overall procedure of the proposed learning method is described in Algorithm 1. Line 6-7 represents the positive phase and line 8-14 represents the negative phase. Gradient and weight update phase is shown in line 15-16. The difference between the proposed method and CD is that we consider the previous collected samples which have less noise than other previous samples to better represent the target distribution.
In this section, we first present a widely used prediction method, DBN-SVM [23], and then propose two prediction methods, DBN-ANN and DBN-R, using the deep architecture. DBN-SVM is a hybrid model which combines a DBN and a nonlinear support vector machine (SVM). The input data is connected to the visible layer of a DBN, and the uppermost hidden layer is connected to the input of a SVM as shown in Figure 4(a). A radial basis function is used as a kernel for the SVM. In the training phase, the DBN is trained first in an unsupervised manner using Algorithm 1. Then the uppermost hidden layer acquired from input data and output data is used to train the SVM. DBN-ANN is a similar hybrid model, but, in this case, an artificial neural network (ANN) is used instead of a SVM as shown in Figure 4(b). The backpropagation algorithm minimizing the mean square error (MSE) using the scaled conjugate gradient (SCG) method [24] is used to train the ANN. The number of hidden layers can be freely selected and a three-layer ANN is used in this paper1 . DBN-R is a new formulation of the deep learning architecture for prediction. The DBN-R model is inspired by the ability of reconstructing missing data in an RBM as shown in Figure 3. Figure 4(c) shows the structure of DBN-R. In the training phase, we concatenate both input xi ∈ Rd and output yi ∈ Rq to construct the data D = {(xi , yi ), i = 1, · · · , n}. The concatenated data D is used to train the DBN using Algorithm 1. In test phase, when a new input x? ∈ Rq is given, we fill x? into the input part vI ∈ Rd of visible layer 1 Note that, while an ANN can have multi-dimensional output, a SVM can only have one dimensional output. For this reason, when we want to predict a n-dimensional output, we have to use n different SVMs.
(a) DBN-SVM Fig. 4.
(b) DBN-ANN
(c) DBN-Reconstruct
The three deep architectures, DBN-SVM [23], DBN-ANN, and DBN-R, for human behavior prediction from left to right.
v ∈ Rd+q and some constant α into the output part vO ∈ Rq , where α was set to the ratio of the number of activations to the number of total incidences (activation + deactivation). With this concatenated v = [vI T vO T ]T ∈ Rd+q , we can reconstruct the visible layer by propagating up and down the hierarchy of the trained DBN using (2) and (3) as shown in 0 Figure 5. Finally, we use the output part vO ∈ Rq of the 0 d+q reconstructed visible layer v ∈ R as a predicted output y? ∈ Rq . The overall procedure is summarized in Algorithm 22 . Furthermore, DBN-R can be interpreted as a prediction based on intention learning. The uppermost representation h2 of a given input x? can be interpreted as a predicted intention. The reconstruction of the visible layer v0 can be interpreted as making a prediction based on the predicted intention h2 . Algorithm 2 Deep belief network using DBN-R Given N pairs of input xi ∈ Rd and output yi ∈ Rq , and the structure of DBN. Train phase 1. Concatenate N pair of input and output, i.e., D = {(xTi , yiT )T |i = 1, · · · , N } ∈ Rd+q . 2. Train the given DBN with D using Algorithm 1. Test phase 1. New input x? ∈ Rd is given. 2. Fill the input part vI ∈ Rd by x? and output part vO ∈ Rq of v by α, and concatenate then into v, i.e., v = [vI T vO T ]T = [xT? α × 1T ]T , where 1 ∈ Rq is a vector of which elements are all 1. 3. Reconstruct the visible layer v0 by propagating v up and down the hierarchy using (2) and (3). 0 ∈ Rq of reconstructed visible 4. Use output part vO v0 ∈ Rd+q as predicted output y? ∈ Rq . IV. E XPERIMENTAL R ESULTS In this section, we provide experimental results for validating the performance of the proposed learning method and 2 Note that unlike DBN-ANN and DBN-SVM, DBN-R does not need an additional layer to perform supervised learning task. Moreover, by using not only the feed-forward process but also the feed-backward process, it can fully utilize the trained DBN structure.
Fig. 5. DBN-R in the test phase. The output part of reconstructed visible layer vO ∈ Rq is the predicted output.
prediction algorithms from Section III. In Section IV-A, we evaluated the performane of our proposed learning algorithm compared to other conventional learning algorithms for a DBN using the UCI MLR dataset [20]. In Section IV-B, our proposed prediction algorithms, DBN-SVM, DBN-ANN and DBN-R, are applied to the MIT home dataset [2] (see Figure 6).
A. Classifying labels using the UCI dataset We have applied our proposed method in Algorithm 1 and compared to other DBN learning methods on the PimaIndians-Diabetes in UCI dataset [20] to verify the competitiveness of the proposed learning algorithm. We have performed a 10-fold cross validation and the result for each algorithm is the average and its standard deviation of 10 independent runs. In the experiment, the three-nearest neighborhood (3-NN) method is used as a classifier because of its simplicity and weights were initialized randomly using samples from the Gaussian distribution with zero mean and standard deviation of 0.01. In addition, the learning rate η was set to 0.01. Table I shows the average results of the proposed method and the other basic neural network learning methods. In full-batch learning, weights are updated over the entire training data. On-line learning updates weights using one training instance at a time and mini-batch learning updates weights over some number u (u < n) of instances [25]. As shown in Table I, the proposed method shows the highest classification rate compared to other training methods.
Entire (4609) Sensor [1] Data Toilet Flush Light switch Burner Coffee machine Drawer Refrigerator Oven Door Toaster Cabinet Window Freezer Jewelry box Washing Machine Microwave Cereal DVD Medicine cabinet Containers Lamp Sink faucet − hot Dishwasher Closet Sink faucet − cold Laundry Dryer Shower faucet Exhaust Fan Garbage disposal 500
1000
1500
2000
2500
3000
3500
4000
4500
(a) MIT home dataset 1 Entire (4609) Sensor [2] Data Sink faucet − hot TV Light switch Cabinet Toaster Toilet Flush Drawer Microwave Burner Sink faucet − cold Stereo Containers Medicine cabinet Shower faucet Door Refrigerator Telephone Freezer Hamper Garbage disposal 500
1000
1500
2000
2500
3000
3500
4000
4500
(b) MIT home dataset 2 Fig. 6. MIT home dataset 1 and 2 [2]. The x-axis indicates temporal sequence with 5 minutes period, and the y-axis indicates the types of sensors used in the dataset. White and black indicates activations and deactivations of sensors, respectively. TABLE I T HE AVERAGE CLASSIFICATION RESULTS USING P IMA -I NDIANS -D IABETES DATA [20] Pima-Indians-Diabetes dataset Method
Classification rate (%)
The proposed method
74.21
Online learning
72.67
Mini-batch learning
72.89
Full-batch learning
72.86
B. Predicting human behavior using the MIT home dataset We used the MIT home dataset [2] for validating the performance of our proposed deep architectures. The MIT home dataset consists of two independent datasets collected from two single-person apartments for two weeks using “tape-andforget” data collection boards. There were 77 sensors in the first apartment and 84 sensors in the second apartment. The sensors were installed in everyday objects, such as drawers, refrigerators, and light switches, as shown in Figure 1. We have preprocessed the dataset to make it suitable for
prediction. We first represent the whole chronological data by a unit period (T ), i.e., if a sensor is activated in a certain unit period, the value for the sensor is 1, otherwise, it is 0. The preprocessed dataset 1 and 2 are shown in Figure 6. The prediction is carried out using a sliding window of size W . In this experiment, we set W to be 9 and T to be 5 minutes. To sum up, the prediction about which sensors will be activated in the next 5 minutes is based on sensory data from previous 45 minutes. We used five different algorithms, k-means, a nonlinear SVM, DBN-ANN, DBN-SVM, and DBN-R, for making predictions. For implementing a nonlinear SVM, LIBSVM package [26] with a RBF kernel was used. In all proposed algorithms, we used three-layer DBN, i.e., one visible layer and two hidden layers. The number of nodes in the first hidden layer is 200 and 100 nodes are used for the second hidden layer. The artificial neural network in DBN-ANN is based on a three-layer ANN with 100 hidden nodes. As shown in the left column of Figure 8, the overall prediction accuracy is usually very high, i.e., above 90%. However, we cannot fully evaluate the prediction performance for two reasons. The overall accuracy includes both activation and deactivation of sensors. However, once a sensor is active (inactive), it will be active (inactive) for a long period of time (see Figure 7). Hence, an algorithm can report a high accuracy value while it makes poor predictions about when a sensor will be activated or deactivated. The second reason is that many sensors are not active for the majority of time, hence, the prediction about deactivation has a little value. Hence, it is more crucial to predict which sensor will be newly activated. We propose a new metric, named a rising edge accuracy (REA), for measuring this prediction quality and it is defined as REA =
# of correctly predicted newly activated sensor . (10) # of newly activated sensor
As shown in Figure 8, the proposed three deep learningbased methods show higher accuracy rates than the baseline method, K-means. Even though these methods showed slightly lower accuracy than the nonlinear SVM, they outperformed the nonlinear SVM in the newly activated sensor experiment as shown in the right columns of Figure 8. This can be explained by the intrinsic limitation of an SVM. While a nonlinear SVM is one of the most widely used classifiers, in recent work regarding analysis of kernel machines suggests some fundamental limitations of the kernel method in that it can only use local information with smoothing priors [19]. However, deep architectures can represent the global structure of a highly nonlinear and complex function [27]. In [5], Aipperspach et al. used the n-gram algorithm for prediction human behavior using the MIT home dataset. Since they only stack the index of newly activated sensors and make a prediction based on this stream, their approach is similar to our second criteria, REA, given in (10). They have demonstrated a REA of 39% for the MIT home dataset 1 and 43% for the MIT home dataset 2. In comparison, the proposed method DBN-R shows better performance with an
Fig. 8. Experimental results on the MIT home dataset. First and second rows shows accuracies on MIT home dataset 1 and 2, respectively. First and second columns indicate overall accuracy and REA, respectively.
REA of 43.9% for dataset 1 and 51.89% for dataset 2. Note that the approach in [5] cannot incorporate simultaneous activations of sensors as well as the temporal characteristic such as the duration of activation or when the sensor will be activated. V. C ONCLUSION AND F UTURE W ORK In this paper, we have proposed two prediction algorithms, DBN-ANN, and DBN-R, and presented a widely used prediction algorithm, DBN-SVM, for predicting human behavior. We also proposed an efficient online learning algorithm for a RBM using bootstrapping. Based on the experimental results on the MIT home dataset, the proposed algorithm outperforms existing classification algorithms, such as SVMs, for predicting when a sensor will be turned on (or when a new activity of a smart home occupant will start). In particular, DBN-R has achieved the best performance. In the experimental setup, we used deep architectures concatenated with multiple layers of restricted Boltzmann machines (RBM) to handle binary sensory data for predicting
human behaviors. However, in order to extend the proposed predictiion algorithm to handle more general case, it is integral to utilize real-valued sensory data. Gaussian-Bernoulli restricted Boltzmann machine (GB-RBM) can be used for this purpose [28]. We plan to extend GB-RBM to more general human behavior prediction problems. VI. ACKNOWLEGDMENT This research was supported by Basic Science Research Program through the National Research Foundation of Korea (NRF) funded by the Ministry of Education, Science and Technology (No. 2010-0027155). R EFERENCES [1] P. Uhlenberg, International handbook of population aging. Springer, 2009, vol. 1. [2] E. M. Tapia, S. S. Intille, and K. Larson, “Activity recognition in the home using simple and ubiquitous sensors,” Pervasive Computing, vol. 3001, pp. 158–175, 2004. [3] E. D. Mynatt, I. Essa, and W. Rogers, “Increasing the opportunities for aging in place,” in Proc. of the ACM Conference on Universal Usability.
[11]
[12] [13]
[14]
[15]
[16] [17]
[18] Fig. 7. An example of sensory data stream from MIT home dataset 2. White box indicates activation whereas black box indicates deactivation. X axis indicates minutes and y axis indicates the type of sensors. In this example, while TV, light switch and cabinet are continuously activated for 50 minutes, a sensor attached to door is newly activated.
[19]
[20] [21]
[4] N. Le Roux and Y. Bengio, “Deep belief networks are compact universal approximators,” Neural Computation, vol. 22, no. 8, pp. 2192–2207, 2010. [5] R. Aipperspach, E. Cohen, and J. Canny, “Modeling human behavior from simple sensors in the home,” Pervasive Computing, pp. 337–348, 2006. [6] M. Mozer, “Lessons from an adaptive house,” Ph.D. dissertation, University of Colorado, 2004. [7] Y.-J. Lin, H. A. Latchman, M. Lee, and S. Katar, “A power line communication network infrastructure for the smart home,” Wireless Communications, vol. 9, no. 6, pp. 104–111, 2002. [8] T. Shon and Y. Park, “Implementation of RF4CE-based wireless auto configuration architecture for ubiquitous smart home,” in Proc. of the IEEE International Conference on Complex, Intelligent and Software Intensive Systems, 2010, pp. 779–783. [9] K. Park, E. Becker, J. K. Vinjumur, Z. Le, and F. Makedon, “Human behavioral detection and data cleaning in assisted living environment using wireless sensor networks,” in Proc. of the ACM 2nd International Conference on Pervasive Technologies Related to Assistive Environments, 2009, pp. 7:1–7:8. [10] N. Kubota and K. Nishida, “Prediction of human behavior patterns
[22]
[23]
[24] [25]
[26]
[27]
[28]
based on spiking neurons for a partner robot,” in Proc. of the 15th IEEE International Symposium on Robot and Human Interactive Communication, 2006, pp. 692–697. S.-J. Blakemore and J. Decety, “From the perception of action to the understanding of intention,” Nature Reviews Neuroscience, vol. 2, no. 8, pp. 561–567, 2001. Y. Bengio, “Learning deep architectures for AI,” Foundations and R in Machine Learning, vol. 2, no. 1, pp. 1–127, 2009. Trends H. Larochelle and Y. Bengio, “Classification using discriminative restricted Boltzmann machines,” in Proc. of the 25th International Conference on Machine Learning, 2008, pp. 536–543. G. E. Hinton and R. R. Salakhutdinov, “Reducing the dimensionality of data with neural networks,” Science, vol. 313, no. 5786, pp. 504– 507, 2006. Y. MarcAurelio Ranzato, L. Boureau, and Y. LeCun, “Sparse feature learning for deep belief networks,” in Advances in Neural Information Processing Systems, vol. 20, 2007, pp. 1185–1192. G. E. Hinton, “Training products of experts by minimizing contrastive divergence,” Neural Computation, vol. 14, pp. 1771–1800, 2002. K. Cho, T. Raiko, and A. Ilin, “Parallel tempering is efficient for learning restricted Boltzmann machines,” in Proc. of the International Joint Conference on Neural Networks, 2010, pp. 3246–3253. R. Salakhutdinov, “Learning deep Boltzmann machines using adaptive mcmc,” in Proc. of the International Conference on Machine Learning, vol. 27, 2010. Y. Bengio, O. Delalleau, and N. Le Roux, “The curse of highly variable functions for local kernel machines,” in Advances in Neural Information Processing Systems, vol. 18. MIT; 1998, 2006, pp. 107– 114. A. Frank and A. Asuncion, “UCI machine learning repository.” [Online]. Available: http://archive.ics.uci.edu/ml L. Yann and C. Corinna. MNIST database of hand written digits. [Online]. Available: http://yann.lecun.com/exdb/mnist/ M. A. Carreira-Perpinan and G. E. Hinton, “On contrastive divergence learning,” in Proc. of the Artificial Intelligence and Statistics, 2005, pp. 33–40. P. Hamel and D. Eck, “Learning features from music audio with deep belief networks,” in 11th International Society for Music Information Retrieval Conference, 2010, pp. 339–344. M. F. Møller, “A scaled conjugate gradient algorithm for fast supervised learning,” Neural Networks, vol. 6, no. 4, pp. 525–533, 1993. D. R. Wilson and T. R. Martinesz, “The general inefficiency of batch training for gradient descent learning,” Neural Networks, vol. 16, pp. 1429–1451, 2003. C.-C. Chang and C.-J. Lin, “LIBSVM: A library for support vector machines,” ACM Transactions on Intelligent Systems and Technology, vol. 2, pp. 27:1–27:27, 2011. Y. Bengio, P. Lamblin, D. Popovici, and H. Larochelle, “Greedy layerwise training of deep networks,” in Advances in Neural Information Processing Systems, vol. 19. MIT; 1998, 2007, pp. 153–160. K. Cho, T. Raiko, and A. Ilin, “Gaussian-bernoulli deep boltzmann machine,” in Advances in Neural Information Processing Systems, 2011.