Asian Journal of Chemistry
Vol. 19, No. 6 (2007), 4183-4187
High Performance Thin Layer Chromatographic Estimation of Atenolol and Indapamide from Pharmaceutical Dosage Form K.R. GUPTA*, S.B. WANKHEDE†, M.R. TAJNE† and S.G. WADODKAR Department of Pharmaceutical Sciences, S.K.B. College of Pharmacy, Near Dragon Palace Temple, Behind Railway Station, New Kamptee, Nagpur-441 002, India E-mail:
[email protected] Atenolol and indapamide in combination is available as tablet dosage forms in the ratio of 20:1. HPTLC method was developed for analysis of above formulation. Atenolol and indapamide were seperated on the plate coated with silica gel 60G F254 using a mixture of toluene:ethanol:acetone:acetic acid (7:2.5:3:0.3 v/v) as mobile phase. Quantification was carried out by the use of densitometer in absorbance mode at 266 nm. The Rf value of atenolol and indapamide was found to be 0.21 and 0.74, respectively. The per cent recovery was found to be 99.42/100.51 and 99.07/98.65 % for atenolol and indapamide by height by area, respectively. The proposed method was quantitatively evaluated in terms of calibration of concentration range, stability and accuracy. It can be adopted for routine analysis of the formulation. Key Words: HPTLC estimation, Atenolol, Indapamide.
INTRODUCTION Atenolol1 is chemically (RS)-4-(2-hydroxy-3-isopropylaminopropoxy)phenylacetamide. A survey of literature reveals that atenolol is estimated by spectrophotometry2-4, HPLC5-7, colorimetric8, spectrfluoro-metry9 alone or in combination with other drugs. Similarly, indapamide10 is chemically (RS)-4-chloro-3-sulphamoyl-N-(2-methyl-2,3-dihydro-1H-indol-1yl)benzamide. A survey of literature reveals that indapamide is estimated by spectrophotometry11 and HPLC12-15 methods. No methods are reported for estimation of these drugs in combination hence we proposed the HPTLC method for the simultaneous determination of both the drugs in tablet dosage form, the method is simple, precise and rapid too. †Department of Pharmaceutical Sciences, R.S.T.M. Nagpur University, Nagpur-441 002, India.
4184 Gupta et al.
Asian J. Chem.
EXPERIMENTAL Atenolol (ATN) working standard was a gift sample from Zim Laboratories Ltd. and indapamide (IND) from Emcure Pharma. Silica gel 60G F254 TLC plates (10 × 10 cm, Merck) were used as stationary phase. Tablets were purchased from local market. Ethanol, toluene, acetone and acetic acid of GR grade (E. Merck) purity were purchased from local supplier. A CAMAG HPTLC system (Switzerland) comprising of CAMAG Linomat IV semiautomatic sample applicator, CAMAG TLC scanner 3, CAMAG twin trough chamber (10 × 10 cm), CAMAG CATS 4 software, Hamilton syringe (100 µL) were used during the study. The chromatographic estimation was performed under the following conditions, stationary phase used was aluminium foiled plates precoated with silica gel 60 F254 (10 × 10 cm). Spotting parameters used were, 4 mm bandwidth, 4 mm space between two bands and a spraying rate of 6 s/µL. Mobile phase used was toluene:ethanol:acetone:ammonia in the ratio of (7:2.5:3:0.3 (v/v). The chamber saturation time employed was 10 min and the plates were developed using ascending technique to a distance of 7 cm. Scanning wavelength of 266 nm with a slit dimension of 3.0 × 0.45 mm. Linearity of detector response: Aliquots of mix working standard of ATN-IND were spotted as sharp bands on the precoated TLC plate, using Camag linomat IV semiautomatic applicator under nitrogen stream. The plate was developed under chromatographic conditions described above. The plate was removed from the chamber and dried using in hot air dryer. Densitometric measurements were performed at 266 nm in absorbance mode. Data peak height and peak area of each band was recorded. The calibration curve was prepared by plotting peak height and peak vs. concentration corresponding to each spot in range of 3.8-10.9 and 0.2-0.6 µg for atenolol and indapamide, respectively. Assay Preparation of standard solution: Stock solution A: An accurately weighed quantity of atenolol (ATN ca. 25 mg) was transferred in to a 25.0 mL volumetric flask. It was dissolved and diluted up to the mark with methanol to give a standard stock solution of 1 mg/mL. Stock solution B: An accurately weighed quantity of indapamide (IND ca. 25 mg) was transferred in to a 25.0 mL volumetric flask. It was dissolved and diluted up to the mark with methanol to give a standard stock solution of 1 mg/mL. Stock solution: From stock solution A 20.0 mL of ATN and 1.0 mL from stock solution B of IND was pipetted out in 25.0 mL volumetric flask and diluted to 25.0 mL with methanol.
Vol. 19, No. 6 (2007)
HPTLC Estimation of Atenolol and Indapamide 4185
Preparation of sample solution
AU
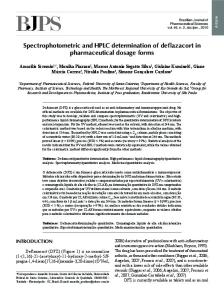
20 Tablets were accurately weighed, crushed to fine powder and average weight was calculated. Accurately weighed quantity of tablet powder equivalent 40 mg of atenolol was weighed and transferred in 25 mL volumetric flask. To it 15 mL of methanol was added and shaken for 10 min and volume was adjusted upto mark with methanol and then filtered. On HPTLC plates, two spots of standard and six spots of the sample solution of equal volumes from each sample solution were applied. The plates were developed and scanned as described under calibration curve. Typical densitogram comparing standard and sample are shown in Fig. 1.
Rf Fig. 1. Densitogram of atenolol (Atn) and indapamide (Ind) from marketed formulation
RESULTS AND DISCUSSION Accuracy: Accuracy of the proposed method was ascertained on the basis of recovery studies performed by the standard addition method. To a fixed amount of the pre analyzed sample, the standard drugs were added at four levels 5, 10, 15 and 20 mg of ATN and 0.25, 0.5, 0.75 and 1.0 mg of IND, respectively. The total amount of drug was determined by above proposed method and the amount of pure drug recovered was calculated and are shown in Table-1. The following formula was used for calculating recovery of pure drug: % Recovery =
T−A × 100 S
4186 Gupta et al.
Asian J. Chem.
where, T = total amount of drug estimated, A = Amount contributed by tablet powder (as per amount estimated by proposed method), S = amount of pure drug added. Precision: Precision of analytical method is expressed as SD or RSD of series of measurement by replicate estimation of the drugs by proposed method (Table-1). TABLE-1 RESULTS FOR ESTIMATIONS % of labeled claim* Recovery* (%) Sample code Atenolol Indapamide Atenolol Indapamide Height Area Height Area Height Area Height Area Standard Mean 99.290 100.160 99.73 99.770 – – – – lab. mixture ± SD 0.211 0.267 0.15 0.474 – – – – Marketed Mean 99.560 100.100 100.06 100.080 99.420 100.510 99.070 98.650 formulation ± SD 0.735 0.540 0.80 1.357 0.962 1.454 0.375 1.772 *Each value is a mean of six observations.
Ruggedness: Studies were carried out for two different parameters i.e. days and analysts. The results of estimation by proposed method are nearly similar under variety of conditions (Table-2). TABLE-2 SUMMARY OF RUGGEDNESS % of labeled claimed* Atenolol Indapamide Height Area Height Area Days Mean 99.390 99.220 99.480 98.410 (n = 3) RSD (%) 0.811 1.641 2.145 1.690 Analysts Mean 99.220 97.250 99.670 99.640 (n = 3) RSD (%) 0.706 1.985 1.845 1.724 *Each value is a mean of six observations. Parameters
Stability indicating ability: The stability indicating ability of the proposed method was investigated by deliberately degrading the sample preparation. The stress conditions applied were acidic (1 M HCl), alkaline (1 M NaOH) and mild oxidizing condition (3 % H2O2) for 24 h at 50ºC. Also, heat (60ºC) and UV-exposure for 24 h was studied. The assay values for ATN and IND when calculated considering peak height and area in all five conditions was found to be different (Table-3).
Vol. 19, No. 6 (2007)
HPTLC Estimation of Atenolol and Indapamide 4187
TABLE-3 RESULTS OF SPECIFICITY STUDY Sample (treated) Acid Alkali Oxide Heat (60ºC) UV-expsoure
% of labeled claim Atenolol Indapamide Height Area Height Area 107.68 103.28 – – 74.40 75.00 – – 70.12 77.40 48.72 54.71 107.28 104.08 96.93 101.87 136.20 134.80 119.14 120.80
ACKNOWLEDGEMENTS The authors are thankful to Head, Department of Pharmaceutical Sciences, Nagpur University, Nagpur for providing facilities and M/s Zim Laboratories Ltd and Emcure Pharma for providing the gift sample of drug. REFERENCES 1. 2. 3. 4. 5. 6. 7. 8. 9. 10. 11. 12. 13. 14. 15.
British Pharmacopeia, H.M. Stationary Office, London Vol. 1, p. 105 (2001). S.M. Al-Ghannam and F. Belal, J. AOAC Int., 85, 817 (2002). S. Singh and R. Jain, Indian Drugs, 34, 678 (1997). M.S. Bhatia, S.G. Kashkedikar and S.C. Chaturvedi, Indian Drugs, 34, 576 (1997). S.A. Shah, I.S. Rathod, C.J. Shishoo, S.S. Salve, M.C. Satia and K.M. Bhat, Indian J. Pharm. Sci., 62, 187 (2000). M.C.F. Ferraro, P.M. Castellano and T.S. Kaufman, IL Farmaco, 58, 307 (2003). C. Giachetti, A. Tenconi, S. Canali and G. Zanolo, J. Chromatogr. Biomed. Sci. Appl., 698B, 187 (1997). K. Basavaiah, U. Chandrashekar and P. Nagegowda, Indian J. Chem. Technol., 11, 777 (2004). H. Abdine, M.A. Sultan, M.M. Hefnawy and F. Belal, Pharmazie, 60, 265 (2005). British Pharmacopeia, H.M. Stationary Office, London, Vol. 1, p. 760 (2001). Y.K. Agarwal and F.D. Majumdar, Anal. Lett., 28, 1619 (1995). T. Ozden, Z.H. Turker and A.V. Tosun, Pharm. Pharmacol. Commun., 4, 397 (1998). M.J. Legorburu, R.M. Alonso, R.M. Jimenez and E. Ortiz, J. Chromatogr. Sci., 37, 283 (1999). D. Chen, K. You, R. Fu, X. Yan and Q. Fang, Zhonguo Yixue Kexueyuan Xuebao, 12, 286 (1990). M.V. Padaval and H.N. Bhargava, J. Pharm. Biomed. Anal., 11, 1033 (1993).
(Received: 16 January 2006;
Accepted: 28 March 2007)
AJC-5539