Hepatitis C Virus Infection in Injection Drug Users Judith Tsui, MD MPH May 4, 2012 FIT 2012
Topics to Cover • • • • •
HCV epidemiology (focus on IDU) HCV natural history HCV screening and treatment (focus on IDU) Barriers to HCV care in IDU Models of care delivery that integrate HCV and substance use treatment • Directions for future research FIT 2012
Historical Background: Hepatitis C Virus (HCV) • RNA virus, 6 major genotypes
• “non-A, non-B hepatitis” • First identified 1988 • Screening in blood products 1992
• No vaccine currently available FIT 2012
Prevalence of HCV in the US • Based on population based survey (NHANES), anti-HCV prevalence in the U.S. is 1.6% – 4.1 million (CI, 3.4 million to 4.9 million) anti-HCV–positive persons nationwide
• Prevalence with chronic infection (viral load +) is 1.3% – 3.2 million (CI, 2.7 million to 3.9 million) with chronic HCV
• Strongest risk factor for HCV is injection drug use – OR for IDU=149 (95% CI: 45-494) v. transfusion prior to 1992 OR=2.6 (95% CI: 0.9-7.3) – 48.4% of anti-HCV–positive persons reported a history of IDU – Among those reporting IDU, 83.3% had not used injection drugs for at least 1 year before the survey. FIT 2012 Armstrong, Wasley, Simard, et al. Ann Intern Med. 2006;144:705-714.
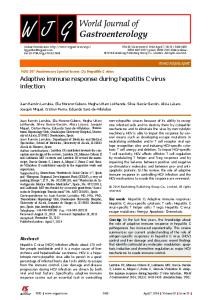
Prevalence of HCV among IDU in the U.S. • Prevalence of anti-HCV among IDU in U.S. studies range 40-90%1-2 • Prevalence estimate in US/Canada: 73% (LL-UL: 70-77)3 – HIV prevalence in IDU ~15%4
• 1.5 million HCV-infected IDU in US (v. 10 million infected world-wide)3 1
Hagan, Pouget, Williams, et al. J Infect Dis. 2010;201:378-385. Hahn, Evans, et al. J Infect Dis. 2009;200:1216-1226. FIT 2012 3 Nelson, Mathers, Cowie, et al. Lancet. 2001;378:571-583. 4 Mathers, Degenhardt, Phillips, et al. Lancet. 2008;372:1733-1745. 2 Page,
Global HCV Prevalence Among IDUs 51% 73% 67%
11%
73%
41% 40% 64% 55%
FIT 2012 Nelson, Mathers, Cowie, et al. Lancet. 2001;378:571-583.
New Infections/100,000
Incidence of Acute HCV Infection United States, 1960-2001
140 120 Decline in injection 100 drug users 80 60 Decline in 40 transfusion recipients 20 0 1960 1965 1970 1975 1980 1985 1989 1992 1995 1998 2001 Year
Armstrong, Alter, McQuillan, Margolis. Hepatology. 2000;31:777-82. Alter. Hepatology. 1997;26:62S-65S. FIT 2012 CDC: unpublished data
HCV Incidence Among IDU in the U.S. • Incidence of HCV ~10-30 cases/100 personyears1-2 • HCV incidence also declining in IDU, but not as dramatic as HIV3 • Proportion of cases reporting IDU has increased4 – 31.8% cases 1982-1989 – 33.5% cases 1990-1993 – 45.6% cases 1994-2006
• IDU are the “core” of the HCV epidemic 1 2 3
4
Hagan, Pouget, Williams, et al. J Infect Dis. 2010;201:378-385. Page, Hahn, Evans, et al. J Infect Dis. 2009;200:1216-1226. FIT 2012 Mehta, Astemborski, Kirk, et al. J Infect Dis. 2011;203:587-9. Williams, Bell, Kuhnert, Alter. Arch Intern Med. 2011;171:242-248.
HCV Incidence in the U.S. Among IDU
FIT 2012 Mehta, Astemborski, Kirk, et al. J Infect Dis. 2011;203:587-589.
Risk Factors for HCV in IDU • Age • Duration of IDU – Narrow window for intervention: 20-50% infected within first 2 years of IDU1,2
• Severity of IDU • Risky IDU behaviors
1
Hagan, Pouget, Williams, et al. J Infect Dis. 2010;201:378-385. FIT 2012 Garfein, Ahdieh-Grant, et al. Clin Infect Dis. 2008;46:1852-1858.
2 Amon,
Factors that Facilitate HCV Transmission in IDU • High concentration of virus in blood of chronic carriers • High prevalence of disease in IDU • Stability of virus in the environment – Persists as dried sample up to 1 week1 – Persists up to 60 days in syringes2 • Sharing of injecting equipment – Swabs, cookers, syringes, filters, water3
1
Doerrbecker, Friesland, Ciesek, et al. J Infect Dis. 2011;232:51-62. Paintsil, He, Peters, et al. J Infect Dis. 2010;202:984-90. FIT 2012 3 Pouget, Hagan, Des Jarlais, et al. Addiction. In press. 2
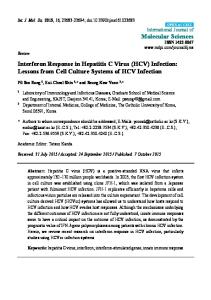
Percentage of Hepatitis C Virus RNA Detection on Used Injecting Equipment
Percent of positive detection
Percentage of hepatitis c virus RNA detection on collected used injecting equipment 90% 80% 70% 60% 50% 40% 30% 20% 10% 0%
80% 83%
50% 33%31%
0% Compresses (n=110)
Cups (n=110)
0%
0%
0%
Water (n=70) Filters (n=10)
FIT 2012 Thibault, Bara, Nefau, Dupleesy-Garson. J Infect Dis. 2011;204:1839-1842.
Syringes (n=320)
Study 1 Study 2
Interventions to Prevent HCV Transmission in IDU • Meta-analysis of behavioral and treatment interventions, including opioid agonist treatment (OAT) and needle and syringe programs (NSP)1 – 26 studies pooled – Combined interventions reduced risk of seroconversion by 75% (RR 0.25; 95% CI: 0.07-0.83)
• Meta-analysis of 6 UK studies of OAT and NSP2 – Full harm reduction (OAT plus NSP) reduced odds of seroconversion by 79% (OR=0.21; 95% CI: 0.08-0.52)
• Data suggest that combined OAT and NSP programs are effective in decreasing HCV transmission in IDU Pouget, Des Jarlais. J Infect Dis. 2011;204:74-83.FIT 2012 2 Turner, Hutchinson, Vickerman, et al. Addiction. 2011;106:1978-1988. 1 Hagan,
HCV Natural History: Hepatic Complications • Chronic hepatitis – Occurs in approximately 80% of patients infected
• Cirrhosis – 5-25% develop cirrhosis over 20-30 years
• Hepatocellular Cancer – 1-3% of cirrhotic patients develop HCCa per year – Rarely occurs outside the setting of cirrhosis
FIT 2012 Ghany, Strader, Thomas, Seeff, AASLD/IDSA/ACG. Hepatology. 2009;49:1335-1374.
HCV Natural History: Hepatic Fibrosis
Fibrosis Stage
4
Rapid Progression Intermediate Progression
3
2 Slow Progression
1
0 0
10
20
30
40
50
Years Poynard, Bedossa, Opolon. Lancet. 1997;349:825-832. FIT 2012 Slide Adapted from Roche Presentation: “Understanding Hepatitis C and Its Treatment”
Factors Associated with Progressive Fibrosis – – – – – – –
Alcohol Duration of infection Older age at infection Male Co-infection with HBV or HIV Being overweight/liver steatosis smoking FIT 2012
Bialek, Terrault. Clin Liver Dis. 2006;10:697-715.
HCV Morbidity and Mortality • Chronic liver disease is 12th leading cause of death in U.S. in 20091 – approx 1/2 is HCV-related
• Incidence of HCCA has tripled in the past 2 decades, primarily from HCV2 • HCV is the #1 cause for liver transplants in the US3 • HCV-related mortality projected to increase 2000-204 1
CDC MMWR Rep. 1998;47(RR-19):1-39. El-Serag. New Eng J Med. 2011;365:1118-11127. FIT 2012 3 Berg, Steffick, Edwards, et al. Am J Transplant. 2009;9:907-931. 4 Wong, McQuillan, McHutchison, et al. Am J Public Health. 2000;90:1562-1569. 2
HCV Mortality: 1999-2007
FIT 2012 Ly, Xing, Klevens, et al. Ann of Int Med. 2012;156:271-8.
HCV Mortality • Increased mortality observed for liver and non-liver causes – Study of 20,000+ blood donors, ½ HCV+ and ½ matched HCV– Vital status from U.S. NDI, mean follow-up 7 years – Hazards ratios (HR) for death associated with HCV: • Liver: HR=45.99 (95% CI: 11.32-186.74) • CV: HR=2.21 (1.41-3.46) FIT 2012 Guiltinan, Kaidarova, Custer, et al. Am J of Epidem. 2008;167:743-750.
HCV Mortality • Increased mortality observed for liver and non-liver causes – Study NHANES participants with linked mortality file (n=9378), median follow-up 14.8 years – Adjusted mortality rate ratio for HCV+ v. HCV• Liver: RR=26.46 (95% CI: 8.00-87.48) • All-cause: RR=2.37 (1.28-4.38)
FIT 2012 El-Kamary, Jhaveri, Shardell. Clin Infec Dis. 2011;53:150-158.
Non-Hepatic Complications of HCV
FIT 2012 Ali, Zein. Cleve Clin J Med. 2005;72:1005-1019.
HCV Mortality in IDU • Research suggests HCV is becoming a major cause of mortality in IDU – Cohort study of 2654 patients entering methadone treatment in Australia 1980-5 – Linked to NDI death data up to 2008 – Liver-related deaths increased over time, was most common cause last year of follow-up • 1/5 deaths (17%) from liver causes, hepatitis • Rate of death 17 from liver causes 17 x higher than general population FIT 2012 Gibson, Randall, Degenhardt. Addiction. 2011;106:2186-2192.
HCV Mortality in IDU
FIT 2012 Gibson, Randall, Degenhardt. Addiction. 2011;106:2186-2192.
The Evolution of HCV Therapy Overall SVR* (%)
1998
2001- 2011
201170%6,7
54%-63%3-5
38%1,2 19%2 6%1
IFN
IFN
IFN + RBV
PEG IFN + RBV
PEG IFN + RBV + PI
24 Wks
48 Wks
48 Wks
48 Wks
24-48 Wks Genotype 1 Only
*SVR rates for all genotypes combined. 1 McHutchison,
Gordon, Schiff, et al. N Engl J Med. 1998;339:1485-1492. Marcellin, Lee, et al. Lancet. 1998;352:1426-1432. 3 Manns, McHutchison, Gordon, et al. Lancet. 2001;358:958-965. 4 Fried, Shiffman, Reddy, et al. N Engl J Med. 2002;347:975-982. 5 Hadziyannis, Sette, Morgna, et al. Ann Intern Med. 2004;14:346-355. 6 Poordad, McCone, Bacon, et al. N Engl J Med. 2011;364:1195-1206. FIT 2012 7 Jacobson, McHutchison, Dusheiko, et al. N Engl J Med. 2011;364:2405-2416. Slide Adapted from Roche Presentation: “Understanding Hepatitis C and Its Treatment” 2 Poynard,
Benefits of SVR • Durable effect,