Psychophysiology, 40 (2003), 716–726. Blackwell Publishing Inc. Printed in the USA. Copyright r 2003 Society for Psychophysiological Research
Heart rate variability in acute psychosis
MINNA VALKONEN-KORHONEN,a MIKA P. TARVAINEN,b PERTTU RANTA-AHO,b PASI A. KARJALAINEN,b JUHANI PARTANEN,c JARI KARHU,c and JOHANNES LEHTONENa a
Department of Psychiatry, Kuopio University Hospital, Kuopio, Finland Department of Applied Physics, University of Kuopio, Kuopio, Finland Department of Clinical Neurophysiology, Kuopio University Hospital, Kuopio, Finland
b c
Abstract Heart rate variability (HRV) provides reliable tools to assess the integrity and reactivity of autonomic nervous function. Our aim was to examine HRV in the resting condition and during different mental loads in acute psychosis compared to healthy controls. HRV was measured in 17 first-episode drug-naive patients with psychosis and 21 healthy controls during oddball tasks and while performing the Wisconsin Card Sorting Test. A discrete event series was constructed by an adaptive QRS detector algorithm and power spectrum estimation was carried out. The RMSSD (representing interval differences of successive heartbeats) and the amount of high frequency (HF) power were significantly reduced in patients. Moreover, the patients’ HRV remained unaltered during the tasks, whereas in controls the HRV diminished with increasing mental load of the task. Patients with psychosis displayed less short-term HR reactivity than healthy controls. They also failed to adapt HRV according to the task-connected strain. Acute psychosis is characterized by a limited capacity to respond to external demands at the level of autonomic nervous system. Descriptors: Heart rate variability, Autonomic nervous system, Psychosis
Power spectral density (PSD) analysis of the intervals between consecutive R peaks (RR) provides a highly reproducible tool to assess the functional balance between parasympathetic and sympathetic domains of the autonomic nervous system activity. Spectral analysis can be used to decompose the total variation of a data series into its frequency components. The most commonly used techniques for the analysis include Fast Fourier transformation (FFT) and autoregressive modeling (AR) (Akselrod et al., 1981; Pagani et al., 1986). FFT integrates all data and is considered more descriptive, whereas the AR technique excludes noise, resulting in a more statistical approach. Despite these differences, the two methods usually achieve equivalent results (Berntson et al., 1997). Variations in high frequency (HF) HRV appear to provide a selective index of vagal control of the heart, whereas the low frequency (LF) variability is a product of both sympathetic and parasympathetic influences on the heart (Akselrod et al., 1981; Berntson et al., 1997; Cacioppo et al., 1994; Task Force of the European Society of Cardiology and the North American Society of Pacing and Electrophysiology, 1996). HF and LF derive from at least partly distinct, although overlapping mechanisms. In healthy young individuals at rest, the most conspicuous of the periodic components of HRV is respiratory frequency, considered to range from about 0.15 Hz to 0.4 Hz (Berntson et al., 1997). Respiratory sinus arrhythmia (RSA) may provide an index of vagal activity. Indeed, it has been suggested that RR interval oscillations at low frequencies, about 0.05–0.15 Hz, may
Heart rate variability (HRV) describes the variation between consecutive heartbeats, and is a reliable quantitative marker of autonomic nervous activity (Task Force of the European Society of Cardiology and the North American Society of Pacing and Electrophysiology, 1996). It can also be used as a tool for assessing the integrity of the autonomic nervous system, the interaction between psychological states and autonomic control, and the pathophysiology of diseases affecting autonomic function, because it reflects various phenomena including individual differences in adrenergic reactivity to daily stressors (for review, see Berntson et al., 1997). HRV varies as a function of age and genetic, dietary, task, metabolic, and social factors. Cardiac reactivity also predicts endocrine and immunologic responses to laboratory stressors (Cacioppo, Uchino, & Bertson, 1994). HRV quantification can be approached using global descriptive statistics to characterize the distribution of heart periods. Nevertheless, though these simple time domain measures are sensitive to the distribution characteristics of the data, they do not support quantitative assessment. Another potential means for quantifying HRV is to extract frequency components of variance related to functions or physiological processes. The authors wish to thank Ina M. Tarkka for her invaluable comments on the manuscript. This study was supported by the Academy of Finland and the Gyllenberg Foundation. Address reprint requests to: Department of Psychiatry, Kuopio University Hospital, P.O. Box 1777, FIN-70211 Kuopio, Finland. 716
717
Heart rate variability in acute psychosis reflect mainly sympathetic outflow (Malliani, Lombardi, Pagani, & Cerutti, 1994), though most researchers consider them to be of both sympathetic and vagal origin (Akselrod et al., 1981; Berntson et al., 1997). Very low frequencies and ultralow frequencies have been reported for circadian rhythms, changes in activity, posture, breathing, autonomic outflow, state of arousal, a range of behavioral variables, thermoregulatory cycles, and fluctuations in plasma renin activity (Akselrod et al., 1981; Berntson et al., 1997). The origins and mechanisms remain, however, unclear. In addition, the timing of dynamic and steady-state effects seem to differ between vagal and sympathetic control of HR: The parasympathetic nervous system is able to modulate HR at all frequencies between 0 and 0.5 Hz, whereas the sympathetic system modulates HR only below 0.1 Hz (Berntson et al., 1997). Baroreceptor reflexes contribute to RSA and may fluctuate in response to both sympathetic and parasympathetic activities on a breath-by-breath basis (Berntson et al., 1997). RSA can be substantially affected by breathing; however, over a wide range of breathing frequencies, RR intervals may remain constant (Berntson et al., 1997). Thus, the magnitude of RSA may provide a suggestive indication of basal levels of vagal cardiac nerve traffic. Because RSA is predominantly mediated by parasympathetic influences on the sinus node, high frequency HRV is often employed as an index of vagal control. Parasympathetic control is related to central vagal outflow to the heart, mean level of vagal effect on the heart (cardiac vagal tone), phasic variation of vagal effects on the heart associated with respiration, and dynamic vagal responses affecting RR interval, including the parasympathetic baroreflex response. However, factors producing changes in vagal control and RSA may differ both within and between individuals (Berntson et al., 1997). Consequently, caution needs to be exercised in interpreting RSA results (Berntson et al., 1997). Low frequency HRVencompasses a wide range of frequencies that may confound three distinct cardiac rhythms (RSA, 0.1 Hz oscillation, and 0.03 Hz oscillation), thus complicating interpretation (Berntson et al., 1997). Low frequency HRV has been associated with cardiac sympathetic activity or sympathovagal balance, whereas changes in LF HRV may be due to variations in vagally mediated baroreflex responses resulting from alterations in the amplitude of sympathetic blood pressure rhythms or by changes in the sensitivity of baroreceptors (Berntson et al., 1997). Heart rate is raised either by reducing parasympathetic activity or by increasing sympathetic tone. These two functionally antagonistic sources of innervation provide a dual control system. In resting conditions, parasympathetic tone predominates (‘‘rest and digest’’), whereas the sympathetic division governs the ‘‘flight and fight’’ reaction. Both systems are also tonically active to maintain a steady internal environment (homeostasis) in the face of changing external conditions (Dodd & Role, 1991). The autonomic branches are not always reciprocally controlled, can vary independently, or demonstrate coactivation and coinhibition. Schizophrenia is associated with prominent sympathetic hyperarousal (Joseph, 1989; Shean & Faia, 1975), as has been demonstrated in galvanic skin responses (Dawson, Nuechterlein, & Schell, 1992; Dawson, Nuechterlein, Schell, Gitlin, & Ventura 1994) and heart rate variability (Gruzelier, 1975; Malaspina et al., 1997). Hyperarousal is often evident in the clinical picture of an acute schizophrenic episode in the form of dilated pupils, moist palms, moderate tachycardia, and a higher than normal
systolic blood pressure, which can be observed even when the patient shows no overt signs of emotional excitation (Kaplan & Sadock, 1996). Antipsychotic medication alters autonomic nervous functions. Despite abundant research, few psychophysiological studies have focused on entirely drug-naive acutely psychotic patients. Consequently, our knowledge of the autonomic nervous system changes in an acute psychotic state, unrelated to either drug effects or the chronicity of the state, is limited. We hypothesized that an acute episode of psychosis would disturb widespread cortical–subcortical circuits modulating the autonomic nervous system, thus inducing immediate alterations in HRV. Such changes would be likely because this central system includes both reticular formation and intermediate thalamic nuclei, reciprocal connections to areas modulating arousal and automatic attention such as the anterior cingulate and basal ganglia, and possibly the pituitary. The aim of this study was to (1) record HRV in acutely psychotic drug-naive first-episode patients to evaluate the functioning of both parasympathetic and sympathetic activity changes, and (2) evaluate the adaptability of HRV during different cognitive tasks requiring both the function of different brain areas and an increasing amount of voluntary effort, as well as variation in the amount of stress and mental load. Psychosis was defined [using The Positive and Negative Syndrome Scale (PANSS)/Structural Clinical Interview for Diagnosis (SCID) of the Dignostic and Statistical Manual of Mental Disorders (DSM-III-R) interview combination] as a disturbance of reality-testing, rather than as a symptom of a particular disease. This enabled us to perform the recordings at an early phase of psychosis, when distinct psychiatric diagnoses could not yet be determined.
Methods Participants We studied 18 patients (10 women, 8 men; mean age 27 years, range 15–52; SD 12.3), all of whom were admitted to hospital evaluation for the first time in their lives. All patients had suffered from some kind of prodromal symptoms before the actual overt psychosis according to the referral and the anamnesis provided by the patients and their relatives (withdrawal, difficulties at school, anxiety, etc.), but no psychotic symptoms. The inclusion criteria for our study were first of all, that each patient was for the first time in their lives disturbed severely enough to be taken to a psychiatric evaluation and secondly, that none of the patients had ever used any neuroleptics, antipsychotic drugs, antidepressants, anxiolytic, or cardiovascular drugs according to their interview and hospital records. It was not possible to accurately adjust the duration of the prodromal symptoms due to discrepancy in the reports. The recordings were made within the first 4 days at the hospital before any medication. The diagnoses were based on the information from the records and the psychiatrist’s interview (Table 1). All interviews consisted of PANSS (Kay, Fiszbein, & Opler, 1987) and SCID (for DSMIIIR diagnosis) scoring and setting the initial diagnosis, and were carried out by one trained psychiatrist (M.V.-K.), who was personally present during all patient recordings. The scores for the PANSS questionnaire (Kay et al., 1987) are given in Table 1. The control group consisted of 21 healthy volunteers (16 women, 5 men; mean age 29 years, range 19–46; SD 7.3). They had never used any psychotropic or cardiovascular medication
718
M. Valkonen-Korhonen et al.
Table 1. Age, Preliminary ICD Diagnoses, and Scores for the PANSS Questionnaire for All Patients PANSS Patient 1 2 3 4 5 6 7 8 9 10 11 12 13 14 15 16 17
Age
DSMIII-R
Diagnoses
Total
Pos
Neg
Global
46 16 17 44 17 19 23 35 23 33 15 52 20 16 16 40 32
2959A 2959A 2959A 2961E 2959A 2959A 2989X 2959A 2959A 2961E 2959A 2971A 2959A 2953A 2954A 2959A 2961E
Schizophrenia, undifferentiated Schizophrenia, undifferentiated Schizophrenia, undifferentiated Psychotic depression Schizophrenia, undifferentiated Schizophrenia, undifferentiated Psychosis, undifferentiated Schizophrenia, undifferentiated Schizophrenia, undifferentiated Psychotic depression Schizophrenia, undifferentiated Delusional disorder Schizophrenia, undifferentiated Schizophrenia, paranoid type Psychosis, schizophreniform Schizophrenia, undifferentiated Psychotic depression
116 81 91 102 83 100 77 106 111 99 103 100 101 120 115 99 102
35 21 23 25 22 31 17 29 26 21 21 28 22 39 24 26 20
30 22 25 28 19 23 21 27 31 25 35 22 32 22 34 28 28
51 38 43 49 42 46 39 50 54 53 47 50 47 59 57 45 54
either. There was no significant difference between the ages of the two groups, p 5 .60. Two of the controls were left-handed. No inquiries were made concerning the participants’ smoking habits or caffeine intake. All participants provided written informed consent and the study was approved by the local ethical committee. For underage patients, two consents were provided, one from the patient and another from one of the patient’s parents. The recording was completely noninvasive. After the recording, each patient was provided with a handout containing information about the study and offering them an opportunity to contact the corresponding author and to deny the use of their data for research purposes at any time and without any consequences for their treatment. None of them denied the use of the recorded material. Recordings The current study is part of a larger project called Information Processing in Acute Psychosis. This project aims to study the effects of acute psychosis on different levels of the perceptual system (auditory and visual ERPs), EEG, and autonomic nervous system. For this purpose, an experimental procedure consisting of several recordings was developed. Heart rate was continuously measured during all the tests with two silver chloride electrodes attached to the chest of the participants following the axis of the heart (one electrode near the head and another near the apex of the heart). All signals were amplified and filtered by Neuroscan Synapse amplifier (Neuroscan Inc., Sterling, Virginia) with a bandpass of 0.3–50 Hz and digitized at 500 Hz. Multichannel EEG data also were recorded, but are not part of the current report. During a 2-hr recording session, six different event-related potential (ERP) paradigms were recorded. For HRV evaluation, three of these were chosen on the basis of the putative mental load. The first task was a passive oddball paradigm, in which the participants sat in a chair and watched a silent video while auditory pitch stimuli were delivered to the right ear (passive). In the second task, participants were asked to pay attention to the auditory stimuli, and to press a button when they heard a pitch deviant tone (light load). In both oddball paradigms, 600 auditory stimuli were presented at an interstimulus interval of 1 s,
85% of the stimuli were at 800 Hz, and 15% were deviant tones randomly presented at 560 Hz. The stimulus duration of all auditory stimuli used was 84 ms, including 7-ms rise and fall times, with the stimulus intensity being individually set 60 dB above the individual hearing level of each participant. In the third task, participants performed a commercial digital (Neuroscan Inc., STIM) version of the classic Wisconsin Card Sorting Test (heavy load), in which the visual stimuli (‘‘cards’’ of 6.5-cm width and 9-cm height, representing four different geometric figures, four different colors, with the number of figures/cards ranging from 1 to 4) were displayed on a computer screen (the distance between participant and the monitor was 1 m). The colors, contrasts, luminance, and raise/fall times of the stimuli and the lighting of the testing room were maintained at a constant for all participants throughout each recording session. Participants used a response panel of four buttons. The participant’s task (heavy load) was to deal the cards according to varying strategies by pressing a button. Subjects were instructed to match the response card with one of the four reference cards (constantly present on screen in line from left to right: (1) 1 red triangle, (2) 2 green stars, (3) 3 yellow crosses, (4) 4 blue circles) following one of the three possible rules. The feature they suggest to be a common denominator with the card they play and the reference card can be color, number of figures, or the figure itself. Played cards were located on the screen under the reference cards, but only the topmost of each stack could be seen by the participant. The correct versus wrong choice was indicated by auditory (different tone pips) and visual (green or red) computer feedback signals immediately after the button press. After 10 correct answers, the program automatically and without warning shifted the strategy required by the participants to choose. In the current study, the test included six complete strategies (5 10 correct choices) following twice each category (color, figure, and number). For some patients, this took more than 20 min and for the fastest controls only B2 min. A similar testing procedure has been used in several previous articles with more detailed methodological information of the test, too. For further description of the test, see, for example, Barcelo, MunozCespedes, Pozo, and Rubia (2000); Chelune and Baer (1986); Cuesta, Peralta, Caro, and deLeon (1995); Greve, 2001;
Heart rate variability in acute psychosis
719
Robinson, Heaton, Lehman, and Stilson, 1980; Silberstein, Ciorciari, and Pipingas, (1995); and Tien et al., 1996. A computer version of the WCSTgives information about set shifting ability of the subject, while the classical Card Sorting test (conducted by neuropsychologists with cards) is more focused on problem solving and concept formation. (Barcelo et al., 2000) Participants were informed about the design of the test and given a couple of minutes practice before the recording. Clinically, they all coped with the tasks well, although the patients made significantly more mistakes in WCSTand missed more targets in the active oddball task. They also had slower reaction times.
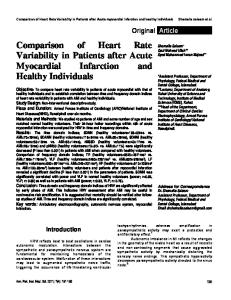
Visual Inspection The raw data for each test and subject were plotted as RR intervals, and test-by-test trends were visually evaluated for mathematical analysis. The data for two typical patients and two controls are presented in Figure 1. No visually detectable change in HRV was observed for psychotic patients during different activations. For the controls, HRV tended to decrease more in the tasks requiring more activation than in the passive task. Visual analysis confirmed this tendency in 13 of the 20 controls, but in none of the patients.
Analysis All data were manually checked to eliminate any potential ectopic beats, arrhythmic events, missing data, and noise effects, which would alter the PSD estimate for HRV. At this point, the recording of 1 patient was excluded from further analysis because of ventricular extrasystolia. Because a couple of subjects completed the heavy load task in less than 2 min, an ECG sample size of 90 s was accepted for the analyses. Visual selection of appropriate sampling epochs was carried out to exclude noisy samples. All the samples were, however, taken from the artifactfree beginning/middle part of each recording. The circumstances were psychophysiologically alike between the subjects because the samples were the same for all subjects within the task. HRV analysis is conventionally conducted utilizing RR interval time series (RiRi 1 intervals as a function of Ri occurrence times). In some context, normal-to-normal (NN) may be used to refer to the intervals between adjacent QRS complexes resulting from sinus node depolarizations. In practice, RR and NN intervals usually appear to be the same. The RR interval time series was constructed by an adaptive QRS detector algorithm. The low-frequency trend in the series was extracted by fitting a second-order polynomial. To recover an evenly sampled signal from the irregularly sampled event series, a cubic interpolation was applied. From this evenly spaced signal, a commonly used nonparametric power spectrum density estimation, based on fast Fourier transformation, was carried out. Statistical comparisons between the two groups were performed using the general linear model analysis of variance for repeated measures (GLM, SPSS Windows 9.0 statistical program). The model employed Greenhouse–Geisser adjustments for the degrees of freedom to correct for the violations of the sphericity assumption when appropriate. The level of significance was set at po.05. The two groups (patients and controls) were set as the between-subject factor, the test as the within-subject factor (passive, light load, and heavy load), and age was set as the covariate in all the models. Moreover, each subject’s sex, education in years, the number of missed targets in the P300 test, the number of false reactions to standard stimuli in P300 test, and the hit-rate in WCST were input into the statistical model as covariates both separately and one by one. Each HRV parameter was separately tested. The correlations between PANSS scores and HRV parameters were calculated using the Spearman correlation matrix.
Time-Domain Methods Time-domain methods are the simplest way to evaluate heart rate variations, based on either the heart rate at any point in time or the intervals between successive normal complexes. For continuous ECG recording, each QRS complex was detected, and RR intervals or the instantaneous heart rate was determined. (Task Force of the European Society of Cardiology and the North American Society of Pacing and Electrophysiology, 1996). Table 2 shows the group averages of the time-domain parameters for the patients and controls. No statistically significant between-subject effects, any significant main effects, nor within-subject interactions were found for time-domain values in GLM models. However, in Spearman correlation matrix, mean RR and mean HRV had a significant correlation with age of the subjects in passive condition.
Results The results of the HRV measurements are presented following the division of methods recommended by the Task Force of the European Society of Cardiologyand the North American Society of Pacing and Electrophysiology (1996).
Statistical Methods More complex statistical time-domain measures can be calculated either as derivatives of direct RR intervals or the instantaneous heart rate, or as derivatives from the differences between RR intervals. Table 2 presents the mean values for the statistical parameters. The most commonly used measures derived from interval differences are RMSSD, the square root of the mean squared differences of successive RR intervals (Task Force of the European Society of Cardiology and the North American Society of Pacing and Electrophysiology, 1996). NN50 is the number of interval differences of successive NN intervals greater than 50 ms, and pNN50 the proportion derived by dividing NN50 by the total number of NN intervals. In each of these three measures, a significant between-subject effect was reached (RMSSD: F 5 6.365, p 5 .016, NN50: F 5 5.863, p 5 .021, and pNN50: F 5 6.381, p 5 .016). Thus, patients’ RMSSD, NN50, and pNN50 were significantly different from the corresponding parameters of controls. No significant main effects or any significant interactions were detected in any of the models. In all three conditions (passive, light load, and heavy load) the standard deviation of HR signal (sHR) had a significant correlation (Spearman) with age of the subjects. Geometric Methods For examining the geometric pattern of the NN intervals, we used an HRV triangular index (integral of the density distribution divided by the maximum of the density distribution, HRVTI) and the triangular interpolation of the NN interval histogram (TINN). There were no significant effects in any of the geometric measures in our data. The triangular index measures general dispersion of RR intervals around the modal value (Berntson et al., 1997). Normal-to-normal (NN) is used here to refer to the intervals between adjacent QRS complexes resulting from sinus
720
M. Valkonen-Korhonen et al. HEAVY LOAD
LIGHT LOAD
PASSIVE
Control 1
RRI (s)
0.9 0.8 0.7
RRI (s)
Control 2 0.9 0.8 0.7 Patient 1 RRI (s)
0.9 0.8 0.7 Patient 2 RRI (s)
0.7 0.6 0.5 0
20
40
60
80
0
20
40 60 Time (seconds)
80
0
20
40
60
80
Figure 1. The raw RR interval data for two typical controls and patients for passive, light load, and heavy load tests. The 90-s sample presented is the same as used in all analyses.
node depolarizations. In practice, RR and NN intervals usually appear to be the same. Frequency-Domain Methods We calculated the most commonly used frequency bands in HRV analysis, which are the very low frequency (VLF: 0–0.04 Hz), low frequency (LF: 0.04–0.15 Hz), and high frequency (HF: 0.15–0.4 Hz) bands. However, due to the short duration of the recordings (90 s), we were only able to reliably determine the powers and peak frequencies of LF and HF bands from the power spectrum. The spectrum was estimated using Welch’s periodogram method (Marple, 1987). The only significant difference between the
groups was in the HF power, F 5 4.747, p 5 .036), because the HF power was significantly lower under all conditions in the patients than in the controls, suggesting changes in vagal control of the heart. HRV Changes Related to Activation and Mental Load Because the main differences in HRV parameters between the patients and controls were established using RMSSD, pNN50, and HF power, these three parameters were chosen to evaluate task-dependent HRV changes. Figure 2 presents trends of RMSSD, pNN50, and HF power across the three degrees of mental load (passive, light load, and heavy load). Patients
Table 2. Group Averages and Standard Deviations of Obtained Variables Controls Variable RR (ms) sRR (ms) HR (1/min) sRR (1/min) RMSSD (ms) pNN50 (%) HRVTI (ms) TINN (ms) LF power (%) HF power (%)
Patients
Passive
Light load
Heavy load
Passive
Light load
Heavy load
8167112 41716 75.079.9 3.871.2 38.8718.8 18.8716.9 70.5721.3 186763 45.3719.8 40.2722.8
8027109 39713 76.3710.1 3.670.9 35.8716.5 18.2717.2 69.8719.3 174754 38.5718.2 40.7721.8
7657137 41716 81.0713.7 4.371.7 31.5717.8 12.4714.4 66.5717.1 179765 49.0715.5 33.1719.5
7597111 36715 80.9711.4 3.971.7 24.479.9 6.176.5 60.3716.9 156754 52.4715.4 28.5717.3
7527111 33713 81.6712.1 3.571.2 24.2711.4 6.679.0 62.8721.6 157757 45.9718.5 29.1716.9
7327116 34713 84.1712.7 3.971.7 23.9711.2 6.579.0 58.9718.0 149753 46.5715.6 28.8718.2
Notes: RR is the mean RR interval, sRR is the standard deviation of RR intervals, HR is the mean heart rate, sHR is the standard deviation of HR signal, RMSSD is the square root of the mean squared differences of successive RR intervals, pNN50 is the relative amount of successive adjacent RR intervals with difference greater than 50 ms, HRVTI (HRV triangular index) is the integral of the RR interval density function divided by the maximum, TINN is the baseline width of the density function, and LF power and HF power are the low- and high-frequency band powers of the PSD.
721
Heart rate variability in acute psychosis CONTROLS (N=21)
PATIENTS (N=17)
RMSSD (ms)
80
60
40
already in the raw data (cf. Figure 1). Figure 3 shows relative changes (between passive and heavy load) for LF and HF power, and pNN50 and RMSSD. The spectral parameters show less correlation and the diagnostic grouping is also less evident, whereas pNN50 and RMSSD are strongly correlated (linear trend), and the figure also suggest better diagnostic alignment. It is important, however, to observe the intercorrelations that many HRV measures exhibit, both when models for statistical analyses are designed and when the results are interpretated. HRV in Schizophrenia versus Nonschizophrenia Diagnoses To capture events typical for acute psychosis as an extensive psychophysiological state, we further examined the effect of a particular diagnosis on the parameters. As in many previous reports, the electrophysiological findings have differed for schizophrenic and nonschizophrenic psychoses. For this purpose, the patient group was divided according to preliminary diagnoses into two diagnostic categories: schizophrenia (11
20
0 60
pNN50 (%)
40 CONTROLS (N=21) PATIENTS (N=17) 40
20
HF power (%)
20
0
80
0
-20
-40
HF power (%)
60 -60 -40
-20
0 LF power (%)
40
20
40
20
20
0 PASSIVE
LIGHT LOAD
HEAVY LOAD
PASSIVE
LIGHT LOAD
HEAVY LOAD
Figure 2. The trend in RMSSD, pNN50, and HF power between passive, light load, and heavy load tests for controls and patients. The bars and the bold lines in the middle of them show the standard deviations and mean values of the groups in each test. The thin lines connect the values of each subject to reveal the individual changes within a group. Note that all three measures reveal the same patterns of changes across conditions. In patients, the parameters remain unchanged, whereas in controls the trend is downward when moved on from passive/light load task to heavy load task.
showed less dramatic changes in HRV, whereas in the controls there was a tendency for acceleration in the first step (passive– light load) and deceleration in the second one (light load–heavy load). These trends were not linear, and showed no significant difference between the slopes of the test–interaction in the linear regression model. The patients’ poor reactivity was evident
pNN50 (%)
10
0
-10
-20
-30 -40
-30
-20
-10
0
10
20
RMSSD (ms)
Figure 3. Relative changes in LF power, HF power, RMSSD, and pNN50 between passive and heavy load tests for all subjects. Dependency of HF and LF power changes is presented on top and that of pNN50 and RMSSD below. A decrease in HF power, pNN50, and RMSSD for heavy load (compared to passive) for most of the control subjects is observed. The linear trend in the lower panel is due to the strong correlation of pNN50 and RMSSD measures. It is important to observe this kind of strong intercorrelations of some of the HRV measures, both when conducting the analyses and when making interpretations.
.526nm .583nnp
.499nm .550nnp
.573nn .630nnnw
.545nnp .578nnw
.485np
.615nnn
HR
.575nnw
.535np
.544nnw
sRR
.527np
.549nnm .456p
.545nnp .555nnw .534np .594nnw
.525nw
sHR
.489nm .556nnp
RMSSD
.541nnm
.510nm .559np
.569nnp
NN50
.487np
.495nm .513np .489np
.602nnp
pNN50
.487np
.518np
.511np
.490nm
.500nm
HRVTI
.572nnp
.588nnw
.500nw
TINN
.604nnnm .531np
.497nw .548nnm
LFpower
.556nnm
.553nnp .530nm .518np .482nw .509nw .531np
.498np
HFpower
.550nnpw
.698nnnmpw
.498nmp
.545npw
.578nnpw
mRMSSD
.552nnpw
.547nnmp .523nmp
.544nnmp .620nnnpw .495nmp
.510npw .544nnmpw
mHFpower
Notes: Numbers are Spearman figures. The small letters in subindexes stand for the test: m: passive (MMN), p: light load (P300), and w: heavy load (Wisconsin test). In the last two columns, m means change in the parameter (RMSSD and HF power) and the letters reveal the tests between which the change was calculated. nnn pr.01, nn.01opr.025, and n.025opr.05.
G16 Active social avoidance
G10 Disorientation G11 Poor attention G14 Poor impulse control G15 Preoccupation
G5 Mannerism and posturing G7 Motor retardation
G2 Anxiety G3 Guilt feelings
Negative signs N2 Emotional withdrawal N3 Poor rapport N4 Passive apathetic social withdrawal N7 Stereotyped thinking Global Psychopathology index G1 Somatic concern
P5 Grandiosity P6 Suspiciousness/ percecution P7 Hostility
P3 Hallucinatory behavior P4 Excitement
PANSS total Positive signs P1 Delusions
RR
Table 3. All Significant Correlations between PANSS Scores and HRV Parameters Are Presented (Spearman Correlation Matrix)
722 M. Valkonen-Korhonen et al.
Heart rate variability in acute psychosis patients) and nonschizophrenia (three delusional disorders and one schizoaffective disorder, mania, and psychotic depression). Diagnostic subgroups were tested in the GLM model as a between-subject factor. No significant between-subject effects were revealed in any of the HRV parameters, nor were any within-subject effects found for the three activations, 0.002oFo2.98, .11opo.97, or age as a covariate. Thus, both patient subgroups shared the same variation in HRV parameters. HRV and PANSS Scores In an effort to determine which, if any, particular symptoms or symptom clusters are related to HRV parameters, we calculated the correlations between the HRV parameters and each single PANSS score, and separately for the positive signs, negative signs, and global psychopathology index, as well as for the total PANSS score. All significant correlations are presented in Table 3. Summary of Results Even though the patients exhibited a higher heart rate across all three conditions, the only significant differences between the groups concerned large short-term variation in HRV (measured as RMSSD and pNN50) and HF power. The patients had significantly lower RMSSD and pNN50, and the amount of HF power was significantly lower in the patients than in the controls. The healthy controls showed changes in the HR variation that were clearly related to the task requirements; whereas, in the patients, the variability remained largely the same throughout the three conditions. No significant differences in HRV parameters were detected between schizophrenia and nonschizophrenic disorders. On the PANSS scores, apathy, social withdrawal, and invert withdrawal were correlated with several HRV parameters and HR reactivity. Discussion The aim of the current study was to examine heart rate variability in acute first-episode drug-naive psychotic patients and to evaluate the adaptation of their heart rate to task-related changes in mental load. The examinations were carried out without any clinical or technical problems, nor did any of the subjects show any noticeable fear or anxiety reactions during the recordings. However, the data for one patient was excluded because of ventricular extrasystolia. The results revealed (1) significantly decreased short-term variation in consecutive heartbeats revealed by reduced RMSSD, (2) significantly less HF power during psychosis compared to healthy controls, and (3) lack of change in HRV in psychotic patients with increasing mental load when compared to controls, who adapted to increasing load by diminishing HRV. These findings were related to PANSS scores, particularly to apathy and withdrawal scores of both negative signs and global psychopathology indexes. The differences in HRV were not dependent on the type of psychosis, but rather on a marker of a psychophysiological state. The results are discussed concerning (1) the clinical picture and symptoms of psychosis, (2) medication, (3) adaptation, (4) technical issues and data analysis, and (5) sympathetic and parasympathetic modulation of heart rate. The investigation of the autonomic nervous system has a long tradition in schizophrenia. An abundance of conflicting evidence has been reported for a variety of subject populations, experimental procedures, measurement techniques, and drug effects. However, high tonic levels of sympathetic arousal and
723 diminished habituation of the amplitudes of autonomic responses have generally been confirmed (Dawson et al., 1994; Zahn, Carpenter, & McGlashan, 1979). Toichi et al. (1999) reported no significant differences in the mean RR in chronic schizophrenic patients, though they found a suppression of parasympathetic function during pronounced psychotic symptoms. Because both the RMSSD and HF power are associated with respiratory effects on heart rate and modulated by both vagal (parasympathetic) and sympathetic activity, our results are consistent with these findings and show the presence of these disturbances even in the early phase of the illness. However, the reduced mean RR in acutely ill patients (Toichi et al., 1999) was not supported by our results. Thus, alterations in the parasympathetic–sympathetic balance seem to be related to acute psychotic symptoms, though the decrease in overall HRV probably appears only in chronic patients. Brekke, Raine, and Thomson (1995) showed a correlation between negative symptoms and reduced resting heart rate, though positive symptoms were not related to alterations in HRV variables. They suggested that heart rate variables might represent trait-related aspects of the negative symptoms. Our results are partly in agreement with this view. However, the highest correlation in HRV and PANSS scores in our data was found for apathy and withdrawal. It could therefore be speculated that these negative signs influenced cognitive performance and thereby affected HRV. However, clinical observation showed that all subjects had coped with the tasks, though the patients attained lower hit rates and made more mistakes. Furthermore, none of the performance parameters had a significant effect on HRV (.169opo.793) in GLM models, and in the correlation matrix, the only significant correlations were between age and the reaction times, and with performance parameters and diagnosis. There were also separate significant correlations between the positive signs of suspiciousness, delusions, and hostility as well as motor retardation and several HRVparameters. Accordingly, our data do not support Brekke’s conclusion that HRV changes (meaning in our data particularly RMSSD, NN50, HF power, and lack of adaptation according to task connected strain) in acute psychosis would be specific to any symptom cluster. Several antipsychotic drugs are known to have significant effects on heart rate, blood pressure, and HRV in resting conditions (Agelink et al., 1998). Most previous studies have focused on medicated patients. Few reports have examined patients who are drug free at the time of recording (Fowles, Watt, Maher, & Grinspoon, 1970), though previously medicated (Zahn, Carpenter, & McGlashan, 1981a,b). A major advantage of our study is that we only included completely drug-naive, firstepisode patients. Our findings thus reveal disturbances in heart rate regulation that are related to the psychotic state per se and are not secondary consequences of chronicity or any treatment modality. Our results also suggest the possibility that psychotic illness may increase, via an HRV decrement, the risk of conductance disturbances and arrhythmias in psychotic patients. A lower heart rate regulation capacity could be further amplified by the effects of any antipsychotic or antidepressive drugs that are known to cause impulse conductance disturbances. This may increase the psychotic patients’ risk for cardiovascular events. Although such a risk could not directly be evidenced by our results, these findings may provide one potential pathophysiological explanation to be tested in future risk studies.
724 It seems that unlike the reciprocal sympathetic–parasympathetic response to orthostatic changes, responses to stress reveal different patterns of correlation. Berntson et al. (1994) have demonstrated individual, cross-task stable characteristics of autonomic responses to stress using pharmacological blockades. Thus, exaggerated cardiac reactivity may arise from distinct modes of autonomic control and represent a risk factor for cardiovascular disease. Cardiac chronotropy is a joint function of sympathetic and vagal outflows to the heart, both of which are affected by psychological stressors and vary independently (Cacioppo et al., 1994). An individual’s classification as having a high heart rate reactivity could be derived from elevated sympathetic reactivity, vagal withdrawal, or reciprocal activation of the sympathetic and vagal outflows to the heart. Similarly, a low heart rate reactivity classification could stem from low sympathetic (and vagal) reactivity, or from low to high coactivation of the sympathetic and vagal controls on cardiac chronotropy (Cacioppo et al., 1994). Heart rate reactivity has also been attributed to multiple modes of autonomic control (Cacioppo et al., 1994). A general increase in the adrenergic activation of the heart is thought to abbreviate the preejection period and elevate HR, whereas decreased activation of the heart is thought to decrease RSA and increase HR (Cacioppo et al., 1994). Stress-induced changes in RSA and in preejection period can vary independently, and each may predict unique autonomic determinants of HR reactivity (Cacioppo et al., 1994). Few reports have investigated the effect of schizophrenia on HRV adaptation. Although the stress of speaking in public is known to increase the heart rate in both patients and controls, schizophrenics exhibit no significant cortisol response, thus indicating an impaired ability to adapt to task demands (Jansen et al., 1998). Cognitive manipulations have induced an increase in heart rate in normal controls, and a similar increase has been reported in paranoid subjects as a function of task demands (Rippon, 1992), whereas other schizophrenics have been shown to display a reduced cardiac response (Steinhauer, Jennings, van Kammen, & Zubin, 1992). Similar findings have been reported for reactivity to sensory stimulation in early psychosis (James & Barry, 1980). In childhood-onset schizophrenia, higher rates of spontaneous HRs and smaller anticipatory HR responses during rest have been observed in a series of experiments using innocuous tones, reaction time instructions, and simple warned reaction time tasks (Zahn et al., 1997). Zahn et al. (1981a,b) reported reduced adaptation of HRV in drug-free patients using a method rather analogous to ours. Using resting conditions, auditory stimuli, and an arithmetic task, they demonstrated a decreased responsivity in patients to all conditions: increased resting HR, lower phasic responsivity, less anticipatory activity, and a lower tonic arousal response to a stress procedure similar to that reported earlier for acutely ill schizophrenic patients (Fowles et al., 1970). Both of these findings are in good agreement with the results of the present study. However, without power spectral analyses, the origin of autonomic nervous system alterations may remain unclear, because time-domain methods tend to group together several spectral components, each of which may correspond to different physiological processes (Myers et al., 1986). On the other hand, at least in our data, the time-domain measures and spectral analyses were strongly associated and represented similar findings of instability in psychosis. The quality of the heart rate sample chosen for analysis of the parameters is important, because potential slow-wave fluctua-
M. Valkonen-Korhonen et al. tions in the raw data can lead to artifacts that prevent reliable estimation of heart rate variability within a sample. This problem was solved by choosing each sample visually and by using a second-order polynomial fitting for removing the slow potentials. The error in RR intervals due to the finite sampling frequency has been shown to be negligible at the 500-Hz level used in this study (Merri, Farden, Mottley, & Titlebaum, 1990). An erroneous assumption of regularly spaced samples causes distortion, and therefore we used cubic interpolation to recover an evenly sampled RR interval series, from which the PSD estimate was calculated. Short recording epochs (1–2 min) would minimize the likelihood of nonstationarities and permit evaluation of trial-to-trial variance and potential systematic changes over trials (Berntson et al., 1997). The issue of stationarity was taken into consideration in the current study by minimizing nonstationarities in data, removing slow trends by means of filtering procedures, avoiding long analytical epochs, testing for the presence of nonstationarities, and omitting highly nonstationary segments in the data. On the other hand, the small sample size has its disadvantages. Together with small number of subjects in the study, we failed in reaching significant covariate effects of HRV timedomain measures in any of the GLM models, which is a somewhat conflicting finding when compared to literature of normal subjects. However, in the correlation matrix, we had significant correlations between age and time-domain measures as expected. The potential influence of respiration on RSA must also be considered. RSA is a product of both peripheral and central respiratory mechanisms, the latter of which is also related to the origin of high frequency HRV (Berntson et al., 1997). Healthy individuals do not breathe uniformly at fixed frequency (Priban & Fincham, 1965), and experimental conditions may alter respiratory parameters substantially; even the experimental control of breathing produces mental effort and reduces HRV (Berntson et al., 1997). However, there are also reports in which voluntary control of breathing had no effect on HRV (Hirsch & Bishop, 1981). The lack of respiratory measures may not preclude some group contrasts in a well-defined population with known respiratory patterns, when experimental conditions do not alter respiratory parameters appreciably (Berntson et al., 1997). This recommendation speaks in support of the current data as well, although respiratory coupling itself may be more altered in the behavioral context of our patients than in the controls, and is of interest as such. Thus, covarying breathing could have also had adverse effects on our data. In summary, our results are well in agreement with the earlier studies on HRV and psychotic disorders (Fowles et al., 1970; James & Barry, 1980; Jansen et al., 1998; Steinhauer et al., 1992; Toichi et al., 1999; Zahn et al., 1981a,b, 1997), bringing about new details of the sympathovagal regulatory state of imbalance in acutely ill drug-naive, first-episode patients and confirming and enlargening the previously demonstrated finding of lower phasic and tonic autonomic nervous system reactivity as meaningful or demanding stimuli (Zahn et al., 1981a,b). In addition to sympathetic hyperarousal, there seems to be a failure of sympathetic–parasympathetic balance in monitoring heart rate during acute psychosis, not related to anxiety, but merely to withdrawal and other negative type symptoms. It is associated with impaired short-term fluctuation of HRV and task-dependent adaptation of the subject and may at least partly, possibly even predominantly, be of parasympathetic origin. These
725
Heart rate variability in acute psychosis alterations imply overall readjustment difficulties in balancing between internal and external stimulation during psychosis. Jackson (1974) demonstrated that in schizophrenia there is a threshold effect on the amplitude of HR deceleration, where HR deceleration tended to decrease, increase, and decrease again with increasing stimulus intensity. We speculate that imbalance in sympatho-vagal monitoring may be, at least partly, responsible for this threshold effect.
To conclude, we suggest that one potential pathophysiological marker of the phase-specific autonomic nervous system dysfunction in acute psychosis may be the impaired short-term variability in heart rate and decreased high frequency power. The clinical implications of our findings may be related to the cardiovascular side effects of antipsychotic and antidepressive drugs as well as to an increased risk of cardiovascular events in patients with psychotic illnesses (Brown, Inskip & Barraclough, 2000).
REFERENCES Agelink, M., Malessa, R., Kamcili, E., Zeit, T., Lemmer, W., Bertling, R., & Klieser, E. (1998). Cardiovascular autonomic reactivity in schizophrenics under neuroleptic treatment: A potential predictor of short-term outcome? Neuropsychobiology, 38, 19–24. Akselrod, S., Gordon, D., Ubel, F., Shannon, D., Berger, A., & Cohen, R. (1981). Power spectrum analysis of heart rate fluctuation: A quantitative probe of beat-to-beat cardiovascular control. Science, 213, 220–322. Barcelo, F., Munoz-Cespedes, J., Pozo, M., & Rubia, F. (2000). Attentional set shifting modulates the target p3b response in the Wisconsin Card Sorting Test. Neuropsychologia, 38, 1342–1355. Berntson, G. G., Bigger, J. T., Eckberg, D., Grossman, P., Kaufmann, P., Malik, M., Nagaraja, H., Porges, S., Saul, J., Stone, P., & van der Molen, M. (1997). Heart rate variability: Origins, methods, and interpretive caveats. Psychophysiology, 34, 623–648. Berntson, G., Cacioppo, J., Binkley, P., Uchino, B., Quigley, K., & Fieldstone, A. (1994). Autonomic cardiac control. III. Psychological stress and cardiac response in autonomic space as revealed by pharmacological blockades. Psychophysiology, 31, 599–608. Brekke, J., Raine, A., & Thomson, C. (1995). Cognitive and psychophysiological correlates of positive, negative, and disorganized symptoms in the schizophrenia spectrum. Psychiatry Research, 57, 241–250. Brown, S., Inskip, H., & Barraclough, B. (2000). Causes of the excess mortality of schizopherinia. British Journal of Psychiatry, 177, 212–217. Cacioppo, J., Uchino, B., & Berntson, G. (1994). Individual differences in the autonomic origins of heart rate reactivity: The psychometrics of respiratory sinus arrhythmia and pre-ejection period. Psychophysiology, 31, 412–419. Chelune, G., & Baer, R. (1986). Developmental norms for the Wisconsin Card Sorting Test. Journal of Clinical and Experimental Neuropsychology, 8, 219–228. Cuesta, M., Peralta, V., Caro, F., & deLeon, J. (1995). Schizophrenic syndrome and Wisconsin Card Sorting Test dimensions. Psychiatry Research, 58, 45–51. Dawson, M., Nuechterlein, K., & Schell, A. (1992). Electrodermal anomalies in recent-onset schizophrenia: Relationship to symptoms and prognosis. Schizophrenia Bulletin, 18, 295–311. Dawson, M., Nuechterlein, K., Schell, A., Gitlin, M., & Ventura, J. (1994). Autonomic abnormalities in schizophrenia. State or trait indicators? Archives of General Psychiatry, 51, 813–824. Dodd, J., & Role, L. (1991). The autonomic nervous system. In E. Kandel, J. Schwartz, & T. Jessel (Eds.), Principles of neural science (Vol. 3, pp. 761–775). Connecticut: Appleton & Lange. Fowles, D., Watt, N., Maher, B., & Grinspoon, L. (1970). Autonomic arousal in good and poor premorbid schizophrenics. British Journal of Social and Clinical Psychology, 9, 135–147. Greve, K. (2001). The WCST-64: A standardized short-form of the Wisconsin Card Sorting Test. Clinical Neuropsychology, 15, 228–234. Gruzelier, J. (1975). The cardiac responses of schizophrenics to orienting, signal and non-signal tones. Biological Psychology, 3, 143–155. Hirsch, J., & Bishop, B. (1981). Respiratory sinus arrhythmia in humans: How breathing pattern modulates heart rate. American Journal of Physiology, 241, 620–629. Jackson, J. (1974). Amplitude and habituation of the orienting reflex as a function of stimulus intensity. Psychophysiology, 11, 647–659. James, A., & Barry, R. (1980). A review of psychophysiology in early onset psychosis. Schizophrenia Bulletin, 6, 506–525.
Jansen, L., de Wied, C. G., Gademan, P., Jonge, R., van der Linden, J., & Kahn, R. (1998). Blunted cortisol response to a psychosocial stressor in schizophrenia. Schizophrenia Research, 33, 87–94. Joseph, C. (1989). EEG and autonomic arousal measures in schizophrenics. International Journal of Neuroscience, 45, 261–276. Kaplan, H., & Sadock, B. Typical signs and symptoms of psychiatric illness. In H. Kaplan & B. Sadock (Eds.), Comprehensive textbook of psychiatry (Vol. 1, pp. 538–542). Baltimore, MD: Williams & Wilkins. Kay, S., Fiszbein, A., & Opler, L. (1987). The positive and negative syndrome scale (PANSS) for schizophrenia. Schizophrenia Bulletin, 13, 261–276. Malaspina, D., Bruder, G., Dalack, G., Storer, S., Kammen, M. V., Amador, X., Glassman, A., & Gorman, J. (1997). Diminished cardiac vagal tone in schizophrenia: Associations to brain laterality and age of onset. Biological Psychiatry, 41, 612–617. Malliani, A., Lombardi, F., Pagani, M., & Cerutti, S. (1994). Power spectral analysis of cardiovascular variability in patients at risk for sudden cardiac death. Journal of Cardiovascular Electrophysiology, 5, 274–286. Marple, S. (1987). Digital spectral analysis. Englewood Cliffs, NJ: Prentice-Hall International. Merri, M., Farden, D., Mottley, J., & Titlebaum, E. (1990). Sampling frequency of the electrocardiogram for spectral analysis of the heart rate variability. IEEE Transactions on Biomedical Engineering, 37, 99–106. Myers, G., Martin, G., Magid, N., Barnett, P., Schaad, J., Weiss, J., Lesch, M., & Singer, D. (1986). Power spectral analysis of heart rate variability in sudden cardiac death: Comparison to other methods. IEEE Transactions on Biomedical Engineering, 33, 1149–1156. Pagani, M., Lombardi, F., Guzzetti, S., Rimoldi, O., Furlan, R., Pizzinelli, P., Sandrone, G., Malfatto, G., Dell’Orto, S., Piccaluga, E., Turiel, M., Baselli, G., Cerutti, S., & Malliani, A. (1986). Power spectral analysis of heart rate and arterial pressure variabilities as a marker of sympatho-vagal interaction in man and conscious dog. Circulation Research, 59, 178–193. Priban, I., & Fincham, W. (1965). Self-adaptive control and respiratory system. Nature, 208, 339–343. Rippon, G. (1992). Paranoid-nonparanoid differences–psychophysiological parallels. International Journal of Psychophysiology, 13, 79–93. Robinson, A., Heaton, R., Lehman, R., & Stilson, D. (1980). The utility of the Wisconsin Card Sorting Test in detecting and localizing frontal lobe lesions. Journal of Consulting and Clinical Psychology, 48, 605–614. Shean, G., & Faia, C. (1975). Autonomic control, selective attention and schizophrenic subtype. Journal of Nervous and Mental Disease, 160, 176–181. Silberstein, R., Ciorciari, J., & Pipingas, A. (1995). Steady-state visually evoked potential topography during the Wisconsin Card Sorting Test. Electroencephalography and Clinical Neurophysiology, 96, 24–35. Steinhauer, S., Jennings, J., van Kammen, D., & Zubin, J. (1992). Beat-by-beat cardiac responses in normals and schizophrenics to events varying in conditional probability. Psychophysiology, 29, 223–231. Task Force of the European Society of Cardiology and the North American Society of Pacing and Electrophysiology. (1996). Heart rate variability: Standards of measurement, physiological interpretation and clinical use. Circulation, 93, 1043–1065. Tien, A., Spevack, T., Jones, D., Pearlson, G., Schlaepfer, T., & Strauss, M. (1996). Computerized Wisconsin Card Sorting Test: Comparison with manual administration. Kao Hsiung I Hsueh Ko Hsueh Tsa Chih, 12, 479–485.
726 Toichi, M., Kubota, Y., Murai, T., Kamio, Y., Sakihama, M., Toriuchi, T., Inakuma, T., Senkogu, A., & Miyoshi, K. (1999). The influence of psychotic states on the autonomic nervous system in schizophrenia. International Journal of Psychophysiology, 31, 147–154. Zahn, T., Carpenter, W., & McGlashan, T. (1979). Autonomic variables related to short-term outcome and clinical improvement in acute schizophrenia. Psychopharmacology Bulletin, 15, 42–43. Zahn, T., Carpenter, W., & McGlashan, T. (1981a). Autonomic nervous system activity in acute schizophrenia: I. Method and comparison with normal controls. Archives of General Psychiatry, 38, 251–258.
M. Valkonen-Korhonen et al. Zahn, T., Carpenter, W., & McGlashan, T. (1981b). Autonomic nervous system activity in acute schizophrenia: II. Relationships to short-term prognosis and clinical state. Archives of General Psychiatry, 38, 260–266. Zahn, T., Jacobsen, L., Gordon, C., McKenna, K., Frasier, J., & Rapoport, J. (1997). Autonomic nervous system markers of psychopathology in childhood-onset schizophrenia. Archives of General Psychiatry, 54, 904–912. (Received July 5, 2001; Accepted February 14, 2003)