HEALTHCARE FOR THE HOMELESS AND ENDING HOMELESSNESS Joshua D. Bamberger, MD, MPH
[email protected] Sarah Dobbins, MPH San Francisco Department of Public Health University of California, San Francisco, Dept. of Family and Community Medicine
Outline • Housing reduces mortality for homeless people with
AIDS • For high users of healthcare system, it is cheaper to be housed than homeless • Not all housing is the same • Characteristics of communities on track to end homelessness • Leadership role of HCH clinics
Plaza High Utilizer Study • 106 Chronically homeless adults • Cost year before housing: $3,132,856 • Cost year after housing: $906,228 • Reduction in healthcare costs: $2,226,568 • Cost of program: $1.1million/year • Reduction in public cost in first year: $1.1 million • More than 90% of reduction
among 15 tenants who cost more than $50,000/year prior to being housed
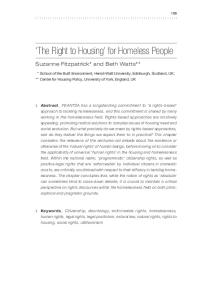
The more beautiful the housing the better the outcome
The more beautiful the housing the better the outcome- Windsor
The more beautiful the housing the better the outcome- Plaza
The more beautiful the housing the better the outcome- Mission Creek
The more beautiful the housing the better the outcome- Richardson
The more beautiful the housing the better the outcome- Kelly Cullen Community
The more beautiful the housing the better the outcome- Kelly Cullen Community
The more beautiful the housing the better the outcome- Kelly Cullen Community
Move-out not death 30.0
25.0
20.0
15.0 Move-out not death Linear (Move-out not death) 10.0 R² = 0.76418 5.0
0.0 Windsor Empress
LeNain
PBI
CCR
West
Folsom Dore
Plaza
149 Mason
990 Polk
Mission Creek
Death by Quality of Housing %death
7.6
6.8
5.3 5.0
4.0
3.9 3.5
3.5 3.1 R² = 0.38889
2.7
Windsor
Empress
LeNain
PBI
CCR
West
2.5
Folsom Dore
Plaza
149 Mason
990 Polk Mission Creek
Death rate Le Nain vs. Mission Creek 2006-2011 7.0
6.0
5.0
4.0 Le Nain death % MCSC death % 3.0
2.0
1.0
0.0 Death Rate/year
Case #1 • 48 y/o man w/ many year h/o homelessness • Experience rectal trauma in 2011 • Colostomy and colostomy repair, complications • H/o alcoholism and cocaine use • Multiple stays in medical respite • Placed in supportive housing in 2012 • Chronic back and leg pain with radiographic abnormalities • First visit to me in 2013 after switching from another clinic • Reports cocaine use at first visit, “just for my birthday.” • Refuses utox next visit: “I am not on parole.” • Denies cocaine use, makes threats to staff
Case #2 • 67 y/o depression, speed use, alcoholism, afib. • Evicted from supportive housing in 2010 • Unrelenting stimulant use and alcoholism • Repeated hospitalization for A. Fib and CHF • Conserved as gravely disabled • Placed in locked facility. Released from locked facility • Drunk and in A. Fib on second day out • 1 year of being on streets, in and out of hospital • Hospitalized and held for grave disability
POSITIVE OUTLIERS Characteristics of communities on track to end homelessness
POPULATION SNAPSHOT
Veteran PIT Counts, 2009-2012 90,000 80,000
75,609
76,329 67,495
Number of Veterans
70,000
62,619
60,000 50,000
43,409
43,437
Sheltered Veterans
35,143
40,000 30,000
Total Veterans
40,033
Unsheltered Veterans 32,200
32,892
2009
2010
20,000
* 27,462
27,476
2011
2012
10,000 * CoCs only required to conduct a new count of unsheltered homelessness in odd numbered years; in 2012, only 32% of CoCs opted not to do a new unsheltered count, providing an incomplete picture of trends in the number of unsheltered homeless Veterans
Source: PIT data, 2009 - 2012
Number of Homeless Veterans in 5 Communities with Greater than 40% reduction 2010-2012 600 500
512
400
Hennepin
300
310
200
256 223 174
Lexington Tacoma Fort Worth Birmingham -------Projected
100 0 2010
2011
2012
2013
2014
2015
Utah Homeless Point-‐In-‐Time Count: 2005-‐2012 18,000
0.70% 16,522
16,000
14,000
0.60%
13,690
15,642
15,525 14,375 0.53%
0.52% 13,362
0.57%
0.60%
0.56%
0.60% 14,351 0.52% 0.50%
0.46% 11,970
12,000
0.40%
10,000
8,000 6,785 6,000
5,565
7,100
7,390
7,105
0.30%
6,440
5,910 5,000
0.20%
4,000
2,000
1,932
1,914
0.10% 1,530
1,470
1,400 812
601
542
0
0.00% 2005 Annualized Total Count
2006
2007
Number of Persons in Families
Source: 2012 Annualized Utah Homeless Point-‐In-‐Time Count
2008
2009
Number of Chronically Homeless Persons
2010
2011
2012
Total Homeless Persons as % of Total PopulaNon
Utah Annualized Chronic Homeless Count: 2005-2012 2,500 2,000 1,500
16% 14%
14%
14% 13%
12%
Chronic Count 10%
1,932
10%
1,914 1,530
1,000
9% 1,470
1,400
8% 5% 812
500
6% 4% 601
3%
4%
542
2%
0
0% 2005
2006
2007
2008
2009
Source: 2012 Utah Homeless Point-In-Time Count
2010
2011
2012
Veterans in Minneapolis/Hennepin County 2009 2011 300
267
250
224
200
177
150
126
100 50 0 2009
2010
2011
2012
total veterans
Point-in-time count for Minneapolis/Hennepin County Continuum total chronic homeless
total chronic homeless (perecnt of 779
775
24.26 21.84
566
17.59 351
10.36
2009
2010
2011
2012
Characteristics of Positive Outliers • High level of communication and collaboration
across different pillars of homeless services • Continuum of care • Healthcare for the homeless • Housing Authority • VA
• Strong and dynamic leadership • Commitment to similar philosophy • Housing First and Harm Reduction
Characteristics of Positive Outliers • Use of data to inform policy • SMART (Specific, Measurable, Attainable, Relevant, Time-sensitive) • Targeted intervention • Chronically homeless = Permanent supportive
housing • Episodic homeless = Rapid re-housing, homeless prevention
Role of HRSA in Leading HCH Towards Ending Homelessness • Limited by congressional mandate • Performance measures already burdensome and difficult to change • HCH as part of Community Health Centers • Healthcare for homeless should be held to same
standards as other health centers • Opportunity for HCH to take lead
Recommendations • Establish connections across the sectors • Position HCH as necessary to evaluate who goes
into housing. • Position HCH as necessary to serve people in supportive housing • Opportunities for revenue with ACA
• Establish measureable goals, provide real time
feedback • Take credit for success • Repeat…..
HEALTHCARE FOR THE HOMELESS AND ENDING HOMELESSNESS Joshua D. Bamberger, MD, MPH
[email protected] Sarah Dobbins, MPH San Francisco Department of Public Health University of California, San Francisco, Dept. of Family and Community Medicine