Guidelines for Conducting Extended Cost-benefit Analysis of Dam Projects in Thailand
Piyaluk Chutubtim
October, 2001
Comments should be sent to the author: Piyaluk Chutubtim, Department of Economics, Chiang Mai University, Chiang Mai, Thailand. Email:
[email protected]
EEPSEA was established in May 1993 to support research and training in environmental and resource economics. Its objective is to enhance local capacity to undertake the economic analysis of environmental problems and policies. It uses a networking approach, involving courses, meetings, technical support, access to literature and opportunities for comparative research. Member countries are Thailand, Malaysia, Indonesia, the Philippines, Vietnam, Cambodia, Lao PDR, China, Papua New Guinea and Sri Lanka. EEPSEA is supported by the International Development Research Centre (IDRC); the Danish Ministry of Foreign Affairs (DANIDA); the Swedish International Development Cooperation Agency (Sida); the Ministry of Foreign Affairs, the Netherlands; the Canadian International Development Agency (CIDA); the MacArthur Foundation; and the Norwegian Agency for Development Cooperation (NORAD). EEPSEA publications are produced by Corpcom Services Sdn. Bhd. in association with the Montfort Boys Town, Malaysia. This program provides vocational training to boys from low-income families and home-based work to mothers. EEPSEA publications are also available online at http://www.eepsea.org.
ACKNOWLEDGEMENTS I wish to thank everyone who has helped make this report possible. The following people, in particular, deserve special mention: Dr. Dale Whittington, my Economy and Environment Program in Southeast Asia (EEPSEA) advisor, for his valuable suggestions and guidance. Dr. David Glover, the Director of EEPSEA, for his valuable comments and support. Dr. Mingsarn Kaosa-ard and the Thailand Development Research Institute staff of the Natural Resources and Environment Program, for valuable comments and information given. The parties responsible for the creation and management of EEPSEA through which the funding and material support for this research and report have been provided.
TABLE OF CONTENTS Abstract
1
1.0
Introduction
2
1.1
Dam Construction in Thailand
2
1.2
Cost-Benefit Analysis (CBA)
3
2.0
Impacts' Identification and quantification 2.1
2.2
3.0
5. 0
15
3.1
15 15 17 18 19 22
Social Surplus 3.1.1 Consumer Surplus and Producer Surplus 3.1.2 Economic Prices Economic Valuation of a Dam Project 3.2.1 Primary (Data) Approaches 3.2.2 Secondary (Data) Approach
economic valuations of impacts and appropriate valuation methods
23
4.1
24
Cost and Benefit Categories 4.1.1 Construction, Operation and Maintenance, Mitigation and Decommissioning Costs 4.1.3 Risk of Dam Failure 4.1.4 Land Acquisition 4.1.5 Externalities 4.1.6 Flood and Seawater Intrusion Control 4.1.7 Water for Irrigation 4.1.8 Hydroelectric Power 4.1.9 Net Fishery and Recreational Benefits 4.1.10 Municipal and Industrial Water Supply 4.1.11 River Navigation
24 25 25 26 26 27 27 27 28 28
Criteria for project justification
30
5.1
30 30 31 32 32 32 33
5.2
6.0
6 8 11 12 12 12 13
Economic estimation
3.2
4.0
Identification of Potential Impacts 2.1.1 Potential Negative Impacts 2.1.2 Potential Positive Impacts 2.1.3 Sunk Costs Quantification of Impacts Over Life-span of Project 2.2.1 With and Without Project Comparison 2.2.2 Non-incremental and Incremental Impacts
6
Present Value and Discount Rate 5.1.1 Economic Concepts of Discounting 5.1.2 Discounting Environmental Impacts Criteria for Project Justification 5.2.1 Net Present Value (NPV) 5.2.2 Benefit-Cost Ratio (B/C ratio) 5.2.3 Economic Internal Rate of Return (EIRR)
Sensitivity Analysis
34
6.1
34 34
Performing a Sensitivity Analysis 6.1.1 Identifying Key Variables
6.1.2 6.1.3
7.0
Calculating the Effect of Changes in Key Variables Drawing Conclusions from the Sensitivity Analysis
Recommendation of the Best Alternative
36 37
37
References
38
Appendix – Case Study: The Kwae Noi Dam Project
40
1.0
Background
40
2.0
Cost-Benefit Analysis of the KND Project 2.1 Identification of Potential Impacts 2.2 Economic Valuation 2.2.1 KND Costs Estimation 2.2.2 KND Benefits Estimation 2.2.3 Comments 2.3 Discounting and Result 2.4 Sensitivity Analysis
40 41 43 43 44 46 47 48
LIST OF TABLES Table 1.
Nine Steps in Performing a CBA
3
Table 2.
Physical Measurement of Project Impacts
15
Table 3.
Economic Valuation of Goods
18
Table 4.
Appropriate Valuation Methods For the Impacts of Dam Construction
29
Table 5.
Illustration of the Effect of Impact Classification on B/C Ratios
33
LIST OF FIGURES Figure 1.
Potential Issues Arising From Dam Construction
7
Figure 2.
Potential Impacts of a Dam Project
8
Figure 3.
How to Determine the Flood Control Benefit of a Dam Project
13
Figure 4.
Example of Non-incremental and Incremental Output
14
Figure 5.
(a) Consumer Surplus and (b) Producer Surplus
16
Figure 6.
Social Surplus
17
Figure 7.
Measuring Costs and Benefits With and Without Price Effects
20
LIST OF BOXES Box A.
Proposed Alternatives of the KND Project
41
Box B.
Costs and Benefits of the Proposed Kwae Noi Dam Project
42
Box C.
Conversion Factors
43
Box D.
The Total Value of Forest in the KND Project
44
Box E.
Results of the Feasibility Study on KND
47
Box F.
Consulting Firms’ Sensitivity Analysis
48
GUIDELINES FOR CONDUCTING EXTENDED COST-BENEFIT ANALYSIS OF DAM PROJECTS IN THAILAND
Piyaluk Chutubtim
ABSTRACT Dam construction has long provided valuable economic benefits to Thailand in distributing low-priced electricity and supporting low-income farmers by providing them with free-flowing irrigation water; this promotes domestic consumption and investment. Even though many benefits are expected from dam construction, a dam project needs to be carefully evaluated using costbenefit analysis (CBA) before approval. Decision-makers have to review the negative effects of the construction and operation of a dam. These effects are sometimes difficult to measure in monetary terms. Each impact requires the use of particular techniques to determine their monetary value; the choice depends on the characteristics of a particular impact and what relevant information is available. The primary data technique incorporates the market price approach, revealed preferences approach, and stated preferences approach. The secondary data technique is also called the benefits transfer method. An erroneously-conducted CBA can lead policy-makers to make a wrong decision on a project. Therefore, in order to provide policy-makers with accurate information and right recommendations on a project alternative, an analyst has to identify all potential project impacts, apply appropriate valuation methods and select the correct criteria. This report provides basic guidelines for analysts to conduct a proper CBA on dam projects and includes a case study of the Kwae Nai Dam in Thailand that will give useful insight into the practical applications of a CBA.
1
1.0 1.1
INTRODUCTION
Dam Construction in Thailand
Thailand has constructed many storage dams in the last three decades and will continue to construct more in the future. Because the potential economic and environmental impacts of such projects are significant, decisions to construct dams need to be based on sound analysis. In particular, they require cost-benefit analyses that are clear, comprehensive and based on accepted economic and accounting principles. Many analyses to date have had serious shortcomings that adversely affect decision-making. The purpose of this paper is to provide guidelines for cost-benefit analysis users and policymakers who commission such studies. It is hoped that this paper will lead to project appraisals that are done in a consistent and transparent manner, facilitating the comparison of alternative project options and enabling informed decision-making. The Appendix to this paper describes a dam construction case study that might have benefited from the guidelines such as those presented in this report. Dams have been built in Thailand mainly to provide low-priced hydroelectricity and water for irrigation, domestic and industrial use, and for flood control. The first storage dam in Thailand was constructed after World War II to serve the rapidly increasing demand for energy. Because Thailand does not have fossil fuel energy resources such as coal and petroleum, hydroelectricity is important as a reliable internal source of energy supply. Furthermore, Thailand relies heavily on agriculture, an economic activity vulnerable to climatic conditions, namely the monsoons. It is not uncommon for flooding of agricultural fields to occur during the monsoon season. In the dry season, there is usually insufficient water for agricultural production. A storage dam providing irrigation water during dry spells will enable multiple crop cultivation throughout the year. Theoretically, therefore, a dam project will lead to an increase in farm productivity and income. Besides the main benefits mentioned above, storage dams also facilitate river navigation, protect against seawater intrusion, and provide fishery and recreational benefits. These benefits are specific to particular projects and their locations. Dam construction, however, entails a huge investment cost and often requires diverting rivers. This, in turn, affects existing user rights and access to the water, and therefore has significant impact on livelihoods as well as the environment. The debate on the pros and cons of dams is overwhelmingly complex. The issues are not confined to the design, construction and operation of dams, they are also about social, environmental and political choices which aspire towards the development and improvement of the well-being of people 2
(World Commission for Dams, 2000). For example, the relocation of people from inundated areas to resettlement sites often causes the evacuees to suffer from the allotment of poor agricultural land with the usual shortage of water and inadequate facilities. When dams are built solely to provide hydroelectric power, all other purposes of water usage become secondary, leading to a conflict among the water users and ultimately, to inefficiency of such projects. Multi-purpose dam projects in Thailand normally involve three government agencies: the Royal Irrigation Department (RID), the Electricity Generating Authority of Thailand (EGAT) and the National Energy Policy Office (NEPO). These agencies are respectively responsible for providing irrigation water, producing electric power and managing the country’s energy resources. They need to be provided with sound economic analyses on dam projects in order to determine the net social welfare value of each. 1.2
Cost-Benefit Analysis (CBA)
A cost-benefit analysis (CBA) is an economic evaluation technique. It can be used to appraise whether a dam project is worth undertaking and it can be used to determine its optimal size. Since the 1970s, CBA has become the World Bank’s dominant decision support system for project appraisal. It is used to evaluate all costs and benefits of a dam project, and to determine whether the project if undertaken, will be able to improve the social welfare of all those concerned, individually and collectively. According to Boardman (1996), the main steps for performing a CBA of a dam construction project are as follows: Table 1. a. b. c. d. e. f. g. h. i.
Nine Steps in Performing a CBA
Define a referent group. Select a portfolio of alternative projects. Identify potential (physical) impacts of the project. Predict quantitative impacts over the life of the project. Monetize all impacts. Discount for time to find present values. Sum: Add up benefits and costs. Perform sensitivity analysis. Recommend the alternative with the largest net social welfare value.
3
(a)
Define a referent group
Project analysts have to define a group of individuals whose welfare will be accounted for when assessing the costs and benefits of a particular project. The referent group does not always comprise all the people affected by the project. In Thailand, however, water resource development projects are undertaken from a national perspective. Therefore, the referent group is the entire population whose welfare is taken into account. However, dams on international rivers such as the Mekong, present special problems as the people affected are not confined to those in Thailand. An analyst should therefore be aware of the political ramifications of a project on neighbouring countries affected even if such impact is exclusive of project costs and benefits. (b)
Select a portfolio of alternative projects
In a dam project, the range of alternatives is subject to its dimensions. The following dimensions are commonly found in water development projects: • Timing: Could the dam project be delayed to a later date1? • Hydropower plant option: Could the dam also be built for hydroelectricity purposes? • Material: The dam could be made from various materials such as earthfill, rockfill or concrete. • Size: The dam could be made according to different heights and capacities. • Mitigation measures: This could include the fish ladder option where the dam could be built with or without fish ladder to mitigate negative environmental effects. In practice, it is useful initially to consider an expanded choice set. A brainstorming session at an early stage will help expand the range of options. In this step, analysts need to select a small sub-set of the most attractive project alternatives. The specific characteristics of each alternative are essential for the scientists, engineers, ecologists, socialists and economists involved in the project concerned to estimate its costs and benefits.
1
A delay in the commissioning date of a project will lead to increased interest accumulated on funds and a delay in revenues accruing to the owner from the completed project.
4
(c)
Identify potential (physical) impacts of the project
Once the project has been specified, all the experts in the relevant fields involved will identify the potential impacts of the project. At this stage, all direct/indirect and tangible/intangible impacts must be fully described. (d)
Predict quantitative impacts over the life of the project
Dam projects have impacts over extended periods of time. Analysts have to predict the magnitude of all impacts in terms of measurable units over the life of a particular project. For instance, the area of irrigation, the amount of electricity and the amount of water supply can be measured in terms of Rai, KWH (kilowatt hour) and cubic metres respectively. If there are any impacts that cannot be quantified or measured in physical units, for example, social and cultural impacts, analysts should provide descriptive information on them. Sometimes, the required information may not be available for prediction. In such a case, analysts will have to make certain assumptions to estimate anticipated impacts. (e)
Monetize all impacts
In this step, analysts have to put all impacts in monetary terms so that the costs and benefits can be compared. Market prices may not be appropriate because they are not adjusted for subsidies, taxes, environmental and social externalities and therefore do not reflect the true value or opportunity costs of these impacts. In economic analysis, ‘shadow prices’ are used instead to assess the net benefits of investment. (Details of this are discussed in Sections 3 and 4.) (f)
Discount for time to find present values
Before adding the positive and negative impacts of a dam project, the monetary costs and benefits that occur at different time periods have to be adjusted. Future costs and benefits have to be discounted by a social discount rate so that they are comparable as if they were evaluated on the same time base. (g)
Sum: Add up benefits and costs
All discounted costs and benefits will be summed up to obtain the projected net benefits. The results of the appraisal are then presented in the forms of Net Present Value (NPV), Benefit-Cost Ratio (B/C ratio) and Internal Rate of Return (IRR). Where there is only one potential project, it is viable to proceed with that project if the NPV of social benefits is positive, the B/C ratio is greater than 1 and the IRR is larger than the social discount rate.
5
(h)
Perform sensitivity analysis
This step attempts to deal with uncertainty. Sensitivity analysis will be performed with respect to uncertain variables that have been identified, such as the magnitude of impacts and the valuation per unit of impact. (i)
Recommend the alternative with the largest net social welfare value
Finally, the analysts have to make a recommendation on the most efficient project that gives the highest positive net benefit value. The traditional CBA is criticized in that it does not fully capture the intangible impacts such as social costs or environmental damage that cannot be measured in monetary terms. Valuation techniques known as extended cost benefit analyses have been developed to take these intangible impacts into account. Another criticism is that the result of a CBA might be biased because project managers tend to overestimate benefits and underestimate costs in order to make a project viable. These guidelines will not go into the details of each step of a CBA. Rather, they will focus on how to make economic valuations and interpretations according to economic criteria. While it is known that a CBA is perfectly consistent with economic principles, it is a very costly and time- consuming process, particularly in the valuation of costs and benefits. These guidelines aim to assist project analysts and commissioning bodies in conducting cost-benefit analyses in a more practical and efficacious manner. The Kwae Noi Dam (KND) Project, an approved water development project in Thailand, was selected as a case study to illustrate a CBA. The consulting firms’ report was rejected a number of times by the Project Committee. Although these guidelines do not provide the latest version of that report, this project is nevertheless a good example because the consulting firms tried to include externalities in terms of environmental impacts in the appraisal. 2.0 2.1
IMPACTS IDENTIFICATION AND QUANTIFICATION
Identification of Potential Impacts
The main purposes of dam construction in Thailand are power generation and irrigation. The positive impacts are obviously tangible, while many negative impacts particularly social and environmental losses, are intangible and difficult to estimate. For a CBA to reflect the true value of the project, all tangible or intangible impacts have to be accounted for in the analysis. An omission of any impact will make the CBA biased and fail to properly determine the economic efficiency of the project. 6
After a set of alternatives is identified, analysts should define the impacts and express them in physical units. A dam construction involves many social issues as shown in the diagram presented below and prepared by the World Commission on Dams (WCD).
Energy options
Water Supply
Recreation
Sedimentation
Greenhouse Gas Emissions (from flooded vegetation)
Flooded habitats culture and homes
Maintenance or Decommissioning Displaced People Protest
Hydropower for electricity
Environmental Flow Requirement
Licensing issues Loss of Downstream Aquifers River Bank Erosion
Trans-boundary water competition
Loss of Livelihood from fisheries
Salinity Waterlogging
Food from irrigation
Source: The World Commission on Dams (2000)
Figure 1. Potential Issues Arising From Dam Construction There are various impacts of a dam construction that depend on factors such as the type, design and location of the dam. The potential impacts of a dam are shown in Figure 2 below.
7
Potential Impacts of a Dam Project Impacts
Negative Impacts
1. 2. 3. 4. 5.
Physical costs Resettlement cost Risk of dam failure Land acquisition Externalities
Positive Impacts
1. Hydroelectric power 2. Irrigation water 3. Reduction of flood losses and seawater intrusion damage 4. Municipal and industrial water supply 5. Net benefits to/from fishery & recreational facilities 6. River navigation
Figure 2. Potential Impacts of a Dam Project 2.1.1
Potential Negative Impacts
Physical Impacts (Costs) Physical impacts are composed of construction, operation and maintenance, mitigation and decommissioning costs. (a)
Construction
Project construction consists of the dam, the irrigation system and the spillway. Engineers need to describe total inputs incurred over the life of the project and state them in common physical units for valuation. (b)
Operation and Maintenance (O&M)
This covers all services and materials used such as engineering and employment services, and fuel when a dam is in operation. (c)
Mitigation
This cost is incurred when a policy-maker wishes to reduce the adverse effects of the project. Dams change river flow. This affects the livelihood of people who live in the reservoir area and even downstream 8
users. Examples of mitigation measures include the building of fish ladders to enable fish to go upstream to lay eggs, or planting trees in other areas to replace trees cut down to make way for the dam. (d)
Decommissioning2
This impact is not typically included in an economic analysis. It will occur at the end of the life of a project when the dam is no longer useful. It refers to the removing of the dam and restoring the river to its pre-dam state. This is necessary for safety and environmental reasons. Decommissioning dams will restore fisheries and riverine ecological processes. Inappropriate removal will however, create negative impacts on downstream aquatic life due to the sudden flush of sediments accumulated in the dam reservoir. The cost of decommissioning depends on the type of decommissioning method/s used, the expected project life, the structure of the dam and the characteristics of the project area. Decommissioning impacts are rarely included in a CBA due to several reasons. Firstly, a dam could be rebuilt instead of being decommissioned. Secondly, if the reservoir suffers from serious siltation, decommissioning is unlikely to ever return the site to its original environmental condition. Rebuilding the dam will not be possible in this situation either. Thirdly, the value of decommissioning would be very small after being discounted because this impact will only occur at the end of the project. Resettlement Dam construction can have severe and widespread effects displacing whole communities from construction and inundation areas and disrupting patterns of communication, social and economic systems as well as land-holding and resource use. Land leased for construction also has to be accounted for as a project resettlement cost. In any event, the affected people are eligible for compensation and rehabilitation. Risk of Loss due to Dam Failure There is a possibility that a dam might fail. Dam failure means the collapse or movement of part of a dam or its foundation, so that the dam cannot retain water (International Commission on Large Dams, ICOLD, 1995). According to ICOLD, the rate of dam failure has been falling. The general causes of dam failure are overtopping, internal erosion in the body and in the foundation of the dam. Sometimes insufficient spillway capacities induce the failure as well. Moreover, large dams may actually increase the risk of earthquakes. This would also increase the risk of catastrophic dam failure at the site.
2
See references 24 and 25 for details on decommissioning. 9
The availability of time series hydrological data is significant to properly calculate the possibility of dam failure and expected loss of lives and property downstream. This risk has to be accounted for as a negative impact of the project. Land Acquisition The land acquisition impact is the loss of forest, agricultural and residential lands. Since the loss of agricultural land and residential areas is accounted for under resettlement costs, the cost of land acquisition focuses on forests. The government need not pay anything to obtain the right to use national forests because these are considered public property. There is however, an economic opportunity cost in that if a dam were not constructed, the forest could be used for other purposes. This opportunity cost has to be accounted for. Deforestation results in the loss of both direct and indirect uses of the forest. The latter include ecosystem and biodiversity conservation and carbon sequestration. Direct uses stem from forests being a source of timber, non-timber forest products, and wildlife. All these can be sold as commercial goods or consumed by local households. The loss of forest uses is accounted for as external costs. Externalities An externality is defined as a cost or a benefit resulting from some activity or transaction that is imposed or bestowed upon parties outside the activity or transaction. The likely external impacts of a dam construction are as follows: (a)
Greenhouse Gas Emission
One possible externality of a dam project is the release of greenhouse gas from the decomposition of organic matter in reservoirs. This will have an adverse effect on global climates. However, although a dam construction does not only have a negative impact on climatic changes through deforestation and degradation of bio-mass in a reservoir, it also provides a positive impact through the fact that the use of hydroelectric power releases less greenhouse gas than other energy sources. (b)
Social and Cultural Impacts
These include losses of historical or cultural sites, community fragmentation and the erosion of cultural identity. (c)
Waterlogging and Salinity
Waterlogging and salinity can have an adverse impact on agricultural production by the rise of groundwater brought about by
10
surface water. When water tables are close to the surface, capillary action draws salts naturally occurring in the soil profile to the surface. Salinisation will reduce yields of crops that do not tolerate high salinity levels. It is commonly found in several reports that a dam construction will increase the spread rates and the number of victims of water-borne diseases. In fact, analysts need to carefully consider how a dam project may affect public health conditions – both positively and negatively. Not all the effects on public health are necessarily negative. An increase in the supply of water for municipalities could well result in public health improvements. 2.1.2
Potential Positive Impacts
Hydroelectric Energy A storage dam is able to supply electric power by installing hydroelectric power generators. Before releasing water for irrigation purposes, electric power is generated by running the water through turbines, generators and transformers. This hydroelectric power provides low-priced energy to meet increasing demands in urban and rural areas. Irrigation Water Irrigation is an important component in agricultural production. The actual benefit derived depends on the physical performance of water delivery, area irrigated, crop intensity, crop patterns and crop yields. Municipal and Industrial Water Supply Water consumption is expected to increase with population growth and economic development. Water is diverted from irrigation canals to serve municipal and industrial demands for water or to supplement other sources of water supply. Water resource managers use reservoirs to increase downstream water flow during a dry season, thus flushing out pollutants from downstream channels-better. This would improve water quality for downstream residents. Reduction of Flood Losses and Seawater Intrusion Damage Dams are used to control floods by storing rain water in the reservoir and then releasing it slowly over time (WCD, 2000). The flood control benefit comes from the reduction of the flood level. Loss of lives and property in downstream areas can thus be reduced or prevented. It is important to know the frequency of floods in order to make an economic evaluation of expected flood damages.
11
During dry seasons, rivers dry out and seawater may intrude into them. A storage dam can protect the intrusion by releasing water to drive seawater out of the rivers. Fishery and Recreational Benefits from Reservoirs Besides the primary benefits of a multi-purpose dam such as providing irrigation water and hydroelectricity, dams can provide secondary benefits like recreational and fishery facilities. Normally after the construction of a reservoir is completed, the Department of Fishery will start breeding fish in it for the villagers. Therefore, income from the fishery and recreational facilities should be included in the project’s analysis as benefits. Nevertheless, recreational and fishery benefits can still be obtained even without the project, from free flowing water. Hence, the net impact of the project on fishery and recreation can be either positive or negative. River Navigation When the dry season is severe, rivers dry up. A storage dam can fill rivers up to a level sufficient for transportation for the benefit of the local people. 2.1.3
Sunk Costs
A sunk cost can be defined as a cost that has already been incurred by the time a decision to resume a project is made. Since this cost will not be changed by future decisions, it is excluded from the economic analysis being conducted. 2.2
Quantification of Impacts Over Life-span of Project
Once all impacts have been identified, analysts have to quantify them into physical terms. The two basic principles are as follows: 2.2.1
With and Without Project Comparison
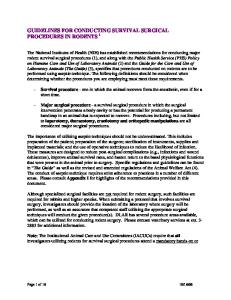
In economic terms, costs and benefits have to be described in terms of marginal values. This means that analysts have to compare the actual net benefit values of the status quo or ‘without-project’ situation with those of the ‘withproject’ situation. (The without-project situation is the one which would prevail without the project.) Very often, analysts compare the net benefit flows in the before-situation and in the after-situation. This can prove to be misleading as illustrated in the example in Figure 3.
12
LEVEL OF FLOODING Without Dam (Status quo) C n
Before
A
m With Dam
B
TIME
O t0
t1
Figure 3. How to Determine the Flood Control Benefit of a Dam Project Before the project is completed, the level of flooding is OA at the time t0. After the time period t0 to t1, the level of flooding would be OC without a dam
project; but only OB with a dam project. Therefore, analysts sometimes conclude that the impact of flood control is the reduction in the flooding level represented by ‘m’ or AB . In fact, the impact of the project should be ‘n’ or BC . This is the true difference in the flooding levels between the without-project situation and the with-project situation. The net benefit of the project would therefore, be underestimated if the analysts relied on the former method of calculation rather than the latter. 2.2.2
Non-incremental and Incremental Impacts3
Non-incremental outputs are project outputs that replace existing water production or supply. For example, a water supply project may replace existing supply from household or community wells. Therefore the net social water supply is constant. Incremental outputs are project outputs that add to existing supply to meet new demands. For example, this will be necessary if and when the demand for water increases in the case of a real decline in the cost of water supply or tariffs. Non-incremental inputs are inputs that are not met by an expansion of overall supply but from existing supplies. For instance, water to a new industrial plant may be supplied by diverting water away from existing agricultural outlets. Incremental inputs are those that meet project demands through an overall expansion of the water supply system. 3
See references 1 and 3 for details on incremental and non-incremental impacts. 13
Price
P0
MC0 a
b
MC1
P1
D Q0
Quantity
Q1
Figure 4. Example of Non-incremental and Incremental Output In the example shown in Figure 4, the demand for water supply is downward sloping. The current marginal cost of water is MC0. People pay a price equal to P0 and the quantity consumed is equal to Q0. When the project is completed, it provides water at a lower marginal cost, MC1. The equilibrium price reduces to P1 and the quantity increases to Q1. The total quantity of consumption met by the project (Q1) can be divided into two types of outputs. The first is non-incremental output referring to the amount of water consumed, Q0, when the marginal cost was MC0. When the project is completed, it benefits the people who consume this amount of water by allowing them to pay for it at a lower price. The benefit of non-incremental output is represented by the shaded area ‘a’ in Figure 4. The other is incremental output referring to the increase in consumption (Q0Q1). The project creates the opportunity to consume more, for people having a willingness to pay less than the original price (P0). The benefit of incremental output is represented by the shaded area ‘b’. All impacts have to be quantified in physical terms as shown in Table 2. For instance, the loss of land has to be estimated in terms of area units or the resettlement payments have to be calculated in terms of physical property units.
14
Table 2.
Physical Measurement of Project Impacts
Negative Impacts
Measurement
1. Physical costs (Construction, O&M, Mitigation and Decommissioning Costs) 2. Resettlement cost 3. Risk of dam failure 4. Land acquisition - Deforestation
- Loss of biodiversity, species extinction - Loss of carbon sequestration 5. Externalities - Greenhouse gas - Social and cultural loss - Waterlogging and salinity Positive Impacts
Electricity Net fishery and recreation Water supply River navigation
3.0 3.1
Physical property (e.g. # of houses) Physical property (e.g. # of houses) Area unit (e.g. Rai, hectare, acre) - Volume of timber, units of NTFPs (non-timber forest products) and wildlife - Depends on project site -Volume of carbon emission - Volume of greenhouse gas emission - Depends on project site - Decrease in farm productivity Measurement
1. Flood and seawater intrusion control 2. Irrigated water
3. 4. 5. 6.
Units of employed inputs
Level of flood, days of flood Cubic metre of water (Expansion of irrigation area and multiple crop cultivation) KWH/year Day visit - day loss / tonnes of fish Cubic metre of water Transportation time saved
ECONOMIC ESTIMATION
Social Surplus
A cost-benefit analysis (CBA) is an economic tool that guides decisionmakers on how to allocate social resources in the most efficient way. Economic efficiency can be measured in terms of ‘social welfare’ or ‘social surplus’. An alternative that provides the maximum social welfare benefit is considered to be the most efficient option. 3.1.1
Consumer Surplus and Producer Surplus
From the economic point of view, an economy consists of two groups of people: consumers and producers. Hence the net social benefits or social welfare
15
is the summation of the net benefits to consumers and the net benefits to producers. The net benefit to a consumer is equal to the difference between what the consumer is willing to pay and the actual payment, known as ‘consumer surplus’. The marginal benefit of a good or the marginal willingness to pay for a good is represented by a demand curve. Consumer surplus is the difference between the area under this demand curve and the area representing actual payment. It is shown by the shaded area in Figure 5 (a).
(a)
(b)
Price
Price S = MC Producer Surplus
Consumer Surplus P*
P*
D = MB = WTP
Q*
Note:
Quantity
Q*
Quantity
P* = Equilibrium price, Q* = Equilibrium quantity D = Demand for goods, MB = Marginal benefit, WTP = Willingness to pay, S = Supply of goods, MC = Marginal cost
Figure 5. (a) Consumer Surplus and (b) Producer Surplus Likewise, the net benefit to a producer known as ‘producer surplus’ is equal to the difference between the total revenue a producer receives for a good and the total opportunity cost of producing that good. Marginal opportunity cost of a good is given by a supply curve. Producer surplus is represented by the shaded area in Figure 5 (b). As shown in Figure 6, the net social benefit or social welfare is the summation of consumer surplus and producer surplus. Any change in consumer surplus or producer surplus will obviously affect social welfare. For measuring the change in social welfare, the demand and supply functions must be known and a set of economic prices must be used for economic valuation.
16
Price
Net Social Benefit = Social Surplus
S = MC
P*
D = MB = MWTP
Q*
Quantity
Note: P* = Equilibrium price. Q* = Equilibrium quantity S = Supply of goods, MC = Marginal cost, D = Demand for goods, MB = Marginal benefit, MWTP = Marginal willingness to pay
Figure 6. Social Surplus 3.1.2
Economic Prices
In a CBA, after the physical impacts of the project have been identified and quantified, they must be valued in common units in order to estimate the change in social welfare. Analysts have to determine economic prices in order to attach monetary terms to physical impacts. The prices should reflect society’s willingness to pay for goods and the opportunity costs incurred by society in producing these goods. In a perfectly competitive market where all agents are price-takers, with no externalities associated with production and consumption of goods, and no government intervention (taxation, subsidization, floor pricing or ceiling pricing), equilibrium prices indicate the marginal social benefit and marginal social cost of production. Only in this case, will market prices or financial prices accurately reflect economic prices. Most impacts of a dam project however, are not traded in that kind of market situation. Rather, they are transacted in markets with distorted and imperfect competition. In addition, some services (like flood protection programmes) can be characterized as public goods for which individuals’ preferences cannot be revealed by market forces. Market failures result in an incorrect set of market prices that inaccurately represent marginal social costs and benefits and leads to inefficient allocation of resources. Therefore, project analysts have to adjust these incorrect market or financial prices before assessing the project. For instance, taxes and subsidies should be eliminated from market prices because they are only income transfers within the economy while external 17
costs and benefits of the project should be included because they are important factors affecting social welfare. Once the prices are adjusted, they will reflect true resource scarcity and will be more accurate for the purpose of economic calculation. Such a modified price is known as a ‘shadow price’ or an ‘accounting price’. In the case where market operations are completely absent and economic prices cannot be derived, economic valuation techniques must be undertaken to derive the value that represents a consumer’s willingness to pay (WTP) or the opportunity cost. ‘Revealed preferences’ and ‘stated preferences’ are wellknown approaches for the valuation of non-marketable goods. Table 3.
Economic Valuation of Goods
Undistorted
Distorted (by government intervention)
Perfectly competitive market
Market prices
Shadow prices
Non-competitive market
Shadow prices
Shadow prices
Market totally absent
3.2
Revealed or stated preferences approaches
Economic Valuation of a Dam Project
Economically, all impacts of a dam project should be valued in economic prices. Sometimes shadow prices are necessary for accurate economic estimations where market imperfection and distortions exist. However, shadow price determination is very complex, time consuming and costly. This is the reason why many analysts do not calculate shadow prices for valuation even though they are more conceptually correct for economic analysis. In industrialized countries, information on shadow prices is normally available from government bodies. This facilitates economic valuation. Developing countries, however, have very limited information on shadow prices. Therefore it is difficult for project analysts in these countries to properly determine the economic value of a project’s impacts. These guidelines provide some practical methods that can be applied for different categories of impacts resulting from dam construction. The valuation methods depend on the nature of the impacts and the availability of information.
18
3.2.1
Primary (Data) Approaches
There are three primary approaches for cost and benefit valuation: (a) market price, (b) revealed preferences, and (c) stated preferences. (a)
Market Price Approach
When the economy is open and the market is uncontrolled and undistorted, it is acceptable to use the market price for valuation purposes. Dam project impacts that can be valued using the market price method are capital goods, operation and maintenance costs, hydroelectric power supply, water supply, commercial fishery, commercial recreation, commercial timber and nontimber forest products, commercial wildlife and property losses. This approach is best applied in cases where additional outputs supplied by the project or additional inputs required by the project have some influence on their market prices. The details of price effects are shown in Figure 7.
19
1.
Price D
D+q’
P0
S a
Quantity
Measuring costs without price effect
If a market has a horizontal supply curve and q’ units of inputs is bought, the demand curve, D, will shift to the right by q’. As marginal costs represented by S are constant, the price remains at P0. Consequently, the opportunity cost to society ( a) equals the amount that the project has to pay (P0 x q’).
q’ Price
2. D
D+q’
S
P1 P0
b
Quantity
Measuring cost with price effect
When a large quantity of resources is required, the price will rise because the supply is upward sloping. The change of social cost ( b) is less than the amount that the project has to pay (P1 x q’). Hence, the true opportunity cost can be calculated from [(P0+P1)/2] x q’.
q’ Price
Measuring benefit without price effect
3.
S S+q’
P0
Figure 7. Measuring Costs c
If a project faces a horizontal demand schedule, D, the market price, P0 will be constant when the project adds a quantity q’. D Therefore, the change in social surplus ( c) * and Benefits equals With the andproject’s Without Price x q’). revenue (P0 Effects Quantity
q’ 4. Price
Measuring benefit with price effect
S D
S+q’
P0 P1
d
If a project faces a downward sloping demand, D, the market price will decrease to P1 when the project adds a quantity q’. The change in social surplus ( d – whole shaded area ) is greater than the project’s revenue (P1 x q’). The project benefit can simply be estimated from [(P0+P1)/2] x q’.
Quantity q’ Source: Boardman et al. (1996) pp.68-80
Figure 7. Measuring Costs and Benefits With and Without Price Effects
20
(b)
Revealed Preferences Approach4
Several impacts, particularly the project’s externalities do not have any trading market. Economic valuation approaches such as revealed preferences and stated preferences would be more appropriate for assessment. The revealed preferences (or indirect) approach does not measure environmental values directly but does so through the price of other goods. Because an individual’s willingness to pay for environmental goods and services cannot be directly observed, the approach seeks to assess an individual’s willingness to pay by revealing individual preferences to proxy variables. There are several methods used in the revealed preferences approach and these are briefly described below. Analysts can assess the benefits of hydroelectric power supply, water supply, flood control or river navigation by using what is known as the ‘replacement cost method’ (RCM). Benefits are estimated from the lowest costs of alternative means of producing goods and services to replace those affected by the dam. A project’s benefits as well as its costs, such as the value of resettlement compensation for property losses, can be valued using this method. Besides the replacement cost method, there is another indirect method called the ‘travel cost method (TCM)’ used to assess the benefits of subsistence fishery and recreation. This method estimates the costs incurred by an individual visiting the site. It is assumed that the individual’s time spent, travel costs, entry fees, on-site expenditure and outlay on necessary capital equipment (for personal use such as boats and fishing rods), represent the individual’s willingness to pay, and therefore the value of the benefit of the good or service. The ‘hedonic property model’ (HPM) is another approach that can be used to evaluate environmental benefits (such as recreation) and costs. The basic assumption is that a buyer’s attitude toward an attribute of a property reflects the willingness to pay for the use of the property. When certain variables are controlled, the remaining price difference (between property in different surroundings) is the value of the environmental effect. For instance, the price of a house in normal surroundings less the price of house in an area with bad odour equals the value of the bad odour. This can be considered as a cost of a project producing bad odour or as a benefit of a project reducing bad odour. Lastly, the ‘factor income method’ (FIM) estimates project impacts as inputs of production. Project benefits can be measured from incremental income earned. For instance, irrigation water can help farmers make higher profits. Hence, the marginal profit can be taken as a value of irrigation water.
4
See references 8 and 9 for details on economic valuation techniques. 21
(c)
Stated Preferences Approach
When a market is totally absent, analysts may use the revealed preferences approach as an indirect technique to reveal individual preferences. However, the information obtained from this would not include proxies representative of goods and services that are difficult to observe such as the value of the ecosystem, the value of undisturbed wildlife or the value of climatic changes. In this case, the stated preferences (or direct) approach should be used to derive the economic values of these non-tradable commodities. This approach measures consumers’ preferences directly by asking people how much they are willing to pay (willingness to pay: WTP) for environmental protection/improvement, or how much they are willing to accept (willingness to accept: WTA) for a worse environment. This approach encompasses the widely accepted ‘contingent valuation method’ (CVM). Analysts have to create a hypothetical market and provide a description of the goods and services being valued. Visual aids and information about substitutes for the goods and services are essential in helping respondents accurately assess the hypothetical market and their willingness to pay. 3.2.2
Secondary (Data) Approach5
In a CBA, environmental costs and benefits cannot be valued simply. Even though the environment has value, it cannot be priced as there is no market for it. Therefore it is necessary to assess consumer preferences. The two special valuation approaches used to determine consumer preferences: the stated preferences and revealed preferences approaches both require large amounts of primary data to obtain accurate results. When there are time and budget constraints, environment values may be estimated from existing studies or secondary data. This method is known as ‘benefit transfer’. Estimated environmental costs or benefits from relevant studies are used to estimate the costs and benefits of a similar environment in a specific area. The area that has been studied and which will be the source of information is called ‘the study site’. The area to which the information from the study site will be ‘transferred’ is called ‘the policy site or project site’. The benefit transfer method requires the necessary assumption that the overall population of the study site is similar to that of the project site. The transferred value must be used for the same kind of environment and the same terms of value must also be used. For instance, if a tourism benefit of the environment was estimated in terms of WTP in the study site, it has to be transferred to the project site as a tourism value in terms of WTP as well. The value cannot be used for other benefit estimations or as WTA. 5
See references 5, 8, 9 & 15 for details on benefit transfer.
22
The benefit transfer method can be categorized in two ways. One is a ‘unit value transfer’ in which an average environmental value per person or per household from the study site is transferred to estimate the environmental value of the project site. The transferred value may require some adjustment for socioeconomic factors such as level of income. The other is a ‘function transfer’. This method involves the transfer of the WTP or WTA function of the study site to assess similar function/s in the project site. The strength of this method is that it is more accurate than the unit value transfer in that the whole set of data used for the WTP/WTA functions is transferred. However, if the WTP/WTA function of the study site was estimated by the TCM or CVM, the low coefficients used will cause inaccuracy. An estimation from such a WTP function can lead to uncertainty (Du Y., 1999). In such a case, the unit value transfer method would be more appropriate. The benefit transfer method may provide a less accurate value than primary data techniques such as the TCM or CVM. For instance, some economists are not in favour of using the benefit transfer method because its validity and reliability are subject to existing studies and these are only very few. In addition, the reliability of the benefit transfer method also depends on the nature of the values estimated. For example, the transferred value of recreation benefits would be more reliable than that of the ecosystem or non-use value because of its less complex nature and also because there are many studies on recreational benefits presently available. Furthermore, the benefit transfer method is not appropriate for pollution tax rate determination because this requires the precise value of environmental impacts; this method only estimates rough values. It could, in this context, be useful for a cost-benefit analysis that does not require very accurate measures. The method is also suitable for urgent studies or low-budget projects when analysts have to make decisions under time pressure or other constraints. It can give policymakers a quick overview of the magnitude of environmental problems.
4.0
ECONOMIC VALUATIONS OF IMPACTS AND APPROPRIATE VALUATION METHODS
This section will examine the economic valuations of each impact of a dam project and provide details of appropriate valuation methods that are practical and consistent with economic appraisal principles.
23
4.1
Cost and Benefit Categories 4.1.1
Construction, Operation and Maintenance, Mitigation and Decommissioning Costs
Construction and operation and maintenance costs involve all expenditure on capital goods, materials and labour. If these inputs are traded in a perfectly competitive market without government intervention, they can simply be valued according to market prices. However, where the government regulates the minimum wage rate, the monetary wage has to be adjusted so as to reflect the true economic opportunity cost of labour. For example, if the minimum wage rate is 100 baht per day but an unskilled worker in a rural area gets paid 80 baht per day, this means that the economic factor is 80/100, which equals 0.8. The monetary wage rate of 80 baht must now be multiplied by 0.8 which gives the result of 64 baht – this is the true economic value of the wage. Any distortion by taxation and subsidization has to be eliminated. However, a pollution charge for correcting externality problems is exempted from this calculation because the market price with pollution tax would already reflect the true opportunity cost of using the environment as a factor of production. Mitigation and decommissioning costs are project-specific and are dependent on the effectiveness of mitigation measures. These costs include engineering services and capital investment in equipment such as fish ladders. If a policy-maker is not certain whether or not to implement mitigation measures, analysts should put forward the mitigation options as project alternatives. The economic valuation of mitigation costs can be conducted in the same way as for construction and operation and maintenance costs. 4.1.2 Resettlement Costs Resettlement costs are composed of two parts: compensation and assistant expenses (all expenses other than compensation for resettlement, for example, transportation costs, public health programmes, etcetera.) Economic resettlement costs cannot be calculated from the legal payment of compensation because the latter may be greater or lesser than the amount people are willing to accept. Compensation can be calculated directly from physical property losses. Analysts may use the market price method to arrive at the value of property losses. Compensation costs can also be estimated using the replacement cost method by valuing the cost of replacing existing assets affected by the dam construction, with alternatives of equal value. Nevertheless, the estimation of welfare loss based on physical property losses or replacement costs is likely to be underestimated because a property is worth more than just its physical value to the people who own them. The stated preferences approach can be used to determine the willingness to accept (WTA) compensation for people who need to be resettled. 24
Resettlement assistant costs valuation can be conducted in the same way as for construction, operation and maintenance, and mitigation costs. 4.1.3
Risk of Dam Failure
There is a possibility that a dam might break. The value of the risk may be estimated from the amount of losses expected. The value of losses and dam breaking possibilities must however, first be assessed. The losses of downstream properties due to dam failure can be assessed by the market price method or replacement cost method. The risk of the dam breaking can be estimated from historic records and by scientific techniques. Currently, the possibility is less than 0.5. A sensitivity analysis may be conducted to cover the whole range of possibilities of dam failure. The expected value analysis is appropriate only if people are risk neutral. People are however, risk averse with respect to flood damages. This being the case, the risk value derived from an expected value estimation will be underestimated. 4.1.4
Land Acquisition
A reservoir construction normally inundates agricultural and residential land and forests. Agricultural and residential land can be valued by the market price method and their value is likely to be included under resettlement costs. Hence, this category shall focus on forests. A forest is considered a non-marketable and multiple-use resource. Its economic value is composed of its direct-use, indirect-use and non-use values. All potential benefits of the affected forest should be defined before assessing its economic value because different valuation techniques apply to different potential forest benefits. (a)
Commercial and Subsistent Timber and Non-timber Forest Products, and Wildlife
Analysts have to first determine if the direct uses of forest are commercial or subsistent. If they are commercial, the market price approach is the appropriate technique. On the other hand, if they are subsistent, the revealed preferences and stated preferences approaches would be more appropriate. (b)
Ecosystem and Biodiversity Losses and Species Extinction
The loss of a forest can cause species extinction as well as ecosystem and biodiversity losses. The value of these losses can only be measured by the stated preferences approach because there is no market for environmental services. Analysts may conduct a survey with a hypothetical market in which the ecosystem, biodiversity and species are preserved. The willingness to pay for the
25
conservation of this hypothetical market can then be assessed. The average willingness to pay (measured in baht) multiplied by the number of people affected provides an estimate of the loss in consumer surplus or the social cost to the ecosystem and biodiversity resulting from forest depletion. (c)
Carbon Sequestration
Analysts can estimate the impact of climatic changes from the level of carbon emission. The price of carbon emission can be obtained from carbon tax rate if any. Global warming causes property damage so the replacement cost method and stated preferences approach would be appropriate valuation techniques to assess the costs of such damage. 4.1.5
Externalities
The possible external impacts from a dam construction are as follows: Greenhouse Gas Emission The same valuation techniques as used for carbon sequestration may be used here. Social and Cultural Losses A reservoir of a dam project may inundate a whole community or historical site. The contingent valuation method is the most appropriate tool to assess peoples’ willingness to pay to conserve such a site. Waterlogging and Salinity Because this externality is likely to have adverse effects on farm productivity, the estimation of this impact is normally included in the prediction of change in farm productivity. (See 4.1.7 below.) 4.1.6
Flood and Seawater Intrusion Control
The benefits of flood and seawater intrusion control can be estimated in two ways. The first is the ex post approach. The benefits can be assessed from losses of property caused by flooding or seawater intrusion, using the replacement cost method. The second way is the ex ante approach. Here, the benefits can be estimated from what people are willing to pay for protection from floods or seawater. The stated preferences approach would be the appropriate choice here.
26
4.1.7
Water for Irrigation
The net benefit of irrigation water is complicated to estimate, but is normally measured by the incremental income earned by farmers, this being the difference between the farmers’ net earnings with irrigation and farmers’ net earnings without irrigation. The factor income method is therefore appropriate here. Analysts must have information on production functions, cost functions and profit functions. Subsidized prices of agricultural products should not be used here. Shadow prices should be applied instead. The market price approach is more appropriate for calculating the consumers’ willingness to pay. If the outputs are exported, farm prices should be derived from border prices less marketing costs. If the outputs are not exported, farm prices should be derived from local prices less marketing costs. 4.1.8
Hydroelectric Power
Typically, a market for electricity is imperfect and its market price does not therefore reflect its real social opportunity cost. Hence shadow prices or the marginal opportunity cost of electricity has to be used. Analysts must identify how large the proportion of electricity produced by the dam is compared to the amount of electricity in the whole economy. If the proportion is very large, it can alter future market price6 of electricity. The benefits of hydroelectricity can also be measured by the replacement cost method which would calculate, the cost of the next best option to generate the same amount of electricity. For example, a gas turbine power plant could be a good substitute for a hydroelectric power plant. Therefore, the cost of setting-up a turbine power plant, with all its related services and externalities such as air pollution, could be used to estimate the value of hydroelectric power. 4.1.9
Net Fishery and Recreational Benefits
A dam construction is expected to destroy the recreational and fishery benefits of a free-flowing river. These benefits, however, will be created in the reservoir area. To estimate fishery benefits, the cost of catching fish must ascertained. The factor income method is preferred if the fishery benefits are commercial. The stated preferences approach can be used to value both commercial and subsistence fishery benefits. To estimate recreational benefits, the travel cost method, hedonic property model and contingent valuation method can be used to estimate consumers’ willingness to pay for visits to the site. The travel cost method is however, an expost model. Analysts may use this method to estimate the recreational benefits of 6
See Figure 7 for details on price effects. 27
a free-flowing river but not of the proposed reservoir, which does not yet exist. Analysts may then use the results of a study on a similar reservoir to estimate the recreational benefits of the reservoir. This method (called the benefits transfer method) has been explained in the previous section. Net recreational benefits
=
Days of visit
x
WTP for recreation from reservoir
-
Days lost
x
WTP for freeflowing river recreation
4.1.10 Municipal and Industrial Water Supply The benefits of water supply can be measured in the same way as that of hydroelectric power. Its value is very area-specific. Analysts generally do not use the market price method because the market for water supply is rarely competitive. The replacement cost method and stated preferences approach may both be used to determine the economic price of water. 4.1.11 River Navigation Rivers are a mode of both international and domestic transportation. Even though information on other means of transportation is available, the cost of the next best alternative to river transportation may be a very poor estimate of the value of improved river navigation. The stated preferences approach should be used to assess the consumers’ willingness to pay for improved river navigation, and the factor income method, to estimate welfare gain in commodity transportation.
28
Table 4.
Appropriate Valuation Methods For the Impacts of Dam Construction Physical Impacts
Appropriate Valuation Method
COSTS 1.
Construction, O&M, mitigation, decommissioning
Capital goods Materials Labour
Market price
2.
Resettlement 2.1 Compensation
Property losses
Market price, Revealed preferences (RCM), and stated preferences (CVM) Market price
2.2
Assistant expenses
3.
Risk of dam failure
4.
Land acquisition
Capital goods Materials Labour Property Forest land Commercial agriculture timber, nontimber forest products and wildlife Non-commercial timber, non timber forest products and wildlife Ecosystem and biodiversity losses, species extinction Carbon sequestration
5.
Externalities
Greenhouse gas emission
Social losses (loss in historic site, erosion of cultural identity, community fragmentation) Waterlogging and salinity
Market price, Revealed preferences (RCM) Market price Market price, Revealed preferences, Stated preferences Revealed preferences (RCM), Stated preferences (CVM) Stated preferences (CVM) Revealed preferences (RCM), Stated preferences (CVM), Carbon tax rate Revealed preferences (RCM), Stated preferences (CVM), Carbon tax rate Stated preferences (CVM)
(Inclusively estimated with irrigation water benefits)
BENEFITS 1.
Flood and seawater intrusion control
Property losses
Stated preference (CVM) -ex ante (what people will pay for flood protection), Revealed preferences (RCM) -ex post (actual losses)
2.
Water for irrigation
Incremental productivity
3.
Hydroelectric power
Electricity generated
4.
Net fishery and recreation
5.
Municipal and industrial water supply
6.
River navigation
Revealed preferences (FIM) Market price (for WTP) Market price, Shadow prices, Revealed preferences (RCM) Market price, Revealed preferences (RCM, TCM, HPM, FIM), Stated preferences (CVM), Benefit transfer. Revealed preferences (RCM) Stated preferences (CVM) Revealed preferences (RCM), Stated preferences (CVM)
Net days of visit
Cubic metres of water supply Time saving
29
5. 0 5.1
CRITERIA FOR PROJECT JUSTIFICATION
Present Value and Discount Rate7
A cost-benefit analysis is a method of project appraisal. A project will be considered worth investing in if its benefits are greater than its costs. In practice, many projects with positive net benefits have to compete with each other for limited government funding. Hence, project priority depends on the magnitude of its net benefit value. For one-year projects, the net benefit can easily be calculated by subtracting the total costs from the total benefits. The result can then be compared with other alternatives. Typical projects, however, have a longer life than one year. Costs and benefits of a project occur at different time periods throughout the project life. In principle, they cannot be compared with each other because their values are different for different time periods. A baht in five or ten years’ time will have a different value from a baht today. In order to make all values compatible with respect to time, they need to be adjusted to present values (present worth). Future values will be adjusted by a certain rate called the ‘discount rate’. The net benefit of projects can be compared after discounting. The net present value (NPV) can be calculated as follows: Vt V1 V2 + + ... + 2 (1 + i ) (1 + i ) (1 + i ) t n V NPV = ∑ t t t = 0 (1 + i )
NPV = V0 +
Where
5.1.1
Vt i t n
= = = =
Value at time t Discount rate Year Number of years
Economic Concepts of Discounting
Expected values of future costs and benefits have to be discounted before the net benefit of the whole project can be calculated. The selection of what is to be used as the discount rate for a project is very essential. Theoretically, a discount rate should reflect time preference or the opportunity cost of capital over time.
7
See references 10, 11, 18 and 26 for details on discount rate.
30
Time Preference It is generally accepted that people have different utility needs at different times. They prefer to consume goods and services in the present rather than in the future. They will postpone their consumption to the future only if they receive compensation or a premium for the postponement. The rate for such a premium is called the ‘social rate of time preference’. Opportunity Cost of Capital According to this concept, a discount rate should reflect the social opportunity cost. Basic economic theory states that a society or country has limited resources, insufficient to satisfy all the peoples’ needs in both the government sector and private sector. When the government spends some resources on a project, the private sector will have less available resources equivalent to the amount absorbed by the government project. Therefore, a discount rate should reflect the opportunity cost of returns on social capital forgone. 5.1.2
Discounting Environmental Impacts
Discounting the costs and benefits of a project that have impacts on the environment is an important issue for analysts. Most environmental impacts are long-term in nature. Therefore, environmental damages are often discounted to insignificant values for project evaluation. On the other hand, a project providing environmental benefits in the long-term would be less attractive than a project that provides short-term economic benefits. Many environmentalists suggest that discounting would impede clean projects and a high discount rate would accelerate the depletion of renewable resources. If the discount rate is greater than the renewal rate (of resources), it would speed up the use of resources until they are exhausted. This problem may be avoided by using a lower discount rate. However, too low a discount rate (making most projects feasible) in developing countries can accelerate domestic investment and capital demand. This may lead to the reduction of domestic labour employment and accentuate the problem of poverty, thus presenting a threat to the environment. The choice of which discount rate to use remains a controversial issue. Some analysts choose to use a high discount rate for development impacts and a low discount rate for environmental impacts. Another solution would be to use a standard discount rate for cost-benefit analyses, such as the ten per cent standard discount rate of the World Bank that is estimated from the cost of capital. A sensitivity analysis should then be conducted by using a range of potential discount rates from 0 – 17%. If the net present values are positive using discount rates from within this range, there should be no further argument on the discount rate. On the other hand, if a negative net present value is derived from within the 31
range, analysts should examine this further and determine which variables are sensitive to the discount rate. 5.2
Criteria for Project Justification
Once the economic values of benefits and costs have been derived, the project’s result can be presented in three traditional forms: Net Present Value (NPV), Benefit-Cost Ratio (B/C ratio) and Economic Internal Rate of Return (EIRR). 5.2.1
Net Present Value (NPV) n
NPV = ∑ t =0
Where
Bt Ct i n
= = = =
Bt − C t (1 + i ) t
Benefit at time t Cost at time t Discount rate Number of years
The criterion for project acceptance is this: it is economically feasible if its NPV > 0. When the NPV is positive, it means that the benefits of the project are greater than its costs. The NPV criterion is limited in that it cannot be used to rank a number of alternative investment projects because the NPV of a project is likely to be positively related to the project’s investment cost or scale. For example, a larger dam project would have higher NPV than a smaller dam project because of the former’s larger capacity. The NPVs of two different scaled projects should not be compared because their outlays are not equal. Nevertheless, if a project is divisible into sub-projects, NPVs expressed in terms of value per dollar invested may validly be used to rank the priority of these sub-projects. 5.2.2
Benefit-Cost Ratio (B/C ratio) n
∑
B/C
(1 + i ) Ratio = t = 0 n Ct
t
t = 0 (1 + i )
t
∑
Where
32
Bt Ct i n
Bt
= = = =
Benefit at time t Cost at time t Discount rate Number of years
The B/C ratio is designed to avoid the limitation of the NPV method. Here, a project is evaluated in terms of benefits per one monetary unit of cost. A project would be worth investing in only if it meets the criterion where the B/C ratio is greater than 1. A number of projects can be ranked using this ratio. The B/C ratio is, however, sensitive to the classification of costs and benefits of the project. Some impacts can be accounted as either a cost or a benefit. In the example illustrated in Table 5 below, the 20 million baht flood control impact may be considered either as a positive benefit or a negative cost. Table 5.
Illustration of the Effect of Impact Classification on B/C Ratios
1. All impacts (excluding flood control) 2. Include the flood control impact as a negative cost 3. Include the flood control impact as a positive benefit
Net Present Costs (million baht)
Net Present Benefits (million baht)
NPV (million baht)
B/C Ratio
70 70-20=50
80 80
30
1.60
70
80+20=100
30
1.43
When the flooding impact is defined as a negative cost, the B/C ratio is 1.60. The ratio will change to 1.43 when we define the impact as a positive benefit although the NPV is not changed. It can be concluded that the B/C ratio is very sensitive to impact classification. B/C ratios should therefore be used to rank alternative projects only if the impacts are similarly classified. 5.2.3
Economic Internal Rate of Return (EIRR) n
n Bt Ct = ∑ ∑ t t t = 0 (1 + r ) t = 0 (1 + r )
Where
Bt Ct r n
= = = =
Benefit at time t Cost at time t EIRR Number of years
The economic internal rate of return is the highest interest rate that a project owner should economically pay. In other words, the EIRR is the discount rate at which the NPV is just equal to zero. The criterion for project selection is that the EIRR must be greater than the social discount rate. This selection tool is popular because it is convenient for project ranking and it is independent of the social discount rate. The problem with the EIRR is that two EIRR values for the same project could arise when the project scale is expanded. In such an event, the EIRR as a selection criterion will cease to be appropriate. 33
5.2.4 Normalized Net Present Value (NPV’) The three criteria mentioned above have been traditionally used in most cost-benefit analyses. Unfortunately, each of them has a limitation with respect to project ranking. According to economic principles, analysts have to rank project alternatives using social welfare or net social benefits. As mentioned above, the NPV criteria cannot be used to rank projects with different outlays. Therefore, a normalization procedure must be performed to modify a project’s NPV to a comparable base. A normalization procedure must satisfy three conditions to ensure a correct ranking of alternative investment plans. These are: (1) reinvestment opportunities must exist (2) all alternatives must have common outlays and (3) there is a common investment period. In order to compare two or more projects with different outlays, analysts have to equalize the magnitude of the capital outlays of each alternative. If only two projects are being compared, it has to be assumed that the alternative with the smaller capital outlay can be repeated or that the remaining capital can be invested in the next best project. The summation of NPV of the smaller project and the NPV of the repeated project, or the next best project, can be compared with the NPV of the larger project. This will be clearly illustrated in the Appendix (the Kwae Noi Dam project case study). 6.0
SENSITIVITY ANALYSIS
In a cost-benefit analysis, analysts are always faced with some uncertainty concerning the project’s impacts and their values. A sensitivity analysis is a technique used for investigating the effect of changes in the benefits and/or costs, of uncertain parameters of the most likely estimate or the base case. A sensitivity analysis will identify the key variables which significantly influence project costs and benefits. The results of the analysis are extremely useful in deciding whether the project in question should be undertaken and if so, what (project) size would be feasible. The results would also help determine measures that might be necessary to mitigate potential adverse effects of the project. 6.1
Performing a Sensitivity Analysis8 6.1.1
Identifying Key Variables
First of all, analysts must define key parameters that could possibly have great influence on the project costs and benefits. Not all variables are key variables in a sensitivity analysis. Normally only those variables that are 8
See references 1 and 3 for details on sensitivity analysis.
34
relatively large in value with respect to the scope of the project are selected for the analysis. In the case of a dam construction, the key variables are as follows: (a)
Construction, Operation and Maintenance, Mitigation and Decommissioning Costs
These costs depend on geo-technical conditions at the project site. Construction costs cannot be determined precisely until construction is underway. According to a study of a cross-check sample by the WCD (2000), multi-purpose dams have demonstrated a greater variability in performance compared with single-purpose dams. On the average, the 45 sampling multipurpose projects had a 63% cost overrun and the Pak Mun Dam, a multi-purpose dam in Thailand, had a 68% overrun. The causes of these overruns as reported by the WCD were (1) poor technical and cost estimations and poor supervision by sponsors, (2) technical problems that arose during construction, (3) poor service by suppliers and contractors, and (4) changes in external conditions. (b)
Dam Performance (Hydroelectric Power Generation, Water Supply Provision and Flood Control Level)
Multi-purpose projects are often designed for sub-optimal outputs of all intended benefits (hydroelectric power, water supply, irrigation, flood control and so on). There are many cases of operational conflicts that contribute to under-performance economically. The performance of multi-purpose dams also depends on weather and geographical conditions such as water inflow, rainfall and watersheds. Variations in weather conditions will lead to uncertainty in dam performance. For instance, the review of several dams in Thailand9 by Sangsriratanakul (1981) found that the amount of electricity generated decreased in the year following a year of low water inflow. Generally, most of the dams in the study generated lower electricity than expected. Drought had often caused water in the reservoirs to fall to inadequate levels for power generation and the provision of irrigation water.
(c)
Agricultural Production
Analysts can estimate agricultural outputs from quantities of used inputs by using production functions. Production functions can be affected by many factors such as technology changes and weather conditions. Changes in these factors can significantly alter the expected outputs and therefore project net benefits.
9
Bhumiphol Dam, the Sirikit Dam, the Ubonratana Dam, and the Sirindhorn Dam. 35
(d)
Price of Impacts
The expected prices of impacts are determined by the demand and supply for them. Any factor affecting such demand or supply would ultimately affect the value of the impacts. Examples of affecting factors would be population forecast and levels of income. Increased figures for these factors would increase market demand for goods and services and raise prices (other factors being equal). (e)
Discount Rate
The choice of a discount rate has a high impact on the NPV and B/C ratio of a project. Analysts should perform a sensitivity analysis using a range of discount rates. As discussed in Section 5, there is usually controversy over the use of a particular discount rate. A sensitivity analysis would help resolve or reduce such controversy. 6.1.2
Calculating the Effect of Changes in Key Variables
To calculate the effect of probable changes in key variables, analysts have to define the probability distributions for the key variables identified and perform simulations on different possible project scenarios. The sensitivity of the base case can be tested in several ways as follows: •
By increasing the investment cost to a certain percentage.
•
By decreasing the economic benefit to a certain percentage.
•
By extending the duration of construction.
The values of the economic indicators (NPV, B/C ratio and EIRR) have to be recalculated for each scenario. The sensitivity of a project is measured by ‘a sensitivity indicator’. The equation is given below: S=
Where
S NPVb NPVs Xb Xs
= = = = =
( NPVb − NPV1 ) / NPVb ( X b − X1) / X b
Sensitivity indicator Value of NPV in the base case Value of NPV in the sensitivity test Value of a key variable in the base case Value of a key variable in the sensitivity test
The higher the value of the sensitivity indicator, the more likely that the NPV is subject to changes in the variables concerned, and therefore the higher the risk for the project.
36
The ‘Monte Carlo analysis10’ is another useful approach for conducting a sensitivity analysis. It attempts to estimate the distribution of net benefits by treating key parameter values as random variables. The basic steps in a Monte Carlo analysis are: 1. Specify the probability distribution for all key variables. 2. Conduct a trial by taking random draws from the distribution for each variable and calculate the net benefits. 3. Repeat the second step many times with different random draws to produce an estimate of expected net benefits. This analysis is very useful when the policymakers are particularly concerned about the risk factor and the parameters have non-uniform distributions or the formulae for calculations are complicated. 6.1.3
Drawing Conclusions from the Sensitivity Analysis
Analysts have to examine whether the sign of the net benefit value changes from positive to negative when values of key variables are changed. If the sign does not change, then the cost-benefit analysis of the project is sound and analysts can have greater confidence in its results. Analysts should further determine which key variables yield a high sensitivity indicator value. 7.0
RECOMMENDATION OF THE BEST ALTERNATIVE
After the sensitivity analysis has been completed, the last step in a CBA is to make a recommendation on the most efficient alternative. Analysts should provide not only the recommended alternative, but also information on the uncertainty of project outcomes. Identification of those who would be affected positively and negatively by the recommended alternative would be useful for policymakers in their decision-making. A CBA is a very useful tool to provide information on project efficiency but it suggests the best choice of investment only in an economic perspective. In practice, the recommended project may not be undertaken because deciding bodies (namely governments) have to take political, social, cultural and other considerations into account.
10
See reference 4 for details on the Monte Carlo analysis.
37
REFERENCES 1.
ADB (Asian Development Bank). 1997. Guidelines for the Economic Analysis of Projects. Economics and Development Resource Center, Manila, Philippines.
2.
______ 1998. Summary of the Handbook on Resettlement: Guideline to Good Practice. ADB, Manila, Philippines.
3.
______ 1999. Handbook for the Economic Analysis of Water Supply Project. Economics and Development Resource Center, Manila, Philippines.
4.
Boardman et al. 1996. Cost-Benefit Analysis: Concepts and Practice. Prentice-Hall. New Jersey, USA.
5.
Brookshire, D. and H. Neill. 1992. Benefit Transfers: Conceptual and Empirical Issues. Water Resources Research Journal. March, Vol. 28, 651-655. American Geophysical Union. Washington, USA.
6.
Du Y. 1999. The Use Of Benefit Transfer In The Evaluation Of Water Quality Improvement: An Application In China. EEPSEA Report.
7.
Field, B.C. and N.D. Olewiler 1994. Environmental Economics. McGrawHill Kyerson Limited. Ontario, Canada.
8.
Freeman, M. 1999. The Measurement of Environment and Resource Values: Theory and Method. Resource for the Future. Washington, USA.
9.
Hanley, N. and C.L. Spash. 1993. Cost-Benefit Analysis and the Environment. Edward Elgar Publishing. Vermont, USA.
10. Henderson N. and I. Bateman. 1995. Empirical and Public Choice Evidence for Hyperbolic Social Discount Rate and the Implications for Intergenerational Discounting. Environmental and Resource Economics Journal 5, 413-423. 11. Holden et al. 1998. Poverty, Market Imperfections and Time Preferences: of Relevance for Environmental Policy? Environment and Development Economic Journal 3, 105-130. Cambridge University Press. Cambridge, United Kingdom. 12. ICOLD (International Commission on Large Dams). 1995. Dam Failures Statistical Analysis, ICOLD Bulletin No.99. Paris, France.
38
13. Manat S. 1981. Resettlement of Population Following Dam Construction: The Case of Srinagarind Dam, Thailand. The Pennsylvania State University, USA. Ph.D Dissertation. 14. Mishan, E.J. 1971. Cost-Benefit Analysis: An Introduction. Praeger Publishers, New York, USA. 15. Navrud, S. 1999. Benefit Transfer-Validity Test. Thirteenth EEPSEA Biannual Workshop. November 16-19. Singapore. 16. OECD (Organization for Economic Cooperation and Development). 1995. The Economic Appraisal of Environmental Projects and Policies: A Practical Guide. France. 17. Panayotou, T. 1996. Basic Concepts and Common Valuation Errors in Cost-Benefit Analysis. EEPSEA Report. 18. Rosen, H.S. 1998. Public Finance. McGraw-Hill Publishing Company. Illinois, USA. 19. Royal Irrigation Department. 1996. The Kwae Noi Dam Project : Summary Report of Environmental Impact Assessment. 20. ______ 1996. The Kwae Noi Dam Project: Feasibility Study. 21. Sangsriratanakul, O. 1981. Evaluation and Reappraisal of Cost-Benefit Analysis For Dam and Reservoir Projects in Thailand. Mahidol University. Bangkok, Thailand. Master Thesis. 22. TDRI (Thailand Development Research Institute). 2000. The Study of Environmental Impact Assessment Development for Environmental Economics (Draft). 23. United Nations Foundation. 2000. Climate Change and Dams. United Nations Environment Programme. 24. World Commission on Dams. 2000. Dams and Development: A New Framework for Decision-Making. Earthscan Publications Ltd. London and Sterling, United Kingdom. 25. ______ @www.dams.org 26. Yaowarat T. 1998. Economic Appraisal. Thammasat University. Bangkok, Thailand.
39
APPENDIX CASE STUDY: THE KWAE NOI DAM PROJECT 1.0
Background
The Kwae Noi River has its origin in Amphur Charttrakan, Phitsanulok Province, and covers an area of approximately 32,000 hectares. Eighty per cent of the population in this area are low-income farmers who own small-sized farms. Agricultural production has been relatively low in this region due to the lack of water supply during the dry season. In addition, there is an average of twelve days of flood during the wet season every year in Amphur Watbot, Amphur Prompriram, Amphur Muang, and Amphur Wangtong, all located in the Phitsanulok Province, and this has further hindered agricultural development. Since it is expected that the problem of floods will grow even more serious over the next few years, the Kwae Noi Dam project is important as a potential solution to this. Initially conceived as an irrigation project in 1977, the Office of the National Economic and Social Development Board (NESDB) in cooperation with the National Energy Policy Office (NEPO), hired a group of consulting firms to perform an initial economic assessment study of the Kwae Noi Dam project. Later in 1983, NEPO, with the support of the Australian government, conducted another set of studies. This time the consultant firms were given the additional mandate not only to conduct an economic assessment, but also to include an estimate of the environmental impacts of the Kwae Noi Dam project. In 1996, the Office of Environmental Policy and Planning (OEPP) became a part of the committee evaluating the consulting firms’ report because the latter had been requested to submit an Environmental Impact Assessment (EIA). The OEPP criticized this report on the basis that much of the information was incomplete, and therefore the report was rejected. While there were numerous reasons as to why the report was rejected, the environmental valuation method and the CBA itself were cited among the main grounds for rejection. 2.0
Cost-Benefit Analysis of the KND Project
In the report presented by the consulting firms, the KND project was assumed to have a life span of 50 years. The lifetime of the dam, buildings, and related irrigation system were estimated at 50 years and the lifetime of machinery at 25 years. The construction would take one to eight years depending upon the time required to construct the components.
40
In the report, the consulting firms first identified the objectives of the project, but failed to specify the referent groups in the analysis. Three alternative cropping systems were proposed in the report: System I (rice – rice), System II (rice – rice – cash crop – vegetable – fruit trees), and System III (rice – cash crop – vegetable – fruit trees). In addition, the choice of whether to construct a hydroelectric power plant had to be made prior to the construction of the dam. The six alternatives in the feasibility study are shown in Box A. Box A.
Proposed Alternatives of the KND Project
Hydroelectric power plant
System I -Rice -Rice
Alternative (1)
2.1
No hydroelectric power plant
System II -Rice -Rice -Cash crop -Vegetables -Fruit trees
System III -Rice -Cash crop -Vegetables -Fruit trees
System I -Rice -Rice
System II -Rice -Rice -Cash crop -Vegetables -Fruit trees
System III -Rice -Cash crop -Vegetables -Fruit trees
Alternative (2)
Alternative (3)
Alternative (4)
Alternative (5)
Alternative (6)
Identification of Potential Impacts
The negative impacts of the project comprised physical impacts (construction of dam and irrigation system and spillways, operation and maintenance, and mitigation costs), resettlement and land acquisition. The positive impacts from the project were assumed to begin in the tenth year. These comprised benefits from flood control, irrigation, hydroelectricity supply, fisheries and tourism, and water consumption. The summary of the project impacts is shown in Box B. For the KND project, the consulting firms had identified and quantified project impacts in terms of marginal or incremental units. Most of the impacts were defined in the report. However, decommissioning costs and risk of loss due to the dam failure were not included in the study.
41
Box B.
Costs and Benefits of the Proposed Kwae Noi Dam Project Without Dam
With Dam
Negative Impacts 1. Construction, O&M, mitigation
No costs incurred.
2. Resettlement
No resettlement required.
3. Land acquisition
No land needed for dam and reservoir; present situation remains.
Amount of employed resources for construction of dam, irrigation system and spillways, O &.M , and mitigation Compensation and assistant expenses for (1) 143 displaced households in reservoir area for loss of homes and cultivated lands (2) 500 households for loss of agricultural lands Land acquired for and covered by reservoir. There will be 4,000 hectares of flooded land and 2,880 hectares of flooded forest. This will ruin wildlife habitat, the ecosystem and biodiversity. For example, 94 species of wild life will be disturbed in or lost from the reservoir area. Two of these are the already threatened monitor lizard species of Varanus Salvatar and Varanus Bengalensis.
Positive Impacts 4. Flood control
5. Water for irrigation
Free-flowing river. On the average, 12,000 ha of cultivated land will be flooded up to 1-2 metres high each year. Free-flowing river; no control over water for irrigation.
Controllable river flow and no flood damage on 12,000 hectares of cultivated land.
Regulated water supply for irrigation during the dry season. The project will provide water for 24,986.56 hectares during the rainy season and 14,896 hectares in the dry season. Due to the expansion of cultivated land, farmers will produce more agricultural products. Production of 148.8×10⁶ KWH per year
6. Hydroelectric power
No hydroelectric power.
7. Net recreation and fishery
Recreation and fishery benefits of free-flowing river particularly in Keng Jed Kwae (proposed national park) from February to July. Average of 300 tourists per year
1.
Supply from free-flowing river.
Controllable and therefore reliable water supply for towns and industries. The project is expected to produce 47.3 million cubic metres a year of water.
8. Municipal and industrial water supply
42
2.
It is expected that at least 1,000 persons will visit the dam and its reservoir per day, in the future. The amount of fish is expected to increase by 323 tonnes a year
2.2
Economic Valuation
Once the physical impacts of the Kwae Noi Dam Project were identified and quantified, the next step of analysis was to monetize these impacts with economic prices. Shadow prices were used to reflect the true economic values of these costs and benefits. They were derived by adjusting market prices with economic conversion factors. These factors were published by the World Bank (1982) and are presented in the Box C below. Box C.
Conversion Factors
Items Standard conversion factor Conversion factor for -consumption goods -labour -electricity -intermediate goods -capital goods -margin for middle men -fertilizer -pesticide -construction -plant variety -transportation
Conversion factors 0.92 0.95 0.92 0.90 0.94 0.94 0.79 0.92 0.88 0.88 0.94 0.87
Source: World Bank Working Paper Number 609 (1982)
Ideally, conversion factors should be frequently updated to take into account changes that might occur through time. Unfortunately, those for Thailand were calculated almost 20 years ago. They are not appropriate to be used for CBA valuation because changes have taken place in the economic structure of Thailand. 2.2.1 KND Costs Estimation •
Construction, mitigation and resettlement costs were estimated using adjusted market prices while operation and maintenance costs were calculated based on information from other projects. The total physical costs of dam construction with and without hydroelectric power plant were 11,742.1 and 9,171.1 million baht respectively.
43
•
Box D.
The cost of forest loss was estimated twice. The first estimation was done when the feasibility study was carried out and the second time was when the EIA was conducted. In the feasibility study, the cost was only 104 million baht in the first year. In the EIA study, foregone environmental benefits were included. Damages due to the loss of a 2,880-hectare forest area were estimated as external project costs. The total economic value of the forest comprised its direct-use value, indirect-use value, option value and non-use value. These are shown in Box D below. The Total Value of Forest in the KND Project
Total economic value
Use value
Direct use -Fruit and herb -Timber -Non timber forest products -Wildlife -Fishery
Indirect use -Carbon sequestration -Water and soil conservation -Soil nutrient
Non-use value
Option value -Water supply -Tourism -Eco-tourism -Agricultural production
Existence and bequest values -Bio-diversity
The cost of forest loss was estimated twice Even though the potential economic forest values were incorrectly classified in the consulting firms’ report, this would have had no effect on the total economic value anyway. Each potential value was estimated by the benefit transfer method. Most of transferred values were obtained from foreign studies because economic valuation studies in Thailand were limited. The transferred value of forest or the cost of forest loss in the EIA was 61,337.5 baht per hectare or 176.652 million baht per year. 2.2.2 • •
44
KND Benefits Estimation
Flood control benefit was estimated from expected loss of properties. Since time series data on flood damages and flood events were not available, the consulting firms used mathematical models for prediction. The benefit was estimated to be 25.27 million baht per year.
•
Since the benefit on irrigation water depends on the cropping patterns and agricultural production, the consulting firms calculated incremental profit from the following formula.
Net benefit of irrigation water = = where
TR0 TR1 TC0 TC1
= = = =
(Profit with project) – (Profit without project) (TR1 – TC1) - (TR0 – TC0) Total revenue without project Total revenue with project Total cost without project Total cost with project
The prices of exported outputs and non-exported outputs were estimated differently. If the products were exported, the farm prices were derived from F.O.B or border prices subtracted by marketing costs. If the products were not exported, the farm prices were derived from wholesale prices in Bangkok subtracted by marketing costs. The estimated annual profits of cropping patterns System I, System II and System III were 93.98, 756.24 and 1,005.58 million baht respectively. •
The benefit of hydroelectric power was assessed by the replacement cost method. It was assumed that the best substitute of a hydroelectric power plant was a gas turbine power plant. The cost of generating power by the gas turbine power plant was therefore used to approximate the benefit of hydroelectricity. The electricity price of a gas turbine power plant calculated by Electricity Generating Authority of Thailand (EGAT) was 0.726 baht/KWH. The proposed hydroelectric power plant could generate 148.8 x 10⁶ KWH per year. The economic value of electricity was therefore 108.03 million baht a year.
•
The benefit of recreation from tourism was estimated as being equal to the benefit gained from the reservoir subtracted by the benefit lost from the free-flowing river. The net annual benefit was 109.5-18.25 = 91.25 million baht. The references of values were however, not quoted in the report.
•
The benefit of water supply was valued by the price of an alternative source, which in this report was well water. The price of well water obtained from the study by the Underground Water Division, Department of Mineral Resource, Ministry of Industry was 2.42 baht/m3. The project would produce 47.3 x 10⁶ m3 per year. Therefore, the value of water supply was derived as 114.47 million baht a year.
45
2.2.3
Comments
Overall, the consulting firms’ feasibility study was consistent with economic principles. However, comments on the CBA can be made as follows: •
The conversion factors were too outdated. They did not reflect the true economic prices because market structures had changed a lot since they were published by the World Bank in 1982.
•
Operation and maintenance costs were roughly estimated as a percentage of working capital costs based on previous studies and projects. This is not a good economic estimation method. The O&M costs should have been calculated from the quantity of required resources.
•
When the consulting firms included environmental impacts in the feasibility study, the cost of forest loss was double counted: once, in the feasibility study and then again, in the EIA study.
•
Some components of the potential economic value of forest are complex and so the benefit transfer method must be carefully applied. For instance, non-timber forest products can consist of various types of plants and wildlife. This type of benefit is area-specific. Using transferred values from foreign countries, as done here, may have provided misleading information.
•
The tourism benefit should not have been estimated from actual spending. Rather, it should have been assessed from the true economic costs that tourists had to forego, such as time.
•
The prices of electricity calculated by EGAT, and those of well water calculated by Underground Water Division, would have to be carefully reviewed because they may have been nominal or financial prices. Economic prices have to reflect the marginal opportunity costs of such services.
•
Some values were not reliable because they were given arbitrarily without any reference, and the consulting firms could sometimes not explain the linkage between physical impacts and their monetary values.
In conclusion, some values of KND impacts were incorrectly estimated because the particular valuation technique used did not reflect the change in social surplus. At this point of the CBA, the concept of opportunity cost should be used to estimate project costs and the concept of willingness to pay should be used to estimate project benefits.
46
2.3 Discounting and Result It is assumed that the consulting firms’ report was consistent with economic principles. The KND project has six different alternatives. The selected discount rate was 10% which was equal to the project’s opportunity cost of investment. The net present costs and net present benefits at a 10% discount rate are shown in Box E. Alternative 3 was recommended by the consulting firms based on the NPV criterion. However, the NPV was not consistent with the project’s B/C ratio and IRR criteria, the reason being that the calculated NPV was not normalized. The outlays of the project alternatives were different and using the NPV values was misleading. The outlays of all alternatives have first to be equalized. The net present costs of the alternatives with a hydroelectric power plant are greater than those of the alternatives without a hydroelectric power plant by 537.33 million baht. If this amount of 537.33 million baht were invested in another project or in the private sector with 12% annual returns, the net present value of this investment would be 102.35 million baht. This extra benefit must be added to the alternatives without a hydroelectric power plant. The normalized NPV is expressed in column (F) of Box E. It can be seen that Alternative 6 should be the recommended option because it provides the highest efficiency revealed by the normalized NPV. Box E.
Results of the Feasibility Study on KND
Alternatives
Net Present Costs (A)
With a power plant 1. Cropping system I 2. Cropping system II 3. Cropping system III Without a power plant 4. Cropping system I 5. Cropping system II 6. Cropping system III
4,502.24
* At 10 % discount rate. B/C Normalized ratio NPV
Net Present Benefits (B)
NPV
IRR
(C)
(D)
(E)
(F)
3,595.02 6,230.42 7,262.05
-907.22 1,728.18 2,759.81
8.27 13.15 14.65
0.82 1.40 1.63
-907.22 1,728.18 2,759.81
2,981.90 5,617.30 6,648.93
-983.01 1,652.38 2,684.02
7.96 13.12 14.67
0.77 1.43 1.69
-880.66 1,754.73 2,786.37
3,964.91
Besides the recommendation for the best alternative, analysts should provide information on the distribution of project impacts and identify who will bear the costs and who will gain benefits from the project. This would provide useful information for policymakers to decide on the project.
47
2.4 Sensitivity Analysis In the consulting firms’ report, the base case was Alternative 3 which is a dam construction with cropping pattern 3 and a hydroelectric power plant.11 The consulting firms assumed that (1) the project cost might increase by 10% (2) the project benefit might decrease by 10% or (3) the project cost might increase by 10 % and the project benefit might decrease by 10%. Box F.
Consulting Firms’ Sensitivity Analysis
Scenario 1. Base case 2. Increase in costs by 10 % 3. Decrease in benefits by 10 % 4. Increase in costs by 10 % and Decrease in benefits by 10 % *
NPV 2,759.81 2,343.83 2,055.45
B/C ratio 1.63 1.48 1.46
IRR 14.65 13.68 13.55
S* 1.60 2.63
1,610.08
1.33
12.62
4.23
Calculated by the author.
The result of the sensitivity analysis showed that the cost-benefit analysis was robust because the sign of the net benefits remained unchanged. The sensitivity indicators of each scenario were 1.60, 2.63 and 4.23 respectively. This means that the project was relatively less sensitive to changes in costs while being more sensitive to changes in its benefits. The firm, however, did not explain which key variables were expected to change. The 10% increase in costs and 10% decrease in benefits were arbitrarily selected. Therefore, it cannot be ascertained whether this 10% scenario is the least favourable of the plausible range of values for each of the variables.
11 However, the analysis shows that the most efficient alternative is actually Alternative 6. 48