Working Paper/Document de travail 2012-8
Growth in Emerging Market Economies and the Commodity Boom of 2003–2008: Evidence from Growth Forecast Revisions by Elif C. Arbatli and Garima Vasishtha
Bank of Canada Working Paper 2012-8 February 2012
Growth in Emerging Market Economies and the Commodity Boom of 2003–2008: Evidence from Growth Forecast Revisions
by
Elif C. Arbatli1 and Garima Vasishtha2 1International
Monetary Fund Washington, DC 20431
[email protected]
2International
Economic Analysis Department Bank of Canada Ottawa, Ontario, Canada K1A 0G9
[email protected]
Bank of Canada working papers are theoretical or empirical works-in-progress on subjects in economics and finance. The views expressed in this paper are those of the authors. No responsibility for them should be attributed to the Bank of Canada or the International Monetary Fund.
2
ISSN 1701-9397
© 2012 Bank of Canada
Acknowledgements We thank Ron Alquist for helpful comments. Kristina Hess and Rose Chen provided excellent research assistance.
ii
Abstract Demand for industrial raw materials from emerging economies, particularly emerging Asia, is widely believed to have fueled the surge in oil and industrial commodity prices during 2002-2008. The paper first presents a simple storage model in which commodity prices respond to market participant’s changing expectations of the future macroeconomic environment. In the model, the change in the price of a commodity depends on the unanticipated changes in demand factors, along with the real exchange rate, the real interest rate, and other factors that affect the marginal convenience yield. It then focuses on the role of demand factors by using a newly constructed monthly measure of unanticipated demand shocks for commodities based on revisions to professional forecasts of industrial production growth for a large group of emerging market and advanced economies. The empirical framework also controls for other macroeconomic factors that affect commodity prices, such as the real effective exchange rate (REER) of the U.S. dollar and the real interest rate. The results show that revisions to growth forecasts for emerging Asia play an important role in explaining movements in the real prices of industrial metals. In addition, the REER of the U.S. dollar is an important determinant of industrial commodity prices. For crude oil, growth forecast revisions for the U.S. and the real interest rate play a significant role in explaining real prices. Furthermore, growth surprises in general fall short of explaining the fast run-up in most commodity prices during 2006-2008, and the magnitude of the collapse in prices during the recent global financial crisis. JEL classification: Q41, Q43 Bank classification: Econometric and statistical methods; International topics
Résumé De l’avis général, la demande de matières premières industrielles dans les marchés émergents, particulièrement en Asie, a alimenté l’essor des prix du pétrole et des matières industrielles entre 2002 et 2008. Les auteurs présentent d’abord un modèle de stockage simple dans lequel les cours des produits de base réagissent aux modifications des attentes des acteurs de marché à l’égard de la conjoncture macroéconomique. Dans ce modèle, les mouvements de prix d’un produit de base sont fonction des variations imprévues des facteurs de demande ainsi que du taux de change réel, du taux d’intérêt réel et d’autres facteurs qui influent sur le rendement d’opportunité marginal. Les auteurs analysent ensuite le rôle des facteurs de demande à l’aide d’une nouvelle mesure mensuelle des modifications imprévues de la demande d’une matière première; cette mesure se fonde sur les révisions apportées aux prévisions émanant de professionnels concernant la croissance de la production industrielle dans un grand nombre d’économies émergentes et avancées. Le cadre empirique tient également compte d’autres facteurs macroéconomiques qui ont une incidence sur les cours des produits de base, tels que le taux de change effectif réel du dollar É.-U. et le taux d’intérêt réel. Les résultats montrent
iii
que les révisions apportées aux perspectives de croissance des économies émergentes d’Asie contribuent de façon importante à expliquer les mouvements des prix réels des métaux industriels. En outre, le taux de change effectif réel du dollar É.-U. est un déterminant clé des prix des matières industrielles. Les révisions apportées aux prévisions relatives à l’économie américaine et le taux d’intérêt réel jouent aussi un rôle majeur dans la variabilité des cours réels du pétrole brut. Par ailleurs, les variations inattendues de la croissance ne parviennent généralement pas à expliquer l’envolée des prix de la plupart des produits de base entre 2006 et 2008 ni l’ampleur de leur chute lors de la récente crise financière mondiale. Classification JEL : Q41, Q43 Classification de la Banque : Méthodes économétriques et statistiques; Questions internationales
iv
I. INTRODUCTION Prices of several commodities rose rapidly during the last decade reaching recent highs in the course of 2007 and 2008 (see Figure 1). This boom in commodity prices coincided with strong growth performance of emerging market economies (EMEs), with growth outpacing that in advanced economies for the 2000-2007 period (see Figure 2). While the commodities boom reflected many cyclical and structural factors, there is a widespread perception that the main reason for it has been buoyant economic growth worldwide, particularly in emerging Asian countries, such as China and India. With the onset of the Great Recession in 2008, commodity prices (especially energy and industrial commodities) experienced a significant downward adjustment, reversing the earlier gains of the 2003-2008 episode. It has been argued that the decline in demand from advanced economies and EMEs, and the significant downward revisions in their near-term growth prospects were the main factors driving movements in commodity prices during the global financial crisis. Commodity prices bottomed out in February 2009 and staged a sharp rebound thereafter, in tandem with the improvement in global economic and financial conditions through 2009. While a number of factors were behind this sharp rebound in commodity prices, most notable are the stronger-than-expected global recovery and the increasingly important role of EMEs in global commodity markets (IMF, 2010). More specifically, the global recovery has been led by emerging Asian economies, where the consumption of commodities has grown at the fastest pace in recent years. Against this backdrop, in this paper we analyze the extent to which movements in the real prices of oil and industrial commodities can be explained by global shocks to demand for commodities. In particular, our aim is to assess the role of the unexpectedly strong economic growth worldwide, particularly in China and India, on the commodity price boom of 2003-08. Since commodities are generally storable, spot prices reflect not only current demand and supply conditions but also expectations of these conditions in the future. Hence, to the extent that inventories link spot and expected future prices, it implies that growth surprises and changing expectations of future conditions, should be more relevant for the determination of prices than the actual rate of growth. We first present a simple model (Section III) to formalize the argument 2
that commodity prices respond to market participant’s changing expectations of the future macroeconomic environment. Specifically, we demonstrate with a storage model that the change in the price of a commodity depends on the unanticipated changes in demand factors, along with the real exchange rate, the real interest rate, and other factors that might affect the marginal convenience yield. We then focus on the role of demand factors. To this end, we use the professional forecast revisions to industrial production growth for a large group of emerging market and advanced economies as a proxy for unanticipated commodity demand shocks. It is important to note that we do not claim that the model described in Section III is ‘complete’ in the sense that it captures all factors that participants in commodity markets respond to. In particular, our approach does not allow for the possibility that the change in the price of a commodity depends on anticipated changes in demand factors. Instead, we focus on this standard model of commodity price formation in the presence of storage since it rationalizes the role of changing expectations of demand conditions in explaining commodity price movements which, in turn, enables us to test the perception that the main reason for the commodity price boom of 2003-08 was unexpectedly strong economic growth worldwide, particularly in emerging Asia. Using forecast revisions to growth as a measure of unanticipated demand shocks for commodities is not without precedent. In a recent study, Kilian and Hicks (2009) use real GDP growth forecast revisions as a measure of demand shocks for the global crude oil market. Our approach, however, differs from theirs in two important respects. First, our main measure of unanticipated commodity demand shocks is the forecast revisions to industrial production growth. Since industrial production is a measure of gross output, it captures the component of real economic activity that drives demand for industrial commodities. We do not use real GDP since it is a measure of value added and not real activity (Kilian, 2009). Industrial production is directly linked to demand for industrial commodities such as aluminum, copper and crude oil, whereas an increase in GDP growth may translate into higher demand for services as well. Indeed, one of the stylized facts that emerges from examining previous downturns and recoveries in commodity prices is that industrial production and commodity prices, on average, tend to peak at about the same time before the trough in the cycle (IMF, 2008). Furthermore, our results also provide evidence in favor of using revisions to industrial production growth as a measure of commodity demand shocks. As discussed later in the paper, when we use GDP growth forecasts 3
revisions as a measure of commodity demand shocks we do not find a significant impact of emerging Asian countries. Second, since our focus is on capturing shifts in the demand for commodities driven by the global business cycle, we focus on a broader set of industrial commodities and not just crude oil as is the focus of Kilian and Hicks (2009). In particular, we cover the following group of commodities in the Bank of Canada Commodity Price Index (BCPI): crude oil, aluminum, copper, nickel, and zinc. We do not include agricultural commodities in this study since demand for food is relatively insensitive to the business cycle compared with other commodities. We also do not include precious metals – gold and silver – since their sensitivity of demand to economic activity is much lower than that of base industrial metals, such as copper and nickel.2 Another key contribution of the paper is to examine the role of the effective depreciation of the U.S. dollar and real interest rates in driving commodity prices. The relationship between commodity prices, especially oil, and the dollar exchange rate has received relatively scant attention in the empirical literature despite the extensive commentary it receives in the popular press and among market participants.3 A depreciation of the dollar real effective exchange rate (REER), such as that seen during much of the last decade (Figure 3), affects both the demand and the supply of commodities. Since we measure commodity prices in real U.S. dollars, when the dollar depreciates in effective terms, it reduces the real relative price of the commodity for consumers in the rest of the world, thus increasing their demand for the commodity. Similarly for producers of the commodity, a depreciation of the REER leads to a lower effective price for their commodity. Both factors lead to a decline in the net supply of the commodity, thereby exerting price pressures, when the REER depreciates. A decline in the effective value of the dollar can raise commodity prices through the asset channel as well. Effective dollar depreciation reduces the returns on dollar-denominated financial assets in foreign currencies, which can make commodities more attractive as alternative assets to foreign investors.
2
Our priors were confirmed by preliminary investigations which revealed that forecast revisions to industrial production growth do not have any significant explanatory power in predicting prices of gold and silver. 3 Recent exceptions include Grisse (2010) and Akram (2009).
4
Overall, we find that growth shocks play a significant role in explaining movements in the real prices of crude oil and most industrial metals. For industrial metals, growth shocks in emerging Asia play an important role in explaining movements in real prices. However, another important determinant of industrial commodity prices is the real effective exchange rate of the U.S. dollar (REER).4 For crude oil, growth shocks in the U.S. and the real interest rate play a greater role in explaining movements in real prices than growth shocks in EMEs. Our results also point towards some interesting differences in the relative importance of different country groups in explaining movements in real commodity prices. Broadly speaking, while growth forecast revisions in the U.S. seem more important for the 1999-2003 and 2008-2009 periods, forecast revisions to growth in emerging Asia played a key role during 2003-2006. However, growth forecast revisions, in general, fall short of explaining the fast run-up in most commodity prices during 2006-2008 and the magnitude of the collapse in prices during the Great Recession. The remainder of the paper proceeds as follows. Section II discusses the trend in prices of crude oil and industrial commodities since the 1990s, and the commodity consumption shares for different countries/regions over this period. Section III first presents a storage model which shows that changes in the real price of a commodity should be related to the market’s changing expectations of the macroeconomic environment. It then presents our empirical framework. Section IV provides a detailed description of the data. Section V presents the results, and section VI concludes.
II. COMMODITY PRICES AND THE ROLE OF EMERGING MARKET ECONOMIES Commodity prices rose dramatically during the last decade, before falling back markedly since mid-2008 as the Great Recession led to downward revisions in expectations of future demand growth (Figure 1). This boom was in stark contrast with the 1980s and 1990s, when most commodity prices were on a downward trend. Oil prices, for example, reached record highs in mid-2008, rising to $134 per barrel (WTI), over 300 percent higher than the beginning of 2003. Comparing the boom in commodity prices during 2003-08 with earlier episodes suggests 4
These results are consistent with Akram (2009), which finds that oil and metal prices are driven mainly by real interest rate and real exchange rate movements.
5
that this boom has been unusual in three important respects. First, it lasted much longer than earlier booms. Second, the price increases were much larger than earlier episodes. And finally, the boom was broader based, involving all the major commodity groups, i.e., oil, metals, food, beverages, and agricultural raw materials. This suggests that the 2003-08 boom reflected a combination of mutually reinforcing demand and supply factors, as well as the effects of growing links among commodity markets and of supportive financial conditions, including U.S. dollar depreciation and low real interest rates (IMF, 2008). Most notable among these factors is the growing demand from EMEs for various commodities – a trend that is likely to continue. A combination of rapid industrialization, stronger per capita income growth, higher commodity intensity of growth, and rapid population growth in some countries (notably China, India, and the Middle East) have contributed to the strong pace of demand growth in recent years (Helbling et al., 2008). For instance, China’s share in world consumption of crude oil has grown by nearly 73 percent from 2001 to 2010. In contrast, the share of the U.S. and other advanced economies in our sample in 2010 was 11 percent and 17 percent lower than their share in 2001, respectively (see Figure 4a). Moreover, commodity demand in EMEs is more income-elastic than in advanced economies. Emerging market economies are also playing a key role in non-energy commodity markets, with the growth path of metal demand in China – the largest metal consumer – underpinning the direction of metal prices. China’s consumption of copper as a share of world consumption increased from 21 percent in 2003 to nearly 40 percent in 2010 (see Figure 4b). Further, during 2003-08, China’s metal demand increased at a faster rate than output and its metal intensity (metal consumption per unit of GDP) increased during this period. A similar trend can be seen in the demand for other industrial metals (see Figures 4c-4e). China’s consumption of aluminum as a share of world consumption doubled from 20 percent in 2003 to nearly 40 percent in 2010. On the other hand, as in the case of other metals, demand from the U.S. and other advanced economies has played a diminishing role. For instance, during 2003-2010 the share of the U.S and other advanced economies in world consumption of aluminum shrunk by over 35 percent (see Figure 4c).
6
More recently, as the Great Recession led to downward revisions in expectations of future demand growth, commodity prices fell back markedly from the levels seen in mid-2008, before staging a sharp rebound after February 2009. The sharp decline and the subsequent rebound in commodity prices over the past year and a half are in stark contrast to previous downturns and recoveries. One explanation for the faster recovery this time around is the stronger than expected recovery in EMEs combined with the changing structure of commodities demand, with emerging economies accounting for an increasing share of global consumption of a wide range of commodities. The empirical section of the paper and the historical decompositions provide an assessment of the extent to which stronger than expected growth in EMEs can help explain this rebound in industrial commodity prices.
III. MODELING COMMODITY PRICES A.
Storage Model
This section describes, through a simple storage model, our motivation for using growth forecast revisions to capture the effects of changes in global demand factors on industrial commodity prices. The model we use is similar to Pindyck and Rotemberg (1990), but differs in incorporating the real effective exchange rate in the net supply equation. The main conclusion from the model is that to explain price movements we need to consider unanticipated changes in fundamentals, as the anticipated changes in demand conditions would already be incorporated in storable commodity prices through arbitrage. The net supply of commodity at time is denoted by Qi ,t and depends on the log real price of the commodity pi ,t (where pi ,t = ln( Pi ,t ) ) measured in U.S dollars, the log real effective exchange rate ( et ) of the U.S dollar, as well as demand ( ai ,t ) and supply conditions ( si ,t ).5 Qi ,t = − ai ,t + si ,t + bi pi ,t + d i et
5
(1.1)
Although the price elasticity of demand and supply are smaller in the short run than in the long run, our model does not incorporate this distinction. Incorporating this distinction would not change the basic prediction of the model that the prices of storable commodities depend on unanticipated shocks and the estimated coefficients would reflect average elasticities.
7
The reason the REER of the U.S dollar plays a role in equation (1.1) is the fact that for the rest of the world, the dollar REER affects the real effective price of the commodity. An appreciated real U.S dollar exchange rate (i.e., higher et ), for a given real price of the commodity measured in U.S dollars, implies a higher real effective price and hence, a higher net supply. The inventory of commodity evolves according to: I i ,t = I i ,t −1 + Qi ,t
(1.2)
The arbitrage condition for a storable commodity (assuming a risk-neutral inventory holder) suggests that the expected change in the real price of the commodity equals the one-period holding cost of the commodity net of the capitalised flow of its marginal convenience yield over the period ( ci ,t ) plus the expected real risk-free interest rate ( rt ). Et pi ,t +1 − pi ,t = ci ,t + rt −
1 var( pi ,t +1 ) 2
(1.3)
The last term in the above equation appears due to the inequality between ln( E t pi ,t +1 ) and 1 Et ln( Pt +1 ) , and we denote it by a constant φ = − var( pi ,t +1 ) in the rest of the exposition below. 2
The convenience yield is the flow of benefits that one obtains from holding stocks, e.g. an assurance of supply as needed, ease of scheduling etc. The marginal convenience yield is assumed to be related to the current level of inventories as well as other factors that might shift the demand for inventories, such as future supply and demand conditions. The higher is the level of inventories, smaller is the marginal convenience yield and, thus, higher is the holding cost net of marginal convenience yield. Hence, we have the following expression that relates ci ,t to I i ,t : c i , t = ni , t + γ I i , t
(1.4)
where γ > 0 and ni ,t is a vector of macroeconomic variables that might affect the demand for inventories. Putting (1.3)-(1.4) together we have the following expression for the expected change in real commodity prices: Et pi ,t +1 − pi ,t = ni ,t + γI i ,t + rt + φ
We can rewrite equation (1.5) in terms of inventories using (1.1)-(1.2):
8
(1.5)
Et I i ,t +1 − ( 2 + γbi ) I i ,t + I i ,t −1 = − ( Et ai ,t +1 − ai ,t ) + ( Et si ,t +1 − si ,t ) + d i ( Et et +1 − et ) + bi ( rt + η i ,t ) − biφ
(1.6)
This difference equation has two characteristic roots, k and l , which depend on γ and bi . It is possible to show that if γ > 0 and bi > 0 , one root lies between 0 and 1 and the other is greater than 1. Therefore there exists a unique non-explosive solution to (1.6) which can be written as: ∞
I i ,t = φ ′ + kI i ,t −1 + (1 / l ) Et ∑ (1 / l ) j [(at + j +1 − at + j ) − ( st + j +1 − st + j ) − d i (et + j +1 − et + j ) − bi (rt + j + ηi ,t + j )]
(1.7)
j =0
Equation (1.7) shows that the inventory of a commodity is a function of the lagged inventories as well as the expected changes in demand, the real exchange rate, the interest rate, and other macro variables. It is also possible to show that the price of the commodity is a function of the same expected fundamentals. Rewriting (1.7) using (1.1)-(1.2) we get: pi ,t =
φ' bi
+
k −1 1 Ii ,t −1 + bi bi
⎡1 ∞ ⎛ 1 ⎞ j ⎤ ⎢ Et ∑ ⎜ ⎟ [(at + j +1 − at + j ) − (st + j +1 − st + j ) − di (et + j +1 − et + j ) − bi (rt + j + ηi,t + j )] + ai ,t − si ,t − di et ⎥ 0 = j ⎝l ⎠ ⎢⎣ l ⎥⎦
(1.8)
Using (1.8), it is possible to derive an expression for the change in commodity prices: j ⎡ ⎤ 1 ∞ ⎛1⎞ ⎢( ai ,t − ai ,t −1 ) − ( si ,t − si ,t −1 ) − d i (et − et −1 ) + ∑ ⎜ ⎟ [(ai ,t + j +1 − ai ,t + j ) − ⎥ l j =0 ⎝ l ⎠ ⎢ ⎥ k −1 1⎛ Et −1 ⎞ ⎢ ⎥ Δpi ,t = ΔI i ,t −1 + ⎜ Et − ⎟⎢ ⎥ bi bi ⎝ l ⎠ ⎢( si ,t + j +1 − si ,t + j ) − d i (et + j +1 − et + j ) − bi (rt + j + η i ,t + j − rt −1 − ηi ,t −1 )] ⎥ ⎢ ⎥ ⎥⎦ ⎢⎣ (1.9)
As equation (1.9) shows, the change in the price of a commodity is a function of the lagged change in inventories, the unanticipated changes in demand factors, the real exchange rate, the real interest rate, and other factors that might affect the marginal convenience yield.
B.
Empirical Framework
The key implication of the model described above is that changes in the real price of a commodity should be related to market participants’ changing expectations of the 9
macroeconomic environment. As noted earlier, the focus of this study is to examine how much of the observed monthly changes in the real prices of commodities can be explained by changing expectations of future demand for commodities. We use a direct measure of global commodity demand shocks based on revisions to professional forecasts of industrial production growth. We estimate equation (1.9) for each commodity in our sample by estimating the reduced-form regression equation of the following form:6 n
n
n
j =0
j =0
j =0
US Asia Asia OtherEMs OtherEMs Δrpricei,t = αi + ∑ β US Ft − j + γ i Δratet + δi ΔREERt + j ,i Ft − j + ∑ β j ,i Ft − j + ∑ β j ,i
(1.10)
λi Δinventi,t −1 + ρi Δsupplyi,t + εi,t where Δrprice i ,t denotes the log difference in the real spot price of commodity i ( i = 1,..... 5 ) at time t ; FtUS , Ft Asia and Ft OtherEMs denote the weighted forecast revisions to industrial production growth for the U.S., emerging Asia, and other EMEs, respectively. The construction of the forecast revision variables is described in detail in the following section. Δratet is the change in the 3-month U.S. T-bill rate (real) and ΔREERt is the log change in the U.S dollar real effective exchange rate. Δinventi ,t −1 is the log change in inventories for commodity i , while Δsupply i ,t is the log change in production for commodity i . ε i,t is the error term which is assumed to be heteroskedastic and possibly serially correlated. We focus on the following key commodities: crude oil, aluminum, copper, nickel, and zinc. We estimate equation (1.10) for each commodity for the period May 1999 to December 2010 using Newey-West standard errors, with 12 lags in the autocorrelation structure. Although equation (1.10) is the most general form of our regression specification, both the AIC and BIC model selection criteria suggested using only the contemporaneous forecast revisions as explanatory variables. Hence, we only report the results for the regression specification that excludes lags of the forecast revisions. Further, when we consider the effects of forecast revisions from advanced and emerging markets together, it is important to recognize that these revisions in emerging markets are likely 6
We also estimate variants of equation (1.10), as described in section IV below.
10
to be correlated with those in advanced economies given the trade and financial linkages between the two groups of countries. Indeed, the correlation between forecast revisions in emerging Asia and the U.S is 0.35 while that between the other EMEs and the U.S. is much stronger at 0.69 (see Table 1(a). Thus, in the benchmark regression specification that we use to construct the historical decompositions reported in section V, we use the “orthogonalized” versions of the emerging market forecast revisions. That is, we use the residuals obtained from regressing emerging market forecast revisions on those of the U.S.
IV. DATA A.
Forecast Surprises
Our measure of shocks to real economic activity is based on revisions of industrial production growth forecasts provided by Consensus Economics (i.e. difference between the current consensus forecast and the previous one). We use the forecast revision data from Consensus Economics instead of other professional forecasters, such as the Economist Intelligence Unit (EIU) data used in Kilian and Hicks (2009), since it represents a broader set of views about global growth prospects, including those of the EIU. The consensus forecast of industrial production growth – like other indicators in the data set – is a pooled forecast computed as the mean of individual responses to a monthly survey of professional forecasters mainly from the respective country. Because of this aggregation, it is generally considered as the market participants’ view of future macroeconomic developments in the economy. These forecasts are reported monthly for regions as well as individual countries, and comprise of forecasts for the past, current and the following calendar years.7 Thus, the forecast horizon (dated to the end of the forecast year) varies between 1 to 24 months. In this paper, we focus on the 12-month forecast horizon. For each month, we construct the revision in the annual industrial production growth forecast for the next 12 months using a weighted average of growth forecasts for the current and the following year. For instance, to construct the 12-month ahead forecast revision in June 2006, we use the change in growth forecasts for 2006 and 2007 since May 2006, and multiply both 7
For India, the forecasts are reported for the fiscal year for part of the sample.
11
revisions by 6/12, reflecting the fact that industrial production growth for the next 12 months has to reflect growth expectations for the last six months of 2006 and the first six months of 2007. The sample includes the following set of 27 emerging and advanced economies: Argentina, Austria, Belgium, Brazil, Canada, Chile, China, Finland, France, Germany, Greece, India, Indonesia, Italy, Japan, Malaysia, Mexico, Singapore, South Africa, South Korea, Spain, Sweden, Switzerland, Taiwan, Thailand, U.K., and the U.S.8 Together with the U.S., the group of countries included in the analysis constitute approximately 80 percent of world GDP and account for, on average, about 90 percent of the world consumption of the commodities in our sample. Given the differences in the intensity of commodity use of these countries, we scale the monthly forecast revisions for each country with the current shares of the respective country in the world consumption of that particular commodity. This allows us to capture the increasing share of China and India in the consumption of energy and industrial commodities. Our sample period is from May 1999 to December 2010. Although the Consensus Economics forecasts are available for different regions since January 1992, the individual forecasts for China and India are only available since May 1999. Since we are particularly interested in the implications of strong economic growth in China and India for commodity prices, we choose May 1999 as the starting point of our sample. Table 1(b) shows the properties of industrial production growth forecast revisions for the U.S., emerging Asia (China and India), other EMEs, and advanced economies in our sample. The mean forecast revisions are small for all countries and regions. However, it is important to note that only emerging Asia exhibited unexpected growth between mid-1999 and December 2010. The U.S. experienced, on average, negative growth shocks during this period as did other EMEs and advanced economies on average. The standard deviations of annual IP growth forecast revisions for the countries and regions in our sample range between 0.40 and 0.45 percent.
8
We could not include the eastern European emerging markets, such as Czech Republic, Poland, Russia, and Turkey in our sample since the industrial production growth forecasts for these countries were available at irregular frequencies during the time period under consideration.
12
B.
Other Data Sources
The spot price data for the different commodities are described in the appendix. We use the U.S. CPI to deflate spot prices. We use the real 3-month U.S. Treasury bill rate as our measure of the real interest rate. The data was taken from the U.S. Department of Treasury. The U.S. REER data was obtained from the Bank for International Settlements (BIS). Data on oil (petroleum) inventories was taken from the International Energy Agency (IEA) and reports the total petroleum stock for OECD countries. Data on stocks of aluminum, nickel, copper and zinc was taken from the World Bureau of Metals Statistics (WBMS). Finally, total world production data for oil is from the IEA while that for the four industrial metals is from the WBMS.
V. RESULTS We estimate equation (1.10) for each commodity in our sample. We first report results for the specification that includes advanced economies and EMEs, where the latter group is divided into emerging Asia (China and India) and other EMEs in order to capture the growing importance of China and India as consumers in commodities markets. In an alternative specification, we consider forecast revisions for the U.S instead of advanced countries as a group. In the benchmark specification for the historical decompositions that are reported in Figures 5-9, we use the forecast revisions for the U.S, emerging Asia, and other EMEs whereby the forecast revisions for emerging Asia and other EMEs are “orthogonalized” with respect to the forecast revisions for the U.S.9 The other explanatory variables in all of the above specifications include the lag of the log change in inventories, the log change in the U.S. dollar REER, the change in the real interest rate, and the log change in supply. Finally, we replicate our results using GDP growth forecasts revisions as a measure of commodity demand shocks for robustness and comparison.
9
We regress forecast revisions for emerging Asia and other EMEs on forecast revisions for the U.S and use the residuals as the “orthogonalized forecast revisions.” In doing so, we explicitly assume that forecast revisions for the U.S are exogenous with respect to forecast revisions in emerging Asia and other EMEs.
13
A.
Industrial Production Growth Forecast Revisions
Table 2 reports the regression results whereby we use forecast revisions for advanced economies, emerging Asia, and other EMEs. Looking first at industrial metals, forecast revisions for emerging Asia have a significant effect on the real prices of aluminum, copper, and zinc. This impact is strongest for copper, followed by aluminum and zinc. A one percentage point revision in growth in emerging Asia is associated with a 5.5 percent growth in copper prices, while the corresponding statistics for aluminum and zinc are 3.6 and 3 percent, respectively.10 In terms of the control variables, the real effective exchange rate of the U.S dollar is associated with a negative and (highly) significant impact on the real prices of all industrial metals. For instance, a one percent real effective appreciation of the dollar is associated with, on average, a 1.8 and 3.05 percent fall in aluminum and nickel prices, respectively. Columns 6-10 report the results from using the “orthogonalized” versions of emerging market forecast revisions as described in the previous section. The coefficient estimates for emerging Asia are not very different. However, the coefficient estimates for the advanced countries’ forecast revisions are now of the expected sign (albeit statistically insignificant) and the corresponding t-statistics higher. With regard to crude oil, one can see that forecast revisions from none of the three regions have a statistically significant effect on changes in the real price of oil. The only variables that have a significant effect are the change in the real interest rate and the lagged change in inventories. Both are negatively related with real oil prices. In a recent study, Grisse (2010) using a structural vector autoregressive model finds that fluctuations in interest rates explain most of the variation in oil prices in the long run. Low interest rates tend to simultaneously decrease the supply for storable commodities and increase the demand through three main channels. First, low real interest rates increase the refiners’ incentives for holding oil inventories by lowering carrying costs, all else being equal. Second, they decrease the oil producers’ incentive to extract oil today by increasing the future value of oil deposits. Third, low real interest rates increase the asset demand for commodities as low-yielding treasury bills become less attractive (Frankel and Rose, 2009).
10
These figures are obtained by multiplying the share of emerging Asia in the consumption of the commodity with the coefficient estimate for emerging Asia from the corresponding regression.
14
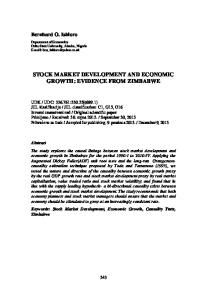
Table 3 reports the results for the regression specification that includes forecast revisions for the U.S. (instead of advanced economies), emerging Asia, and other EMEs together. As before, we first estimated the model with the raw forecast revisions variables (columns 1-5) and then with the “orthogonalized” emerging market forecast revisions (columns 6-10). Regarding industrial metals, results reveal that forecast revisions for emerging Asia have a positive and statistically significant effect on the real price of aluminum, copper, and zinc, while revisions to growth forecasts for other EMEs do not play a significant role. As before, the real effective appreciation of the U.S. dollar is associated with a decline in the real prices of all industrial metals, and this effect is highly statistically significant. Columns 6-10 (Table 3) report the results from using the “orthogonalized” versions of the emerging market forecast revisions variables. Forecast revisions for the U.S are significant for all commodities, whereas emerging Asia has a significant coefficient for aluminum, copper and zinc. Other EMEs are not significant in this set of results as in the previous specifications. The effect of the REER continues to be significant for all commodities except oil.11 This is the benchmark specification that we use for the historical decompositions where it is possible to trace the contribution of growth forecast revisions (and other explanatory variables) in explaining movements in commodity prices. For crude oil, results show that growth forecast revisions for the U.S have a positive and significant impact on the real price. The real interest rate and the lagged change in inventories have a negative and statistically significant effect on the real price of oil. None of the other explanatory variables are statistically significant. Figures 5-9 show the simulated values of real spot prices using July 1999 as the base year. Since the model allows for trend growth, the figures show the deviations from this trend. This allows us to concentrate on the effects of forecast revisions and other explanatory variables and, hence, facilitates a better comparison of results across commodities. The dynamic simulations for aluminum (Figures 5a-5b) show that the model captures movements in prices pretty well, except the sharp rise starting at the end of 2005. The real exchange rate, followed by growth forecast 11
We also estimated the regressions excluding the REER variable and our results remain qualitatively unchanged. These results are not reported in the interest of brevity but are available upon request.
15
revisions for emerging Asia contribute to a sustained increase in prices during 2004-2008, whereas U.S growth revisions have an offsetting negative impact. In contrast to oil, emerging Asia plays a more significant role than the U.S. in explaining the sharp decline in aluminum prices during the crisis. For copper (Figures 6a-6b), forecast revisions for emerging Asia predict a sustained increase in price during 2005-2008 but it is important to note that the REER seems to play an even bigger role in explaining the persistent price increase during this period. Nevertheless, the model does not fully capture the extent and the pace at which copper prices rose during 2006. With regard to nickel and zinc (Figures 7-8), the model does not seem to be as successful in explaining the extent to which prices rose during 2005-2008. For nickel, forecast revisions for emerging Asia are not significant and the predicted movements in prices come mainly from forecast revisions in the U.S and the REER movements. For zinc, forecast revisions for both the U.S. and emerging Asia do not seem to play a major role. Figures 9a-9b show the results of the dynamic simulation exercise for crude oil. The model does a fairly good job in capturing oil price movements (Figure 9a). However, the large dip in oil prices during 2001 and the sharp spike in 2008 are not well captured. Furthermore, the model predicts a recovery in oil prices after the financial crisis with a lag. Figure 9(b) shows that forecast surprises for the U.S. and real interest rates explain a substantial part of the fluctuations in the real price of oil. It is interesting to note that forecast revisions for the U.S predict a substantial cumulative decline in prices which applies to some extent to all commodities. Forecast revisions in emerging Asia predict a sustained increase in prices starting in 2006, but the magnitude of this improvement is not very significant. Furthermore, during the recent global crisis, forecast surprises in the U.S. explain a greater part, compared to emerging Asia, of the fall in oil prices from 2008:06 to 2009:02.
B.
GDP Growth Forecast Revisions
We also use an alternative measure of commodity demand shocks based on revisions to real GDP growth forecasts provided by Consensus Economics. This data is structured in the same way as the industrial production growth forecasts data described earlier. Tables 4-5 show the 16
same set of regressions as in Tables 2-3, but with the GDP growth forecast revisions as measures of unanticipated commodity demand shocks. The first thing to note is that the effect of advanced countries as a whole and the U.S. separately are much larger when we use GDP growth forecast revisions. This potentially reflects the fact that industrial production forecast revisions are more volatile than GDP growth forecast revisions.12 When we consider emerging Asia, we observe that GDP forecast revisions are not significant for any of the five commodities that we consider in this paper. This might simply be reflecting the fact that industrial production growth is a more relevant measure of demand for industrial metals which would also explain why the coefficients for emerging Asia become significant when we consider industrial production growth revisions.
VI. CONCLUSION It has often been argued that economic growth worldwide, and especially in emerging Asia, has been the key driver of the global boom in commodities during 2003-2008, as well as the collapse in commodity prices during the recent global financial crisis. This paper analyzes the role of global demand shocks, as measured by revisions in professional industrial production growth forecasts for a large set of EMEs and advanced economies, in explaining the movements in commodity prices over the last ten years. Broadly speaking, we find that growth forecast revisions play a significant role in explaining variations in the prices of crude oil and most industrial metals. However, the regression results and dynamic simulations suggest that the real effective exchange rate of the U.S dollar also plays a very significant role, especially for the industrial metals. The real interest rate plays a statistically significant role in explaining movements in the real price of oil.
Comparing the importance of different countries/regions, we find that forecast surprises in the U.S. and emerging Asia (i.e., China and India) are important for explaining movements in prices for most commodities in our sample. On the other hand, forecast revisions in other EMEs do not seem to play a significant role. This is not surprising given the relatively small shares of these countries in the global consumption of commodities included in our sample. 12
The standard deviation of industrial production forecast revisions is much higher than that of GDP growth forecast revisions for all countries in our sample.
17
Our results also point towards some interesting differences in the relative importance of different regions in explaining movements in commodity prices over our sample period. Broadly speaking, while forecast revisions in the U.S. seem more important for the 1999-2003 and 20082009 periods, growth forecast revisions for emerging Asia played a key role during 2003-2006. However, growth surprises in general fall short of explaining the fast run-up in most commodity prices during 2006-2008 and the magnitude of the collapse in prices during the recent global financial crisis. Furthermore, we find that the real effective exchange rate of the U.S. dollar has played a very significant role in explaining industrial commodity prices, especially their sustained increase during 2006-2008. It is therefore a variable that needs to be incorporated in empirical models of commodity prices. Finally, in contrast with some of the previous studies that use forecast revisions to capture demand shocks13, we find that growth in emerging Asian countries do not necessarily go very far in explaining oil prices. However, it is also important to recognize that there are caveats in this analysis. First, we are not able to identify whether the forecast revisions are permanent or transitory given the short time horizon of the forecast data. The effects of forecast revisions that are more persistent should be larger and, since we are not controlling for the persistence of different revisions, we are only capturing the average effect of forecast revisions in the sample. Second, we do not capture unanticipated shocks to other variables such as interest rates, exchange rates, and changes in supply in our empirical analysis. Although it may be possible to construct such measures using futures data and inflation forecasts, given our emphasis on demand shocks in this paper, we only use measures of unanticipated demand shocks. Future work in this area could benefit from extending this analysis in the direction of identifying shocks to other important determinants of commodity prices.
13
See, for instance, Kilian and Hicks (2009). As mentioned, there are some important differences between our framework and that of Kilian and Hicks. First, while Kilian and Hicks use revisions to forecasts of real GDP growth as the measure of commodity demand shocks, we focus on revisions to forecasts of IP growth which we believe is a better measure of commodities demand than real GDP. Second, we scale the monthly forecast revisions for each country with its share in the world consumption of the particular commodity, and thus capture the growing importance of emerging Asia in the consumption of commodities. In contrast, Kilian and Hicks scale the GDP growth forecast revisions by the share of the country’s real GDP in world real GDP (in PPP-adjusted terms).
18
VII. REFERENCES Akram, Farooq Q., 2009, “Commodity Prices, Interest Rates and the Dollar,” Energy Economics, Volume 31, Issue 6, November, pp. 838-851. Frankel, J. and A. Rose, 2009, “Determinants of Agricultural and Mineral Commodity Prices,” Mimeo, Kennedy School of Government, Harvard University. Grisse, Christian, 2010, “What Drives the Oil-Dollar Correlation?” Unpublished manuscript. Helbling, Thomas, Valerie Mercer-Blackman and Kevin Cheng, 2008, “Riding a Wave,” Finance and Development, March. Available at http://www.imf.org/external/pubs/ft/fandd/2008/03/index.htm IMF, 2010, World Economic Outlook, International Monetary Fund, April: Washington D.C. ____, 2008, World Economic Outlook, International Monetary Fund, April: Washington D.C. Kilian, Lutz, 2009, “Not All Oil Price Shocks are Alike: Disentangling Demand and Supply Shocks in the Crude Oil Market,” American Economic Review, 99:3, 1053-1069. Kilian, Lutz and Bruce Hicks, 2009, “Did Unexpectedly Strong Economic Growth Cause the Oil Price Shock of 2003-2008?” CEPR Discussion Paper Series No: 7265. Pindyck, Robert S. and Julio J. Rotemberg, 1990, “The Excess Co-Movement of Commodity Prices,” The Economic Journal, Vol. 100, No.403; pp. 1173-1189.
19
Appendix: Description of variables Variable Commodity Prices Crude oil Aluminum Copper Nickel Zinc Commodities consumption Crude oil
Description
Source
West Texas Intermediate Crude Oil at Cushing, Oklahoma (U.S.$/barrel) LME cash settlement (US$/lb.) LME cash settlement (US$/lb.) LME cash settlement (US$/lb.) LME cash settlement (US$/lb.)
Commodity Research Bureau (CRB)
Million tonnes
BP Statistical Review of World Energy, June 2011. World Bureau of Metals Statistics (WBMS); Bloomberg WBMS; Bloomberg WBMS; Bloomberg
Aluminum
Aluminum primary consumption (metric tons)
Copper Nickel Zinc
Refined copper consumption (metric tons) Semi-refined nickel consumption (metric tons) Zinc slab consumption (metric tons)
Inventories Crude oil
Total OECD petroleum stocks
Aluminum Copper Nickel Zinc
LME primary aluminum stocks, total commercial (metric tons) LME refined copper stocks, world total (metric tons) LME semi-refined copper stocks, world total (metric tons) LME zinc slab stocks, world total (metric tons)
CRB CRB CRB CRB
WBMS; Bloomberg International Energy Agency (IEA) WBMS; Bloomberg WBMS; Bloomberg WBMS; Bloomberg WBMS; Bloomberg
Commodities production Crude oil Aluminum Copper Nickel Zinc
Total world production (KBD) Aluminum Primary Production World Total Refined Copper Production World Total Semi Refined Nickel Production World Total Zinc Slab Production World Total
IEA WBMS; Bloomberg WBMS; Bloomberg WBMS; Bloomberg WBMS; Bloomberg
Macroeconomic data US CPI US$ REER
CPI-U: All items, SA Real effective exchange rate
Bureau of Labor Statistics Bank for International Settlements Department of Treasury
US 3-month T-bill rate
US Treasury, constant maturities 3-monthmiddle rate
20
Table 1a: Correlations between industrial production growth forecast revisions for different country groups U.S. U.S. Emerging Asia Other EMEs Advanced economies
1 0.35 0.69 0.72
Emerging Asia
Other EMEs
Advanced economies
1 0.33 0.40
1 0.83
1
Source: Consensus Economics and authors’ calculations
Table 1b: Properties of industrial production growth forecast revisions Country/region
Mean
Standard Deviation
AutoCorrelation
U.S
-0.14
0.45
0.11
Emerging Asia
0.04
0.44
0.12
Other EMEs
-0.07
0.45
0.73
Advanced economies
-0.12
0.40
0.86
Notes: All numbers are in percentage points. The numbers for emerging Asia, other EMEs, and advanced economies are the averages across the group of countries in each region. The list of countries is given in section IV(A).
21
Table 2: Industrial Production Forecast Revisions – Advanced economies and EMEs Aluminum (1)
Copper (2)
Nickel (3)
Zinc (4)
Oil (5)
Aluminum (6)
Copper (7)
Nickel (8)
Zinc (9)
Oil (10)
Advanced
-0.01 (-0.80)
-0.04 (-0.92)
-0.02 (-0.40)
-0.07 (-1.83)
0.08 (1.59)
0.05 (2.92)
0.06 (1.42)
0.03 (1.33)
0.02 (0.40)
0.06 (1.29)
Emerging Asia
0.13 (2.13)
0.22 (2.53)
0.02 (0.11)
0.10 (2.55)
0.27 (1.07)
Other EMEs
0.10 (0.81)
0.05 (0.31)
0.16 (1.51)
0.12 (0.64)
-0.17 (-0.75)
∆REER
-1.79 (-5.45)
-2.38 (-4.09)
-3.05 (-4.60)
-2.59 (-4.61)
-0.88 (-1.32)
-1.79 (-5.45)
-2.38 (-4.09)
-3.05 (-4.60)
-2.59 (-4.61)
-0.88 (-1.32)
∆Real rate
-0.51 (-0.71)
0.13 (0.15)
-0.22 (-0.15)
1.15 (0.78)
-4.50 (-3.61)
-0.51 (-0.71)
0.13 (0.15)
-0.22 (-0.15)
1.15 (0.78)
-4.50 (-3.61)
∆Inventories (t-1)
-0.04 (-0.74)
0.05 (1.46)
-0.05 (-1.47)
-0.06 (-0.54)
-1.95 (-2.87)
-0.04 (-0.74)
0.05 (1.46)
-0.05 (-1.47)
-0.06 (-0.54)
-1.95 (-2.87)
∆Supply
-0.03 (-0.31)
-0.05 (-0.34)
0.04 (0.39)
0.03 (0.39)
0.44 (0.64)
-0.03 (-0.31)
-0.05 (-0.34)
0.04 (0.39)
0.03 (0.39)
0.82 (1.07)
Res_emerging Asia
0.13 (2.13)
0.22 (2.53)
0.02 (0.19)
0.10 (2.55)
0.27 (1.07)
Res_other EMEs
0.10 (0.81)
0.05 (0.31)
0.16 (1.51)
0.12 (0.64)
-0.17 (-0.75)
Adj R-sqd.
0.34
0.25
0.16
0.21
0.24
0.34
0.25
0.16
0.21
0.24
Observations
137
137
137
137
137
137
137
137
137
137
Notes: Coefficients in bold are significant at the 10 percent level. Figures in parentheses are the t-statistics. All regressions are estimated using Newey-West standard errors, with 12 lags in the autocorrelation structure. The dependent variable in each regression is the log change in the real spot price of the respective commodity. The explanatory variables are specified as follows: ‘Advanced’ refers to the weighted forecast revisions to IP growth for advanced economies, with the weights being the countries’ shares in world consumption of the respective commodity (as described in section IV.A); ‘Emerging Asia’ refers to the weighted forecast revisions to IP growth for China and India; ‘Other EMEs’ refers to the weighted forecast revisions to IP growth for other EMEs in our sample (i.e. excluding China and India); ‘∆Exchange rate’is the log change in the U.S. dollar REER; ‘∆Real rate’ is the change in the 3-month U.S. T-bill rate (real); ‘∆Inventories (t-1)’ refers to the log change in inventories for the respective commodity lagged by one period; ‘∆Supply’ is the log change in the production of the respective commodity; ‘Res_emerging Asia’ and ‘Res_other EMEs’ are the “orthogonalized” forecast revisions for emerging Asia and other EMEs, respectively.
22
Table 3: Industrial Production Forecast Revisions – U.S. and EMEs Aluminum
Copper
Nickel
Zinc
Oil
Aluminum
Copper
Nickel
Zinc
Oil
(1)
(2)
(3)
(4)
(5)
(6)
(7)
(8)
(9)
(10)
U.S.
-0.01 (-0.35)
0.20 (1.43)
0.49 (2.53)
0.12 (0.75)
0.19 (2.51)
0.09 (2.82)
0.24 (3.83)
0.50 (4.65)
0.15 (2.13)
0.17 (2.12)
Emerging Asia
0.13 (2.04)
0.20 (2.28)
-0.04 (-0.45)
0.08 (1.87)
0.25 (1.07)
Other EMEs
0.07 (0.65)
-0.10 (-0.55)
0.03 (0.30)
-0.06 (-0.28)
-0.16 (-0.77)
∆REER
-1.78 (-5.28)
-2.10 (-4.76)
-2.86 (-4.95)
-2.53 (-4.72)
-0.84 (-1.36)
-1.76 (-5.29)
-2.28 (-4.38)
-2.86 (-4.95)
-2.53 (-4.72)
-0.85 (-1.36)
∆Real rate
-0.55 (-0.74)
-0.20 (-0.22)
-0.50 (-0.33)
0.90 (0.61)
-4.52 (-344)
-0.53 (-0.70)
-0.20 (-0.22)
-0.50 (-0.33)
0.90 (0.61)
-4.52 (-3.44)
∆Inventories (-1)
-0.03 (-0.68)
0.04 (1.16)
-0.04 (-1.00)
-0.04 (-0.38)
-1.95 (-2.90)
-0.06 (-1.48)
0.04 (1.16)
-0.04 (-1.00)
-0.04 (-0.38)
-1.95 (-2.90)
∆Supply
-0.03 (-0.35)
-0.07 (-0.43)
0.04 (0.33)
0.02 (0.25)
0.54 (0.79)
-0.06 (-0.65)
-0.07 (-0.43)
0.04 (0.33)
0.02 (0.25)
0.54 (0.79)
-0.04 (-0.45)
0.08 (1.87)
0.25 (1.07)
Res_emerging Asia
0.13 (2.04)
Res_other EMEs
0.07 (0.65)
-0.10 (-0.55)
0.03 (0.30)
-0.06 (-0.28)
-0.16 (-0.77)
0.19 (2.28)
Adj R-sqd.
0.34
0.26
0.19
0.21
0.26
0.34
0.26
0.19
0.21
0.26
Observations
137
137
137
137
137
137
137
137
137
137
Notes: Coefficients in bold are significant at the 10 percent level. Figures in parentheses are the t-statistics. All regressions are estimated using Newey-West standard errors, with 12 lags in the autocorrelation structure. The dependent variable in each regression is the log change in the real spot price of the respective commodity. ‘U.S.’ refers to the weighted forecast revisions to IP growth for the U.S. For a description of the other explanatory variables, see notes to Table 2.
23
Table 4: GDP Growth Forecast Revisions – Advanced economies and EMEs Aluminum (1)
Copper (2)
Nickel (3)
Zinc (4)
Oil (5)
Aluminum (6)
Copper (7)
Nickel (8)
Zinc (9)
Oil (10)
Advanced
0.04 (0.57)
0.23 (1.20)
0.15 (0.97)
0.11 (0.69)
0.33 (2.41)
0.12 (2.22)
0.22 (2.60)
0.16 (2.33)
0.12 (1.77)
0.25 (2.87)
Emerging Asia
0.04 (0.31)
0.18 (1.22)
0.05 (0.24)
0.17 (1.61)
0.74 (1.38)
Other EMEs
0.34 (1.46)
-0.13 (-0.35)
-0.01 (-0.03)
-0.13 (-0.34)
-0.48 (-0.92)
∆ REER
-1.75 (-5.00)
-2.15 (-4.45)
-2.86 (-4.95)
-2.41 (-4.36)
-0.62 (-1.13)
-1.75 (-5.00)
-2.15 (-4.45)
-2.86 (-4.95)
-2.41 (-4.36)
-0.62 (-1.13)
∆ Real rate
-1.27 (-1.48)
-1.06 (-0.78)
-0.44 (-0.37)
0.55 (0.41)
-5.17 (-4.37)
-1.27 (-1.48)
-1.06 (-0.78)
-0.44 (-0.37)
0.55 (0.41)
-5.17 (-4.37)
∆ Inventories (-1)
-0.04 (-0.73)
-0.03 (1.01)
-0.04 (-1.26)
-0.02 (-0.22)
-1.80 (-3.04)
-0.04 (-0.73)
0.03 (1.01)
-0.04 (-1.26)
-0.02 (-0.22)
-1.80 (-3.04)
∆ Supply
-0.04 (-0.44)
-0.11 (-0.82)
0.05 (0.51)
0.03 (0.37)
0.38 (0.59)
-0.04 (-0.44)
-0.11 (-0.82)
0.05 (0.51)
0.03 (0.37)
0.38 (0.59)
0.04 (0.31)
0.18 (1.22)
0.05 (0.24)
(1.61)
0.74 (1.38)
0.34 (1.46)
-0.13 (-0.35)
-0.01 (-0.03)
-0.13 (-0.34)
-0.48 (-0.92)
0.17 Res_emerging Asia
Res_other EMEs Adj R-sqd.
0.28
0.21
0.16
0.21
0.30
0.28
0.21
0.16
0.21
0.30
Observations
137
137
137
137
137
137
137
137
137
137
Notes: Coefficients in bold are significant at the 10 percent level. Figures in parentheses are the t-statistics. All regressions are estimated using Newey-West standard errors, with 12 lags in the autocorrelation structure. The dependent variable in each regression is the log change in the real spot price of the respective commodity. The variables ‘Advanced’, ‘emerging Asia’, and ‘other EMEs’ refer to the weight forecast revisions to real GDP growth for the respective country groups. For a description of the other explanatory variables, see notes to Table 2.
24
Table 5: GDP Growth Forecast Revisions – U.S. and EMEs Aluminum (1)
Copper (2)
Nickel (3)
Zinc (4)
Oil (5)
Aluminum (6)
Copper (7)
Nickel (8)
Zinc (9)
Oil (10)
U.S.
0.06 (0.74)
0.33 (1.15)
1.02 (2.88)
0.25 (1.02) 0.18
0.43 (3.01) 0.76
0.17 (2.15)
0.40 (2.37)
0.97 (5.36)
0.26 (2.22)
0.42 (3.84)
Emerging Asia
0.04 (0.32)
0.20 (1.30)
0.07 (0.36)
(1.63)
(1.49)
Other EMEs
0.36 (1.68)
0.01 (0.02)
-0.07 (-0.31)
-0.11 (-0.39)
-0.27 (-0.64)
∆ REER
-1.76 (-5.03)
-2.21 (-4.40)
-2.94 (-5.39)
-2.42 (-4.36)
-0.69 (-1.26)
-1.76 (-5.03)
-2.21 (-4.40)
-2.94 (-5.39)
-2.42 (-4.36)
-0.69 (-1.26)
∆ Real rate
-1.28 (-1.48)
-1.12 (-0.76)
-0.85 (-0.68)
0.43 (0.31)
-5.24 (-4.51)
-1.28 (-1.48)
-1.12 (-0.76)
-0.85 (-0.68)
0.43 (0.31)
-5.24 (-4.51)
∆ Inventories (-1)
-0.04 (-0.90)
0.03 (0.92)
-0.05 (-1.56)
-0.03 (-0.31)
-1.77 (-2.91)
-0.04 (-0.90)
0.03 (0.92)
-0.05 (-1.56)
-0.03 (-0.31)
-1.77 (-2.91)
∆ Supply
-0.04 (-0.42)
-0.11 (-0.80)
0.07 (0.57)
0.03 (0.34)
0.44 (0.70)
-0.04 (-0.42)
-0.11 (-0.80)
0.07 (0.57)
0.03 (0.34)
0.44 (0.70)
0.04 (0.32)
0.20 (1.30)
0.07 (0.36)
0.18 (1.63)
0.76 (1.49)
0.36 (1.68)
0.01 (0.02)
-0.07 (-0.31)
-0.11 (-0.39)
-0.27 (-0.64)
Res_emerging Asia
Res_other EMEs
Adj R-sqd.
0.28
0.21
0.20
0.21
0.31
0.28
0.21
0.20
0.21
0.31
Observations
137
137
137
137
137
137
137
137
137
137
Notes: Coefficients in bold are significant at the 10 percent level. Figures in parentheses are the t-statistics. All regressions are estimated using Newey-West standard errors, with 12 lags in the autocorrelation structure. The dependent variable in each regression is the log change in the real spot price of the respective commodity. The variables ‘Advanced’, ‘emerging Asia’, and ‘other EMEs’ refer to the weighted forecast revisions for real GDP growth for the respective country groups. For a description of the other explanatory variables, see notes to Table 2.
25
Figure 1: Real commodity prices (Dec 2000 =100) 600 Crude Oil Copper Zinc
500 400
Aluminum Nickel
300 200 100 0 Jan‐10
Jan‐09
Jan‐08
Jan‐07
Jan‐06
Jan‐05
Jan‐04
Jan‐03
Jan‐02
Jan‐01
Jan‐00
Jan‐99
Jan‐98
Jan‐97
Jan‐96
Jan‐95
Jan‐94
Jan‐93
Jan‐92
Jan‐91
Jan 90
Source: Bank of Canada, Bureau of Labor Statistics, and authors’ calculations
Figure 2: Real GDP Growth 16
per cent
11
6
1 1990 ‐4
1992
1994 1996 United States Advanced economies China
1998
2000
2002 2004 2006 2008 Emerging Asia (excl. China and India) Emerging and developing economies India
2010
Source: International Monetary Fund, World Economic Outlook Database, April 2011
Figure 3: Real Effective Exchange Rate of the U.S. Dollar (Jan 1999 =100) 120 115 110 105 100 95 90 85 80 75
Jan 99 Jul 99 Jan 00 Jul 00 Jan 01 Jul 01 Jan 02 Jul 02 Jan 03 Jul 03 Jan 04 Jul 04 Jan 05 Jul 05 Jan 06 Jul 06 Jan 07 Jul 07 Jan 08 Jul 08 Jan 09 Jul‐09 Jan‐10 Jul‐10 Jan‐11
70
An increase is an appreciation. Source: BIS
26
Figure 4: Consumption as a share of world consumption of commodities (a): Crude Oil 35 30 25
percent
20 15 10 5 0 99
00
01
02
Other EMEs
03
China
04
05
India
06 U.S.
07
10
(c): Aluminum
45
50
40
45
35
40 35
30
30
25
percent
percent
09
Adva nced (excl. U.S.)
(b): Copper
20
25 20
15
15
10
10
5
5 0
0 99
00
01
02
03
04
05
Other EMEs India Adva nced (excl. U.S.)
06
07
08
09
99
10
China U.S.
00
01
02
03
04
05
06
07
Other EMEs
China
India
U.S.
08
09
Adva nced (excl. U.S.)
(d): Nickel
(e): Zinc
60
50 45
50
40 35
percent
40
percent
08
30 20
30 25 20 15 10
10
5 0
0 99
00
01
02
03
04
05
06
07
08
09
10
99
00
01
02
03
04
05
06
Other EMEs
China
Other EMEs
China
India
U.S.
India
U.S.
07
Adva nced (excl. U.S.)
Adva nced (excl. U.S.)
Note: All figures show commodity consumption as a share of world consumption, expressed in percentage points. Source: BP, WBMS, and authors’ calculations.
27
08
09
10
10
28
2010m8
2010m2
2009m8
2009m2
Exchange Rate
2008m8
2008m2
2007m8
2007m2
2006m8
2006m2
US
2005m8
2005m2
2004m8
Emerging Asia
2004m2
2003m8
2003m2
2002m8
2002m2
2001m8
2010m8
2010m2
2009m8
2009m2
2008m8
2008m2
2007m8
2007m2
2006m8
2006m2
2005m8
2005m2
2004m8
2004m2
2003m8
2003m2
2002m8
2002m2
2001m8
2001m2
2000m8
2000m2
1999m8
0.5
2001m2
2000m8
2000m2
1999m8
Figure 5: Predicted values for the real price of aluminum (a): Actual versus model prediction
1
Model
Actual
0
-0.5
-1
(b): Contribution of different factors to aluminum prices
1
Unexplained
0.5
0
-0.5
29
-1
2008m8
2008m2
2007m8
2007m2
2006m8
2006m2
2005m8
2005m2
2004m8
2004m2
2003m8
2003m2
2002m8
2010m8
-0.5
2010m8
0
2010m2
Unexplained
2010m2
0.5
2009m8
(b): Contribution of different factors to copper prices
2009m8
1
2009m2
-1.5
2009m2
2008m8
2008m2
2007m8
Exchange Rate
2007m2
2006m8
2006m2
2005m8
US
2005m2
2004m8
Emerging Asia
2004m2
2003m8
2003m2
2002m8
2002m2
2001m8
2001m2
2000m8
2000m2
1999m8
Model
2002m2
2001m8
2001m2
2000m8
2000m2
1999m8
Figure 6: Predicted values for the real price of copper (a): Actual versus model prediction
1 Actual
0.5
0
-0.5
-1
-1.5
30
-1
2008m8
2008m2
2007m8
2007m2
2006m8
2006m2
2005m8
2005m2
2004m8
2004m2
2003m8
2003m2
2002m8
2002m2
2001m8
2010m8
2010m8
-0.5
2010m2
0
2010m2
0.5
2009m8
1
2009m8
Unexplained
2009m2
1.5
2009m2
(b): Contribution of different factors to nickel prices
2008m8
2008m2
2007m8
2007m2
Exchange Rate
2006m8
2006m2
2005m8
2005m2
US
2004m8
2004m2
2003m8
Emerging Asia
2003m2
2002m8
2002m2
2001m8
2001m2
2000m8
2000m2
1
2001m2
2000m8
2000m2
1999m8
-1.5
1999m8
Figure 7: Predicted values for the real price of nickel (a): Actual versus model prediction
1.5
Model
Actual
0.5
0
-0.5
-1
31
-1
2008m8
2008m2
2007m8
2007m2
2006m8
2006m2
2005m8
2005m2
2004m8
2004m2
2003m8
2003m2
2010m8
-0.5
2010m8
0
2010m2
0.5
2010m2
Unexplained
2009m8
1
2009m8
1.5
2009m2
(b): Contribution of different factors to zinc prices
2009m2
2008m8
2008m2
Exchange Rate
2007m8
2007m2
2006m8
2006m2
2005m8
US
2005m2
2004m8
Emerging Asia
2004m2
2003m8
2003m2
2002m8
2002m2
2001m8
2001m2
2000m8
2000m2
1999m8
Model
2002m8
2002m2
2001m8
2001m2
2000m8
2000m2
1999m8
Figure 8: Predicted values for the real price of zinc (a): Actual versus model prediction
1.5 Actual
1
0.5
0
-0.5
-1
-1.5
32 Exchange Rate
Inventories Real Interest Rate
0.5
0
-0.5
-1
2009m2
2008m8
2008m2
2007m8
2007m2
2006m8
2006m2
2005m8
2005m2
2004m8
2004m2
2003m8
2003m2
2002m8
2002m2
2001m8
2001m2
2000m8
2000m2
1999m8
2010m8
US
Unexplained
2010m8
Emerging Asia
2010m2
1
2010m2
(b): Contribution of different factors to oil prices 2009m8
-1.5
2009m8
2009m2
2008m8
2008m2
2007m8
2007m2
2006m8
2006m2
2005m8
2005m2
2004m8
2004m2
2003m8
2003m2
2002m8
2002m2
2001m8
2001m2
2000m8
2000m2
1999m8
Figure 9: Predicted values for the real price of crude oil
(a): Actual versus model prediction
1 model
Actual
0.5
0
-0.5
-1