Grid-Tied Photovoltaic Development and Barriers in Texas
Prepared by Ricardo Castillo Min Budathoki Yang Wang
for ECE 689 - 605
Technical Report: TR-2010-ECE689fall Group December 10, 2010
Texas A&M University College Station, Texas, 77843 1
Executive Summary
This report describes the grid-tied photovoltaic market, the technology, the support policies and the barriers that have impacted the development of this market. This report is organized into five sections. Section 1 is the introduction of the report. Section 2 contains technology aspects of photovoltaic systems; section 3 contains economic aspects of photovoltaic; section 4 contains barriers different than technological and economical. The last sections contain our conclusion.
TR-2010-ECE689fall_Group
Page 1
Contents 1. Introduction ..........................................................................................................................................3 2. Technology ............................................................................................................................................4 2.1
History of Photovoltaic Technology
4
2.2
Some recent PV innovations in labs
5
2.3
Photovoltaic System Analysis
6
2.3.1
Modules
6
2.3.2
Inverters
8
2.4
PV Performance Analysis
10
2.5
Some other technological Barriers in PV system
11
3. Economics ...........................................................................................................................................12 3.1
3.4
Energy Market in Texas
12
3.2
Cost of Electricity in Texas
13
3.3
Cost of Photovoltaics
13
Economical Barrier
15
3.5.2.2 Rebates
18
3.5.2.3 Net-metering:
35
4. Other Barrier: ....................................................................................................................................41 4.1
Regulations and Permitting
41
4.2
Sitting and Aesthetic Issues
41
4.3
Lack of Solar Knowledge
41
4.4
Lack of government policy supporting EE/RE.
41
4.5 Difficulty overcoming established energy systems.
42
4.6 Failure to account for all costs and benefits of energy choices.
42
4.5
42
4.7 Inadequate workforce skills and training.
5. Conclusion ..........................................................................................................................................43 6. REFERENCES ...................................................................................................................................45
TR-2010-ECE689fall_Group
Page 2
1. INTRODUCTION Texas has been a global energy leader in oil and gas drilling, production, and refining. This allowed Texas to gain expertise in energy research and innovation, which in combination with huge natural resource could be used to develop energy production based on solar energy. The global PV market has grown by an average of 30 percent annually for the last 2 decades. With this increase, there is significant improvement in economical scale of manufacturers. The consumption of electricity is growing every other day. The average use of electricity varies from state to state so we focused our research on the national level first and then it will be compare with the energy that we use in Texas. Our project at this time will include available resources, and other benefits for supporting photovoltaic (PV) technology in Texas. The Texas electric market and the impact of the PV dissemination programs at both federal and state level will be discussed, and some of the technological and social barriers that should be overcome in order to make PV viable will be identified
TR-2010-ECE689fall_Group
Page 3
2. TECHNOLOGY 2.1 History of Photovoltaic Technology The foundation of solar photovoltaic energy was laid in 1839 by French scientist Edmond Becquerel with the discovery of photovoltaic effect. During early twentieth century some progress was made for the development of solar power. The first application of solar power was made in 1958 when VanguardOne, a satellite with small solar array, was launched to the space. In 1970, the price of solar power was $20/watt [1] and it has been estimated that by 1977, the global annual photovoltaic installed capacity was 500 kilowatt (kW) [2]. After 1982, full megawatts scale projects started to emerge as well as intense research in this topic, which contributed with advancements in technology. By 1999, the world’s solar cumulative power capacity reached 1 giga watt (GW) [2], and the application of solar photovoltaic became more diverse and its use was spread worldwide. Solar photovoltaic (PV) is a semiconductor technology that converts sunlight directly into electricity. The thin semiconductor wafer forms an electric field with positive terminal on one side and negative on the other side. The semiconductor material exhibit a property called photoelectric effect that absorbs photon of light and releases electrons. These electrons in turn constitute the electric current which can be used as electricity. A number of solar cells are electrically connected to each other and are placed on the frame to form a photovoltaic module. In turn multiple modules are wired together to form an array. In fact, modules can be configured in both series and parallel arrangement to get any required voltage and current. In today’s PV device, single junction/interface is used to create an electric field. Here, the photons with energy above the band gap of the semiconductor device are used while those of lower energy photons are unused. In addition to single junction PV cell, there is a multi-junction device still under research. In multi-junction device, individual single- junction cells are arranged in the descending order of band gap. The top junction (e.g. Gallium indium phosphide) captures the high energy photons while the remaining junctions aid the flow of photons (e.g. copper indium diselenide, Gallium arsenide). Such cell combination is believed to have efficiency of 35% [3]. According to the recent survey done by solarbuzz.com, today’s market shares (78-80) % by crystalline silicon solar cell while thin film solar cell shares only (18-20) %. Crystalline silicon used in solar cell is poor absorber and thus required more thickness. The efficiency of such cell is in between (11-16) %. In fact, there are two types of crystalline silicon used in the today’s industry, namely mono and multi-crystalline silicon. An interface is formed by doping phosphorous on the top of boron. In practice, most efficient production cell have mono-crystalline silicon as the semiconductor in solar cell. On the other hand, thin film solar cells have amorphous silicon to absorb light. Here, material cost are significantly reduced while the efficiency ranges from (5-8) %. There is a tradeoff between price and efficiency between thin film and crystalline solar cell. The thin film solar cell is more popular in residential uses and is exploring every year due to its economic price.
TR-2010-ECE689fall_Group
Page 4
2.2 Some recent PV innovations in labs A) Research and development (R&D) is done to improve the efficiency of these thin film technology. For instance, according to the US National Renewable Energy Laboratory (NREL), they have successfully tested thin film solar cell based on copper indium gallium diselenide (CIGS) with efficiency of 19.9% [4] as shown in figure 1. This makes thin film competitive with traditional silicon semiconductor cell.
Figure 1 Copper indium gallium diselenide (CIGS) thin-film solar cell (NREL) [] B) On the other hand, SUNRGI a California based PV manufacturing has developed a Xtreme Concentrated Photovoltaic (XCPV) that concentrate sun’s light close to 2000 times. It is believed that the wholesale cost of electricity produced from such PV cell is as low as five cents per kWh [5]. If such cells are commercially used in the market, the price is competitive with the wholesale of producing electricity using fossils fuels. Here, the system tracks the sun from sunrise to sun set. In short, these cells have advantages of more efficient (~37%) as well as less surface area for the same output. Figure 2 shows the comparisons of average outputs of three different PV cell in Daggett, California in the period of one year.
Figure 2 Energy output comparison for three different PV cell [4] According to the research done by State Energy Conservation Office (SECO), the energy from sunshine falling on one acre of west Texas land is capable of producing energy equivalent of 800 barrels of oil each year. While west Texas has a huge potential of solar resources, this technology can be implemented readily. TR-2010-ECE689fall_Group
Page 5
C) Researchers at McMaster University have developed light absorbing nanowires made from high performance photovoltaic such as gallium arsenide, indium gallium phosphide on carbon nanotube fabric as shown in figure 3. They have a target of achieving 20% efficiency within couple years. This technology can be the best alternatives for current thin film technology of (58) % efficiency. The reason behind this fact is that, nanotubes have absorbing nature and we can significantly reduce manufacturing cost.
Figure 3 Hairy solar panels made from nanowire [4] 2.3 Photovoltaic System Analysis Now, let us discuss more detail about photovoltaic system. The photovoltaic system is composed of following major components as shown in figure 4: a) Modules for Energy conversion b) Inverter for energy inversion c) Utility meter for energy distribution and d) Electric Utility for transmission and distribution
Figure 4 Photovoltaic System Composition
2.3.1
Modules
Technological details about the solar modules have already been discussed in the previous section. However, in this section we are going to estimate the average cost of PV modules per watt. In general, an installation cost of PV system is determined by the cumulative cost of modules, inverter, regulatory and compliance, and labor cost. More importantly, about 50 % of the installation cost is determined by the price of module as shown in figure 5. Figure 6 and 7 show the survey that was made within United States to calculate the average cost of PV modules and PV inverters. TR-2010-ECE689fall_Group
Page 6
Figure 5 Pv system installation cost/watt
Figure 6 Price survey of PV modules cost/watt
Average Price per Watts for Grid-Tied inverters
2 1.8
KACO
1.6
PV Powered
$/Watts
1.4
Beacon Power
1.2
Outback Power Systems Solectria
1 0.8
SMA
0.6
Xantrex
0.4 0.2 0 0
2000
4000
6000
8000
10000
12000
14000
16000
Power Rating (Watts)
Figure 7 Price Survey of Grid-Tied Inverters United States The installation cost varies widely within United States and overseas. Now, let us calculate the average residential installation cost per watt for in Unites States based on the assumption on the following assumptions:
Modules=$2.65 (from figure 6) Inverter = 0.65 (considering inverters below 10k –residential system, figure7) Labor cost = $0.75 Regulatory, Compliance =$2.35 Other accessory materials =$.56
TR-2010-ECE689fall_Group
Page 7
Total sums up to $6.96 ~$7.00 The average PV installation cost per watt decline by an average of $.30 from 1998 to 2008 [5].This can be illustrated in the figure 8. For residential PV, the average installation cost has reduced from $12.30/watt in 1998 to $8.50/watt in 2008. This reduction in cost is the cumulative effect of improvement in cost structure and efficiency of PV infrastructure and of course the policy.
Figure 8 Average installation cost/watt historical trends [5] On the other hand, in 2007 the average installation cost per watt in Japan was $5.9/watt while that of Germany was $6.6/watt. During the same year, the average installation cost in US was $7.9/watt. The reason behind this high cost PV installation in US might be because of the less grid-connected PV capacity (500MW) as compared to Japan (1800MW) and Germany (3800 MW). However, it is important to keep in mind that, market size is not the only determining factor. For instance, Japan had smaller market as compare to Germany but the installation cost/watt was lower. One reason behind this fact was that PV support policies in Japan were oriented to the residential sector. Several other factors that make the difference in installation cost include labor cost, foreign exchange rate, procedure for receiving incentives, and the module cost.
2.3.2
Inverters
Now, let us discuss more on the inverter from the technological prospective. Inverter currently comprises 10% of the system cost. The higher the power rating of the inverter, the less average price/watt we get. This can be seen from the graph above. Technology in the inverter mainly affects CEC efficiency and the warranty period. From the recent survey made in United States, the grid-tied inverters in the market have CEC efficiency of 95%. Inverters are becoming more sophisticated with the advancing technology. Inverters these days are designed with many features such as data logging and communication capabilities. A configuration called master-slave is introduced to operate inverter at a maximum power levels for higher system efficiency. In addition to that multi-string inverter can be used to connect many strings to a single inverter to have separate maximum power point tracker (MPPT) to each string. This method is beneficial for PV with shading problems. Many inverter models available in US don’t have such features. TR-2010-ECE689fall_Group
Page 8
On the other hand, it is believed that conventional inverters are responsible for the loss of 2% in peak efficiency. Furthermore, they are weightier. In order to solve such problem, transformerless inverters are introduced and are more popular in Japan and Germany. However, the development of transformerless inverter in US is very slow. In august 2010, SMA has received certificates from Underwriters Laboratory (UL) for its transformerless inverter. Now, SMA can distribute them in the US market. Some of these models include Sunny Boy 8000TL-US, Sunny Boy 9000TL-US, and Sunny Boy 10000TL-US inverters. Before that there was a special requirement imposing designer to use galvanically isolated device because there was concern about having transformerless electrical system feed into the public utility grid (lack of galvanization between AC and DC circuit). High frequency inverter on the other hand employs multi-step process to convert power into high frequency AC and back to DC, and finally to the AC output voltage. These HF transformers are small, lightweight and provide isolation. These are considered as the compromises between low frequency (traditional transformer) and transformerless design. Regarding the transformerless inverter, manufacturer still expect changes in regulations or in utilities requirements and in the meantime inverter with transformer continue to serve the market. In addition to efficiency & design, warranty is a part of inverter’s technology. From the recent market survey in US (Assignment #2), the grid-tied PV inverter has an average warranty period of 5-10 years, while off-grid have 1-3 years within the same power rating. Some manufacturers such as KACO, PV Powered, SMA, Xantrex, and Fronius offer their customers a warranty of 10 years. This data supports the rapid expansion of grid-tied PV in US as compare to off-grid. Thus, technology plays a significant role in solar energy implementation. It is important to keep in mind that the main barrier for the growth of PV industry is high cost. The cost in turn is directly related to the technological achievement we make in these areas. For instance, reducing the module material cost by using effective semiconductor material/technology and increasing efficiency leads us to significantly reduce installation cost. The following is the survey done by international energy agency (IEA), 2002 and 2007 to study the components reliability and system performance. Although these data are pretty old but still represent the same trend in PV industry. Also, there is not vast technological difference between Europe, North America and Asia, it still represent US PV market. The big difference it make is with federal, states, & local policies. More importantly, this is even valid for different states in US. Thus, we have assumed Texas is also represented in the research & survey we made in this photovoltaic technology part
TR-2010-ECE689fall_Group
Page 9
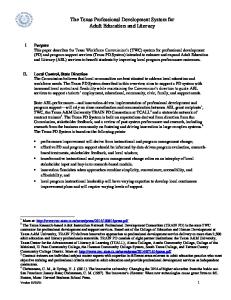
2.4 PV Performance Analysis According to the report published by IEA in 2002, inverters have more failure rate than other component in Photovoltaic power system as shown in figure 9. This is the result published after the survey done 1000 roof in Germany. Although, the failure rates is declining with the innovation and research over time but
Figure 9 PV system failure rate in Germany surveyed in 1000 roof [6]
this significantly impact PV performance, and reliability.
Figure 10 shows the data published in 2007 by IEA PVPS about the performance ratio of Photovoltaic power system.
Figure 10 performance ratio over time in grid connected PV system between 1990 and 2006 [7] In this survey, 461grid-tied PV system built in between 1990 and 2006 with a total of 1648 years of operational data were analyzed. The survey was done in PV system below 10k (residential) and the participant countries were from Germany, Japan and Switzerland. The middle green dots represent the mean performance value of the PV system over time. This report shows a trend towards higher inverter efficiency and hence higher performance ratio over time. This survey reveals that there always exist challenges in improving the reliability of the inverter. Some of the methods that help towards better inverter and overall system reliability are as follows:
Building block approach for standardization and modularization of the inverters
TR-2010-ECE689fall_Group
Page 10
Interconnection technologies Reduction in inverter heat loss, and better electrolytic capacitor Design, installations and standards maintenance can significantly improve this part
2.5 Some other technological Barriers in PV system Since the main challenge in PV system is the high cost, several ways of managing cost have already been discussed. In addition to cost, solar energy is not highly concentrated and therefore requires significant surface area to collect an appreciable amount of energy. Research and development is underway to introduce high concentration photovoltaic in the market in affordable price. Also, there are lots of protection issues related to PV system. Some of them are:
Ground fault can harm life and electronic components The system is always energized In-circuit arc can ignite fire Overcurrent protection difficult to provide
Intermittency is another technological problem related at high penetration. Such problem can be solved using Energy storage that decreases base load generation requirement. Storage device such as Batteries (lithium, lead-acid, alkaline), Kinetic flywheel, or hydrogen fuel cell can be used depending on the cost, efficiency and available resources. In short, from the research done on the Technological reveals that solar photovoltaic energy has great potential to contribute on the renewable energy system. However, there are many technological challenges to overcome every other day. The challenges include but not limited to cell material &module technology, power electronic system (inverter), and electrical network. From the cost prospective, PV modules play a significant role and from the system reliability point of view, inverter plays an important role. Our modern technology should focus on solving this problem in order to have overall system reliability.
TR-2010-ECE689fall_Group
Page 11
3. ECONOMICS
3.1 Energy Market in Texas Due to its large population and an energy-intensive economy, Texas leads the nation in energy consumption [9], accounting for more than one-tenth of total U.S. energy use and per capita residential use of electricity is significantly higher than the national average, due to high demand for electric airconditioning during the hot summer months and the widespread use of electricity as the primary energy source for home heating during the typically mild winter months. Since January 1, 2002, Texas has a deregulated market, which means that people have the power to choose their electricity provider [10]. Deregulation was designed to promote competition among retail electricity providers (REPs), which in turn, spurs competitive pricing. However, deregulation is not present in all the state. For instance, in areas served by cooperatives or municipal utilities, people have the option of choosing an alternate REP only if the cooperatives and municipal utilities opted in to deregulation. To date, only the area served by the Nueces Electric Cooperative has chosen to opt in. Therefore, deregulation has not been opted in by most of the municipal and cooperatives utilities in Texas. ERCOT is one of nine regional electric reliability councils under North American Electric Reliability Corporation (NERC) authority, which was designated for operating the electric grid and managing the deregulated market for 75 percent of the land area (figure 11) and 85% of the electric consumption in the state [14].
Figure 11 ERCOT Area
Texas is a state with abundant natural resources, which are used for meeting its energy needs. Texas leads the Nation in fossil fuel reserves. Texas crude oil reserves represent almost one-fourth of the U.S. total, and Texas natural gas reserves account for over three tenths of the U.S. total, making it the nation’s leading natural gas producer [18]. Natural gas-fired power plants typically account for about one-half of the electricity produced in Texas and coal-fired plants account for much of the remaining generation [18]. Texas is a major nuclear power generating State. Two nuclear plants, Comanche Peak and South Texas Project, typically account for about one-tenth of the State’s electric power production.
TR-2010-ECE689fall_Group
Page 12
As an example of the non-renewable energy source dependence in Texas, figure shows the sources of energy for generating electricity in the ERCOT area. According to figure, natural gas is the most important source followed by coal and nuclear. Due to the size and the dependence of the electricity market in fossil fuels, the emissions of carbon dioxide and
Figure 12 Sources of energy in ERCOT area [1]
sulfur dioxide are among the highest the nation. Texas leads the nation non hydroelectric renewable energy potential, including wind, solar, and biomass resources. Despite this potential, renewable energy sources contribute minimally to the Texas power grid (about 2% in ERCOT area). Most of the electricity from renewable energy sources in Texas is generated with wind. 3.2 Cost of Electricity in Texas Texas retail electricity prices (price that REPs sell the electricity to the consumers) averaged 11.99 cents per kWh for residential, 10.27 cents per kWh for commercial, and 8.27 cents per kWh for industrial customers in March 2008 [11]. On the other hand, wholesale electricity price (price that power generation companies sell the electricity to REPs) is significantly lower, averaging 5.5 cents per kWh, but ranging from an average monthly low of about 4.5 cents per kWh in October to an average high of about 7.5 cents per kWh in August 2006 [11]. The wholesale price of electricity during peak hours, however, can sometimes rise to over 80 cents per kWh in ERCOT. 3.3 Cost of Photovoltaics PV system cost, which is measured in dollars per watt ($/W), involves module and non-module cost. The non-module cost may include array mounts, wiring, switches, fuses, connectors, the inverter and possibly metering or other components that may be required for the interconnection. The installation cost, permitting and fees, shipping, and taxes also must be included. Figure 13 shows the trend of global module price from 1998 to 2008. In this period, the average percentage of the module cost was 52 % of the system cost, which give us an idea how important is the module price for the total cost of the system. The price of solar PV panels (or ―modules‖) is established by national and even global markets. According to figure, from 1998 to 2008, the average sale price of modules reduced from 6 to about 4 $/W, that is, a reduction of 33%. However, this price has fallen from $4 per watt in 2008 to about $1.80 per watt in early 2010 [17], which means a drop of about 50 percent, attributable in part to slow demand during the economic crisis and to a global surplus of silicon. Based on this trend, the module price is expected to continue to drop. TR-2010-ECE689fall_Group
Page 13
Figure 13 Module and non-module price over the time [13] As a consequence of the drop of the module price, the cost of electricity generated from photovoltaics has decreased as shown in figure 14. Currently this ranges from about 20 to 35 cents per kWh [11]. This cost is significantly higher than the average wholesale price of electricity.
However, wholesale price of
electricity sometimes can rise to over 80 cents per kWh in ERCOT area [11] during peak Figure 14 Trend of Photovoltaic cost over the time [8] demand hours, which occur incidentally when solar resource is greatest, particularly in Texas. The fact that solar energy tends to be synchronous with energy demands, makes solar PV applications suited during peak periods, which would help to offset the need to add expensive electric generating capacity to satisfy peak demand. This also could lead to substantial savings for Texas energy consumers in the form of ―avoided generation capacity capital costs, avoided fuel costs, avoided CO2 emissions, the value of fossil fuel price hedging and avoided distribution costs. Trends in non-module costs may be particularly relevant in gauging the impact of state and utility PV programs. Non-module costs consist of a variety of cost components that may be more readily affected by local programs – including both deployment programs aimed at increasing demand (and thereby increasing competition and efficiency among installers) as well as more targeted efforts (e.g., training and education programs). Non-module costs have fallen over time, at least until 2005, suggests that state and local PV programs have had some success in driving down the installed cost of PV. Cost will continue to decrease as experience is gained in installation, as interconnection and installation requirements are standardized and as a fair value for PV electricity is agreed upon. And, of TR-2010-ECE689fall_Group
Page 14
course, if petroleum becomes scarcer or if global warming is taken seriously, the price of fossil generation may rise to the cost of PV generation. 3.4 Economical Barrier The main motivation for developing PV technology is the desire to reduce dependence on depletable fossil fuels with their adverse effect on the environment. Photovoltaic technology has made huge technological and cost improvement, but except for certain niche markets such as remote power applications, PV technology is still more expensive than traditional energy sources in terms of initial cost. PV has its major cost ―upfront‖. This means that buying a PV system is like paying years of electric bills up front. Your monthly electric bills will go down, but the initial expense of PV may be significant. Investment in a PV system tends to be problematic for small businesses and individuals who find it hard to raise the initial capital. In order to understand the real cost of a PV system, it is necessary to perform a life-cycle analysis, that is, the total cost of owning and operating the system over its lifetime.
Figure 15, PV life-cycle analysis [19]
Figure 15 shows an example of the cash flow over the life of a PV system. Negative cash flows, which depict the expenditures, are shown in red; positive cash flows, which depict the incomes, are shown in blue. A major feature of PV systems is that the initial capital cost (A) produces by far the largest negative cash flow. This is followed by many years of positive cash flows representing the value of electricity generated (or savings due to electricity not purchased), and small negative ones to pay for routine system maintenance. Generally, it is also prudent to allow for additional capital expenditure to replace worn out or damaged components such as the inverter. And finally we may hope to obtain an end-of-life scrap value for the system (E). One of the major considerations for a long-term project like a PV system is the time value of money. A proper life analysis refers all future cash flows to their equivalent value in today’s money. A positive value of present worth is generally taken as a good indication of financial viability. One aspect that potential PV owners want to know before investing money is the payback period of the system, that is, the number of years it takes for the total cost to be paid for by the income derived from the system [12]. Due to uncertainties about technical performance, system and component lifetimes, interest rates, and the future price of electricity, it is hard to know how long the system will last, or if additional capital injection will be needed as time goes by.
TR-2010-ECE689fall_Group
Page 15
3.5 Incentives The products of a new high tech like PV tend to be very expensive at the start, before cumulative production gathers pace. If governments wish to pursue urgent policy objectives such as reduction of carbon emissions, they may decide to stimulate market development with financial incentives. There are markets, typically small scale and remote from the electricity grid in areas, where PVs are economically successful. On the other hand, Grid-Tied PV systems are rarely economic at present, but if incentive programs are available in any of a number of forms, they may significantly affect the life-cycle cost (LCC) or payback of a system making. In United States, a combination of federal, state, and utility subsidies and policies have been implemented to accelerate market growth with the confidence that it will become cost effective without assistance in the future. Federal incentives used to promote renewable energy sources include investment tax credit. State policies used to promote renewable energy sources include renewable portfolio standard, renewable energy credits (RECs), net metering rules and financial incentives including exemptions from state taxes. In the next sections, it will be analyzed each of these incentives: 3.5.1
Federal Incentives
At the federal level, an important subsidy is the investment tax credit (ITC), which is a reduction in the overall tax liability for individuals or businesses that make investment in solar energy generation technology. The tax credit is for 30 percent of the cost of the system (including equipment and labor), up to $2,000 [11]. The credit originally was set to expire at the end of 2007, but Congress extended it for another year, through December 31, 2008. Then, in October 2008, Congress extended the credit for an additional 8 years and eliminated the $2,000 cap for residential systems [11]. The tax credit amount is simply 30% of the cost basis of the installed system and the tax credit is taken for the year the system is placed in service. Unused credit can be carried forward till at least 2016, the year the ITC expires. Three points can be deduced here:
For people and businesses having considerable or at least consistent income tax exposure, tax credits are an especially valuable incentive to invest in PV system. For people or businesses with little or no income tax liability (due to low income relative to expenses) could not take advantage of the 30% ITC in that short period of time. As 2016 is approaching, less people or businesses are going to invest in PV since they could not take advantage of the totality of the credit in a short period of time.
TR-2010-ECE689fall_Group
Page 16
On an industry level, a long-term ITC provides consistent financial support for growth such as building manufacturing plants, developing an installer workforce, and investing in large-scale solar electric plants that require extended planning and construction time. However, since ITC program was created in the 1970’s, ITC’s have come and gone; they’ve been extended, expired, and revived, which has created uncertainty in solar industry markets. Federal income tax credit for solar energy has expanded markets for solar products; however, it can be inferred that longer ITC periods would help to provide a more stable environment for solar project development. 3.5.2
State incentives
State governments have been important supporters of renewable energy development. State policies used to promote renewable energy sources include renewable portfolio standards, renewable energy credits (RECs), interconnection and net metering rules and financial incentives including exemptions from state taxes. There is a wide difference in the incentives that various states offer for solar power, which means the growth of solar power will vary substantially by state. Penetration of PV will be faster in states with higher electricity retail rates and supportive state legislation, rather than in states with the best solar resources.
3.5.2.1 Renewable Portfolio Standard Renewable Energy Portfolio (RPS) is a regulation in which a specified percentage of the electricity acquired by REPs comes from renewable energy sources. Each electricity provider is required to acquire renewable energy capacity based on its market share of energy sales times the renewable capacity goal. Currently, about 25 states have adopted RPS, which vary widely in design, percentage requirement, eligibility and time frame. REPs can meet their RPS individual requirements by acquiring specified percentage of the electricity from renewable energy sources or by presenting the requisite quantity of Renewable Energy Credits (RECs) bought by electricity generators. RECs are issued to generators for each megawatt hour (MWh) of renewable power generated. Additionally, businesses and individuals may voluntarily purchase RECs to offset their carbon footprints and to support the development of clean energy sources. Texas introduced its first Renewable Portfolio Standard as part of the state's electricity industry restructuring legislation in 1999, in which it was mandatory that electricity providers collectively acquire 2,000 MW of electricity from renewable energy sources generated by both large scale generators and small scale distributed generators by 2009 [8]. Municipally and cooperatives utilities are not required to achieve the renewable energy goals, but those choose that choose to enter in the deregulated market become subject to RPS requirements. Since its implementation, the Texas RPS has promoted the growth of renewable energy in Texas and demonstrated to be one of the most effective and successful in the nation. However, due to the lower TR-2010-ECE689fall_Group
Page 17
cost associated with wind energy compared with other sources of renewable energy and the favorable wind resources across Texas, RPS only has had great influence for wind market while it has not proven to be an effective driver for the solar market where high costs of solar outweigh the higher revenues afforded by the ability to create and sell renewable energy credits. To encourage diversity of renewable resources in the State, in 2005 the Texas Legislature was reformed to include a target of 500 MW of non-wind renewable generation while increasing the state’s original RPS goal from 2,000 to 5,880 MW by 2015 and 10,000 MW by 2025 [8]. Despite this reform, since 2005, just 9 MW of non-wind renewable generating capacity, in the form of a single landfill gas plant, along with several MW of customer-sited solar generation spurred by municipal subsidy programs, has been completed. This means that the current RPS in Texas is not capable by itself of stimulating the growth of the solar generation and hence, additional incentives are needed to spur solar generation in the state. Texas’ RPS goal is stated as a minimum number of megawatts; other states define their RPS goals as a percentage of total electric production. Reference 8 shows a list of the RPS requirements of the states that have this regulation. By 2015, Texas RPS requirement will be 5880 MW, which will represent 4 to 5 % of the state’s estimated electricity generation [15]. Considering that Texas has the largest solar energy resources among the states and that in terms of annual consumption, Texas is the largest electricity market in the United States, Texas RPS target is low in comparison to the RPS requirements of the other states whose solar resource and consumption are lower than Texas. In order to increase the total amount of energy that comes from solar, the current RPS could be modified for adding solar specific requirements within the RPS. This addition to the RPS is known as solar ―carve-out‖, and has been adopted by eleven states.
3.5.2.2 Rebates Because of the financial crisis, the rebate is a good opportunity for customer to decrease their initial payment for PV system directly. Although rebate program varies significantly by different states and different utilities, we can’t deny that the state or utility rebate programs are the primary driver stimulating PV market. Right now, there are several interesting rebate in Texas. The first one is the Solar and Wind Energy Device Franchise Tax Deduction [20]; Texas allows a corporation or other entity subject the state franchise tax to deduct the cost of a solar energy device from the franchise tax which is equivalent to a corporate tax. Entities are permitted to deduct 10% of the amortized cost of the system from their apportioned margin. It is difficult for us to tell if 10% of amortized cost the system compared with the apportioned margin is an attractive incentive for the corporation which has purchased a PV system. The second one is Solar and Wind Energy Business Franchise Tax Exemption [21]; Companies in Texas engaged solely in the business of manufacturing, selling, or installing solar energy devices are exempted from the franchise tax. There is no ceiling on this exemption, so it is a substantial incentive for solar manufacturers. The third one is Renewable Energy Systems Property Tax Exemption, The Texas TR-2010-ECE689fall_Group
Page 18
property tax code allows an exemption of the amount of the appraised property value that arises from the installation or construction of a solar or wind-powered energy device that is primarily for the production and distribution of thermal, mechanical, or electrical energy for on-site use, or devices used to store that energy. Compared the franchise tax deduction, property tax exemption with the franchise tax exemption, we can notice that Texas gives their local business of manufacturing, selling, or installing solar energy devices more attractive incentive than selling the PV system to the corporations which is interested in or has already purchased a PV system. Perhaps the Texas wants to develop the Texas local PV industries which is not only a driver stimulating local PV market by attracting more investment from other states, but also gets better preparations for future U.S. PV market. Because Texas is a very famous state in United States for the petroleum, In order to increase more industrial investment, solar energy technology is a great opportunity for Texas because of the amazing potential solar energy in Texas. If we compare the state rebate in Texas with California, we can notice that the rebates in California are much more than Texas. The first two are California Solar Initiative – Single and Multi-Family Affordable Solar Housing (SASH & MASH) Program [22, 23], the California Solar Initiative (CSI) provides financial incentives for installing solar technologies through a variety of smaller sub-programs. Of the total $3.2 billion in total funding for the CSI, $216 million has been set aside for programs to help fund photovoltaic (PV) installations on low-income housing. The third one is California Solar Initiative PV Incentives [24], the California Public Utilities Commission (CPUC) adopted a program -- the California Solar Initiative (CSI) -- to provide more than $3 billion in incentives for solar-energy projects with the objective of providing 3,000 megawatts (MW) of solar capacity by 2016. The fourth one is CEC - New Solar Homes Partnership [25], the New Solar Homes Partnership (NSHP) is a 10-year, $400 million program to encourage solar in new homes by working with builders and developers to incorporate into the homes high levels of energy efficiency and high-performing solar systems. The NSHP specifically targets the market-rate and affordable housing single-family and multifamily sectors, with the goal of achieving 400 MW of installed solar electric capacity on new homes, and to have solar electric systems on 50% of all new homes built in California by the end of 2016. We can notice that California has the totally different PV plan with Texas. The main target for PV in California is not only increase the PV market, but also want to increase their electricity generation significantly by PV system. Compared with Texas, California does not have abandon petroleum resource as Texas, the traditional generation in California is less than Texas, and the population in California is 10 million more than Texas, so renewable energies especially solar and wind are so helpful for California to solve the energy demand crisis. That’s why California spend lots of money to encourage people to buy and use the renewable energy as soon as possible even the cost of PV system is a little bit expensive than traditional generation. Besides the Texas state rebate, there are many utility rebates available in different area in Texas, shown in the following table.
TR-2010-ECE689fall_Group
Page 19
Table.1. Texas utility rebate program [26] Utility name
Rebate
Amount
Applicable Sectors & Maximum Incentive
program AEP
Smart Source
SWEPCO
PV Rebate
$2.50/W DC
Commercial,
Industrial,
Residential,
Nonprofit, Schools, Local Government, State
Program
Government,
Tribal
Government,
Government,
Multi-Family
Fed.
Residential,
Agricultural, Institutional, Must be a SWEPCO Customer Residential: $25,000 Non-residential: $90,000 AEP Texas
Smart Source
Central
PV Rebate
Company
Program
$2.50/W DC
Commercial, Industrial, Residential, Nonprofit, Schools,
Local
Government,
Government,
Tribal
Government,
Government,
Multi-Family
State Fed.
Residential,
Agricultural, Institutional, Must be an AEPTCC Customer Residential: $25,000 Non-residential: $180,000 AEP Texas
Smart Source
North
PV Rebate
Company
Program
$2.50/W DC
Commercial, Industrial, Residential, Nonprofit, Schools,
Local
Government, Government,
Government,
Tribal
Government,
Multi-Family
State Fed.
Residential,
Agricultural, Institutional, Must be an AEPTNC Customer Residential: $25,000 Non-residential: $90,000 Austin
Residential
$2.50
TR-2010-ECE689fall_Group
per Residential, Must be Austin Energy Customer
Page 20
Energy
Solar PV
watt-AC
$15,000 per home installation and $50,000 per
Rebate
site
Program Bryan Texas
Solar PV
Utilities
Rebate
$3 per watt Commercial, Industrial, Residential, Nonprofit, AC
Schools, Local Government, Multi-Family
Program
Residential, Institutional, Any BTU Customer Lesser of 80% of invoice cost or $12,000 per site, per fiscal year
CPS Energy
Solar PV Rebate Program
$3.00/W AC Commercial, Industrial, Residential, Nonprofit, watt
Institutional, Must be CPS Energy Customer
standard,
Residential: $30,000 or 50% of cost;
may
be
altered based
Non-residential: $100,000 or 50% of cost
on inspection results Denton
GreenSense
PV:
$3.00 Commercial, Residential
Municipal
Solar Rebate
Electric
Program
per AC watt PV: $15,000 per structure (based on the calculated expected performance of
the
system) El
Paso Solar PV Pilot Residential:
Electric Company
Program
Commercial, Industrial, Residential, Nonprofit,
$2.00/W DC
Schools, Local Government, Construction,
Non-
State Government, Installer/Contractor, Tribal
Residential:
Government, Fed. Government, Multi-Family
$1.75/W DC
Residential, Must be a Texas El Paso Electric Customer
TR-2010-ECE689fall_Group
Page 21
Residential: $20,000 Non-Residential: $43,250 Entergy
Solar PV Pilot
Texas
Program
$2.50/W DC
Commercial, Industrial, Residential, Nonprofit, Schools, Local Government, Construction, State Government, Installer/Contractor, Tribal Government, Fed. Government, Multi-Family Residential, Must be an Entergy Texas Customer Residential: $25,000 Non-residential: $125,000
Guadalupe
Renewable
Valley
Energy
Electric
Rebates
PV:
Commercial, Residential, Nonprofit, Schools,
$2.00/watt
Local Government, State Government, Fed. Government, Agricultural, Institutional, Must
Cooperative
be a GVEC member PV: $8,000
Oncor
PV Incentive
Electric
Program
Delivery
Residential:
Commercial, Industrial, Residential, Nonprofit,
$2.25/W DC Schools, Local Government, Construction, (STC)
State Government, Installer/Contractor, Tribal
Non-
Government, Fed. Government, Multi-Family
residential:
Residential, Must be an Oncor Customer
$1.75/W DC Residential: $22,500
Texas New
Solar PV Pilot
Mexico
Program
(STC)
Non-residential: $175,000
$2.50/W DC
Commercial, Industrial, Residential, Nonprofit, Schools, Local Government, Construction,
Power
State Government, Installer/Contractor, Tribal
Company
Government, Fed. Government, Multi-Family Residential, Must be a TNMP Customer $25,000
TR-2010-ECE689fall_Group
Page 22
We collected some the utility rebate information in California shown in the following table. Table.2. California utility rebate program [27] Alameda Municipal Power
Solar
Systems up to 50 kW: $2.42/W
Commercial, Residential
Photovoltaics Systems larger than 50 Rebate $0.27/kWh for first 5 years
kW: Maximum size is 1 MW
Program Anaheim
PV Buydown
Public
Program
Utilities
or 110% of customer's load, whichever is less
Residential: $2.99/watt AC Commercial under 30 kW: $2.09/watt AC
Commercial, Residential,
Low-
Income Residential
Commercial between 30 kW and 1 The incentives are based MW: $0.31/kWh for first 5 years of on the customer's most production.
recent
12-month
electricity usage. Azusa Light
Solar
& Water
Partnership Program
$3.00 per watt if customer transfers Commercial, Residential RECs to utility
50% of system cost
$2.42 per watt if customer retains ownership of RECs
Burbank
Residential
Water &
&
Power
Commercial Solar
Commercial installations:
Systems up to 30 kW (upfront Residential, payment based on expected Schools, performance):
Support Program
Commercial, Industrial, Nonprofit,
Government,
State Low-
Income Residential $2.09/watt AC if customer keeps RECs
Maximum payment of $400,000 per year for
$2.33/watt AC if customer grants RECs to utility
performance-based incentives
$2.67/watt for schools, affordable housing, non-profits
TR-2010-ECE689fall_Group
Page 23
Systems over 30kW (performance based incentive paid over the first 5 years): $0.226/kWh if customer keeps RECs $0.288/kWh if customer grants RECs to utility $0.311/kWh for schools, affordable housing, non-profits Residential Installations (customer has the option of the upfront rebate or the production based incentive): Upfront Incentive: $2.64/watt AC if customer keeps RECs $3.14/watt AC if customer grants RECs to utility Performance-based
incentive
paid
over the first 5 years: $0.364/kWh if customer keeps RECs $0.464/kWh if customer grants RECs to utility City of
PV Buy
Gridley
Down
Utilities
Program
City of
PV Rebate
Lompoc
Program
$2.80/W-AC
Commercial, Residential. $5,600
Non-profits: $3.50/W AC; All other Commercial, customers: $3.00/W AC
Utilities
TR-2010-ECE689fall_Group
Residential, Nonprofit 50% the system cost, up
Page 24
to $50,000 City of Palo PV Partners
Systems
1 kW to 30 kW: $2.00/W Commercial, AC.
Additional
$0.50/W
for Residential,
governmental or non-profit entities.
Nonprofit,
Local Government, State
MW: Government, performance-based incentive of Agricultural, (All MID Customers) $0.133/kWh for 10 years. Systems
>30
kW
to
1
50% of total project costs. Pasadena
Solar Power
Systems up to 30 kW have the option Commercial,
Water and
Installation
of receiving an expected performance Residential,
Power
Rebate
based
buydown
(EPBB)
or
Nonprofit,
a Local Government, State
performance based incentive (PBI). Government, Systems larger than 30 kW are only Institutional eligible for the PBI. EPBB: Residential: $2.40/watt AC Commercial and all PPAs: $1.40/watt AC Non-profits
and
Government:
$2.15/watt AC Income-qualified
residential:
$4.00/watt PBI: Residential: $0.363/kWh Commercial
and
all
PPAs:
$0.212/kWh TR-2010-ECE689fall_Group
Page 28
Non-profit
and
Government:
$0.325/kWh Income-qualified
residential:
$0.632/kWh PBI is awarded for the first 5 years of the system's operation. PG&E
Advanced
Baseline Entry Level Home: $75 /kW; Residential,
Homes New $0.43 /kWh; $1.72 /Therm
Construction,
Construction
Installer/Contractor,
Incentives
Home 30% Above Baseline: $225 /kW; $1.29 /kWh; $5.14 /Therm ENERGY Program
STAR® or
other
Home Builders
Homes Design Team Incentive: Green Home $5,000 New
Certification: 10% bonus Compact Home (10% smaller than LEED for Homes threshold): 15% bonus Design Team Incentive: 50% cost for projects that have at least ten units Photovoltaic (PV) Systems Peak kW Reduction: $75 /kW, $0.43 /kWh, $1.72 /Therm Homes 30% Better than 2008 Title 24 with a 30% Reduction in Cooling Load: $1,000/single unit home and $200/multi-family units Plumas-
PV Rebate
Sierra REC
Program
2010 rebate level: $2.42/watt (AC)
Commercial, Industrial, Residential,
Nonprofit,
Agricultural
TR-2010-ECE689fall_Group
Page 29
$6,000 for residential; $12,000
for
small
commercial, agricultural and
non-profit
applications; $20,000 for large commercial and industrial applications Redding
Earth
Electric
Advantage Rebate
2010 Levels PV
(less
Commercial, Residential than
10
kW):
$2.42- PV: None;
$3.07/watt AC;
Program PV (10 kW - 1 MW): $0.35/kWh for first 5 years of actual production Riverside
Residential
Public
PV Incentive
Utilities
Program
$4/watt AC
Residential $16,000
or
75%
of
project cost, whichever is less
Roseville
PV Buy
Electric
Down Program
Residential: Unavailable
Commercial,
Roseville Commercial systems less than 10 kW: Residential, Electric Customers $2.00/watt AC 10kW to