Grid Cells, Place Cells and Memory Nobel Lecture, 7 December 2014 by May-Britt Moser Norwegian University of Science and Technology (NTNU), Trondheim, Norway.
O
n 7 December 2014 I gave the most prestigious lecture I have given in my life—the Nobel Prize Lecture in Medicine or Physiology. After lectures by my former mentor John O’Keefe and my close colleague of more than 30 years, Edvard Moser, the audience was still completely engaged, wonderful and responsive. I was so excited to walk out on the stage, and proud to present new and exciting data from our lab. The title of my talk was: “Grid cells, place cells and memory.” The long-term vision of my lab is to understand how higher cognitive functions are generated by neural activity. At first glance, this seems like an overambitious goal. President Barack Obama expressed our current lack of knowledge about the workings of the brain when he announced the Brain Initiative last year. He said: “As humans, we can identify galaxies light years away; we can study particles smaller than an atom. But we still haven’t unlocked the mystery of the three pounds of matter that sits between our ears.” Will these mysteries remain secrets forever, or can we unlock them? What did Obama say when he was elected President? “Yes, we can!” To illustrate that the impossible is possible, I started my lecture by showing a movie with a cute mouse that struggled to bring a biscuit over an edge and home to its nest. The biscuit was almost bigger than the mouse itself. The mouse tried persistently, without success, but finally took time to sit down and think. This led to success—the mouse got the biscuit up the wall and could bring it to its nest. I think this illustrates the struggle of scientists who are trying to crack 333
334�
The Nobel Prizes
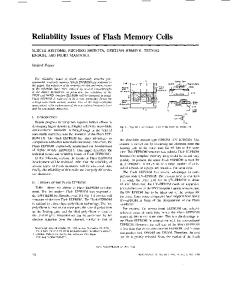
FIGURE 1. Hierarchical map showing complexity and organization of the visual cortices and associated areas. Visual input at the bottom (RGC, retinal ganglion cells; LGN, lateral geniculate nucleus); entorhinal cortex (ER) and hippocampus (HC) at the top. Hippocampal place cells and entorhinal grid cells with trajectory in grey and spike positions in red are indicated. By studying functional cell types at the top of the hierarchy we might understand the computational mechanisms that are responsible for other cognitive functions as well. Reproduced, with permission, from Felleman and van Essen (1991).
Grid Cells, Place Cells and Memory�335 the brain’s fundamental codes. Occasionally, between long periods of strenuous effort, there is a sense of Eureka when we understand an additional piece of the brain puzzle. In this lecture, I will show how the discovery of place cells and grid cells has opened our eyes to some of the secrets of the brain, and how work on these cells has put us on the track of the neural computations responsible for perception of space as well as cognitive brain functions in general. Grid cells and place cells comprise a large fraction of the cells in the entorhinal cortex and the hippocampus, respectively—brain regions that are almost as far away from the primary sensory and motor cortices as one can get. The entorhinal cortex and the hippocampus represent the peak of the cortical hierarchy, in the sense that these regions receive highly processed information from nearly all regions of the cortex and that they also project information back to each of these regions (Fig. 1; Felleman and van Essen, 1991; Squire and Zola-Morgan, 1991; Witter and Amaral, 2004). The fact that the characteristic firing pattern of place cells and grid cells cannot be extracted from any particular sensory input suggests that the pattern arises within the hippocampal-entorhinal circuit itself. We have not yet deciphered the neural codes for the grid pattern or the localised firing of the place cells but the presence of experimentally controllable firing correlates, combined with the access to activity patterns of multiple discrete cell types, provides us with a powerful model system. This model system can be used to determine not only how specific activity is generated but also how it gets transformed from one cell type to another. By extracting the principles for formation and transformation of firing patterns in the hippocampal-entorhinal space circuit, we can learn a lot about how the cortex operates in general. THE RELATIONSHIP BETWEEN GRID CELLS AND PLACE CELLS The hippocampal-entorhinal space circuit consists of several functionally distinct cell types. The first one to be discovered was the place cell (O’Keefe and Dostrovsky, 1971). As John O’Keefe told you in the first lecture, place cells fire specifically when animals are in certain locations in the environment. Each cell has its own set of preferred firing locations—or place fields. In small enclosures, most cells have only one firing field. Different cells fire at different locations, such that in any ensemble of a few dozen place cells, every single place in the environment is covered by a unique subset of simultaneously active place cells (O’Keefe, 1976; Wilson and McNaughton, 1993). The unique firing patterns associated with every single position led O’Keefe and Nadel (1978) to propose that the hippocampus was the cognitive map of the brain.
336�
The Nobel Prizes
The discovery of place cells raised questions about the origin of the place signal. Were the place cells alone, or was there a wider network with different cell types responsible for different functions? As Edvard Moser told you in the second lecture, an obvious place to look for counterparts of the place cells was
FIGURE 2. Grid cells and place cells are only one synapse apart, but we do not know how grid patterns are transformed to place fields. The bottom part of the figure shows grid fields for five cells and a place field for one cell. Firing rate is represented on the z-axis, position on the x- and y-axes. Place fields may be generated through a Fourier-like process by linear summation of grid fields across a range of grid scales. The coloured central peak will add up to a place field whereas other peaks (in dark blue) will cancel due to different wavelengths. Artwork by Tor Stensola. Modified, with permission, from Solstad, Moser and Einevoll (2006).
Grid Cells, Place Cells and Memory�337 the entorhinal cortex, since nearly all cortical input to the hippocampus is mediated via this region (Witter and Amaral, 2004). Our exploration of this area a decade ago led to the discovery of grid cells—cells that fire at discrete locations, like place cells in the hippocampus, but in a unique manner (Fyhn et al., 2004; Hafting et al., 2005). Each grid cell fires at multiple locations and these multiple locations form a periodic hexagonal lattice that covers the entire surface of the local environment. The presence of grid cells only one synapse upstream of the place cells led us and others to ask whether place cells receive their spatial information from grid cells. Do place cells reflect a transformation of signals from grid cells? Half a century ago, Hubel and Wiesel (1962) suggested that orientation-selective cells in the visual cortex originate by linear summation of inputs from cells with concentric circular receptive fields. In the same way, we and others suggested after the discovery of grid cells that place fields emerge by linear summation of output from grid cells over a range of spatial scales (Fuhs and Touretzky, 2006; McNaughton et al., 2006; Solstad et al., 2006). It was suggested that, via a Fourier-like summation process, inputs from periodic grid fields with different grid scales would be sufficient to generate a single place field (Fig. 2). The periodicity of the grid fields was not inherited by the place cells because the different wavelengths of cells with different grid scales cancelled each other except at the central peak. Over the subsequent years, we learnt that the story was more complicated. Grid cells were not the only entorhinal cell type with a spatially modulated firing pattern. In 2006, one year after the discovery of grid cells, we found that grid cells co-localised with head direction cells. Head direction cells had been discovered in the 1980s in the presubiculum by Jim Ranck (1985). These cells fire if and only if the rat faces a certain direction in the environment (Taube, 2007). Head direction cells were subsequently found in a number of brain regions (Taube, 2007) and they also turned out to be abundant in the medial entorhinal cortex, primarily in the intermediate and deep layers (Sargolini et al., 2006). Two year later, we found a third cell type in the same circuit—the border cell (Solstad et al., 2008). Border cells fired if and only if the animal was near one or several of the borders of the local environment, for example a wall of a recording enclosure or an edge of a table. Border cells were present in all layers, including layer II, where we found most of the grid cells. Similar cells were reported in the same region by the Knierim group (Savelli et al., 2008) and in the subiculum by the O’Keefe group (Barry et al., 2006; Lever et al., 2009). Grid cells, head direction cells and border cells maintained their firing properties across environments—a grid cell was always a grid cell, a head direction cell was always a head direction cell, and a border cell was always a border cell (Solstad et al., 2008).
338�
The Nobel Prizes
FIGURE 3. Place cells could be computed by the summation of inputs from grid cells over a range of scales (Fig. 2). However, more recent work suggests that both head direction cells and border cells project to the hippocampus (Zhang et al., 2013), suggesting that place fields may be generated by spatial input from a variety of cell types. Top: Francesca Sargolini. Bottom: Trygve Solstad.
The existence of multiple functional cell types in the medial entorhinal cortex led us to ask if place cells receive spatial information not only from grid cells but also from head direction cells and border cells (Fig. 3). The question is particularly relevant because computational models from the late 1990s pointed to cells with boundary-dependent activity as a potential origin of the hippocampal place signal (O’Keefe and Burgess, 1996; Hartley et al., 2000). It was hypothesised, in these models, that place cells receive input from cortical ‘boundaryvector cells’, cells whose firing rates reflected distance and direction relative to specific boundaries in the local environment. Border cells in the medial entorhinal cortex would represent a subclass of this hypothesised input population. During the past few years, we have tried to determine which of these cell types project to the hippocampus. We have developed a method for functional tagging of neurons with axonal projections to a target region—in our case the hippocampus (Zhang et al., 2013). Together with Sheng-Jia Zhang and Jing Ye, we developed recombinant adeno-associated virus (AAV) carrying the genes for the light-sensitive cation channel channelrhodopsin-2 (ChR2) as well as a fluorescent marker protein. The virus was infused into the hippocampus, where it transduced not only local neurons but also axons of cells with projections into the hippocampus. Neurons with axonal projections to the hippocampus could
Grid Cells, Place Cells and Memory�339 subsequently be identified in the superficial layers of the medial entorhinal cortex, as well as other regions with hippocampal projections (Fig. 4). No staining was observed in the deeper layers of the entorhinal cortex, which have limited projections to the hippocampus. Expression of ChR2 in hippocampus-projecting medial entorhinal cortex neurons made it possible to link the neurons to their functional firing profile. Implanting tetrodes and an optic fibre in the medial entorhinal cortex of animals with hippocampal injections of AAV-ChR2, we first identified ChR2-expressing neurons as entorhinal cells with constant minimal latency responses to a short, locally delivered light pulse (Fig. 4). These cells responded at invariant latencies after the illumination—with a trial-to-trial variation of less than 1 ms. The functional identity of the light-responsive cells was then determined by recording their activity while the animal was running in an open field. As expected, a considerable portion of the responsive neurons—approximately 25%—were grid cells. However, there were also light-responsive border cells (7%) and head direction cells (12%). Because the light-responsive neurons must have axons to the hippocampus (otherwise they would not have been infected), the findings
FIGURE 4. The hippocampus receives input from multiple functional cell types in the medial entorhinal cortex. Top right: Sheng-Jia Zhang and Jing Ye. Left: Expression of ChR2 after injection of traffic-improved recombinant adenoassociated virus in the hippocampus. The virus carried the gene for channelrhodopsin (ChR2) as well FLAG (which encodes a peptide sequence that can be identified by fluorescent antibodies). Transduced neurons are labelled in red. Note expression not only in the hippocampus but also in the medial entorhinal cortex, suggesting retrograde transduction of entorhinal cells with axonal projections into the hippocampus. The rats were implanted in the medial entorhinal cortex with a microdrive containing tetrodes for single unit recording as well as an optic fibre for photostimulation of locally infected cells. Right: Raster diagram showing spike times for a single grid cell after laser stimulation on more than 120 trials. The cell fires at a constant latency (9.0 ms), suggesting that it was directly activated by light. Reproduced, with permission, from Zhang et al. (2013).
340�
The Nobel Prizes
suggest that the hippocampus receives input from a broad spectrum of entorhinal cell types, including grid cells and border cells, but also a large fraction of cells with no detectable spatial firing pattern. The retrograde transduction study implies that projections from the medial entorhinal cortex to the hippocampus are functionally mixed. Most likely, place cells can be formed from a variety of spatial inputs, including grid cells and border cells. In this sense, the data provide support for both grid cell and boundary vector cell models of place cell formation. However, the detailed mechanism for place field formation remains elusive. As of today, we do not know if different place cells receive inputs from different cell classes in the medial entorhinal cortex, or if, alternatively, all cells receive the same mix of inputs, with differentiation taking place not at the level of inputs but locally in the hippocampal circuit or at the dendritic level. One possibility is that individual cells receive inputs from a variety of entorhinal cell types with different subsets of inputs predominating at different times. A number of more recent models have proposed that place fields can be generated from any pattern of spatially modulated input, regardless of whether it is periodic or modulated by distance from boundaries. The condition is that selected inputs can be amplified by local circuit activity or Hebbian plasticity (Rolls et al., 2006; de Almeida et al., 2009; Savelli et al., 2010; Monaco and Abbott, 2011). It will remain for the future to determine to what extent place cells are formed by hard-wired connections between entorhinal cells and hippocampal cells, but the functional tagging study suggests that place fields can be formed in more than one way and that intrahippocampal processes contribute to the transformation mechanism. ENTORHINAL SPEED CELLS I have told you that the entorhinal cortex contains spatially modulated cell types such as grid cells and border cells. These cell types provide accurate information about the animal’s current location, but how is this information updated in accordance with the animal’s movements in the environment? A number of observations point to grid cells as part of a path integration-based representation of space, where displacement is obtained by constantly integrating running velocity over short intervals (Hafting et al., 2005; McNaughton et al., 2006). In this scheme, new grid cells are recruited, in a periodic manner, as the animal moves from one place to another, with the selection of cells dependent on information about the animal’s current speed and direction. But is such information available to the grid cells? Directional information is expressed in head direction cells, but while speed has been observed to correlate weakly with the firing rates
Grid Cells, Place Cells and Memory�341
FIGURE 5. Experimental set-up for identification of speed cells. Spike activity was monitored as a rat ran along a linear track with its body confined inside a computer-driven frame without a bottom (a ‘Flintstone car’) that was moved along the track at a pre-set speed. Top right: Emilio Kropff.
of some grid cells (Sargolini et al., 2006; Wills et al., 2012), the existence and nature of a local speed signal in the entorhinal microcircuit has remained unclear. In the following section, I will present new data suggesting that a population of cells in the medial entorhinal cortex is dedicated to the representation of speed. To estimate the relationship between firing rates and speed, we recorded neuronal activity under strict control of the animal’s running speed (Fig. 5). Together with postdoc Emilio Kropff, we monitored activity in the medial entorhinal cortex while rats ran across a linear track with their body confined inside a frame without a bottom—a Flintstone car. The frame was moved along the track at a computer-determined speed. The recordings showed that among the cells recorded in the medial entorhinal cortex, approximately 15% had firing rates that correlated strongly with the running speed of the animal, irrespective of where the animal was on the track. In these cells, a change in running speed was always accompanied by a change in firing rate. The faster the speed, the higher the firing rate (Fig. 6). The relationship was linear. The observations in the Flintstone car suggested that we had come across a new functional cell type—speed cells. But if speed cells represent speed, and nothing else, they should also do so in the open field environments where we identified both grid cells and border cells. This led us to record, in 17 rats, from more than 2000 cells in the medial entorhinal cortex while the rats foraged randomly in standard square enclosures. The rats covered a wide range of instantaneous running speeds, from 0 cm/s to more than 50 cm/s. For each cell, we plotted firing rate as a function of running speed.
342�
The Nobel Prizes
FIGURE 6. Firing rate and running speed as a function of position for two representative speed cells. Pyramidal cells (pyr); fast spiking cell (fast sp). The speed of the Flintstone car is changed abruptly at the middle of the track. Top: Curves show the mean firing rate of the cell (blue and red, left axis) and the mean running speed of the rat (grey, right axis). Bottom: Pearson correlation between instantaneous running speed and mean firing rate for different car speeds.
As in the Flintstone car, many cells had firing rates that increased linearly with speed (Fig. 7). Approximately 15% of the cells had speed-rate relationships exceeding the correlations obtained in a shuffled distribution of spike-time pairs. Virtually none of the cells exhibited any spatial preferences; mean firing rates were similar across the entire recording environment. Having established that a considerable number of entorhinal cells respond to instantaneous running speed, we asked whether these cells form a population of their own, or if they overlap with other cell types. Grid cells, head direction cells and border cells were classified by standard statistical criteria, and speed cells were identified as cells with speed-rate correlations exceeding the 99th percentile of the shuffled distribution. Speed cells were found in all cell layers (Fig. 8). Throughout the circuit, the speed cells formed a discrete cell category (Fig. 9). The overlap between speed cells and any of the other cell types was significantly lower than expected by chance from random category assignments. For example, only 8 out of 518 grid cells had significant responses to speed. The overlap with head direction cells and border cells was similarly low. These analyses suggest that speed cells are functionally distinct from other entorhinal cell classes. The spatial and directional information expressed by these cells is an order of magnitude lower than that of all other entorhinal cell types.
Grid Cells, Place Cells and Memory�343
FIGURE 7. Firing rate as a function of position and running speed in 12 representative medial entorhinal speed cells recorded during chocolate cereal-motivated free foraging in a square open field. Left for each cell: colour-coded spatial rate map showing maximal activity in red and minimal activity in blue. Right for each cell: Mean firing rate as a function of running speed. All speed cells demonstrated a linear relationship between running speed and firing rate.
Taken together, our findings show that the medial entorhinal cortex has a large dedicated population of speed cells, characterised by a linear response to firing rate. The linear nature of the speed-rate relationship makes the temporal integration of the signal proportional to the displacement of the animal in the environment. The information encoded by these speed cells provides exactly what grid cells need for position to be updated dynamically during movement. We do not know yet how the speed signal is generated, but observations of speed-representing cells in the mesencephalic locomotor region (Lee et al.,
FIGURE 8. Pie charts showing distribution of speed cells across layers of the medial entorhinal cortex. Speed cells were located in all cell layers.
344�
The Nobel Prizes
FIGURE 9. Speed cells form a population of their own. The scatter plot shows head direction and spatial information for more than 1,200 neurons classified as grid, head direction, speed, or border cells. The scale is logarithmic. Each dot corresponds to one cell. Cell identity is colour-coded as indicated; colour code as in Fig. 8. Black dots represent speed cells that met at least one additional criterion. Note the low number of speed cells that satisfy criteria for other cell types.
2014) point to efference copies in this region as a potential source of speed information in the entorhinal cortex as well as other cortices. THE HIPPOCAMPUS—MEMORY OR SPACE? Until now the focus of my talk has been on hippocampal and entorhinal circuits for spatial representation. However, are these circuits only important for space? In fact, modern studies of the hippocampus began with a different approach to the function of the hippocampus. More than half a century ago, Scoville and Milner (1957) reported, in patient H.M., that surgical removal of the two hippocampi was accompanied by a severe disruption of memory for daily life events. They described the loss of memory as follows: After operation this young man (HM) could no longer recognize the hospital staff nor find his way to the bathroom, and he seemed to recall nothing of the day-to-day events of his hospital life.
Grid Cells, Place Cells and Memory�345 For the next 55 years, each time he met a friend, each time he ate a meal, each time he walked in the woods, it was as if for the first time. But how can the same brain structures be responsible for two so apparently different functions as spatial mapping and memory? The link between space and memory has been known since ancient times. The Greek invented the Method of Loci as a mnemonic device to recall large quantities of information (Yates, 1966). In this technique the subject memorises the layout of a building (a ‘memory palace’), or a path through a familiar environment (Fig. 10). The subject then encodes items by placing them at unique locations in the palace, or along the path, as he or she walks through the environment. Retrieval of items
FIGURE 10. Space is used as a framework for storing memories. A cartoon of a ‘Memory Palace’ can be used to illustrate the Method of Loci. Different countries in South America (left) are associated with symbols placed at unique locations in the memory palace (right). For example, Chile is placed in the room at the bottom left that has chilli wallpaper. Peru is placed in a room with a photo of my former supervisor Per Andersen. The method exploits the natural tendency for memories of objects and events to be associated with space and is widely used as a method for remembering long lists of items. Illustration: Ailin Moser.
346�
The Nobel Prizes
is subsequently achieved by walking through the palace once again, which will activate the items in order. The method is efficient in that it increases substantially the number of items that can be recalled, at the same time as interference between the items is reduced. The successful use of this method for over two thousand years points clearly to a link between space and memory. So if space and memory linked, and the link occurs in the hippocampus, what are the mechanisms? O’Keefe and colleagues observed early on that place cells do not exclusively represent the animal’s current location. Place cells may also reflect the memory of a location, expressed as a position-correlated firing pattern in the absence of the sensory inputs that originally elicited the firing (O’Keefe and Speakman, 1987). Reactivation of past place field patterns has subsequently been reported in a variety of circumstances (Pavlides and Winson, 1989; Wilson and McNaughton, 1994; Jarosiewicz and Skaggs, 2004; Leutgeb et al., 2005a). The expression of past locations in the activity of place cells is consistent with a huge clinical and experimental literature pointing to the hippocampus as a key element of the brain’s network for declarative memory (Squire, 1992; Squire and Wixted, 2011). Presumably, each memory stored in the hippocampus contains information about place, expressed in firing locations of place cells, as well as the events that take place in each of those places, expressed in the form of rate variations (O’Keefe and Nadel, 1978; Leutgeb et al., 2005b). If we accept that place cells merge spatial and nonspatial information, from present and past, let us then put the hippocampal memory circuit in a wider anatomical context. So far I have spoken much about the medial entorhinal cortex as a major cortical determinant of neural activity in the hippocampus. However, the hippocampus receives an equally large projection from the lateral entorhinal cortex (Fig. 11). The lateral entorhinal cortex is likely to provide the hippocampus with information about discrete objects as well as olfactory information, considering that cells in this area have been reported to fire specifically in response to discrete objects (Deshmukh and Knierim, 2011; Fig. 12) as well as specific odours (Petrulis et al., 2005; Igarashi et al., 2014). Motivated by the presence of object-responsive cells, we decided, with graduate student Albert Tsao, to examine whether cells in the lateral entorhinal cortex respond not only when an object is present but also when an object has been in a certain location in the past (Tsao et al., 2013) (Fig. 13). A LEGO toy was placed at an arbitrary location in a standard square open field. Activity was recorded from the lateral entorhinal cortex while the animal investigated the environment. Activity was also recorded during subsequent trials, when the object was no longer there. A small number of cells responded to the presence of the
Grid Cells, Place Cells and Memory�347
FIGURE 11. Association between position and memory cues. A horizontal section of the entorhinal cortex and hippocampus with cartoons suggesting different functions encoded in the medial and the lateral entorhinal cortex and place cells in the CA region. The firing field of a place cell is indicated over the hippocampus (as in Fig. 1 and 2). Medial entorhinal cortex (MEC), lateral entorhinal cortex (LEC), presubiculum (PrS), dentate gyrus (DG) and subiculum (S). Brain section with projections: Courtesy of Menno Witter.
FIGURE 12. Cells in the lateral entorhinal cortex (LEC) respond to objects. Top: Samples of toys used as objects in the box where the rat chased after pieces of food. Bottom: colour-coded rate maps showing the response of a lateral entorhinal cell to objects placed at different positions in the box. The cell responds specifically to the presence of toy objects (objects: white circles, arrows: subsequent object location). Reproduced, with permission, from Deshmukh and Knierim (2011).
348�
The Nobel Prizes
object but other cells, intermingled among the object-sensitive cells, responded only after the object had been removed. The response was sometimes transient, lasting for only a few exposures after the presentation of the object, but after repeated exposures, the response could be generally be followed for a long time, in some cases two weeks, as long as the cells could be monitored (Fig. 14). When the object was moved to new locations on successive trials, traces of activity were left at each of those locations (Fig. 13). These findings suggest that cells in the lateral entorhinal cortex are not only involved in encoding of discrete elements of the current spatial environment but also express the memory of objects or events associated with past locations. Whether trace cells project to the hippocampus remains to be determined but assuming that a large fraction of the lateral entorhinal cells project to the hippocampus, place cells are likely to receive information about discrete objects and events in addition to the spatial information they receive from grid cells and border cells in the medial entorhinal cortex. In the hippocampus, these types of information are likely brought together to form a coherent spatial-nonspatial memory. The Method of Loci may work so well because it exploits the preparedness of the hippocampus for associating space with individual items and experiences. MECHANISMS FOR ASSOCIATING EVENTS WITH PLACE—ODOURS AS A GATEWAY I would now like to present some recent data that illustrate potential mechanisms for interaction between the lateral entorhinal cortex and the hippocampus. I present them because they may help us understand how cortical areas communicate in general.
FIGURE 13. Colour-coded firing rate maps showing neural activity in response to past locations of a LEGO toy object. Left: successive positions of LEGO object in the recording enclosure. Black, training position. Blue, new positions on test day (one per trial). Right: object locations on successive trials (top). All rate maps (bottom) are for the same cell. Activity cumulates at places where the object has been located. Right: Albert Tsao. Reproduced, with permission, from Tsao et al. (2013).
Grid Cells, Place Cells and Memory�349
FIGURE 14. Colour-coded rate maps showing long lasting trace of activity in a lateral entorhinal trace cell following exposure to an object at a single location in the recording box. The object was placed for consecutive days at the bottom right of the box. The object was then moved before the recordings in the figure started. Object traces could be seen for almost two weeks after the object was removed. Reproduced, with permission, from Tsao et al. (2013).
FIGURE 15. The hippocampus receives olfactory information via the lateral entorhinal cortex. Abbreviations as in Fig. 11.
350�
The Nobel Prizes
To examine how cells in the lateral entorhinal cortex interact with cells in the hippocampus, let us take advantage of the strong connections that this part of the entorhinal-hippocampal circuit has with the olfactory bulb and the piriform cortex (Burwell, 2000; Witter and Amaral, 2004). When we experience a situation and there are strong odours associated with this situation, the odours are likely encoded in the hippocampus along with the place and other aspects of the experience (Fig. 15). When we re-encounter the odour, it may function as a retrieval cue, and the entire situation may be re-experienced in memory. The power of odours as retrieval cues is beautifully illustrated by Marcel Proust in his novel “In search of lost time,” where he declares that “. . . the smell and taste of things remain poised a long time, like souls, ready to remind us, waiting and hoping for their moment . . .” (Fig. 16). To study the mechanisms of odour-induced memory retrieval in the lab, we teamed up with postdoc Kei Igarashi and trained rats in an odour-place association task (Fig. 17; Igarashi et al., 2014). When odour A (for example, chocolate) was presented in the odour port, the rat had to run to a food cup in location A¢ to obtain the reward. When odour B (for example, banana) was presented,
FIGURE 16. Movie illustrating associations between odour and space, as described in Marcel Proust’s In Search of Lost Time. The movie was produced by Helmet Movie and can be viewed at www.nobelprize.org.
Grid Cells, Place Cells and Memory�351
FIGURE 17. Odour-place association task. Left: Kei Igarashi. Right: Movie illustrating performance in a rat trained to discriminate odours with unique associations to food locations. If Emma the rat sniffed chocolate in the odour port, she had to go to position A to get a reward. If she sniffed banana, she would have to go to position B for her reward. The rats reached asymptotic performance (more than 85% correct) after a few weeks of training. Reproduced, with permission, from Igarashi et al. (2014). The movie can be viewed at www.nobelprize.org.
it received a reward only after running to location B¢. After some training, the rats ran to the correct location on nearly all trials. Performance stabilised at 85% correct performance. While the rats acquired the odour-place task, we recorded spike activity and field potentials from the lateral entorhinal cortex and hippocampus, often simultaneously. Task acquisition was associated with a gradual increase in the number of cells with odour-selective firing in the odour port (Fig. 18). For each cell, we calculated odour selectivity as the difference between firing rates during odour A and odour B as a fraction of the sum of these rates. Odour selectivity in the hippocampus and the lateral entorhinal cortex increased strongly during the cue period when the rat was sniffing in the odour port. During the first training stages, few cells fired differentially to odours A and B but at the end, when the rats had reached asymptotic performance, odour-selective firing was observed in approximately half of the cells, both in lateral entorhinal cortex and in the distal part of CA1, which has strong connections with the lateral entorhinal cortex. The selectivity of the odour representations was entirely abolished on error trials, when the rat subsequently ran to the wrong food location. The change in firing preferences was accompanied by a selective increase in the power of 20–40 Hz beta-gamma oscillations in the lateral entorhinal cortex and the distal CA1 (Fig. 19). The power increase was associated with an increase in the coherence of 20–40 Hz oscillations between field potentials in the
352�
The Nobel Prizes
FIGURE 18. Response of all cells with activity at the odour port. Cells were recorded in the distal CA1 and the lateral entorhinal cortex at times T1–T5 of odour-place training (T5 is above 85% correct criterion), and on error trials at T5 (T5e). Each row shows data for one cell around the time of odour sampling. Selectivity for odour cues is expressed for each cell as the difference in firing rate in the presence of left- and right-associated odours, divided by the sum of these rates. Selectivity is colour-coded from –1 to +1. Cells were sorted along the y-axis according to selectivity. Reproduced, with permission, from Igarashi et al. (2014).
Grid Cells, Place Cells and Memory�353
FIGURE 19. Well-trained animals exhibited strong 20–40 Hz oscillations in the distal CA1 and the lateral entorhinal cortex. Left: Percentage of correct choices as a function of training day. Arrows indicate different stages of training (T1–T5). Middle: recording locations in the distal CA1, the lateral entorhinal cortex, and the medial entorhinal cortex. Right: Time-resolved power spectra averaged across tetrodes in the distal CA1, the lateral entorhinal cortex, and the medial entorhinal cortex. Change in power is colourcoded. T5e indicates power spectra for error trials; T5d shows spectra for correct trials down sampled to the number of error trials. Note strong 20–40 Hz activity during presentation of the odour cue. Reproduced, with permission, from Igarashi et al. (2014).
two areas (Fig. 20). Again, the increase occurred gradually, in parallel with task performance and development of odour selectivity. At the beginning of training, there was no detectable coherence at all, but as the rats approached asymptotic performance, strong coherence developed (Fig. 20). On error trials, the coherence was abolished. The increase in power and coherence on correct trials was confined to the cue sampling interval in the odour port, when retrieval of odour-paired target locations was likely to take place. In CA1, the increase in coherence preceded the formation of odour-selective representations, suggesting that the CA1 activity was imposed by the emergence of coherent activity between cells in distal CA1 and lateral entorhinal cortex. Taken together, these findings demonstrate a form of hippocampal learning where improvement in associative performance coincides with increased coupling of 20–40 Hz oscillations in connected cell populations. The increase in functional coupling was associated with the development of unique odour representations in each area. Error trials were invariably accompanied by reduced coupling and reduced odour selectivity, suggesting that the changes are necessary for successful odour-cued place retrieval. The results point to 20–40 Hz oscillations as a mechanism for the formation of functional circuits between the
354�
The Nobel Prizes
FIGURE 20. Coherence between field potentials in the lateral entorhinal cortex and the distal CA1 at successive stages of training (T1–T5). Top: Time-resolved coherence spectra for EEG recorded simultaneously in the lateral entorhinal cortex and the distal CA1. T5e indicates coherence spectra for error trials; T5d shows spectra for correct trials downsampled to the number of error trials. Note the development of 20–40 Hz coherence as animals learn the task, as well as the loss of coherence on error trials. Reproduced, with permission, from Igarashi et al. (2014).
Grid Cells, Place Cells and Memory�355 lateral entorhinal cortex and the hippocampus during encoding of associative memory. Coherent firing in the lateral entorhinal cortex and CA1, mediated by coherent neural oscillations, may provide sufficient presynaptic and postsynaptic coincidence for changes in entorhinal-CA1 synapses to take place (Singer, 1993; Bi and Poo, 1998). REMAPPING KEEPS MEMORIES APART One of the greatest challenges for a memory system is to keep memories apart. Avoiding memory interference is particularly a challenge for the hippocampal system, given its involvement in episodic memory. Every day we experience thousands of episodes—episodes that must be stored as overlapping patterns of activity if the hippocampus is to have capacity for them all. If the storage involves overlapping activity, how can we then avoid mixing up memories that involve similar subsets of neurons, and what does this mean for the storage capacity of the hippocampus? The overlap of hippocampal representations has until now been tested by recording place cells in pairs of environments—in two differently shaped recording enclosures, or in boxes located in two different rooms. It was shown by Bob Muller and John Kubie in the 1980s that place cells form distinct maps for different recording environments (Muller and Kubie, 1987). The replacement of activity patterns between environments was referred to as ‘remapping’. In 2004, with postdoc Stefan Leutgeb, we showed that, in the CA3 area of the hippocampus, representations for environments in two different rooms are no more similar than expected by chance, with the chance level determined by scrambling the distribution of neurons that were active in the two rooms (Leutgeb et al., 2004). These recordings suggested that pairs of hippocampal representations are fully orthogonalised, raising the possibility that the hippocampus has mechanisms for decorrelating new representations from existing ones. The generality of this assumption has not been tested, however. With graduate student Charlotte Alme we thus set out to determine whether there is a limit to the number of orthogonal representations that can be stored in the CA3 network. Place cells were recorded in CA3 while animals explored a series of 11 environments, 10 of which were novel to the animal. All environments consisted of black square recording boxes placed in rooms with similar background cues. With this setup, we were able to compare 55 pairs of recording environments. The results were striking. All pairs were completely uncorrelated (Fig. 21), except when an environment was presented twice (Fig. 22). Thirty per cent of cells fired in only one environment, 13% fired in two rooms, and only
356�
The Nobel Prizes
FIGURE 21. Independence of place representations in CA3 of the hippocampus. The rat was tested in 11 different rooms (A–K). Data are shown for seven representative simultaneously recorded CA3 cells. Colour-coded firing rate maps show high rates in red and low rates (no activity) in blue. Note different patterns of activity across pairs of rooms. Most cells are active only in one or few rooms, and the combination of active cells differs from room to room. The bottom graph shows the number of cells with activity in different numbers of rooms. The majority of cells are active in either no rooms or only one room. Bottom right: Charlotte Alme. Reproduced, with permission, from Alme et al. (2014).
Grid Cells, Place Cells and Memory�357
FIGURE 22. Stability of place cells in the 11-room protocol. Room number is indicated at the top of each row (N, novel; F, familiar). Colour maps show firing rate across the recording box. Repeated recordings in N1 and N6 show stability of new representations. Reproduced, with permission, from Alme et al. (2014).
6% fired in 6 rooms or more. Population vector analyses further showed that the pattern of spatial firing across the cell sample was completely uncorrelated between each of the rooms (Fig. 23). In sum, these findings suggest that hippocampal place cells have the capacity to form large numbers of independent representations. Spatial patterns never carried over between environments. This independence among representations is exactly what is needed for a memory system to minimise interference. FROM SPATIAL MAPPING TO NAVIGATION In the final part of my talk I would like to ask how the brain uses hippocampal and entorhinal maps for navigation. For animals to get from one place to another, there must be mechanisms for reading out the information expressed in place cells and grid cells. These mechanisms are not well understood. We do not
358�
The Nobel Prizes
FIGURE 23. Population vector correlations across all pairs of test rooms in the 11-room experiment. Left: Definition of population vectors. Rate maps for all CA3 cells were stacked and 400 population vectors (PVs) were defined, one for each of the 20 × 20 pixels of the recording box. Right: Colour-coded matrix showing average dot product values for pairs of population vectors across all 55 room pairs. Room symbols as in Fig. 22. Note low dot products between all different pairs of rooms but high dot products between repeated trials in the same room (asterisks). Reproduced, with permission, from Alme et al. (2014).
know, at present, how place cells or grid cells are used for animals to get from their current location to a goal location elsewhere in the environment. Some important clues were obtained when scientists in the Eichenbaum lab reported, more than a decade ago, that place cells in hippocampal area CA1 express information about where the animal is coming from or where it is going (Wood et al., 2000). Rats were trained in a T-maze-based alternation task, in which they were trained to take alternating left or right turns at the junction (Fig. 24). Place cells on the stem of the maze fired at different rates on left- and right-turn trajectories. Later work showed that the dependence on trajectory had both retrospective and prospective components (Ferbinteanu and Shapiro, 2003), reflecting both the preceding and the succeeding choice of trajectory, with prospective components dominating near the end of the stem, before the decision point (Catanese et al., 2014). The source of this trajectory-dependent information has not been identified, however. In the final set of experiments, we asked whether the expression of trajectory choices depended on a wider circuit including not only the CA1 but also the medial prefrontal cortex and the nucleus reuniens of the thalamus, which projects selectively to the CA1 subfield of the hippocampus (Witter and Amaral, 2004; Cassel et al., 2013).
Grid Cells, Place Cells and Memory�359
FIGURE 24. Trajectory-dependent firing in CA1 of the hippocampus. Left: Hiroshi Ito. Top right: Modified T-mazes used for the continuous alternation task. The stem of the maze was divided into successive sectors. Bottom right: Trajectory of animal (grey) and spike positions of a single CA1 place cell. Left: trajectory only; middle: left-turn trials; right: right-turn trials. Reproduced, with permission, from Wood et al. (2000).
First, to test the impact of inputs from the nucleus reuniens, we compared trajectory-dependent firing in CA3 and CA1 of the hippocampus (Fig. 25; Ito et al., 2015). CA3 does not receive inputs from the nucleus reuniens, so if the latter is the source of trajectory-dependent firing, it should not be expressed strongly in the CA3 region. This prediction was verified in the data. While 55% of the cells in CA1 showed trajectory-dependent firing, with significantly higher firing rates on left turns than right turns, or vice versa, only 18% of the CA3 cells showed such activity. We then tested the contribution of reuniens activity more directly by monitoring activity in this nucleus, at the same time as spikes were recorded in CA1 (Fig. 26). Nucleus reuniens neurons were active across the entire maze but nonetheless exhibited differential firing on left- and right-turn trajectories. Forty-two per cent of the reuniens cells showed significant trajectory-dependent firing.
360�
The Nobel Prizes
FIGURE 25. Trajectory-dependent firing in CA1 (top) but not CA3 (bottom). Left panels: Rate maps for representative place cells during running in the continuous alternation task (left to right: all laps, right-turn laps, left-turn laps). Right panel: means (solid lines) and 95% confidence intervals (shaded) for spike rates of a single cell across the stem of the maze. Left-turn runs in blue, right-turn runs in red. Right: Left- and right-turn trajectories were classified as high-rate or low-rate depending on which direction had the highest mean peak rate on the stem. Spike rates were normalised to the peak firing rate of each cell and sorted according to field position on the high-rate trajectory. Each line shows one cell. Normalised spike rate is colour-coded. Reproduced, with permission, from Ito et al. (2014).
Because the nucleus reuniens receives strong projections from the medial prefrontal cortex (Cassel et al., 2013), we next hypothesised that trajectory-dependent firing in the reuniens is imposed by activity on this nucleus by inputs from the medial prefrontal cortex. To test this, we recorded activity in the anterior cingulate cortex and the prelimbic cortex (Fig. 27). Trajectory-dependent firing was found in both of these medial prefrontal areas, despite the lack of discrete firing fields in the rate maps. Approximately one-third of the cells showed significant differences in firing rate between left and right-turn trajectories. Finally, we asked if activity in the nucleus reuniens is necessary for trajectory-dependent firing in the CA1, or if alternatively trajectory-dependent firing patterns are expressed independently across a variety of brain regions. The question was addressed in two ways. First we used ibotenic acid to induce selective lesions in the nucleus reuniens. Activity was then recorded in CA1 (Fig. 28). The
Grid Cells, Place Cells and Memory�361
FIGURE 26. Trajectory-dependent firing in the nucleus reuniens. a: Nissl-stained coronal section showing tetrode track (red circle) in the nucleus reuniens (outline). b: Rate maps of a representative nucleus reuniens cell in the continuous alternation task. Top, colourcoded rate maps, with scale bar; bottom, spike locations (red) on trajectory (blue). c: Normalised spike rate on the stem for all cells recorded in nucleus reuniens, plotted as in Fig. 25. Reproduced, with permission, from Ito et al. (2014).
lesions reduced the number of cells with trajectory-dependent firing. Only 16% of the cells passed the criterion for trajectory dependence, a level almost identical to the percentage recorded in the CA3 region of control animals. In a second series of experiments, we inactivated parts of the nucleus reuniens using optogenetic methods. The enhanced halorhodopsin eNpHR3.1 was expressed selectively in the nucleus. Light was then applied over the injection site, and spikes were recorded in CA1. Again the percentage of trajectory-dependent cells decreased. These data demonstrate that nucleus reuniens activity is required for goal-directed firing in the CA1 area of the hippocampus. Collectively, our findings identify the medial prefrontal cortex, the nucleus reuniens and CA1 as part of an interconnected circuit for representation of goal-directed activity during spatial navigation. The data point to this circuit as
362�
The Nobel Prizes
FIGURE 27. Trajectory-dependent firing in the medial prefrontal cortex. a: Nissl-stained coronal section showing tetrode positions (red circles) in the dorsal prelimbic area. b: Rate maps for a representative cell recorded at the location in a. c: Normalised rate on the stem for all cells in the medial prefrontal cortex, as in Fig. 25 and 26. Reproduced, with permission, from Ito et al. (2014).
part of the animal’s representation of the intended direction of movement, and suggest that activity in this circuit is imposed by activity in the medial prefrontal cortex via connections through the nucleus reuniens. The data also provide evidence for a role of the thalamus in long-range communication between cortical regions.
Grid Cells, Place Cells and Memory�363
FIGURE 28. Impaired trajectory coding after lesions in the nucleus reuniens. a: Nisslstained coronal brain section showing a bilateral nucleus reuniens lesion. Outline shows the nucleus reuniens. b: Colour-coded rate maps for a representative CA1 place cell in a nucleus reuniens-lesioned animal. c: Mean rate, 95% confidence intervals and rasters for the cell in b. d: Normalised firing rate on the stem for all CA1 place cells from animals with nucleus reuniens lesions, plotted as in Fig. 25–27. e: Box plot showing change in peak rate between left- and right-turn trajectories for CA1 place cells with trajectorydependent firing. Note that in nucleus reuniens-lesioned animals, the number of CA1 cells with trajectory-dependent firing is no larger than in CA3 of control animals. Reproduced, with permission, from Ito et al. (2014).
FIGURE 29. Illustration of the medial prefrontal—nucleus reuniens—CA1 circuit for trajectory-dependent activity. Goal-directed information through this circuit is mixed in the hippocampus with information from the medial and lateral entorhinal cortices.
364�
The Nobel Prizes
FIGURE 30. Movie illustrating with music the search for insight in the brain sciences. The search occurs in a foggy landscape but for the one who searches persistently there are openings. Music composed and performed by musicians at the Norwegian University of Science and Technology (Helmet; names at the end of the movie). The movie can be viewed at www.nobelprize.org.
THANK YOU! Edvard, John and I would like to thank the Nobel committee and the assembly for awarding us the 2014 Nobel Prize. I want to celebrate the event by sharing a movie with music made especially for this event. The music is made by jazz musicians at my institution, the Norwegian University of Science and Technology. It is inspired by our search for knowledge—a search that sometimes feels like wandering in a fog landscape where we see things close to us but fail to obtain a global view. Research is a bit like that but sometimes we make breakthroughs and see far. During the past few decades there have been many breakthroughs in systems and circuit neuroscience. The prize to the three of us is recognition of this exciting development. REFERENCES 1. Alme CB et al. (2014). Place cells in the hippocampus: Eleven maps for eleven rooms. Proc. Natl. Acad. Sci. USA, 111, 18428–18435. 2. Barry C et al. (2006). The boundary vector model of place cell firing and spatial memory. Rev. Neurosci. 17, 71–97. 3. Bi GQ and Poo MM (1998). Synaptic modifications in cultured hippocampal neurons: dependence on spike timing, synaptic strength, and postsynaptic cell type. J. Neurosci. 18, 10464–72.
Grid Cells, Place Cells and Memory�365 4. Burwell RD (2000). The parahippocampal region: corticocortical connectivity. Ann. N. Y. Acad. Sci. 911, 25–42. 5. de Almeida L, Idiart M and Lisman JE (2009). The input-output transformation of the hippocampal granule cells: from grid cells to place cells. J. Neurosci. 29, 7504–7512. 6. Cassel JC et al. (2013). The reuniens and rhomboid nuclei: neuroanatomy, electrophysiological characteristics and behavioral implications. Prog. Neurobiol. 111, 34–52. 7. Catanese J, Viggiano A, Cerasti E, Zugaro MB and Wiener SI (2014). Retrospectively and prospectively modulated hippocampal place responses are differentially distributed along a common path in a continuous T-maze. J. Neurosci. 34, 13163–13169. 8. Deshmukh SS and Knierim JJ (2011). Representation of non-spatial and spatial information in the lateral entorhinal cortex. Front. Behav. Neurosci. 5, 69. 9. Felleman DJ and van Essen DC (1991). Distributed hierarchical processing in the primate cerebral cortex. Cereb. Cortex 1, 1–47. 10. Ferbinteanu J and Shapiro ML (2003). Prospective and retrospective memory coding in the hippocampus. Neuron 40, 1227–1239. 11. Fuhs MC and Touretzky DS (2006). A spin glass model of path integration in rat medial entorhinal cortex. J. Neurosci. 26, 4266–4276. 12. Fyhn M, Molden S, Witter MP, Moser EI and Moser M-B (2004). Spatial representation in the entorhinal cortex. Science 305, 1258–1264. 13. Hafting T, Fyhn M, Molden S, Moser M-B and Moser EI (2005). Microstructure of a spatial map in the entorhinal cortex. Nature 436, 801–806. 14. Hartley T, Burgess N, Lever C, Cacucci F and O’Keefe J (2000). Modeling place fields in terms of the cortical inputs to the hippocampus. Hippocampus 10, 369–379. 15. Hubel DH and Wiesel T (1962). Receptive fields, binocular interaction, and functional architecture of cat striate cortex. J. Physiol. (Lond.) 160,106–154. 16. Igarashi KM, Lu L, Colgin LL, Moser M-B and Moser EI (2014). Coordination of entorhinal-hippocampal ensemble activity during associative learning. Nature 510, 143–147. 17. Ito HT, Zhang S-J, Witter MP, Moser EI, Moser M-B (2015). A prefrontal-thalamohippocampal circuit for goal-directed spatial coding. Nature, in press. 18. Jarosiewicz B and Skaggs WE (2004). Hippocampal place cells are not controlled by visual input during the small irregular activity state in the rat. J. Neurosci. 24, 5070–7. 19. Lee AM et al. (2014). Identification of a brainstem circuit regulating visual cortical state in parallel with locomotion. Neuron 83, 455–466. 20. Leutgeb S, Leutgeb JK, Treves A, Moser MB and Moser EI (2004). Distinct ensemble codes in hippocampal areas CA3 and CA1. Science 305, 1295–1298. 21. Leutgeb JK et al. (2005a). Progressive transformation of hippocampal neuronal representations in “morphed” environments. Neuron 48, 345–358. 22. Leutgeb S, Leutgeb JK, Moser M-B, Moser EI (2005b). Place cells, spatial maps and the population code for memory. Curr. Opin. Neurobiol. 15, 738–746. 23. Lever C, Burton S, Jeewajee A, O’Keefe J and Burgess N (2009). Boundary vector cells in the subiculum of the hippocampal formation. J. Neurosci. 29, 9771–9777.
366�
The Nobel Prizes
24. McNaughton BL, Battaglia FP, Jensen O, Moser EI and Moser M-B (2006). Path integration and the neural basis of the ‘cognitive map’. Nature Rev. Neurosci. 7, 663–678. 25. Monaco JD and Abbott LF (2011). Modular reealignment of entorhinal grid cell activity as a basis for hippocampal remapping. J. Neurosci. 31, 9414–9425. 26. Muller RU and Kubie JL (1987). The effects of changes in the environment on the spatial firing of hippocampal complex-spike cells. J. Neurosci., 1951–1968. 27. O’Keefe J (1976). Place units in the hippocampus of the freely moving rat. Exp. Neurol. 51, 78–109. 28. O’Keefe J and Burgess N (1996). Geometric determinants of the place fields of hippocampal neurons. Nature 381, 425–428. 29. O’Keefe J and Dostrovsky J (1971). The hippocampus as a spatial map. Preliminary evidence from unit activity in the freely-moving rat. Brain Res. 34, 171–175 (1971). 30. O’Keefe J and Nadel L (1978). The Hippocampus as a Cognitive Map (Oxford: Clarendon Press). 31. O’Keefe J and Speakman A (1987). Single unit activity in the rat hippocampus during a spatial memory task. Exp.Brain Res. 68, 1–27. 32. Pavlides C and Winson J (1989). Influences of hippocampal place cell firing in the awake state on the activity of these cells during subsequent sleep episodes. J. Neurosci. 9, 2907–2918. 33. Petrulis A, Alvarez P and Eichenbaum H (2005). Neural correlates of social odor recognition and the representation of individual distinctive social odors within entorhinal cortex and ventral subiculum. Neurosci. 130, 259–274. 34. Ranck J Jr. (1985). Head direction cells in the deep cell layer of dorsal presubiculum in freely moving rats. In Electrical Activity of the Archicortex, ed. G. Buzsáki, CH Vanderwolf, pp. 217–20 (Budapest: Akademiai Kiado). 35. Rolls ET, Stringer SM and Ellio T (2006). Entorhinal cortex grid cells can map to hippocampal place cells by competitive learning. Network 17, 447–465. 36. Sargolini F, Fyhn M, Hafting T, McNaughton BL, Witter MP, Moser M-B and Moser EI (2006). Conjunctive representation of position, direction, and velocity in entorhinal cortex. Science 312, 758–762. 37. Savelli F and Knierim JJ (2010). Hebbian analysis of the transformation of medial entorhinal grid-cell inputs to hippocampal place fields. J. Neurophysiol. 103, 3167–3183. 38. Savelli F, Yoganarasimha D and Knierim JJ (2008). Influence of boundary removal on the spatial representations of the medial entorhinal cortex. Hippocampus 18, 1270–1282. 39. Scoville WB and Milner B (1957). Loss of recent memory after bilateral hippocampal lesions. J. Neurol. Neurosurg. Psychiatry 20, 11–21. 40. Singer W (1993). Synchronization of cortical activity and its putative role in information processing and learning. Annu. Rev. Physiol. 55, 349–74. 41. Solstad T, Boccara CN, Kropff E, Moser M-B and Moser EI (2008). Representation of geometric borders in the entorhinal cortex. Science 322, 1865–1868. 42. Solstad T, Moser EI, Einevoll GT (2006). From grid cells to place cells: A mathematical model. Hippocampus 16, 1026–1031.
Grid Cells, Place Cells and Memory�367 43. Squire LR (1992). Memory and the hippocampus: A synthesis from findings with rats, monkeys, and humans. Psychol. Review 99, 195–231. 44. Squire LR and Wixted JT (2011). The cognitive neuroscience of human memory since H.M. Annu. Rev. Neurosci. 34, 259–288. 45. Squire LR and Zola-Morgan S (1991). The medial temporal lobe system. Science 253, 1380–1386. 46. Taube JS (2007). The head direction signal: origins and sensory-motor integration. Annu. Rev. Neurosci. 30, 181–207. 47. Tsao A, Moser M-B and Moser EI (2013). Traces of experience in the lateral entorhinal cortex. Curr. Biol. 23, 399–405. 48. Wills TJ, Barry C and Cacucci F (2012). The abrupt development of adult-like grid cell firing in the medial entorhinal cortex. Front Neural Circuits 6, 21. 49. Wilson MA and McNaughton BL (1993). Dynamics of the hippocampal ensemble code for space. Science 261, 1055–1058. 50. Wilson MA and McNaughton BL (1994). Reactivation of hippocampal ensemble memories during sleep. Science 265, 676–679. 51. Witter MP and Amaral DG (2004). Hippocampal Formation. In: The Rat Nervous System, edited by Paxinos G, p. 635–704. 52. Wood ER, Dudchenko PA, Robitsek RJ and Eichenbaum H (2000). Hippocampal neurons encode information about different types of memory episodes occurring in the same location. Neuron 27, 623–633. 53. Yates, FA (1966). The Art of Memory. Chicago: University of Chicago Press. 54. Zhang SJ et al. (2013). Optogenetic dissection of entorhinal-hippocampal functional connectivity. Science 340, 1232627. Portrait photo of May-Britt Moser by photographer Alexander Mahmoud.