GREENHOUSE GAS INVENTORY FOR ABU DHABI EMIRATE
INVENTORY RESULTS EXECUTIVE SUMMARY DECEMBER 2012
Under the Patronage of:
Led By:
ABOUT EAD The Environment Agency - Abu Dhabi (EAD) was established in 1996 to preserve Abu Dhabi’s natural heritage, protect our future, and raise awareness about environmental issues. EAD is Abu Dhabi’s environmental regulator and advises the government on environmental policy. It works to create sustainable communities, and protect and conserve wildlife and natural resources. EAD also works to ensure integrated and sustainable water resources management, to ensure clean air and minimise climate change and its impacts.
Published By Environment Agency - Abu Dhabi P.O. Box 45553, Abu Dhabi T. +971 2 445 4777 F. +971 2 446 3339 E.
[email protected] www.ead.ae © Copyright 2012 Environment Agency - Abu Dhabi All Rights Reserved No part of this publication may be reproduced, stored in a retrieval system or transmitted in any form or by any means, electronic, electrostatic, magnetic tape, mechanical, photocopying, recording, scanning or otherwise, without permission in writing from the publisher.
2
TABLE OF CONTENTS Foreword
04
1. Climate Change Challenges and Greenhouse Gas Mitigation
06
2. Methodology and Tools of GHG Inventory
07
3. Energy Sector
08
3.1 Potential Sources and Emissions
08
3.2 Methodological Approaches of Estimation
08
3.3 GHG Emissions from Oil and Gas Subsector
08
3.4 GHG Emissions from the Electricity Production and Water Desalination Subsector
08
3.5 GHG Emissions from the Energy Industries Subsector
09
3.6 GHG Emissions from the Transport Subsector
10
3.7 GHG Emissions from Manufacturing Industries and Construction
12
3.8 GHG Emissions from the ‘Other’ Energy Subsectors
13
4. Industrial Processes Sector
14
4.1 Potential Sources and Emissions
14
4.2 Summary of Emissions
14
5. Agriculture Sector
15
5.1 Potential Sources and Emissions
15
5.2 Estimation of GHG Emissions
15
6. Land-use Change and Forestry Sector
16
6.1 Potential Sources or Sinks, and Emissions or Removals
16
6.2 Estimation of GHG Emissions/Removals
16
7. Waste Sector
17
7.1 Potential Sources and Emissions
17
7.2 Estimation of GHG Emissions
17
8. Overall GHG Inventory Results
18
8.1 Total GHG Emissions
18
8.2 Key Category Sources and Emissions
22
8.3 Key Emissions Indicators
23
9. Challenges
24
10. Recommendations
24
Stakeholders
25
3
FOREWORD The GHG Inventory for Abu Dhabi Emirate project started in April 2011 with an overall time period of two years. This included planning and institutional arrangements; capacity strengthening; data collection; estimation of emissions and reporting. The proper institutional arrangement to conduct and manage the project was defined, based on integration of all necessary actions and procedures of the inventory, as well as the sharing of responsibilities between all relevant stakeholders. The face-to-face meetings and consultations with relevant entities, as well as the capacity strengthening programme that targeted most of the concerned entities at local and federal level, all contributed to enhance the data access and implementation of the inventory. The inventory report represents the main achievements of the project with a focus on the technical basis associated with data collection and emissions estimation. It provides the basis for the inputs used to develop the GHG inventory, and the detailed IPCC spreadsheets of estimations that integrate inputs in one analytical framework. The GHG inventory results are reported in the IPCC format; analysed by sector, subsectors and key category of emission; and presented in accordance with the national needs and standards indicators. ABU DHABI INITIATIVE FOR A GHG INVENTORY EAD decided to conduct a GHG inventory for the Abu Dhabi Emirate, in line with the international commitment to the UNFCCC, and in action to the Abu Dhabi environmental baseline and strategic priority for air quality. The initiative aims to identify and quantify the GHG emissions and removals from sources and sinks according to international procedures and guidelines of the IPCC. The target sectors are energy; industrial processes and product use; land-use change and forestry; agriculture; and waste. The detailed and up-to-date listing of greenhouse gas emissions and removals in Abu Dhabi Emirate will support the national GHG inventory for the UAE, and allow researchers and policy-makers to perform scenarios for co-control measures and co-benefit opportunities in the Emirate. The project will not only establish the baseline for the GHG data necessary for assessing future environmental improvement measures, but has also contributed to capacity-strengthening of local entities in terms of competence building and knowledge transfer for estimation and reporting of their emissions. This initiative is the first of its kind in the region in that it focuses on finer geographic and subcategory levels of detail. It is encouraging to note that the Dubai Carbon Centre of Excellence recently launched a similar project for the Dubai Emirate. Such efforts will facilitate development of an emirate-scale estimate, analysis and impact assessment of global change, which will lead to reliable regional climate change projections or modelling in the Middle East. The Abu Dhabi GHG inventory is tracking GHG sources and sinks in the Emirate of Abu Dhabi for the year 2010; the most recent year with available and accessible data. 2010 is also representative of a period of high economic development and can be aligned, to the extent possible, with baseline years used in other inventories or in updating the upcoming national GHG inventory and communication report.
4
5
1. CLIMATE CHANGE CHALLENGES & GREENHOUSE GAS MITIGATION Climate change is a persistent and long-term significant change in the ‘average’ climate and natural variability that a given region experiences. This may include average temperature, precipitation and wind patterns. Climate change has widely been attributed to the increase in greenhouse gases in the atmosphere as a result of human activities. The Intergovernmental Panel on Climate Change (IPCC) 4th Assessment Report 1 makes a number of points specific to the Middle East and summarises past and present climate change impacts on the region as follows: o Increasing surface air temperature which is more pronounced during winter than in summer; o Inter-seasonal, inter-annual and spatial variability in rainfall trends has been observed during the past few decades across Asia; and o Annual mean rainfall exhibits increasing trends in the Arabian Peninsula. The State of the Environment (SoE) Report for Abu Dhabi highlighted key vulnerabilities associated with climate change, principally sea-level rise coastal flooding; increased salinity of coastal aquifers; impacts on the marine environment; heat stress; built environment impacts; risk to health from vector-bourne diseases; more extreme weather events (floods, droughts, etc.); increased risk of dust storms; and risk from airborne contaminants (e.g. pesticides)2. It is important to note that greenhouse gas mitigation represents a voluntary and progressive approach to the climate change challenge. The Environment Agency-Abu Dhabi (EAD) believes that significant reductions in emissions are feasible, and that there will be real advantages to the Emirate in aiming to achieve them. In short, both mitigation and adaptation activities are very important for the Emirate. There are already existing or draft strategies that will ensure that Abu Dhabi achieves significant GHG reductions in the mid-term. These include: o Masdar initiative o The Ecological Footprint Initiative (Al Basma Al Beeiyah) o Executive Affairs Authority’s programme to reduce energy consumption through improved AC efficiency o Estidama Initiative on green building codes for new residential and commercial construction o Abu Dhabi Energy Policy that contains a 7% renewable electricity capacity target by 2020; nuclear power generation; and demand side management schemes o Abu Dhabi Environment Vision 2030 o Abu Dhabi Economic Vision 2030 o Abu Dhabi Plan 2030 o Surface Transport Master Plan 2030 o Waste Management Strategy o ADNOC Strategic Health, Safety and Environment (HSE) Objectives, including elimination of hydrocarbon flaring, and optimisation of land, energy and raw materials utilisation within the oil and gas industry.
1. IPCC 4th Assessment Repor t, 2007, www.ipcc.ch 2. State of the Environment Repor t for Abu Dhabi, 2007 http://www.soe.ae/Abu_Themespage.aspx?m=43
6
2. METHODOLOGY AND TOOLS OF GHG INVENTORY The methodology used to develop Abu Dhabi's GHG inventory is based on the Revised 1996 IPCC Guidelines for National Greenhouse Gas Inventories; the IPCC Good Practice Guidance and Uncertainty Management in National Greenhouse Gas Inventories (GPG2000) prepared by the IPCC; and the Good Practice Guidance for Land Use, Land-Use Change, and Forestry (GPG2003), which further expanded upon the methodologies in the Revised 1996 IPCC Guidelines. Following the revised IPCC Guidelines, carbon dioxide (CO2), methane (CH4) and nitrous oxide (N2O) emissions were examined and quantified. Nitric oxides (NOx), sulphur dioxide (SO2), non-methane volatile organic compounds (NMVOCs), and carbon monoxide (CO) were also considered in this report.
7
3. ENERGY SECTOR 3.1 POTENTIAL SOURCES AND EMISSIONS The energy sector is the most important sector in greenhouse gas emission inventories, and CO2 accounts typically for 95% of energy sector emissions. GHG emissions from the energy sector include emissions from fuel combustion activities (energy industries, manufacturing industries and construction, transport and others) and fugitive emissions from fuel extraction, transformation, transportation and storage. Examples are leakage of natural gas and flaring during oil or gas extraction and refining. 3.2 METHODOLOGICAL APPROACHES OF ESTIMATION The IPCC guidelines distinguish two basic approaches for estimating emissions from fossil fuel combustion: the Reference or Top-down Approach, and the Sectoral or Bottom-up Approach. The Reference Approach is a straightforward method that can be applied on the basis of relatively available energy supply statistics, including fuel exports, imports and stock changes. The Sectoral approach covers a detailed account of GHG emissions on the basis of energy production, transformation and consumption statistics. Due to the lack of statistical data on aggregated fuel consumption, the Sectoral approach was used for estimation of emissions. 3.3 GHG EMISSIONS FROM OIL AND GAS SUBSECTOR The overall GHG emissions associated with oil and gas industries in Abu Dhabi Emirate in 2010 were totalled 17,206 Gg CO2 eq, of which fugitive emissions contributed only 6% and the remaining were combustion emissions. 3.4 GHG EMISSIONS FROM THE ELECTRICITY PRODUCTION AND WATER DESALINATION SUBSECTOR This subsector of energy refers to water desalination and power generation, which are usually linked, in Abu Dhabi Emirate. GHG emissions arise from this subsector by combustion of fossil fuels in Combined Heat and Power (CHP) plants. The total electricity generation in 2010 was 41,859 GWh, of which 147 GWh was transferred from the Emirates Aluminium company (EMAL) and the Abu Dhabi Oil Refining company (TAKREER). The GHG emissions arising from public electricity production and water desalination by ADWEA and IWPPs plants totaled 30,840 Gg CO2 eq. These emissions correspond to 41,712 GWh, excluding the 147 GWh transferred from EMAL and TAKREER to the public grid.
8
3.5 GHG EMISSIONS FROM THE ENERGY INDUSTRIES SUBSECTOR The GHG emissions from the energy industries (comprising public electricity production combined with water desalination, oil and gas extraction and oil refining) totalled 48,045 Gg CO2 eq, of which only 2% were fugitive. Regarding the indirect emissions, the most dominant were NOx from combustion activities and SOx from fugitive oil/gas activities. The results of emissions are presented in Table 3.1 and Figures 3.1 to 3.3. Table 3.1: Direct GHG Emissions from Energy Industries by Activity and by Emission Category Public Electricity Production & Water Desalination
Oil Extraction
Gas Processing
Oil Refining
Total Energy Industries Emissions
Total GHG Emissions (Gg CO2 eq)
30,840
1,650
10,328
5,228
48,045
Subsector Share %
64.2%
3.4%
21.5%
10.9%
100%
Combustion Emissions (Gg CO2 eq)
30,840
1,478
9,538
5,223
47,078
0
172
790
5
967
Energy Subector
Fugitive Emissions (Gg CO2 eq)
Fugitive emissions constitute about 2% of energy industries total GHG emissions.
As seen in Figure 3.1, public electricity and water desalination was the dominant activity in energy industries, responsible for about 64% of the direct GHG emissions. Gas extraction/processing, oil refining and oil extraction were responsible for 22%, 11% and 3% of the energy industries emissions, respectively.
Fig. 3.1: Sectoral Direct GHG Emissions from Energy Industries Oil Ref ining Gas Processing Oil Extraction
10.9%
Public Electricity Production & Water Desalination
21.5% 64.2% 3.4%
9
Fig. 3.2: Direct GHG Emissions from Energy Industries (Gg CO2 eq)
35,000
30,840
30,000 25,000 20,000 15,000 10,328
10,000 5,000
5,228 1,650
0
Oil Refining
Gas Processing
Oil Extraction
Public Electricity Production & Water Desalination
Fig. 3.3: Direct and indirect GHG emissions from energy industries by gas
Direct GHG Emissions from Energy Industries 50.000 45.000 40.000 35.000 30.000 25.000 20.000 15.000 10.000 5.000 0
Indirect GHG Emissions from Energy Industries 35.00 30.00 25.00 20.00 15.00 10.00 5.00 0
CO2 emissions (Gg)
CH4 (Gg CO2 eq)
N2O (Gg CO2 eq)
NOx (Gg)
CO (Gg)
NMVOCs (Gg)
SOx (Gg)
3.6 GHG EMISSIONS FROM THE TRANSPORT SUBSECTOR In general, the transport sector includes domestic aviation, road transport, rail transport, national navigation, and other forms of transport. In Abu Dhabi Emirate, four types of fuel were consumed in the transport subsectors in 2010, namely gasoline, diesel oil, natural gas, and jet kerosene. Sector applicability and consumption shares of fuel across the transport subsectors in the Emirate of Abu Dhabi are summarised on the following page:
10
The results of emissions are presented in Table 3.2 and Figures 3.4 and 3.5. Table 3.2: GHG Emissions from the Transport Subsector Greenhouse gas source category
Total Transport Emissions Fuel combustion emissions
CO2 Total GHG emissions emissions (Gg CO2 eq) (Gg) 18,547.28 18,547.28
GH4 N2O GH4 N2O (Gg) (Gg CO2 eq) (Gg) (Gg CO2 eq)
18,321.59 0.79 18,321.59
NOx (Gg)
CO NWVOCs SOx (Gg) (Gg) (Gg)
16.61
0.67
209.09
60.12160.73 11.28
4.67
16.61
0.67
209.09
60.12 160.73 11.28
4.67
0.79
Table 3.3: GHG emissions by transport category Greenhouse gas source category Road Aviation Other Total Transport Emissions
CO2
CH4
N2O
Total GHG emissions (Gg CO2 eq)
11,549.38
15.24
170.98
11,735.60
6,735.37
1.36
37.27
6,774.00
36.84
0.00
0.84
37.68
18,321.59
16.61
209.09
18,547.28
The direct GHG emissions in the transport sector totalled 18,547 Gg CO2eq, of which 63% was emitted from road vehicles and 37% from domestic aviation. Fig. 3.4: Sectoral Direct GHG Emissions from Transport Road 0.2%
Aviation Others
36.8%
63.0%
Fig. 3.5: Transport GHG Emissions by Category and by Emission Type N2O CH 4 CO 2 Gg CO 2 eq 12,000.00 10,000.00 8,000.00 6,000.00 4,000.00 2,000.00 0.00 Road
Aviation
Others
11
3.7 GHG EMISSIONS FROM MANUFACTURING INDUSTRIES AND CONSTRUCTION GHG emissions from industry are split into two sectors: energy-related emissions reported under the energy subsector ‘manufacturing industries and construction’, and the industrial processing emissions reported under ‘industrial processes and product use’ sector. GHG emissions associated with manufacturing industries are the fuel combustion emissions; CO2, CH4, N2O, CO, NOx, SO2 and NMVOC. The results of emissions are presented in Table 3.3 and Figure 3.6. Table 3.4: GHG Emissions from the Manufacturing Industries Subsector Greenhouse gas source category
CO2 Total GHG emissions emissions (Gg) (Gg CO2 eq)
CH4 CH4 (Gg) (Gg CO2 eq)
N 2O (Gg)
N2O (Gg CO2 eq)
NOx (Gg)
CO (Gg)
NMVOCs SOx (Gg) (Gg)
Total manufacturing industries Emissions
4,821.39
4,794.55
0.09
1.88
0.08
24.96
11.85
7.01
0.11
0.03
manufacturing industries & construction
4,821.39
4,794.55
0.09
1.88
0.08
24.96
11.85
7.01
0.11
0.03
Fig. 3.6: GHG Emissions from Manufacturing Industries and Construction CO 2 CH 4 N2O 5,000 4,000 3,000 2,000 1,000 0 CO 2
CH4
N 2O
The direct GHG emissions from manufacturing industries and construction subsector totalled 4,821 Gg CO2 eq, mainly in the form of CO2. This constitutes about 6.7% of the GHG emissions in the energy sector.
12
3.8 GHG EMISSIONS FROM THE ‘OTHER’ ENERGY SUBSECTORS The ‘Other’ energy subsectors comprise energy activities in residential, commercial/institutional, agriculture and fishing areas. In Abu Dhabi Emirate, there were two types of fuel consumed in these subsectors in 2010, namely Liquefied Petroleum Gas (LPG) and fuel oil. The results of emissions are presented in Table 3.4 and Figure 3.7. Table 3.5: GHG Emissions associated with ‘Other’ Energy Subsectors Greenhouse gas source and sink categories Other subsectors (residential, commercial/ institutional, agriculture and fishing)
Total GHG CO2 emissions emissions (Gg CO2 (Gg) eq)
509.98
506.73
CH4 (Gg)
0.01
N 2O CH4 (Gg CO2 (Gg) eq)
0.11
0.01
N2O (Gg CO2 eq)
NOx (Gg)
CO (Gg)
NMVOCs (Gg)
SOx (Gg)
3.13
1.91
8.02
0.56
0.18
CO2 eq )
Fig. 3.7: Direct GHG Emissions from ‘Other’ Energy Subsectors
CO 2 CH 4 N2O
Gg CO 2 eq 600.00 500.00 400.00 300.00 200.00 100.00 0.00
Other subsectors (residential, commercial/industrial, agriculture and fishing)
The direct GHG emissions from the residential, commercial or institutional, agriculture and fishing subsectors totalled 510 Gg CO2 eq, mainly in the form of CO2. This constitutes less than 1% of the GHG emissions in the energy sector.
13
4. INDUSTRIAL PROCESSES SECTOR 4.1 POTENTIAL SOURCES AND EMISSIONS This sector covers the industrial processes from manufacturing industries. GHG emissions arise from a wide variety of activities, which emit carbon dioxide (CO2), methane (CH4), nitrous oxide (N2O), hydrofluorocarbons (HFCs) and perfluorocarbons (PFCs). 4.2 SUMMARY OF EMISSIONS The direct GHG emissions from Industrial Process totalled 17,907 Gg CO2 eq, of which about 42% was PFCs and the remaining was CO2. These constitute about 18.1% of the total GHG emissions in the Emirate of Abu Dhabi. The emissions mainly arose from aluminium production; iron and steel production; and cement production. GHG emissions from asphalt and glass production were negligible. Table 4.1 presents the GHG emissions from the industrial processes in the Emirate of Abu Dhabi. Table 4.1: GHG Emissions from Industrial Processes (Gg CO2 eq)
(Gg) CO2
CH4
N2O
10,367.38
0.00
0.00
Mineral Products 1,866.38
0.00
0.00
Total Industrial Processes
Cement Production
NMVOC
SO2
HFCs
PFCs
SF6
Direct GHG
1.79 101.25
841.91
11.98
0.00
1.16
0.00
17,907.38
0.00
841.77
1.12
0.00
0.00
0.00
NOx
CO
0.00
1,866.38
Road Paving with Asphalt
841.77
Glass Production
0.00
Metal Production 8,501.00 Iron and Steel Production Aluminium Production
1,866.38
1.12
0.00
0.00
1.79 101.25
0.14
10.86
7,376.00
0.18
0.14
0.21
1,125.00
1.61 101.25
0.00
10.65
0.00
1.16
0.00 7,376.00
1.16
8,665.00
Figure 4.1 illustrates the industry share in direct GHG from the three major industrial processes in the Emirate of Abu Dhabi. Figure 4.1: Industry Share in Direct GHG Emissions from Industrial Processes Iron and Steel Production Aluminium Production Cement Production 11%
Figure 4.2: Direct GHG Emissions from Industrial Processes CO 2 PFC
Gg CO 2 eq 18,000.00 16,000.00 14,000.00 12,000.00 10,000.00
48%
8,000.00 41%
6,000.00 4,000.00 2,000.00 0.00 Metal Production
Mineral Products
The PFCs emissions totalled 7,540 Gg CO2 eq. The source of this type of emission is the primary production of aluminum. Figure 4.2 presents the emissions of CO2 and PFCs from the industrial processes sector. Emissions from hydrofluorocarbons (HFCs) were considered negligible as the products containing these gases were not produced in the Emirate.The estimation of SF6 emissions associated with electric power transmission proved to be a significant challenge due to data constraints and was assumed to be negligible. However, more investigation can be conducted on PFCs, HFCs and SF6 emissions in the next inventory. 14
5. AGRICULTURE SECTOR 5.1 POTENTIAL SOURCES AND EMISSIONS The agricultural sector contributes methane emissions from enteric fermentation and manure management, as well as nitrous oxide emissions from agricultural soils. Other categories for agricultural emissions, namely rice cultivation and prescribed savannah burning do not apply to the Emirate of Abu Dhabi. Field burning of agricultural residues is considered as negligible. 5.2 ESTIMATION OF GHG EMISSIONS The results of emissions are presented in Table 5.1 and Figures 5.1 and 5.2.
Table 5.1: GHG Emissions from Agriculture Greenhouse gas source category
CH4
N2O
Figure 5.1: GHG Emissions from Agriculture
Total GHG emissions (Gg CO2 eq)
N 2O
Gg CO 2 eq
CH 4
1,800.00 1,600.00 1,400.00
Enteric fermentation
649.36
Manure Management
35.30
Agriculture Soils
649.36 0.00
35.30
1,728.05
1,728.05
1,200.00 1,000.00 800.00 600.00 400.00 200.00
Total Agriculture 684.66 1,728.05 Emissions
0.00
2,412.71
Agriculture Manure Soils Management
Enteric Fermentation
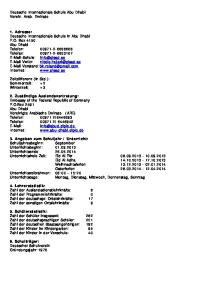
The direct GHG emissions from the agriculture sector totalled 2,413 Gg CO2 eq, predominantly in the form of N2O from fertilisers used in agricultural soils. The emissions were 2.4% of the total GHG emissions from all activity sectors in the Emirate. Compared to the UAE national inventory for the year 2000 (SNC), the share for the agriculture sector was 3%. As shown in Figure 5.2, the majority of the GHG emissions were from agricultural soils (72%), then enteric fermentation (27%) and finally from manure management (1%).
Figure 5.2: Source breakdown for GHG Emissions in Agriculture Agriculture Soils Enteric Fermentation Manure Management
27%
72%
1%
15
6. LAND-USE CHANGE AND FORESTRY SECTOR 6.1 POTENTIAL SOURCES OR SINKS, AND EMISSIONS OR REMOVALS This sector covers emissions and removals of greenhouse gases from different land uses such as forestry, croplands, grasslands and settlements3. The net carbon uptake due to these sources is calculated and if the figure is positive then this counts as a removal of CO2, and if the figure is negative, it counts as an emission. Finally, the net carbon uptake or emission is expressed as CO2. Therefore, the dominant gas of concern in this source category is carbon dioxide (CO2). Other important direct GHGs are methane (CH4) and nitrous oxide (N2O). Indirect GHGs, including carbon monoxide (CO), oxides of nitrogen (NOx, i.e., NO and NO2), and non-methane volatile organic compounds (NMVOCs), are also produced from land-use change and forest management activities, particularly where burning is involved. 6.2 ESTIMATION OF GHG EMISSIONS/REMOVALS The results are presented in Table 6.1 and Figure 6.1. Table 6.1: Overall GHG Emissions and CO2 Removals by Land-use Change & Forestry Greenhouse gas source and sink categories Total national emissions and removals
Total GHG CO2 CO2 CH4 CH4 emissions emissions removals (Gg) (Gg CO2 (Gg CO2 (Gg) (Gg) eq) eq) 99,100.51 77,907.12 -4,609.28 413.92 8,692.30
Total land-use change and forestry
0.00
0.00 -4,609.28
A. Changes in forest and other woody biomass stocks
0.00
0.00 -4,609.28
B. Forest and grass land conversion
0.00
0.00
C. Abandonment of managed lands
0.00
N2O (Gg)
N2O (Gg CO2 eq)
NOx (Gg)
CO (Gg)
16.00
4,961.09
108.03
289.77
0.00
0.00
0.00
0.00
0.00
0.00
0.00
0.00
0.00
0.00
0.00
0.00
0.00
0.00
0.00
0.00
0.00
0.00
NMVOCs SOx (Gg) (Gg)
856.84
48.22
0.00
0.00
PFCs PFCs (Gg eq) (Gg CO2 eq)
1.16
7,540.00
0.00
D. CO2 emissions & removals from soils
0.00
0.00
0.00
E. Other (please specify)
0.00
0.00
0.00
Figure 6.1: Contribution of LUCF as a sink for CO2 removals CO2 Emissions
6%
CO2 Removals
94%
The contribution of the land-use change and forestry sector as a sink for CO2 removals was 4,609 Gg CO2, a sequestration of about 6% of the total CO2 emissions, or abatement of 4.7% of the total GHG emissions in the Emirate.
3. Settlements include all classes of urban tree formation and village trees.
16
7. WASTE SECTOR 7.1 POTENTIAL SOURCES AND EMISSIONS In Abu Dhabi Emirate, based on the collected information, this sector comprises of methane from municipal solid waste (MSW)4 disposal; methane from domestic or commercial wastewater treatment; as well as sludge treatment. Industrial wastewater treatment is considered negligible. 7.2 ESTIMATION OF GHG EMISSIONS The results are presented in Table 7.1 and Figures 7.1 and 7.2. The GHG emissions from the waste sector totalled 6,857 Gg CO2 eq, of which 92% of emissions were due to solid waste disposal in the landfills, and 8% were due to wastewater handling and treatment. The dominant emission was CH4. In the overall inventory, the contribution of the waste sector was about 6.9% of the total GHG emissions. Table 7.1: GHG Emissions Associated with the Waste Sector Greenhouse gas source and sink categories Waste Total
Total GHG CO2 emissions emissions (Gg CO2 (Gg) eq) 6,856.90
A. Solid waste disposal on land B. Wastewater handling
CH4 (Gg)
N2O N2O (Gg) (Gg CO2 eq)
CH4 (Gg CO2 eq)
323.56 6,794.75
6,318.57
300.88
6,318.57
538.34
22.68
476.18
0.20
62.15
0.00
0.00
Fig. 7.1: Subsectoral Share of Waste GHG Emissions Solid Waste Disposal 7.9%
Wastewater Treatment
0.00
0.00
CO (Gg)
0.00
0.20
62.15
0.00
0.00
NMVOCs SOx (Gg) (Gg)
0.00
0.00
0.00
0.00
B. Waste incineration D. Other (please specify)
NOx (Gg)
0.00
0.00
0.00
0.00
0.00
0.00
0.00
0.00
0.00
0.00
0.00
Fig. 7.2: GHG Emissions from Waste N 2O CH 4
Gg CO 2 eq 7,000.00 6,000.00 5,000.00 4,000.00 3,000.00 2,000.00
92.1%
1,000.00 0.00 Wastewater handling
Solid waste disposal on land
4. Municipal Solid Waste (MSW) includes household waste, yard/garden waste, commercial/market waste and organic industrial solid waste. MSW should not include inorganic industrial waste such as construction or demolition materials.
17
8. OVERALL GHG INVENTORY RESULTS 8.1 TOTAL GHG EMISSIONS In Abu Dhabi Emirate, the total GHG emissions were 99,101 Gg CO2 eq, which includes 71,924 Gg CO2 eq from energy; 17,907 Gg CO2 eq from industrial processes; 2,413 Gg CO2 eq from agriculture, and 6,857 Gg CO2 eq from waste. CO2 sequestration by the forestry and land use sector amounted to 4,609 Gg. Net GHG emissions are estimated at 94,491 Gg CO2 eq. The sectoral direct GHG emissions in Abu Dhabi Emirate are presented in Figure 8.1. Fig. 8.1: Sectoral direct GHG emissions in Abu Dhabi Emirate 80,000
71,924
70,000 60,000 50,000 40,000 30,000 17,907
20,000 10,000
6,857 2,413
-4,609
0 -10,000 Waste
Land-use Change & Forestry
Agriculture
Industrial Processes
Energy
Figure 8.2 presents the share of inventory sectors in the total GHG emissions. Energy-related activities accounted for the dominant portion of the emissions; about 72.6% of all emissions are associated with the combustion of fossil fuels and the release of fugitive emissions from oil and gas operations. Industrial processes accounted for 18.1% of all emissions, followed by waste with 6.9% and agriculture with 2.4% of total emissions. Approximately 4.7% of the total emissions were sequestered by the extensive system of hardwood tree plantations throughout the Emirate. Fig. 8.2: Share of Inventory Sectors in the Total GHG Emissions Energy
2.4%
Waste
6.9%
Agriculture Industrial Processes
18.1%
72.6%
18
19
A breakdown of the total direct GHG emissions by gas is illustrated in Figure 8.3. The main emission was CO2, constituting about 78.6% of the total GHG emissions, followed by CH4 with 8.8%, PFCs emissions from production of primary aluminum with 7.6%, and N2O constituting 5% of the total GHG emissions. Emissions from hydrofluorocarbons (HFCs) and sulphur hexafluoride (SF6) were negligible as the products containing these gases are not produced in the Emirate. Fig. 8.3: Total Direct GHG Emissions by Gas 80.0%
78.6%
70.0% 60.0% 50.0% 40.0% 30.0% 20.0% 10.0%
8.8%
7.6%
5.0%
0.00% PFCs
N 2O
CO2
CH 4
Gas
CO2
CH4
N2O
PFCs
Contribution in GHG
78.6%
8.8%
5.0%
7.6%
77,907.12
413.92
16.00
1.16
Amount of emission (Gg)
The total indirect GHG emissions from all inventory sectors in Abu Dhabi Emirate are presented in Figure 8.4.
Fig. 8.4: Total Indirect GHG Emissions by Gas 900,00 800,00 700,00 600,00 500,00 400,00 300,00 200,00 100,00 0,00
NOx (Gg)
CO (Gg)
NMVOCs (Gg)
SOx(Gg)
20
Within the energy sector, as highlighted in Figures 8.5 and 8.6, energy industries activities (electricity production combined with water desalination, oil/gas extraction and oil refining) were the main sources of combustion and fugitive emissions, contributing to about 67% of the energy sector emissions or 48,045 Gg CO2 eq.Transport was the second energy subsector, responsible for 26% of GHG emissions or 18,547 Gg CO2 eq, followed by manufacturing industries and construction with 7% or 4,821 Gg CO2 eq.The contribution of ‘others’ energy subsector (residential/commercial, agriculture, etc.) was very small, at less than 1% of the energy emissions.
Fig. 8.5: Subsectoral Share of Energy GHG Emissions Energy Industries
0.7%
Transport Manufacturing Industries & Construction Others (Res, Com, Agr, Fish)
25.8% 66.8% 6.7%
Fig. 8.6: Direct GHG Emission from Energy Activities (Gg CO2 Eq)
60,000 48,045
50,000 40,000 30,000 18,547
20,000 10,000
510
4,821
0
Others (Res, Com, Agr, Fish)
Transport
Manufacturing Industries & Construction
Energy Industries
Details of the GHG emissions by subsector and activity and by gas are presented and discussed in Chapters 3 to 7.
8.2 KEY CATEGORY SOURCES AND EMISSIONS A key category analysis was performed to identify the key sources of emissions that are responsible for 95% of the total GHG emissions. This allows identification of those emission categories that require particular attention – because the category contributes a large share to the total national emissions or because it has a significant influence on the trend in national emissions relative to a chosen reference year. Table 8.1 and Figure 8.7 present the key sources of emissions that were responsible for 95% of the total GHG emissions in Abu Dhabi Emirate in year 2010.
21
Table 8.1: List of the Key Sources and GHG Emissions in Abu Dhabi Emirate, 2010 Geographic Area/Country Inventory Year IPCC Source Category
Abu Dhabi Emirate/UAE 2010
Key Category Sectors* Emission Level Applicable Estimate Cumulative Assessment Greenhouse (current year, level excl. excl. Gas non-LULUCF) LULUCF (%) LULUCF (%) (Gg CO2 eq)
Source Categories to be Assessed in Key Source Category Analysis
Sector
1.A.1
Energy
CO2 Emissions from Stationary Combustion
1.A.3
Energy
CO2 Mobile Combustion: Road Vehicles
2.C
Industrial Processes PFC Emissions from Aluminium Production
2.C
Industrial Processes CO2 Emissions from the Iron and Steel Industry
1.A.3
Energy
6.A
Waste
1.A.2
Energy
1.A.1
Energy
N2O (Non-CO2) Emissions from Stationary Combustion
2.A
Industrial Processes CO2 Emissions from Cement Production
4.D
Agriculture
CO2
43,916.9
44.3%
44.3%
CO2
11,549.4
11.7%
56.0%
PFCs
7,507.5
7.6%
63.6%
CO2
7,376.0
7.4%
71.0%
CO2
6,735.4
6.8%
77.8%
CH4 Emissions from Solid Waste Disposal Sites
CH4
6,318.6
6.4%
84.2%
CO2 Emissions from Manufacturing Industries and Construction
CO2
4,794.6
4.8%
89.0%
N2O
2,933.7
3.0%
92.0%
CO2
1,866.4
1.9%
93.9%
N2O
1,728.1
1.7%
95.6%
CO2 Mobile Combustion: Aircraft
N2O (Direct and Indirect) Emissions from Agricultural Soils
* Key Category Sectors are the sectors responsible for 95% of the total GHG emissions. [Sum of GHG emissions from all activity sectors = 99.101 Gg CO2 eq.]
Fig. 8.7: Key Sources and Key GHG Emissions in Abu Dhabi Emirate, 2010
50.0% 44.3%
45.0% 40.0% 35.0%
TON CO 2/CAP
30.0% 25.0% 20.0% 15.0% 6.8%
10.0% 3.0%
5.0% 1.7%
4.8%
7.4%
7.6%
11.7%
6.4%
1.9%
0.0%
t s s s y n n es on on str raf tio tio ion icle trie Sit sti sti irc uc uc du iss us eh al bu bu d d A n d V I s m o o : n l o m m r I E n d e Pr sp Co Co tP tio oa ng ct) Ste Di us en ry um :R uri ire ary nd ini na ste on em mb fat nd a i on o I a i i t m o C u t t n C d us W an m Alu Iro Sta Sta an ile M lid mb fro m ct ob So the Co fro rom rom ns om M ire f f r o e s i m m l f 2 i D s s ( s ro ro iss ion ob on on CO O on sf sf iss M ssi ssi Em ssi N2 on on 2 mi mi Em O2 mi ssi ssi E i i C C0 E )2 E C 2 2 Em PF Em O CO 4 2 CO -C CO CH on (N O N2
It is obvious that CO2 emissions from stationary combustion are the major emissions in Abu Dhabi Emirate that can affect global warming, and were responsible for 44.3% of the total GHG emissions in 2010. The next major emissions were CO2 from road transport with about 11.7%, followed by PFCs from aluminium production with 7.6%, and CO2 emissions from the iron and steel industry with around 7.4% of the total GHG emissions in the Emirate.
22
8.3 KEY EMISSIONS INDICATORS Table 8.2 presents the main GHG and CO2 emissions indicators for Abu Dhabi Emirate in 2010. The total GHG and CO2 emissions per capita was about 48.5 and 38.1 ton CO2 eq, respectively, while the CO2 emissions per capita from fuel combustion activities was 33 ton CO2 eq (compared with 32 ton CO2 eq/capita for the UAE in 2009, IEA 2011). A comparison of per capita CO2 emissions from fuel combustion in some selected countries, including the UAE and Abu Dhabi Emirate, is presented in Figure 8.8. The ratio of CO2 emissions to GDP in the Emirate of Abu Dhabi in the year 2010 was 0.5 kg CO2 /USD. For the UAE, this ratio was 0.85 kg CO2 /USD in 2006.5 Table 8.2: GHG/CO2 Emission Indicators for Abu Dhabi Emirate in 2010 GHG and CO2 Emissions per Capita, per GDP and per kWh Electricity in Abu Dhabi Emirate, 2010
Sector
Energy
Industrial Processes
Agriculture
Land-use Change & Forestry
Waste
GHG Emissions (Gg CO2 eq)
71,924
17,907
2,413
-4,609
6,857
99,101
94,491
CO2 Emissions (Gg)
67,540
10,367
0
-4,609
0
77,907
73,298
GHG Emissions per capita (ton CO2 eq)
47.62
45.4
CO2 Emissions per capita (ton CO2)
37.44
35.2
CO2 Emissions from Fuel Combustion per capita (ton CO2/ cap)
32.46
-
CO2 Emissions from Fuel Combustion per GDP (kg CO2/ US$)
0.40
-
CO2 Emissions per GDP (kg CO2/ US$)
0.46
-
GHG emission factor for combined electricity & water desalination (kg CO2-eq/ kwh)
0.74
-
GHG emission factor attributed to electricity production (kg CO2-eq/ kwh)
0.51
-
GHG emission factor attributed to water desalination (kg CO2-eq/ cu meter)
13.76
CO2 emission factor for combined electricity & water desalination (kg CO2/ kwh)
0.69
-
CO2 emission factor attributed to electricity production (kg CO2/ kwh)
0.47
-
CO2 emission factor attributed to water desalination (kg CO2/ cu meter)
12.79
-
Net Overall Emissions Emission
Considering the total population of Abu Dhabi Emirate by end of 2010 as 2,080,954 [SCAD estimation, March 2013] Gross domestic product by economic activities in 2010 (620.3 Billion Dirham ~ 168.87 Bill US$), [SCAD statistics yearbook 2011] Total water production from all power plants in Abu Dhab in 2010 was 695 million cubic meter Total electricity production by ADWEA and IWPPs plants in 2010 was 41712 GWh Average fuel allocation factor to water desalination 31%
A comparison of CO2 emissions from fuel combustion per GDP and per kWh electricity produced in some selected countries, including UAE and Abu Dhabi Emirate, is presented in Figure 8.8. Fig. 8.8: CO2 emissions from fuel combustion per GDP and per kWh electricity in selected countries, (IEA Statistics 2012)
5. IEA 2008: List of countries by ratio of GDP to carbon dioxide emissions, based on data for 2006 (for the UAE, CO2:139,553 Ktonn, GDP:164.17 Billion USD).
23
9. CHALLENGES As presented in the individual inventory sectors, there are data gaps and clarifications that should be resolved for a few subsectors. There is also a lack of significant information on the aggregated fuel statistics (production, import, export, international bunkers and stock change), which needs to be addressed in the next inventory cycle. Any uncertainties associated with the inventory results need to be assessed. To summarise, the key challenges that remain as we look back on the project include: o The quality of available data; o The lack of data in some subsectors; o The need for appropriate emission factors; o Uncertainties in the data; o Cooperation from some entities.
10. RECOMMENDATIONS The following recommendations should be considered for the next inventory cycle: 1. Track GHG emissions consistently. In order to improve the reliability, scope, and quality of acquired data, all concerned entities should start tracking their emissions according to quality standards and reporting procedures established by EAD. 2. Develop targeted GHG development training programmes. Ongoing training of individuals throughout the Abu Dhabi emirate who are responsible for data collection or compilation within their respective organisations is essential. Targeted training refers to in-depth, sector or entity-specific programmes that are designed to be responsive to the unique features and challenges encountered by the inventory development process. 3. Promote the development of GHG inventory partnerships. This would involve supporting the establishment of GHG inventory units within the various entities throughout the Abu Dhabi emirate that report emissions, but especially within major emitting sources such as energy activities. The current teams that built the first inventory should be expanded and strengthened to form the units. Also, each GHG inventory unit should be encouraged to develop an internal corporate GHG management programme to document changes in relevant technologies, equipment, and processes, thereby enhancing their own efforts regarding spreadsheet configuration, data entry, updating, and documentation. 4. Carry out analysis to improve data and reduce uncertainties. Any uncertainties associated with the inventory results, as well as the overall robustness of the inventory, should be comprehensively assessed. It is recommended that the inventory results be validated by comparing the bottom-up and the top-down approaches. 5. Consider the use of alternative GHG inventory methodologies. While the IPCC’s revised 1996 guidelines is the standard methodological approach at the national level, it is important to note that it need not represent a limiting factor in the development of an emirate-level GHG inventory. There are several other methodologies and/or protocols that have been developed since the 1996 guidelines that offer significant verifiability, credibility, completeness, disaggregation and other advantages. For example, there is the Greenhouse Gas Protocol (GHG Protocol) developed by the partnership between the World Resources Institute and the World Business Council for Sustainable Development. There is also the American Petroleum Institute’s (API) Compendium of Emissions Estimating Methodologies for the Oil and Gas Industry. Since the Abu Dhabi GHG inventory is a voluntary initiative, the process could be more effectively tailored to meet the needs of emirate-specific climate change policy development needs through the use of one or more of these more sophisticated methodological approaches. 6. Develop relevant emission factors. The stakeholders should establish a team to develop emission factors that are specific and relevant to UAE, which would then be proposed to the relevant national authorities for endorsement. 24
STAKEHOLDERS 1.
Ministry of Environment and Water
2.
Ministry of Energy
3.
Ministry of Foreign Affairs (Directorate of Energy and Climate Change)
4.
Supreme Petroleum Council / Abu Dhabi National Oil Company (ADNOC)
5.
Abu Dhabi Water and Electricity Authority
6.
MASDAR
7.
Statistics Centre - Abu Dhabi
8.
Department of Transport
9.
Centre of Waste Management - Abu Dhabi
10.
Abu Dhabi Ports Company
11.
Abu Dhabi Food Control Authority
12.
Al Ain Municipality
13.
Western Region Municipality
14.
Abu Dhabi Municipality
15.
Urban Planning Council - Abu Dhabi
CO2 eq )
16.
Regulation and Supervision Bureau
17.
Abu Dhabi Sewerage Services Company
18.
Higher Corporation for Specialised Economic Zones (ZonesCorp)
25