Last Revised by Juan Arias 2012
1
Graphing Tips for Microsoft Excel 2010 PC A note before you begin: Make certain the program with which you are working is in fact Microsoft Excel 2010. If it is not, these instructions will be of little use to you when you begin to create your graphs. Goals of this worksheet: Create a simple bar graph Create a simple line graph Practice APA style for figures In APA style, Tables and Figures are often referenced. Tables generally display numerical data in ordered sets of rows and columns. Figures generally encompass everything else: graphs, charts, drawings, photographs, etc. This worksheet deals specifically with creating figures. I.
Create & Edit Figure 1: BAR GRAPH
When to use a bar graph: Bar graphs should be used to compare groups and/or nominal data. It is customary in APA style to create bar graphs representative of the averages of data. IF your data are not already expressed as a mean (average), it is simple to calculate the mean in Excel: 1. Select cell in which you would like the mean to appear 2. Select the function symbol at top of screen and scroll down to average
3. Define the ranges of cells for which you want the average calculated, delineated by a colon (i.e., A2:A11) click [OK] Excel Shortcut: 1. Alternatively, you can select the cell in which you would like the mean to appear 2. Type the equals sign (=), then begin typing the function you want to perform, e.g., “=AVERAGE” (You can then double-click AVERAGE from the options given). 3. Use your mouse to highlight the range of numbers of which you wish to take the average. 4. Hit Enter to automatically process the function and create the average value.
2
Once your data appear as you wish them to, you can begin creating a default bar graph. Highlight the data AND labels you wish to present in your figure Select Insert tab > Charts section > Column menu > 2-D Column > Clustered Column (first 2D option) (NOTE: In Excel, a vertical bar graph is titled a column chart. Do not go to the “Bar Chart” section of the Insert Charts tab, or you will make things harder on yourself!)
EDITING TIP Perhaps the most important graph-editing skill you can learn is to use “Context Specific Menus” also called “Quick Menus.” These are the menu options that appear when you doubleclick or right-click on a particular part of the graph. Not all of the menu options are available in the quick menus but for those that are available, the quick menu is much faster than using the menus at top. FIGURE CAPTIONS APA figures, unlike those you see in other format styles, do not include titles above the image. Instead, APA style uses Figure Captions below the figure. Figure Captions include the figure number (which is italicized), a brief descriptive phrase (which substitutes for a title), and any brief explanation necessary for understanding the figure. Figure Captions are easiest to make in your Word Processor once you have already pasted your figure into your document.
3
However, if you ever need to create a non-APA style title at the top of a graph in another context: Chart Tools Layout tab > Labels section > Chart Title menu > select Above Chart Create a left-aligned caption for this graph below the figure itself in Microsoft Word after you have copied and pasted the graph from Excel to Word.
GRIDLINES As a rule, APA style does not recommend gridlines that extend across the graph Left-click on any gridline and press [delete]
LEGEND In APA style, the legend for a graph is represented within the area of the axes of the graph. To move the legend, you may simply click the image and drag it to where you want it to go. Often a legend is unnecessary and can be deleted: Left-click on the legend and press [delete].
4
DATA (BAR) FORMATTING APA style recommends “omitting visually distracting detail” in favor of a simple, clear presentation. The graph is not meant to be visually stunning – it’s meant to communicate information. This usually means 2-D images with simple line styles and very little color. To format multiple bars simultaneously: Left-click graph background > Right-click any bar > Format Data Series*.
*The “Series Options” menu (first menu in the Format Data Series window) is not necessary for this graph, but is useful when the primary x-axis categories are further divided in subgroups.
To format each bar individually: Left click bar (highlights all columns) > Left click again (highlights one column) > Right click > Format Data Point. Once in this screen: Border Color tab > Solid line = Black. Border Style tab > Width = (0.75 to 2 pt recommended). Fill tab > Solid fill > Select color from menu (blacks and greys only) NOTE: You can also design the chart to have only grey tones by choosing the Design tab (under Chart Tools when chart is selected) and selecting the grey graph.
5
BACKGROUND AREA Make the background color white and DO NOT use a border around either the Chart or Plot area. Right-click outer border of chart > Format Chart Area Fill tab = Auto (which is usually white) or Solid fill = white. Border Color tab > No line Repeat this process with the Plot Area, if necessary (by right-clicking plot background).
6
AXIS LABELING APA style uses labels on both the x- and y- axes. (With our source data, Excel created scaling, but not labels, for both axes—rating number for the y-axis and category for the x-axis). To add a Vertical (Y-Axis) label: Chart Tools > Layout tab > Labels section > Axis Titles > Primary Vertical Axis Title > Rotated Title
For the Horizontal (X-Axis): Chart Tools > Layout tab > Labels section > Axis Titles > Primary Horizontal Axis Title > Title Below Axis
Type an appropriate label for each axis into the label boxes that appeared.
7
AXIS SCALING You want to be sure to scale your axes so they encompass all of your data points. Set your units (and tick marks) to be detailed enough to provide good visual landmarks, but not so detailed as to add distracting lines to your axes. Right-click the y-axis and choose Format axis. Or from the menus... Chart Tools > Layout tab (Axes section) > Axes menu > Primary vertical axis > More Primary Vertical Axis Options. Axis Options tab > set Minimum to Fixed = 1, Maximum Fixed = 5, Major unit Fixed = 1, Major tick mark type = outside. Number tab > set Decimal places = 1. Click [Close].
FONT AND POINT SIZE APA style recommends Arial font, with point sizes between 8 and 14 points, and having largest and smallest text differing by no more than 4 points. Note: these sizes are for a written paper – sizes for other presentation formats (e.g., PowerPoint or Posters) can vary from this. To set font and point size, first select the item to size then use: Home tab > Font section > Font and Point size options. Set the font/size for both axes and labels. You can now cut and paste your image into your word document. Remember to add a Figure Caption below your image!!
8
II.
Create and Edit Figure 2: LINE GRAPH
When to use a line-graph: Line graphs are typically used to show changes over time or other forms of continuous change. In APA style, bar graphs are most typical when the x-axis variable is categorical, while line graphs are typically used when the x-axis variable is continuous (e.g., over time). Highlight the data and labels you wish to use. Select Insert tab > Charts section > Line menu > 2-D Line > Line with Markers
GRIDLINES Left-click on any gridline and press [delete]. LEGEND If a legend is required, move it to within the graph. If a legend is not required, leftclick on the legend and press [delete]. Or set Legend to “none” in Chart Tools > Layouts tab > Labels > Legend > None AXIS LABELING Chart Tools > Layout tab > Labels section > Axis Titles > Primary Vertical Axis Title > Rotated Title Chart Tools > Layout tab > Labels section > Axis Titles > Primary Horizontal Axis Title > Title below axis Type an appropriate label for each axis into the label boxes that appeared. FONT AND POINT SIZE Home tab > Font section > Font and Point size options. Set the font/size for both axes and labels.
9
AXIS SCALING Right-click the y-axis and choose Format axis. Or from the menus... Chart Tools > Layout tab > Axes section > Axes menu > Primary Vertical Axis > More Primary Vertical Axis Options Axis Options tab > set minimum, maximum, & major unit Fixed to appropriate numbers. Set major tick = outside. Number tab > set decimal to appropriate number. Then click [OK]. DATA FORMATTING Instead of editing the fill color and outline as we did for the bars in the bar graph, for the line graph we can edit the marker and line. Generally, you want the line to be relatively thin and the markers to be large enough to be distinct, but no larger; too large and the marker becomes imprecise, covering too much area. Right-click line > Format Data Series Marker Fill tab > Solid fill > Select color from menu Line Color tab > Solid line > Select color from menu
BACKGROUND AREA Right-click outer border of chart > Format Chart Area Fill tab = Auto (which is usually white) or Solid = white. Border Color tab > No line Repeat this procedure with the Plot Area selected, if necessary You can then cut and paste your image into your word document. Remember to add a Figure Caption below your image!!
10
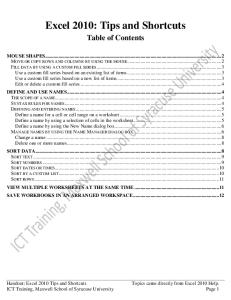
Example of an APA Style Bar Graph in Completion:
Average Liking Rating
5.0
4.0
3.0
2.0
1.0 Computer
Internet
CellPhone
Word
Excel
Type of Technology Figure 1. Average preference ratings for different technology types.
APA Figures Checklist: Do each of your figures have… 1. A solitary spot on its own page, after the References and Tables sections? 2. Correctly graphed data? (Bar vs. Line graph? Black or grey points only? White background, no border?) 3. An appropriately scaled and labeled X-Axis? 4. An appropriately scaled and labeled Y-Axis? 5. A Figure Caption below the figure (including italicized figure number and a description)? 6. And nothing else? …Good.