ORIGINAL RESEARCH
n MUSCULOSKELETAL IMAGING
Note: This copy is for your personal, non-commercial use only. To order presentation-ready copies for distribution to your colleagues or clients, contact us at www.rsna.org/rsnarights.
Identification of Intraarticular and Periarticular Uric Acid Crystals with Dual-Energy CT: Initial Evaluation1 Katrina N. Glazebrook, MD Luis S. Guimarães, MD Naveen S. Murthy, MD David F. Black, MD Tim Bongartz, MD Nisha J. Manek, MD Shuai Leng, PhD Joel G. Fletcher, MD Cynthia H. McCollough, PhD
Purpose:
To estimate the accuracy, sensitivity, specificity, and interobserver agreement of dual-energy computed tomography (CT) in detection of uric acid crystals in joints or periarticular structures in patients with arthralgia and patients suspected of having gout, with joint aspiration results as reference standard.
Materials and Methods:
With institutional review board approval, patient consent, and HIPAA compliance, 94 patients (age range, 29–89 years) underwent dual-source, dual-energy (80 and 140 kVp) CT of a painful joint. A material decomposition algorithm was used to identify uric acid. Two blinded musculoskeletal radiologists evaluated the dual-energy CT images and classified the examination findings as positive or negative for the presence of uric acid crystals. Reference standard was the result of joint aspiration.
Results:
Forty-three of 94 patients (46%) underwent attempted joint aspiration within 1 month of dual-energy CT. Aspiration was successful in 31 of 43 patients (72%). In 12 of 31 patients (39%), uric acid crystals were identified at joint aspiration; in 19 patients, they were not. Readers 1 and 2 had no false-negative findings for uric acid at dual-energy CT. Sensitivity was 100% (12 of 12; 95% confidence interval (CI): 74%, 100%) for both readers. Specificity was 89% (17 of 19; 95% CI: 67%, 99% ) for reader 1 and 79% (15 of 19; 95% CI: 54%, 94%) for reader 2, with nearperfect agreement between the readers (k = 0.87; range, 0.70–1.00) in the 31 patients who underwent aspiration.
Conclusion:
Initial retrospective assessment suggests that dual-energy CT is a sensitive, noninvasive, and reproducible method for identifying uric acid deposits in joints and periarticular soft tissues in patients suspected of having gout. q
RSNA, 2011
1
From the Departments of Radiology (K.N.G., L.S.G., N.S.M., D.F.B., S.L., J.G.F., C.H.M.) and Rheumatology (T.B., N.M.), Mayo Clinic, 200 First St SW, Rochester, MN 55905. Received December 20, 2010; revision requested February 21, 2011; final revision received July 6; accepted July 12; final version accepted July 13. Address correspondence to C.H.M. (e-mail:
[email protected]). q
RSNA, 2011
516
radiology.rsna.org
n
Radiology: Volume 261: Number 2—November 2011
MUSCULOSKELETAL IMAGING: Intraarticular and Periarticular Uric Acid Crystals at CT
G
out is the most common inflammatory arthritis among men older than 40 years of age (1). In the past few decades, gout has approximately doubled in prevalence in the United States (2–4), with clinical presentations becoming increasingly complex, owing to iatrogenic factors, multiple comorbidities, and advanced age (5,6). Such unconventional presentations can lead to erroneous diagnoses and delays in treatment (6). Prompt diagnosis and early treatment of gout plays a major role in preventing eventual functional impairment and reduction in comorbidities, such as cardiovascular and renal disease associated with hyperuricemia (2,6). The most important determinant of therapeutic success in acute gout is how soon therapy is initiated (7). Unfortunately, the traditional available methods to diagnose gout have substantial limitations. Demonstration of uric acid crystals within joint fluid remains the current reference standard, but synovial fluid aspiration may not reveal uric acid crystals in up to 25% of patients who have acute disease (8), and laboratory accuracy for detection of uric acid crystals varies considerably (9,10). Consequently, clinicians often base the diagnosis on secondary criteria such as hyperuricemia, response to treatment, radiologic changes, or a typical natural history (9). However, the diagnostic accuracy of these noninvasive methods is limited. For example, up to 42% of patients with gout have normal serum urate levels before treatment, and hyperuricemia may be present in patients without gout (11). Alterations of bone on radiographs typically occur only years into the illness, and even then, only 45% of patients have radiographic findings (12,13). Thus, noninvasive tech-
niques to accurately diagnose uric acid crystals within joints would be helpful to identify gout in patients with atypical inflammatory arthropathies and rule out gout as a diagnostic possibility in others. Dual-energy computed tomography (CT) has recently been shown to reliably help identify uric acid kidney stones by exploiting the photon energy–dependent attenuation of different materials (14,15). By analyzing the difference in attenuation observed in a material exposed to two different x-ray spectra simultaneously, the composition of materials can be determined (16). We hypothesized that the same technique could be used to identify uric acid crystals in the joints or in the periarticular structures. Previous articles have described the utility of dualenergy CT in the evaluation of gout in the extremities in patients with known gout or in those suspected of having gout (17–19). In a small series of five cases (18), the diagnosis of gout was confirmed with joint aspiration in four patients. The purpose of the current study was to estimate the accuracy, sensitivity, specificity, and interobserver agreement of dual-energy CT in demonstrating the presence of uric acid crystals in joints or periarticular structures in patients with arthralgia and patients suspected of having gout, with joint aspiration results as the reference standard.
Materials and Methods Patients and Scanning Technique The institutional review board of our institution approved this Health Insurance Portability and Accountability Act– compliant, retrospective study, conducted from data in institutional patient databases and archives. Implication for Patient Care
Advance in Knowledge n Unenhanced, low-dose dualenergy CT can add information to joint fluid aspiration in patients suspected of having gout by aiding identification of uric acid deposition within joints and periarticular soft tissues. Radiology: Volume 261: Number 2—November 2011
n
n Dual-energy CT can help confirm results from joint fluid aspiration or potentially replace joint fluid aspiration in some patients with an acutely inflamed joint by aiding identification of uric acid deposition within joints and periarticular soft tissues.
radiology.rsna.org
Glazebrook et al
Patient inclusion criteria for this study were as follows: (a) signed consent from the patient to use past medical data for research purposes, (b) clinical suspicion of the presence of monosodium urate crystals in the examined joint by the rheumatologist or orthopedic surgeon caring for the patient, (c) clinical ordering of dual-energy CT examination for clinical purposes to rule in or exclude uric acid crystals in the most affected joint or joints, and (d) dual-energy CT examination of the painful joint performed with our gout protocol between April 2008 and February 2010. During the aforementioned time frame, 148 consecutive patients underwent 154 articular dual-energy CT examinations. Dual-energy CT for the identification of gout is a Food and Drug Administration–approved technique and was offered to the referring clinicians as a diagnostic imaging option for potential gout patients. Given the challenging presentation of many patients with arthralgia, clinicians referred patients for dual-energy CT who had atypical presentations whose differential diagnoses included inflammatory seronegative arthropathies, rheumatoid arthritis, gout, calcium pyrophosphate disease arthropathy, degenerative arthritis, and carpal tunnel syndrome. For each dual-energy CT examination, the most symptomatic joints were evaluated with dual-energy CT. Fifty-three patients were excluded
Published online before print 10.1148/radiol.11102485 Content code: Radiology 2011; 261:516–524 Abbreviation: CI = confidence interval Author contributions: Guarantors of integrity of entire study, K.N.G., N.M., C.H.M.; study concepts/study design or data acquisition or data analysis/interpretation, all authors; manuscript drafting or manuscript revision for important intellectual content, all authors; approval of final version of submitted manuscript, all authors; literature research, K.N.G., L.S.G., D.F.B., C.H.M.; clinical studies, L.S.G., N.S.M., D.F.B., T.B., S.L., C.H.M.; experimental studies, K.N.G., S.L., J.G.F.; statistical analysis, L.S.G., J.G.F.; and manuscript editing, K.N.G., L.S.G., N.S.M., T.B., N.M., J.G.F., C.H.M. Potential conflicts of interest are listed at the end of this article.
517
MUSCULOSKELETAL IMAGING: Intraarticular and Periarticular Uric Acid Crystals at CT
because they had enrolled in a different study (a prospective trial), and one patient was excluded because he did not consent to having his past medical data used for research purposes, leaving 94 patients (age range, 29–89 years). One hundred forty-four dual-energy CT scans were obtained in these 94 patients (two joints were examined in 21 patients, three joints were examined in two patients, and one patient underwent two examinations 8 months apart). The latter patient’s data has been previously published in a case report (19). No other data have been published. Selected CT examinations were performed by using a dual-source CT scanner operating in dual-energy mode (Table 1). The first 53 patients were examined with the first-generation scanner (Somatom Definition DS; Siemens Healthcare, Forchheim, Germany) by using tube potentials of 80 kV (tube B) and 140 kV (tube A). The remaining 41 patients were examined with the second-generation scanner (Somatom Definition Flash; Siemens Healthcare). To increase the separation of the two x-ray spectra, the second-generation system allows the use of a tin filter in the high-energy beam (20,21); thus, scanning was performed by using 140 kV and additional tin filtration on the B tube and 80 kV on the A tube. Extremities were scanned one at a time, if bilateral examinations were required. All scans were obtained without intravenous contrast material. Siemens Healthcare provided the CT scanner used in this work through a grant to Mayo Clinic. No authors are employees of Siemens Healthcare. Two authors (J.G.F. and C.H.M.) are Mayo Clinic employees and receive grant support from Siemens Healthcare but did not have access to study data prior to manuscript drafting. Two other authors (L.S.G. and K.N.G.) retained sole control of study data during the entire study. Only Mayo Clinic authors had access to and control of the data during preparation of this manuscript.
Material Differentiation Algorithm The reconstructed low- and high-energy images were analyzed by using a com518
Glazebrook et al
mercially available software tool (Gout, Syngo CT Workplace; Siemens Healthcare). The software employs a material decomposition algorithm to identify uric acid and calcium voxels according to their material-specific dual-energy behavior. The CT number in single-energy CT is determined by both the atomic number and mass density; hence, there is not a unique mapping of CT numbers to material composition, even with the use of calibration standards. Dual-energy CT overcomes this limitation by taking two particular measurements with which to determine the two particular properties of a material: atomic number and mass density. Soft-tissue portions of the image are segmented by using CT number threshold levels and material decomposition. The material decomposition analysis then assigns each of the remaining voxels to one of the two material classes (uric acid, calcium). For each voxel, the CT numbers in the low- and high-energy images represent the amount of x-ray attenuation that occurred within that voxel. The low- and high-energy CT numbers can be plotted with respect to one another to identify material composition (Figs 1, 2).
Image Analysis Two musculoskeletal radiologists (K.N.G. and N.S.M., with 14 and 3 years as attending musculoskeletal radiologists), blinded to patients’ clinical data, evaluated the images by using a commercially available workstation (Dual energy version, Syngo CT Workplace; Siemens Healthcare). Axial images, as well as images reconstructed in the sagittal and coronal planes, were reviewed. Volumerendered three-dimensional views were also produced, every 45° around the imaged joint. Readers were asked to classify the examination findings as positive or negative for the presence of monosodium urate crystals. They were also asked to grade the presence of artifacts according to a four-point scale that takes into consideration the influence of any artifacts on the diagnostic confidence (grade 1, no artifacts, high confidence in diagnostic capability; grade 2, presence of artifacts,
but no change in confidence; grade 3, presence of artifacts causing decreased confidence; grade 4, severe artifacts, nondiagnostic). In patients in whom more than one joint was scanned, a positive finding in any single joint was sufficient to consider the patient to have gout.
Reference Standard Assessment and Interobserver Agreement In the subset of patients who underwent successful joint aspiration, each reader’s conclusions were compared with the results of joint aspiration, which was performed within a month of dualenergy CT and served as the reference standard. Results of joint aspiration were considered positive when aspiration demonstrated uric acid crystals at polarized microscopic examination. Results were considered negative when no uric acid crystals were visualized. In these patients, serum uric acid levels were also recorded so that they could be associated with dual-energy CT and final clinical diagnosis in an effort to gauge potential incremental clinical benefit of dual-energy CT. Statistical Analysis Performance characteristics (accuracy, sensitivity, specificity) of dual-energy CT for detection of gout were calculated, along with exact 95% confidence intervals (CIs) (22). Interobserver agreement for the presence of uric acid crystals, as determined from the dual-energy postprocessed images, was calculated between readers according to the method of Landis and Koch (23), with a k value of 0–0.20 representing slight agreement, a k value of 0.21–0.40 representing fair agreement, a k value of 0.41–0.60 representing moderate agreement, a k value of 0.61–0.80 representing substantial agreement, and a k value of 0.81–1.00 representing near-perfect agreement. Descriptive statistics were used to relate correlations of dualenergy CT findings to uric acid levels in those patients who underwent successful joint aspiration. Descriptive statistics were also used to report artifact scores for each reader. Differences in artifact scores between gout cases and
radiology.rsna.org
n
Radiology: Volume 261: Number 2—November 2011
MUSCULOSKELETAL IMAGING: Intraarticular and Periarticular Uric Acid Crystals at CT
Table 1
Glazebrook et al
Figure 1
Parameters Used for Image Acquisition and Reconstruction with Both Generations of Dual-Source CT Equipment Used in Our Study Parameter Detector configuration (mm) Pitch Rotation time (sec) Automatic exposure control Quality reference (mAs) With 80-kV tube With 140-kV tube Kernels used for reconstruction Minimal collimation (mm) Reconstruction increment (mm) Composition ratio†
First-generation Unit
Second-generation Unit
64 3 0.6 0.7 1.0 On
40 3 0.6 1.2 1.0 On
340 80 B70f and D30f* 0.75 0.3 0.3
340 238 B70f and D30f* 0.6 0.3 0.4
* B70f and D30f are names used by the manufacturer. The D family of reconstruction kernels must be used for accurate dualenergy CT processing. D30f is a medium-sharp kernel. †
The attenuation in Hounsfield units on weighted-average images, HUw-av, was calculated during reconstruction by using the manufacturer’s default settings. The composition ratio used in patients examined with the first-generation scanner was 0.3, by using the following formula: HUw-av = 0.3 · HUl-kVp + 0.7 · HUh-kVp, where HUl-kVp is Hounsfield units on images with low peak kilovolts and HUh-kVp is Hounsfield units on images with high peak kilovolts. A composition ratio of 0.4 was used in patients examined with the second-generation scanner.
Figure 2
Figure 2: Images reformatted in the sagittal plane from an ankle dual-energy CT study. Left: Before utilization of the material decomposition algorithm. Besides several erosions in the distal tibia and talus, image reveals the presence of high density material in the intra-articular and periarticular soft tissues. Right: After utilization of the material decomposition algorithm, the high-density material in the intra-articular and periarticular tissues shows up green (which means that the algorithm classified those voxels as containing uric acid) and are consistent with tophaceous deposits.
nongout cases within each reader were evaluated by using the Wilcoxon rank sum test. All analyses were performed with software (SAS, version 9.2; SAS, Cary, NC). Radiology: Volume 261: Number 2—November 2011
n
Results During the catchment period, 94 patients underwent dual-energy CT and were not participating in the afore-
radiology.rsna.org
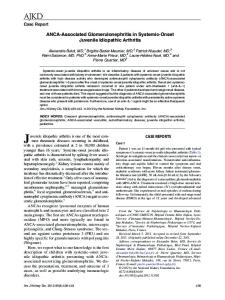
Figure 1: Simplified description of how the three-material decomposition material works. The x-axis of this coordinate system represents the Hounsfield unit value of a voxel at 140 kVp, while the y-axis represents the Hounsfield unit value of a voxel at 80 kVp. The addition of three points to this coordinate system (black circles), which represent the Hounsfield units of three idealized materials (soft tissue, monosodium urate, and calcium) at 80 and 140 kVp, allows the definition of a new coordinate system. If a data point is below the angle bisector (dotted line) dividing the angle between the calcium and uric acid line segments (dark gray circle), the algorithm will characterize such a voxel as uric acid (green color coding). If an unknown data point is above the angle bisector (light gray circle), the algorithm will characterize such a voxel as not being uric acid (purple color coding). (Adapted, with permission, from reference 14.)
mentioned prospective trial (mean age, 62.3 years; range, 29–89 years), which included 53 men (mean age, 62.7 years; range, 29–89 years) and 41 women (mean age, 63.5 years; range, 29–84 years). Forty-three of 94 patients (46%) underwent aspiration and joint fluid analysis within a month of CT, but in 12 of these patients (28%), the results of the procedure were not conclusive because of the presence of insufficient fluid for analysis (Fig 3). Of the 31 patients who underwent successful aspiration of the imaged joint within 1 month of dual-energy CT (mean age, 64 years; range, 39–89 years), 19 were men (mean age, 63 years; range, 39– 89 years) and 12 were women (mean age, 67 years; range, 45–84 years). In 12 of 31 patients (39%), uric acid was identified in the joint fluid, while in 19 patients (61%), it was not. Within 519
MUSCULOSKELETAL IMAGING: Intraarticular and Periarticular Uric Acid Crystals at CT
this cohort, 16 hands, 14 feet, and one knee were referred for dual-energy CT. Serum uric acid levels were available in 30 of 31 patients (Table 2). Of the patients with positive findings at joint aspiration, five had increased serum uric acid levels while seven had serum uric acid levels within normal limits. Of the patients with negative findings at joint aspiration, six had increased serum uric acid levels, while 12 had serum uric acid levels within normal limits (Table 2). Of the 12 patients with positive findings at joint aspiration, six were treated with steroids to reduce the inflammation and then were treated with urate-lowering therapies; six were treated solely with urate-lowering therapy. Clinical follow-up was available in eight of 12 patients after initiation of treatment, and all had substantial relief of joint pain and inflammation. The diagnostic performance of dualenergy CT for the identification of uric acid crystals and a diagnosis of gout was estimated on a per-patient basis in the 31 patients who underwent successful joint aspiration within 1 month of dual-energy CT. Both readers identified all patients with uric acid detected in their joint fluid. Sensitivity for both readers, along with their final consensus, was estimated to be 100% (12 of 12; 95% CI: 74%, 100%). In relation to specificity, reader 1 had two falsepositive results, whereas reader 2 had four false-positive results (two of them were the same false-positive results called by reader 1). Consequently, specificity was 89% (17/19; 95% CI: 67%, 99%) and 79% (15/19; 95% CI: 54%, 94%) for readers 1 and 2, respectively. Overall accuracy was 94% (95% CI: 79%, 99%) for reader 1 and 87% (95% CI: 70%, 96%) for reader 2. Positive predictive values were 86% (12 of 14; 95% CI: 57%, 98%) for reader 1 and 75% (12 of 16; 95% CI: 48%, 93%) for reader 2, while negative predictive values were 100% for both readers (17 of 17 for reader 1 [95% CI: 80%, 100%] and 15 of 15 for reader 2 [95% CI: 78%, 100%]) (Table 2). Serum uric acid levels (n = 30) were not associated with the final clinical impression (P = .68). The concordance 520
Glazebrook et al
Table 2 Summary of Joint Aspiration Results Compared with Dual-Energy CT Interpretations and Serum Uric Acid Levels A: Relationship between Joint Aspiration and Blinded Dual-Energy CT Results Reader
Sensitivity for Aspiration-positive Estimate (n = 12)*
Specificity for Aspirationnegative Estimate (n = 19)*
1 100 (74, 100) 89 (76, 100) 2 100 (74, 100) 79 (54, 94) Consensus 100 (74, 100) 89 (67, 99) B: Relationship between Joint Aspiration and Serum Uric Acid Levels Laboratory Value Mean Mean Serum uric acid 6.9 (2.2) 6.8 (1.8)‡ level† Patients with 42 (5/12) 33 (6/18) increased level (%)§
Accuracy forTotal Sample Estimate (n = 31)* 94 (79, 99) 87 (70, 96) 94 (79, 99) P Value .84 .64
* Data are percentages. Numbers in parentheses are 95% CIs. 95% CI = 95% exact (Clopper-Pearson) CI. †
The normal range for serum uric acid level in women is 2.7–6.1 mg/dL, and in men, it is 3.7–8.0 mg/dL. To convert to Système International units in micromoles per liter, multiply by 59.485. Numbers in parentheses are standard deviations.
‡
Value is based on 18 patients with aspiration-negative results.
§
Numbers in parentheses were used to calculate the percentages. Percentages were rounded.
Figure 3
Figure 3: Flowchart summarizes the inclusion of patients in the dual-energy CT (DECT) study, with subsequent reference standard joint aspiration test results.
index (c statistic, area under the receiver operating characteristic curve) for a logistic regression model configured with only serum uric acid level as a predictor was poor (c = 0.509);
however, the addition of dual-energy CT results to the regression model improved the concordance index to 0.98 (P , .001). Thus, the addition of dualenergy CT to the serum uric acid levels
radiology.rsna.org
n
Radiology: Volume 261: Number 2—November 2011
MUSCULOSKELETAL IMAGING: Intraarticular and Periarticular Uric Acid Crystals at CT
improved discrimination of patients with gout from patients without gout. In the subset of patients with aspiration results, there was near-perfect agreement between the two readers (k = 0.87; 95% CI: 0.70, 1.00). In two cases, the results were read as falsepositive by both readers. In one case, the dual-energy CT result was identified by both readers as positive for gout in the inferior patellar tendon. The initial clinical diagnosis was of inflammatory arthritis; however, the patient returned 3 months later with pain at the tibial tuberosity and a mildly swollen ankle. Aspiration results of the ankle joint were positive for uric acid crystals, so the diagnosis was changed to that of gout (Fig 4). In the second case with a falsepositive result, wrist aspiration results were negative; however, findings on the dual-energy CT scan were positive in the extensor carpi ulnaris tendon and within the wrist joint. The serum uric acid level was increased, and there was very high clinical suspicion for gout, so the final clinical impression was of gout. Both of these patients had clinical improvement following treatment for gout. In both of these cases of falsepositive results of examinations, clinicians agreed with the dual-energy CT results rather than with the negative findings at joint aspiration. If the specificity was recalculated, considering the final clinical impression in these two patients, the specificity would improve to 100% (17 of 17) for reader 1 and 88% (15 of 17) for reader 2. Two additional cases with falsepositive results were identified by reader 2. Both patients had serum uric acid levels within normal limits at the time of dualenergy CT. They underwent wrist and hand scanning, respectively, with negative metacarpal phalangeal joint aspiration results. At follow-up in 15 and 24 months, respectively, there was no clinical evidence of gout in either patient. In three patients, aspiration results were positive for calcium pyrophosphate crystals but negative for uric acid crystals. All three dual-energy CT scans showed purple coloration of calcium in the soft tissues, correlating with the calcium pyrophosphate deposition. Radiology: Volume 261: Number 2—November 2011
n
Only one patient underwent dualenergy CT twice, once before and once after medical treatment (in this case, 8 months apart). The second CT scan demonstrated marked reduction of the monosodium urate burden (19). This progress corresponded with dramatic improvement in clinical symptoms after treatment (Fig 5). Readers expressed different diagnostic confidence. For reader 1, the mean and standard deviation ratings for normal findings and gout were 1.3 and 0.6 and 1.6 and 0.5 (P = .11), whereas reader 2 reported scores of 1.2 and 0.4 and 1.8 and 0.4 (P , .01), respectively. Reader 2 expressed greater confidence levels in the studies with negative results. Reader 1 considered that there were artifacts interfering with diagnostic confidence in one patient (one of 31, 3%). Reader 2 never thought that the artifacts interfered with diagnostic confidence.
Discussion In the past few decades, gout has approximately doubled in prevalence in the United States (2,3). Currently, at least 3 million Americans are thought to have active gout, with a self-reported history of gout in up to 3 million more (1%–2% of adults) (4). This retrospective pilot study demonstrated that dual-energy CT can help identify uric acid crystals in patients who are suspected of having gout with a high degree of sensitivity and accuracy. Moreover, interobserver reproducibility was high, and uric acid crystals were often identified in periarticular tissues and tendons. Dual-energy CT also aided correct classification of three cases of calcium pyrophosphate deposition disease. Invasive needle aspiration and demonstration of uric acid crystals within joint fluid with polarizing microscopy remains the current standard of reference for the diagnosis of gout (24), but there is bias for patients in whom joint aspiration could be performed. This factor leads to potential underestimation of the specificity of dual-energy CT. In two patients in our study, results were incorrectly classified as false-positive;
radiology.rsna.org
Glazebrook et al
however, follow-up with clinical improvement after treatment and repeat positive aspiration results 3 months after dual-energy CT, respectively, showed that both patients likely had gout. In both cases, the uric acid crystals were not at the site of blinded joint aspiration. The clinicians agreed with the dualenergy CT results rather than with the negative joint aspiration results and initiated medical treatment. In addition, many physicians do not perform synovial fluid analysis, and therapy is often initiated with an assumed clinical impression. Frequently, clinicians base their diagnosis on secondary criteria like hyperuricemia, radiographic findings, response to treatment, or a typical natural history (9). However, diagnostic accuracy of these techniques may be limited, because up to 42% of patients with gout have serum uric acid levels within normal limits before treatment (11), hyperuricemia may be present in patients without gout, and radiographic alterations in bone typically occur only 6–12 years after symptom onset and, even then, only 45% of patients have radiographic findings (11,13). CT is the best modality to demonstrate radiographic changes in bone (25,26). Magnetic resonance imaging better demonstrates synovial involvement at an early phase of the disease (27), but its relative lack of specificity and the long examination time and high cost of the technique limit its role in routine clinical assessment of gout. In a retrospective study, ultrasonography has been suggested as a noninvasive and relatively specific means to diagnose gout (28).This technique has several advantages (lack of radiation, dynamic and multiplanar assessment, usefulness for procedures), but it has a small field of view and is operator dependent. Dalbeth et al (29) identified several methods of tophus assessment in clinical trials of chronic gout. While physical measurements were more feasible than advanced imaging methods, they do not allow for assessment of intra-articular or deep tophi. Dual-energy CT, with use of dedicated automated volume assessment software, can measure tophus 521
MUSCULOSKELETAL IMAGING: Intraarticular and Periarticular Uric Acid Crystals at CT
Figure 4
Figure 4: Serum uric acid levels in the normal range in a 54-year-old man with multiple episodes of oligoarthritis. Clinical impression is of inflammatory arthritis. Dual-energy CT shows areas of green pixelation consistent with uric acid deposition in the superior and inferior aspect of the patellar tendon. Patient was treated with methotrexate and prednisone. He returned 3 months later with pain over the tibial tuberosity at the patellar tendon insertion, and mild ankle joint swelling. Ankle joint aspiration results were positive for uric acid crystals; therefore, the diagnosis was changed to that of gout.
volumes in the extremities. Reduction of tophus volume following successful treatment can be documented with serial dual-energy CT scans (19). The results of our study suggest that dual-energy CT is a means to diagnose gout, with a capacity to improve diagnostic accuracy in patients suspected of having this disease. Artifacts rarely interfered with radiologists’ performance in our group. Artifacts were seen in the feet and ankles, with green pixels in the skin of the heel or calluses and in the nails, as these structures can have CT numbers that are increased because of high density but behave like soft tissue; nonetheless, such artifacts do not interfere with diagnostic interpretation as they are not periarticular in location. Other artifacts caused by adjacent metal fixation devices or patient motion also did not interfere with diagnostic confidence. 522
Glazebrook et al
Figure 5
Figure 5: Chronic tophaceous gout in a 54-year-old man. (a) Dual-energy CT scan obtained at the commencement of intensive urate-lowering treatment shows extensive uric acid deposition in the wrist and hand (green color mapping in this three-dimensional reconstruction of the right hand). The volume estimation of uric acid deposition was 11.27 cm3. (b) Dual-energy CT 8 months later, after treatment, shows substantial reduction in uric acid deposition within the right hand and wrist. The volume estimation of uric acid was 1.2 cm3, showing 91% reduction. This correlates very well with the clinical impression of marked reduction of soft-tissue swelling.
Tiny scattered green pixelation within tendons, particularly about the ankle, are thought to be artifactual or caused by image noise; however, more clumped areas of green pixelation within tendons may be the result of subclinical deposition of uric acid. It is recognized that uric acid crystals have been identified in asymptomatic joints in intercritical gout (8). Calcium pyrophosphate crystal deposition (proved in three cases with aspiration) did not cause artifact; scans in all three cases were negative for green pixelation for uric acid deposits but did show purple coloration of calcium. Choi et al (17) evaluated the performance of dual-energy CT for gout and achieved results similar to ours. In all 20 patients with gout (10 with aspiration–proved gout), color-coded urate deposits were identified, whereas no urate deposits were present in the
10 control patients with other forms of arthritis. Dual-energy CT depicted 440 areas of urate deposition in their 20 patients, compared with only 111 areas found at physical examination. Nicolaou et al (18) also found that dual-energy CT was a useful diagnostic tool in the treatment of gout. They concluded that the diagnosis or exclusion of gout in acute disease was helpful in their five clinically challenging cases in which patients presented to the emergency room. In the four cases with positive findings on dual-energy CT scans, despite normal serum uric acid levels in three cases, the diagnosis was confirmed with aspiration of uric acid crystals (18). One potential disadvantage of dualenergy CT might be the exposure of the patient to ionizing radiation. However, the mean effective dose in our study was less than 1 mSv. This is less than the
radiology.rsna.org
n
Radiology: Volume 261: Number 2—November 2011
MUSCULOSKELETAL IMAGING: Intraarticular and Periarticular Uric Acid Crystals at CT
average annual effective dose from naturally occurring radiation in the United States (ie, background radiation levels) and far less than 100–200 mSv, the values below which there is no convincing statistical evidence of increased risk of radiation-induced malignancy (30,31). Our study had some limitations, beginning with its retrospective design. On the basis of the accuracy noted in dual-energy CT evaluation of renal stones, the Food and Drug Administration– approved use of dual-energy CT for gout evaluation was offered to the clinicians, who found CT helpful in their assessment of a challenging group of patients with atypical presentations. There is therefore selection bias, on the part of the referring rheumatologists, in the type of patients who underwent dual-energy CT. In addition, only 31 of 94 patients underwent joint fluid aspiration that provided evaluable results. This subset may not be representative of all at-risk patients, so generalizability may be limited. Furthermore, the statistical precision (as measured by the CI width) is also limited because of the small sample size. Joint aspiration was not performed in 51 patients for a variety of reasons, the main one being reluctance on the part of both the patient and the clinician to place a needle into an acutely inflamed joint, which may appear as cellulitis. Also, the use of joint aspiration as the reference standard is flawed, as the false-negative rate may be as high as 25% in acute disease (8). This may have caused an artificial decrease in specificity in our study (by counting cases with potentially truepositive findings as false-positive cases). This emphasizes the potential complimentary role of dual-energy CT in determining the diagnosis of gouty arthropathy in acute disease. Finally, the minimum threshold concentration of uric acid crystals required for accurate and reliable diagnosis of gout by using dual-energy CT was not determined. In conclusion, dual-energy CT performs well in the detection of uric acid crystals in gout and can add information to joint fluid aspiration, possibly replacing this invasive procedure in some patients with an acutely inflamed Radiology: Volume 261: Number 2—November 2011
n
joint, and may provide a diagnostic imaging modality for patients who do not undergo joint aspiration. Dual-energy CT may be useful in establishing the extent of gout by identifying subclinical tophi and in identifying urate deposits in atypical anatomic sites for gout. Dualenergy CT may also be useful to monitor disease progression and response to treatment through serial measurements of individual tophus volume and total tophus burden. Finally, the easily understandable color display and threedimensional volume-rendered images in patients with the disease allow information to be easily communicated to clinicians and patients. Prospective studies are underway to validate our results and to evaluate the diagnostic yield of dual-energy CT for gout in a larger number of patients. Acknowledgments: We express our sincere gratitude to Rickey E. Carter, PhD, Division of Biomedical Statistics and Informatics, Mayo Clinic, Rochester, Minn, for his assistance with statistical analysis and manuscript review. Disclosures of Potential Conflicts of Interest: K.N.G. No potential conflicts of interest to disclose. L.S.G. No potential conflicts of interest to disclose. N.S.M. No potential conflicts of interest to disclose. D.F.B. No potential conflicts of interest to disclose. T.B. Financial activities related to the present article: none to disclose. Financial activities not related to the present article: received a grant from a private benefactor supporting a clinician scholarship award currently dedicated to further evaluate the clinical utility of dual-energy CT. Other relationships: scanner used for dual-energy CT was provided by Siemens Healthcare, which may be perceived as an institutional conflict of interest. N.M. No potential conflicts of interest to disclose. S.L. No potential conflicts of interest to disclose. J.G.F. Financial activities related to the present article: none to disclose. Financial activities not related to the present article: institution received grant and equipment used in the study from Siemens Healthcare. Other relationships: none to disclose. C.H.M. Financial activities related to the present article: institution received a grant from Siemens Healthcare, and equipment from Siemens Healthcare was used in this study. Financial activities not related to the present article: institution received a grant from Siemens Healthcare. Other relationships: none to disclose.
References 1. Roubenoff R, Klag MJ, Mead LA, Liang KY, Seidler AJ, Hochberg MC. Incidence and risk factors for gout in white men. JAMA 1991; 266(21):3004–3007.
radiology.rsna.org
Glazebrook et al
2. Hak AE, Choi HK. Lifestyle and gout. Curr Opin Rheumatol 2008;20(2):179–186. 3. Wallace KL, Riedel AA, Joseph-Ridge N, Wortmann R. Increasing prevalence of gout and hyperuricemia over 10 years among older adults in a managed care population. J Rheumatol 2004;31(8):1582–1587. 4. Lawrence RC, Felson DT, Helmick CG, et al. Estimates of the prevalence of arthritis and other rheumatic conditions in the United States. Part II. Arthritis Rheum 2008;58(1): 26–35. 5. Choi HK, Mount DB, Reginato AM; American College of Physicians; American Physiological Society. Pathogenesis of gout. Ann Intern Med 2005;143(7):499–516. 6. Terkeltaub R. Update on gout: new therapeutic strategies and options. Nat Rev Rheumatol 2010;6(1):30–38. 7. Schlesinger N, Dalbeth N, Perez-Ruiz F. Gout—what are the treatment options? Expert Opin Pharmacother 2009;10(8):1319–1328. 8. Swan A, Amer H, Dieppe P. The value of synovial fluid assays in the diagnosis of joint disease: a literature survey. Ann Rheum Dis 2002;61(6):493–498. 9. Schlesinger N. Diagnosis of gout: clinical, laboratory, and radiologic findings. Am J Manag Care 2005;11(15 suppl):S443–S450; quiz S465–S468. 10. Schlesinger N, Norquist JM, Watson DJ. Serum urate during acute gout. J Rheumatol 2009;36(6):1287–1289. 11. Schlesinger N, Baker DG, Schumacher HR Jr. Serum urate during bouts of acute gouty arthritis. J Rheumatol 1997;24(11):2265–2266. 12. Buckley TJ. Radiologic features of gout. Am Fam Physician 1996;54(4):1232–1238. 13. Peh WC. Tophaceous gout. Am J Orthop 2001;30(8):665. 14. Primak AN, Fletcher JG, Vrtiska TJ, et al. Noninvasive differentiation of uric acid versus non-uric acid kidney stones using dual-energy CT. Acad Radiol 2007;14(12):1441–1447. 15. Graser A, Johnson TR, Bader M, et al. Dual energy CT characterization of urinary calculi: initial in vitro and clinical experience. Invest Radiol 2008;43(2):112–119. 16. Johnson TR, Krauss B, Sedlmair M, et al. Material differentiation by dual energy CT: initial experience. Eur Radiol 2007;17(6): 1510–1517. 17. Choi HK, Al-Arfaj AM, Eftekhari A, et al. Dual energy computed tomography in tophaceous gout. Ann Rheum Dis 2009;68(10): 1609–1612.
523
MUSCULOSKELETAL IMAGING: Intraarticular and Periarticular Uric Acid Crystals at CT
18. Nicolaou S, Yong-Hing CJ, Galea-Soler S, Hou DJ, Louis L, Munk P. Dual-energy CT as a potential new diagnostic tool in the management of gout in the acute setting. AJR Am J Roentgenol 2010;194(4):1072–1078. 19. Bacani AK, McCollough CH, Glazebrook KN, et al. Dual energy computed tomography for quantification of tissue urate deposits in tophaceous gout: help from modern physics in the management of an ancient disease. Rheumatol Int. http://www.ncbi.nlm.nih.gov /pubmed/20016988. Published December 17, 2009. Accessed May 16, 2011. 20. Primak AN, Ramirez Giraldo JC, Liu X, Yu L, McCollough CH. Improved dual-energy material discrimination for dual-source CT by means of additional spectral filtration. Med Phys 2009;36(4):1359–1369. 21. Primak AN, Giraldo JC, Eusemann CD, et al. Dual-source dual-energy CT with additional tin filtration: dose and image quality evalu-
524
Glazebrook et al
ation in phantoms and in vivo. AJR Am J Roentgenol 2010;195(5):1164–1174. 22. Clopper CJ, Perason ES. The use of confidence or fudicial limits illustrated in the case of the binomial. Biometrika 1934;26(4):404–413. 23. Landis JR, Koch GG. The measurement of observer agreement for categorical data. Biometrics 1977;33(1):159–174. 24. McCarty DJ, Hollander JL. Identification of urate crystals in gouty synovial fluid. Ann Intern Med 1961;54:452–460. 25. Chen CK, Chung CB, Yeh L, et al. Carpal tunnel syndrome caused by tophaceous gout: CT and MR imaging features in 20 patients. AJR Am J Roentgenol 2000;175(3):655–659. 26. Perez-Ruiz F, Dalbeth N, Urresola A, de Miguel E, Schlesinger N. Imaging of gout: findings and utility. Arthritis Res Ther 2009;11(3):232. 27. Narváez JA, Narváez J, Ortega R, De Lama E, Roca Y, Vidal N. Hypointense synovial le-
sions on T2-weighted images: differential diagnosis with pathologic correlation. AJR Am J Roentgenol 2003;181(3):761–769. 28. Thiele RG, Schlesinger N. Diagnosis of gout by ultrasound. Rheumatology (Oxford) 2007; 46(7):1116–1121. 29. Dalbeth N, Schauer C, MacDonald P, et al. Methods of tophus assessment in clinical trials of chronic gout: a systematic literature review and pictorial reference guide. Ann Rheum Dis 2010;70(4):597–604. 30. National Research Council. Committee to Assess Health Risks from Exposure to Low Level of Ionizing Radiation. Health risks from exposure to low levels of ionizing radiation: BEIR VII Phase 2. Washington, DC: National Academies Press, 2006. 31. McCollough CH, Guimarães L, Fletcher JG. In defense of body CT. AJR Am J Roentgenol 2009;193(1):28–39.
radiology.rsna.org
n
Radiology: Volume 261: Number 2—November 2011