Global Price of Foreign Exchange Risk Francesca Carrieri, Vihang Errunza and Basma Majerbi* March 2003
Abstract We provide new evidence on the pricing of exchange risk in emerging stock markets (EMs). We conduct empirical tests in a conditional setting with a multivariate GARCH-inMean specification and time-varying prices of risk for nine EMs to determine whether exchange risk is priced under alternative model specifications and exchange rate measures. Since inflation rates in EMs are high and volatile, we argue that the use of real exchange rates offer a better proxy for both inflation risk and nominal exchange risk. In addition to using real exchange rates, the empirical model allows for partial integration. Our main results support the hypothesis of significant exchange risk premia in emerging stock markets. The price of exchange risk is also significantly time-varying consistent with previous evidence for major developed markets. The empirical evidence also suggests that there is variation across countries and over time in the relative importance of exchange risk premia. However, currency risk remains an important risk factor even after accounting for local risk.
*
All authors are at the Faculty of Management, McGill University, Montreal, Quebec, H3A1G5, Canada. Carrieri may be reached at
[email protected]; Errunza may be reached at
[email protected]; Majerbi may be reached at
[email protected]. We are grateful to Giorgio De Santis and Luis Viceira for helpful discussions. This paper has also benefited from workshop at McGill University. Errunza acknowledges financial support from the Bank of Montreal Chair at McGill University and SSHRC. Carrieri acknowledges financial support from SSHRC.
1. Introduction Foreign exchange risk is one of the most important dimensions of international asset pricing. Indeed, under deviations from purchasing power parity (PPP), exchange risk should be priced [see, for example, Solnik (1974), Stulz (1981), and Adler and Dumas (1983)].1 These international asset pricing models (IAPMs) include covariances of asset returns with changes in deviations from PPP in addition to the covariance with the world market portfolio. Early attempts to test IAPMs in an unconditional setting were inconclusive. More recently, Dumas and Solnik (1995) and De Santis and Gerard (1998) use a conditional framework and find evidence that foreign exchange risk is priced in major developed stock markets. Most previous results are based on models that implicitly assume full market integration and study major developed stock markets (US, UK, Japan and Germany). Therefore, the available evidence is not sufficient to allow generalization about whether exchange risk is priced globally in different market environments, such as emerging markets (EMs), that are neither fully integrated nor completely segmented. In addition, many EMs have experienced some kind of currency crises with overwhelming negative impact on their economies and stock markets. This may affect the perception of foreign investors with respect to the importance of exchange rate risk as an additional source of uncertainty in EMs. It is then interesting to empirically see if such perception is reflected in significant (and/or) larger foreign exchange risk premia in equity returns of emerging markets. Indeed, the issue of whether foreign exchange risk is priced for securities from these markets remains to a large extent an open question. For example, the Bailey and Chung (1995) study finds evidence that Mexico’s equity market premia are related to risk premia in the currency market. However, they conclude that some risk premia can be detected only if time-variation is allowed. Hence, we use a conditional framework to investigate whether foreign exchange risk is priced in emerging stock markets under different model specifications and exchange risk measures. Based on data from nine EMs encompassing different regions and different 1
See Karolyi and Stulz (2002) for an excellent discussion.
2
exchange rate regimes, we attempt to provide some answers to the following related questions: •
Does exchange risk command a significant time varying risk premium in equity returns?
•
Does the price of exchange risk remain significant once we account for local market risk in a model that assumes partial integration?
•
If exchange risk is priced, how does this exchange premium compare to what has been reported for developed stock markets? Our base model uses the IAPM of Adler and Dumas (1983). The base case assumes
emerging markets are fully integrated with the world capital market and allows us to compare our findings with those of Dumas and Solnik (1995) and De Santis and Gerard (1998). This assumption is then relaxed and replaced by a partial integration hypothesis, which is more appropriate for the case of EMs. Our empirical methodology is similar to that of De Santis and Gerard (1998) with the exception of the exchange rate specification. We use measures of real exchange rates to investigate the significance of exchange risk pricing in emerging stock markets. We argue that, in the case of EMs, this is more appropriate and also more consistent with the original IAPM of Adler and Dumas (1983) where both world market risk and inflation risk are priced. Previous empirical tests based on this model have assumed inflation as negligible and simplified the model by estimating the prices of risk from the covariances of the asset returns with nominal exchange rate changes. Although this is a reasonable assumption in the case of major developed markets, we cannot ignore inflation by assuming that it is nonrandom when we deal with the relatively more inflationary and volatile emerging economies. In the absence of such simplifying assumption, we derive our empirical model where the covariance terms of asset returns with inflation rates are replaced by the covariance of asset returns with the change in real exchange rates. Since real exchange rates are inflation adjusted, the change in the real exchange rate is a more correct measure of PPP deviations for our setting. Furthermore, it is well accepted that EMs are neither fully integrated nor completely segmented [see for example, Errunza, Losq and Padmanabhan (1992) and Bekaert and Harvey (1995)]. The empirical evidence about the behavior of emerging market returns
3
provided by Harvey (1995) suggests that expected returns in these markets are more likely to be influenced by local rather than global factors. Hence, in our main estimation, we follow Bekaert and Harvey (1995) and De Santis and Gerard (1998) and test for the significance of the pricing of exchange risk within the framework of a model that allows for partial integration by including a time varying price of local market risk.2 Its inclusion is motivated by the fact that in partially integrated markets, tests based on an IAPM such as the fully integrated framework of Adler and Dumas (1983) may result in a spurious significance of the exchange risk factor because of failure to account for the domestic risk factor. Our results can be summarized as follows. We find evidence in multicountry systems that include a large number of assets from developed and emerging markets that currency risk from emerging market countries is significant and time-varying. Unlike the US market where the world risk factor is the most important, most EMs show larger premia linked to the exchange risk factor, particularly with respect to the risk of emerging market currencies. On average over the whole sample total currency premia are negative, confirming that the hedging component in currency premia is predominant. Total currency premia are also economically significant as on average they represent 15 percent of the total. Over subperiods we find that the contribution from emerging markets currency risk can be as high as 50 percent for some assets. When we investigate its importance relative to the local risk, we observe that, while bilateral exchange rate risk is still significant for half of the countries, local risk is often priced and at times subsumes the statistical importance of currency risk. For some countries, the significance of the price of currency risk on the stock market is quite sensitive to the choice of the exchange risk measure used. We take this as indication that in emerging markets it is difficult to disentangle inflation risk, proxied by the real exchange rate changes, from country-specific risk. Although local market risk is on average the largest component, total currency premia still represent 21 percent of total premia, with the EM currency factor as the largest element. Thus, currency risk remains an important risk factor in economic, if not statistical, terms.
2
Previous empirical studies that include both world and domestic market factors along with other risk factors to test various forms of IAPMs include Chan, Karolyi and Stulz (1992), Choi and Rajan (1997), Choi, Hiraki and Takezawa (1998).
4
The rest of the paper is organized as follows. In section 2, we briefly discuss the existing empirical literature on the pricing of exchange risk. Section 3 outlines the model and methodology. Section 4 describes the data and presents some preliminary analysis of emerging market returns. The empirical results from tests of exchange risk pricing under full integration and those based on a partial integration specification are presented in section 5. Section 6 concludes the paper. 2. Past Research Early theoretical studies proposed IAPMs that include exchange risk along with the traditional market risk factor [Solnik (1974), Stulz (1981), Adler and Dumas (1983)]. On the empirical side, there are only few studies that directly test for the existence and significance of such exchange risk premia in stock markets. In general, the evidence is quite mixed and fragmentary. Early unconditional tests, such as Hamao (1988) and Jorion (1991), were rather inconclusive and generally found no evidence that exchange risk is priced on the Japanese and US stock markets respectively. More recent studies, based on a conditional setting [Dumas and Solnik (1995), De Santis and Gerard (1998), Carrieri (2001), Choi, Hiraki and Takezawa (1998), Doukas, Hall and Lang (1999)], tend to strongly support the hypothesis that foreign exchange risk is priced in stock markets of major developed countries. The literature on foreign exchange risk premia as they relate to EMs is very sparse. With the exception of the Bailey and Chung (1995) study of the Mexican market, the unconditional tests of Carrieri and Majerbi (2003) for a sample of nine EMs and the Phylaktis and Ravazzolo (2002) analysis of Pacific Basin financial markets, we are not aware of any other work that focuses on exchange risk premia in emerging stock markets. The conclusions in Carrieri and Majerbi (2003) provide initial evidence that exchange risk seems to be unconditionally priced in EMs using aggregate data, although with firm level data both the world market and the exchange risk factors become insignificant and are subsumed by the domestic risk factor. However, given the growing evidence about time variation of expected asset returns and the prices of risk, it would be more relevant to investigate whether exchange risk is priced in EMs using a conditional framework. Previous research for developed markets has 5
shown that the conclusions are very different depending on whether we test a conditional or an unconditional version of the same asset pricing model. Indeed, further investigation of this important issue is called for. 3. Model and Methodology 3.1. The model We begin with the specification based on Adler and Dumas (1983) model that assumes full integration. In a world with L+1 countries, we can write the full integration model of Adler and Dumas (1983) as L
E (ri ,t ) = å δ j ,t −1 cov t −1 (ri ,t , π $j ,t ) + δ w,t −1 cov t −1 (ri ,t , rw,t )
(1)
j =1
where ri and rw are excess returns on the asset i and the world market portfolio, π $j is the rate of inflation of country j expressed in the reference currency , E is the expectations operator, δ w is the price of world market risk and δ j ’s are the prices of inflation risks. The term cov (ri , π $j ) measures the exposure of asset i to both the inflation risk and the exchange risk associated with country j. Dumas and Solnik (1995) and De Santis and Gerard (1998) simplified the model by assuming that domestic inflation is non-stochastic. Since π$j ≈ π j + e j ,3 where π j is the inflation in local currency terms and ej is the change in the nominal exchange rate, they assume that the only random component in π $j is the relative change in the exchange rate between the reference currency and the currency of country j. Therefore, cov (ri , π $j ), is a pure measure of the exposure of asset i to the currency risk of country j and δ j can be interpreted as the price of risk of currency j. This simplification is reasonable for major 3
If Pj is the price level in country j (expressed in the local currency j), then the price level of country j
expressed in U$ is:
Thus,
dPj$ $ j
P
=
dPj Pj
Pj$ = Pj × S j where Sj is the nominal exchange rate expressed as U$/FCj +
dS j Sj
+
dPj Pj
×
dS j Sj
and, π$j ≈ π j + e j
6
developed countries where the changes in domestic inflation relative to exchange rate fluctuations are almost negligible. However, for many EMs where inflation is volatile, we cannot substitute the change in the nominal exchange rate for the inflation rate π $j . In addition, using nominal exchange rates to proxy for inflation in the reference currency would cause misspecification of the estimated risk premium as it would not account for the adjustment from local inflation. Therefore, when inflation cannot be assumed non stochastic, we should have two covariance terms for each currency. Not only this is too difficult to estimate, but the separation between local inflation and local currency value for a given country to estimate inflation and exchange risk premia may not have a relevant economic meaning. This is because, especially in EMs, the two “risk factors” are closely related. One way to overcome the difficulty in empirical testing of IAPMs for the case of high inflation countries is to proxy the inflation rate π $j by the change in the real exchange rate of currency j instead of the nominal exchange rate (see proof in appendix 1). As explained in the appendix, this would still require an assumption about inflation for the reference currency (the U$) to be non stochastic, which is reasonable. Intuitively, it is also more appealing to approximate the inflation risk from a given currency by the real exchange risk, since changes in the real exchange rate come from the combined effects of changes in the inflation differential (between country j and the US) and changes in the nominal currency value. Therefore, we can estimate the following version of the Adler-Dumas model where only the reference country inflation rate (US) is assumed to be non-stochastic: L
E (ri ,t ) = δ w,t −1 cov t −1 (ri ,t , rw,t ) + å δ j ,t −1 cov t −t (ri ,t , e rj ,t )
(1a)
j =1
where erj is the change in the real exchange rate of currency j vis-à-vis the US$. δ j can be interpreted as the price of exchange risk after adjusting for inflation changes. Next, we modify this simplification to depict a more realistic global market environment. We follow Bekaert and Harvey (1995) and De Santis and Gerard (1998) who include local risk premia in a model with global covariance risk. We test for the
7
significance of the pricing of exchange risk within the framework that allows for partial integration by including a time-varying price of local market risk: L
E (ri.t ) = δ w,t −1 cov t −1 (ri ,t , rw,t ) + å δ j ,t −1 cov t −1 (ri ,t , e rj ,t ) + δ d ,t −1 vart −1 (ri ,t )
(1b)
j =1
where, δ d , the price of domestic risk, is incorporated to measure factors such as legal barriers to portfolio flows or differential tax treatment across countries that are not captured by the full integration model. 3. 2. Empirical Methodology
We first estimate the full integration model in equation (1a) jointly for a system of countries. The empirical model includes a time-varying price of world market risk and time-varying prices of real exchange rate risk, L
rt = δ w,t −1 hw,t + å δ l ,t −1hn + j ,t + ε t j =1
ε t | Ω t −1 ~ N (0, H t )
(2)
where:
rt is a vector of excess returns of s assets measured in a common currency;
δ w, t −1 is the price of world market risk; δ j ,t −1 are the prices of currency risk; Ωt −1 is a set of information variables available to investors at time t; hi,t is a column of the (N x N) covariance matrix Ht. We estimate the system (2) for N assets, that include 1 1
(6) Are the prices of all currencies risk equal to zero? H 0 : k em, j = k mj , j = 0 ∀j
(7) Are the prices of all currencies risk constant? H 0 : k em, j = k mj , j = 0 ∀j > 1
Likelihood function
-8146.92
Panel C: Diagnostics Tests For Normalized Residuals Mean Skewness Kurtosis Brazil Chile Mexico Korea Thailand USA EM currency index Major currency index World
B-Ja
Q(z)12b
-0.028 -0.32* 1.59** 34.95** 9.22 0.090 -0.11 1.62** 31.43** 36.91** -0.000 -1.44** 4.76** 373.91** 23.46* -0.030 0.22 1.65** 34.54** 12.45 -0.027 -0.47** 2.74** 100.26** 40.97** 0.002 -0.79** 3.59** 184.38** 10.20 -0.051 -1.27** 4.38** 309.15** 24.76* -0.009 0.32* 0.43 7.06* 33.22** -0.029 -0.70** 2.30** 87.15** 14.82 a Bera-Jarque test statistic for normality. b Ljung-Box test statistic for returns and returns squared. c Absolute Mean Pricing Error d Root Mean Squared Error ** and * denote statistical significance at the 1% and 5% levels respectively.
Q(z2)12b 13.67 15.51 13.33 12.54 29.47** 5.37 8.23 7.11 5.36
AMPEc
RMSEd
11.73 7.57 8.98 7.74 6.89 3.25 0.77 1.32 2.99
15.88 9.93 13.26 10.62 10.25 4.28 1.14 1.69 3.96
Table 5. Summary Statistics for Equity Premia This table contains averages for the risk premia estimated for the model in table 4. On the left hand side of the panel, we report annualized means, in percent, for the world market premium (WMP), the emerging markets currency premium (EMCP), the major currencies premium (MJCP), and the total premium (TP) as the sum of the previous three. On the right hand side, we also report each premium as a percentage of the total in absolute terms.
WMP
EMCP
MJCP
TP
WMP
EMCP
MJCP
all sample
Brazil Chile Mexico Korea Thailand USA World
5.80
0.24
-0.83
5.21
84.4%
3.5%
12.1%
2.40
-0.51
0.07
1.96
80.6
17.0
2.4
7.99
-1.13
0.49
7.35
83.2
11.7
5.1
5.70
-0.27
-0.41
5.02
89.4
4.2
6.4
5.90
-0.72
-0.64
4.54
81.3
9.9
8.8
6.51
-0.11
-0.15
6.24
96.1
1.7
2.2
7.40
-0.23
-0.59
6.58
90.0
2.8
7.2
86.4 83.8
7.3 9.3
6.3 7.0
average av. among EMs Jan 76 - Dec 85
Brazil Chile Mexico Korea Thailand USA World
4.47
0.34
-0.58
4.23
83.0%
6.3%
10.7%
1.67
-2.26
0.06
-0.53
41.9
56.6
1.5
7.45
-4.36
0.27
3.36
61.7
36.1
2.2
4.76
-1.85
-0.18
2.72
70.1
27.3
2.7
4.47
-3.77
-0.47
0.23
51.3
43.3
5.4
6.41
-0.41
-0.13
5.87
92.2
5.9
1.9
7.16
-0.83
-0.50
5.83
84.4
9.8
5.8
69.2 61.6
26.5 33.9
4.3 4.5
average av. among EMs Jan 91 - Dec 00
Brazil Chile Mexico Korea Thailand USA World average av. among EMs
7.75
0.36
-0.24
7.86
92.9%
4.3%
2.9%
2.97
1.43
-0.15
4.25
65.2
31.5
3.3
8.79
1.92
0.27
10.98
80.0
17.5
2.5
6.94
1.53
-0.43
8.05
77.9
17.2
4.8
7.45
2.70
-0.75
9.40
68.3
24.8
6.9
6.99
0.18
-0.13
7.04
95.8
2.4
1.8
8.08
0.39
-0.36
8.11
91.6
4.4
4.0
81.7 76.9
14.6 19.0
3.7 4.1
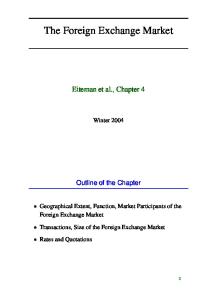
Figure 1. Time Varying (TV) Prices of Risk Estimated from Full Integration Model T V p r ic e o f w o r ld m a r k e t r is k 0 .2 0
0 .1 5
0 .1 0
0 .0 5
E s ti m a te d
2000
1999
1998
1997
1996
1995
1994
1993
1992
1991
1990
1989
1988
1987
1986
1985
1984
1983
1982
1981
1980
1979
1978
1977
1976
0 .0 0
A ve r a g e ( 0 .0 3 9 6 )
T V p r ic e o f E M c u r r e n c y r is k 0 .8 0
0 .4 0
0 .0 0
- 0 .4 0
1994
1995
1996
1997
1998
1999
2000
1995
1996
1997
1998
1999
2000
1993
1992
1991
1990
1994
E s ti m a te d
1989
1988
1987
1986
1985
1984
1983
1982
1981
1980
1979
1978
1977
1976
- 0 .8 0
A ve r a g e ( - 0 .0 2 9 4 )
T V p r ic e o f M a jo r c u r r e n c y r is k 0 .8 0
0 .4 0
0 .0 0
- 0 .4 0
E s ti m a te d
1993
1992
1991
1990
1989
1988
1987
1986
1985
1984
1983
1982
1981
1980
1979
1978
1977
1976
- 0 .8 0
A ve r a g e ( - 0 .0 2 6 7 )
Figure 2. Estimated Risk Premia for Country Returns from Full Integration Model Braz il 4.00
3.00
2.00
1.00
1998
1999
2000
1999
2000
1997
1998
1996
1995
1994
1993
1992
1991
1990
1989
1987
1986
1985
1984
1983
1982
1981
1980
1979
1978
1977
1976
0.00
-1.00
-2.00 world mkt RP
EM exhange RP
Major exchange RP
C h ile 2.00 1.50 1.00 0.50
1997
1996
1995
1994
1993
1992
1991
1990
1989
1987
1986
1985
1984
1983
1982
1981
1980
1979
1978
1977
-0.50
1976
0.00
-1.00 -1.50 -2.00 -2.50 -3.00 w orld m k t R P
E M ex hange R P
M ajor ex c hange R P
-0.50
world mkt RP
EM exhange RP
3.00
2.50
2.00
1.50
1.00
0.50
0.00
-1.00
-1.50
-2.00
Major exchange RP
1997
1996
1995
1994
1993
1992
1991
1990
1989
1987
1986
1985
1984
1983
1982
1981
1980
1979
1978
1977
1976
2000
Korea
2000
Major exchange RP
1999
-6.00
1999
-4.00 1998
-2.00
1998
1997
1996
1995
1994
EM exhange RP
1993
1992
1991
1990
1989
1987
world mkt RP
1986
1985
1984
1983
1982
1981
1980
1979
1978
1977
1976
Mexico
4.00
2.00
0.00
-0.50
world mkt RP
E M ex hange RP
3.00
2.50
2.00
1.50
1.00
0.50
0.00
-1.00
Major ex change RP
1997
1996
1995
1994
1993
1992
1991
1990
1989
1987
1986
1985
1984
1983
1982
1981
1980
1979
1978
1977
1976
2000
U SA
2000
M ajor ex change RP
1999
-3.00
1999
-2.00 1998
-1.00
1998
1997
1996
1995
1994
EM ex hange RP
1993
1992
1991
1990
1989
1987
world m kt RP
1986
1985
1984
1983
1982
1981
1980
1979
1978
1977
1976
Thailand
3.00
2.00
1.00
0.00
Table 6. QML Estimates of the Partial Integration Model with T.V. Prices of World and Currency Risk and Constant Price of Domestic Risk The estimated model is:
rit = δ w,t −1 cov t −1 (rit , rwt ) + δ em,t −1 cov t −1 (rit , remt ) + δ mj ,t −1 cov t −1 (rit , rmjt ) + δ i vart −1 (rit ) + ε it
ìδ w,t −1 = exp(k w′ z t −1 ) ï ′ z t −1 ïδ em,t −1 = k em where í ′ z t −1 ïδ mj ,t −1 = k mj ïε ℑ ~ N (0, H ) t î t t −1 where rem is the change in the real EM currency index; rmj is the change in the real Major currency index; δi is a constant price of domestic risk added only in the pricing equation of EMs returns. Z is a set of global information variables which includes a constant, the world dividend yield in excess of the risk free rate (XWDY), the change in the term structure spread (∆USTP) and the default spread (USDP). The conditional covariance matrix Ht is parameterized as follows:
H t = H 0 ∗ (u ′ − aa ′ − bb) + aa ′ ∗ ε t −1ε ′t −1 + bb′ ∗ H t −1
where * denotes the Hadamard matrix product, a and b are 9×1 unit vector.
Panel A: Parameter estimates
kw estim.
kem
std.err.
p-value
estim.
std.err.
Const XWDY ∆USTP USDP
-2.8514 1.0531 0.0068 0.2735 0.1404 2.3838 1.1173 0.0329 0.1078 0.3856 -1.1519 1.1055 0.2975 0.2618 0.1738 0.3538 1.1794 0.7642 -0.2373 0.1694 All GARCH parameters are significant and satisfy the stationarity condition.
kmj p-value 0.0514 0.7798 0.1320 0.1613
estim. -0.0193 0.5903 -0.1218 0.2064
std.err. 0.0953 0.1926 0.0853 0.1153
Prices of domestic risk: Brazil
Chile
Mexico
Korea
Thailand
-0.0020
0.0058
-0.0009
0.0065
-0.0003
std.err.
0.0037
0.0043
0.0040
0.0063
0.0060
p-value
0.5983
0.1782
0.8199
0.2997
0.9614
δi
p-value 0.8398 0.0022 0.1534 0.0734
Panel B: Specification Tests χ2
Null hypothesis (1) Is the price of world market risk constant? H 0 : k w, j = 0 ∀j > 1
df
p-value
6.3080
3
0.0975
12.0024
4
0.0173
11.9972
3
0.0074
10.1423
4
0.0381
9.7154
3
0.0211
19.5653
8
0.0121
19.2776
6
0.0037
3.7128
5
0.5915
(2) Is the price of real EM currency risk equal to zero? H 0 : k em, j = 0 ∀j
(3) Is the price of real EM currency risk constant? H 0 : k em, j = 0 ∀j > 1
(4) Is the price of real Major currency risk equal to zero? H 0 : k mj , j = 0 ∀j
(5) ) Is the price of real Major currency risk constant? H 0 : k mj , j = 0 ∀j > 1
(6) Are the prices of all currencies risk equal to zero? H 0 : k em, j = k mj , j = 0 ∀j
(7) Are the prices of all currencies risk constant? H 0 : k em, j = k mj , j = 0 ∀j > 1
(8) Are the prices of domestic risk jointly equal to zero? H 0 : δ i = 0 ∀i
Likelihood function
-8145.12
Panel C: Diagnostics Tests For Normalized Residuals Mean Skewness Kurtosis Brazil Chile Mexico Korea Thailand USA EM currency index Major currency index World
B-Ja
Q(z)12b
0.005 -0.32* 1.60** 35.20** 9.26 0.034 -0.09 1.55** 28.74** 36.84** 0.012 -1.44** 4.76** 373.97** 23.35* -0.094 0.21 1.60** 32.59** 13.22 -0.022 -0.47** 2.74** 100.73** 40.89** 0.004 -0.78** 3.58** 183.61** 10.15 -0.046 -1.27** 4.41** 312.56** 24.74* -0.003 0.32* 0.44 7.17* 33.36** -0.026 -0.70** 2.31** 87.88** 14.80 a Bera-Jarque test statistic for normality. b Ljung-Box test statistic for returns and returns squared. c Absolute Mean Pricing Error d Root Mean Squared Error ** and * denote statistical significance at the 1% and 5% levels respectively.
Q(z2)12b 13.42 15.38 13.00 15.82 29.90** 5.36 8.65 7.65 5.38
AMPEc
RMSEd
11.73 7.59 9.00 7.88 6.89 3.25 0.77 1.31 2.99
15.88 9.88 13.25 10.68 10.25 4.28 1.14 1.68 3.96
Table 7. Hypotheses Testing of the Partial Integration Model with T.V. Prices of World, Currency and Domestic Risk - using real bilateral exchange rates -
The estimated model is:
rit = δ w,t −1 cov t −1 (rit , rwt ) + δ c ,t −1 cov t −1 (rit , rct ) + δ di ,t −1 vart −1 (rit ) + ε it
ìδ w,t −1 = exp(k w′ z g ,t −1 ) ï ïδ c ,t −1 = k c′ z g ,t −1 where í ïδ di ,t −1 = k d′ z di ,t −1 ïε ℑ ~ N (0, H ) t î t t −1
where rct is the change in the real exchange rate of the foreign currency with respect to the dollar; Zg is a set of global information variables (same as in previous model); Zdi is a set of local information variables (specific to country i) which includes a constant, the local market dividend yield in excess of the eurodollar rate (XLDY), the local market lagged excess return (LAGRet), and the change in the local inflation rate (∆LCinf). H t = H 0 ∗ (u ′ − aa ′ − bb) + aa ′ ∗ ε t −1ε ′t −1 + bb′ ∗ H t −1 ; where * denotes the Hadamard matrix product, a and b are 4×1 unit vector.
Null Hypothesis
χ2
BRAZIL df p-value
χ2
CHILE df p-value
χ2
COLUMBIA df p-value
(1) Is the price of world market risk constant?
H 0 : k w, j = 0 ∀j > 1
26.6953
3
0.0000
26.5471
3
0.0000
17.4186
3
0.0006
1.4662
4
0.8326
7.8481
4
0.0973
6.6600
4
0.1550
1.4654
3
0.6903
5.7319
3
0.1254
4.5650
3
0.2066
0.3737
4
0.9846
12.3944
4
0.0146
29.9442
4
0.0000
0.3358
3
0.9532
11.8025
3
0.0081
29.1094
3
0.0000
(2) Is the price of real bilateral XR risk equal to zero?
H 0 : kc, j = 0 ∀j (3) Is the price of real bilateral XR risk constant?
H 0 : kc, j = 0 ∀j > 0 (4) Is the price of domestic market risk equal to zero?
H 0 : k d , j = 0 ∀j (5) ) Is the price of domestic market risk constant?
H 0 : k d , j = 0 ∀j > 1
Table 7. cont. Null Hypothesis
INDIA df
χ2
p-value
χ2
KOREA df p-value
χ2
MALAYSIA Df p-value
(1) Is the price of world market risk constant?
H 0 : k w, j = 0 ∀j > 1
16.2415
3
0.0010
31.5876
3
0.0000
15.4654
3
0.0015
11.9251
4
0.0179
15.7004
4
0.0034
21.6419
4
0.0002
3.7161
3
0.2938
11.6326
3
0.0088
21.5464
3
0.0001
3.2630
4
0.5148
16.8426
4
0.0021
8.6000
4
0.0719
2.6658
3
0.4461
15.4980
3
0.0014
2.3233
3
0.5081
(2) Is the price of real bilateral XR risk equal to zero?
H 0 : kc, j = 0 ∀j (3) Is the price of real bilateral XR risk constant?
H 0 : kc, j = 0 ∀j > 0 (4) Is the price of domestic market risk equal to zero?
H 0 : k d , j = 0 ∀j (5) ) Is the price of domestic market risk constant?
H 0 : k d , j = 0 ∀j > 1
Null Hypothesis
χ2
MEXICO df p-value
PHILIPPINES* df p-value χ2
χ2
THAILAND Df p-value
(1) Is the price of world market risk constant?
H 0 : k w, j = 0 ∀j > 1
37.3046
3
0.0000
9.1258
3
0.0277
20.3256
3
0.0001
208.7988
4
0.0000
3.1398
4
0.5347
3.3136
4
0.5068
77.9503
3
0.0000
1.6062
3
0.6580
3.3136
3
0.3458
15.1540
4
0.0044
13.9540
4
0.0074
8.7403
4
0.0679
13.6786
3
0.0034
13.4025
3
0.0038
8.1599
3
0.0428
(2) Is the price of real bilateral XR risk equal to zero?
H 0 : kc, j = 0 ∀j (3) Is the price of real bilateral XR risk constant?
H 0 : kc, j = 0 ∀j > 0 (4) Is the price of domestic market risk equal to zero?
H 0 : k d , j = 0 ∀j (5) ) Is the price of domestic market risk constant?
H 0 : k d , j = 0 ∀j > 1
* for Philippines, we report the estimates obtained using the EM currency index due to a difficulty encountered in estimating the system with the bilateral exchange rate only.
Table 8. Hypotheses Testing of the Partial Integration Model with T.V. Prices of World, Currency and Domestic Risk - using real bilateral exchange rates and Major currency index -
χ2
Null hypothesis
BRAZIL df p-value
χ2
CHILE df p-value
χ2
COLUMBIA df p-value
(1) Is the price of world market risk constant?
H 0 : k w, j = 0 ∀j > 1
13.3412
3
0.0040
12.1663
3
0.0068
9.0554
3
0.0286
1.3475
4
0.8533
9.3732
4
0.0524
148.2758
4
0.0000
1.3293
3
0.7222
6.3340
3
0.0964
61.9434
3
0.0000
4.5142
4
0.3409
4.9135
4
0.2963
14.8105
4
0.0051
3.6010
3
0.3079
4.9108
3
0.1784
12.7680
3
0.0052
6.8257
8
0.5555
14.7971
8
0.0632
209.8522
8
0.0000
6.1716
6
0.4043
11.9099
6
0.0640
92.7355
6
0.0000
0.8237
4
0.9352
16.4085
4
0.0025
39.0678
4
0.0000
0.5555
3
0.9065
16.0849
3
0.0011
39.0676
3
0.0000
(2) Is the price of real bilateral XR risk equal to zero?
H 0 : k c1, j = 0 ∀j (3) Is the price of real bilateral XR risk constant?
H 0 : k c1, j = 0 ∀j > 1 (4) Is the price of real Major currency risk equal zero?
H 0 : k c 2, j = 0 ∀j (5) Is the price of real Major currency risk constant?
H 0 : k c 2, j = 0 ∀j > 1 (6) Are the prices of all currencies risk equal to zero?
H0 : å k
c, j
= 0 ∀c , j
(7) Are the prices of all currencies risk constant?
H0 : å k
c, j
= 0 ∀c , ∀j > 1
(8) Is the price of domestic market risk equal to zero?
H 0 : k d , j = 0 ∀j (9) ) Is the price of domestic market risk constant?
H 0 : k d , j = 0 ∀j > 1
Table 8. cont.
INDIA df p-value
χ2
Null hypothesis
χ2
KOREA df p-value
χ2
MALAYSIA df p-value
(1) Is the price of world market risk constant?
H 0 : k w, j = 0 ∀j > 1
18.3407
3
0.0004
12.5515
3
0.0057
11.1013
3
0.0112
7.4389
4
0.1144
10.6102
4
0.0313
20.6165
4
0.0004
0.0498
3
0.9971
8.0047
3
0.0459
20.5771
3
0.0001
5.1747
4
0.2698
11.5611
4
0.0209
10.3089
4
0.0355
5.0139
3
0.1708
11.4241
3
0.0096
10.1971
3
0.0170
15.3084
8
0.0534
22.0012
8
0.0049
32.0667
8
0.0001
5.1242
6
0.5280
19.1527
6
0.0039
27.6601
6
0.0001
0.3616
3
0.9481
15.2101
3
0.0016
1.0878
4
0.8962
0.2913
2
0.8645
13.7352
2
0.0010
0.5681
3
0.9037
(2) Is the price of real bilateral XR risk equal to zero?
H 0 : k c1, j = 0 ∀j (3) Is the price of real bilateral XR risk constant?
H 0 : k c1, j = 0 ∀j > 1 (4) Is the price of real Major currency risk equal zero?
H 0 : k c 2, j = 0 ∀j (5) Is the price of real Major currency risk constant?
H 0 : k c 2, j = 0 ∀j > 1 (6) Are the prices of all currencies risk equal to zero?
H0 : å k
c, j
= 0 ∀c , j
(7) Are the prices of all currencies risk constant?
H0 : å k
c, j
= 0 ∀c , ∀j > 1
(8) Is the price of domestic market risk equal to zero?
H 0 : k d , j = 0 ∀j (9) ) Is the price of domestic market risk constant?
H 0 : k d , j = 0 ∀j > 1
Table 8. cont.
χ2
Null hypothesis
MEXICO df p-value
χ2
PHILIPPINES df p-value
χ2
THAILAND df p-value
(1) Is the price of world market risk constant?
H 0 : k w, j = 0 ∀j > 1
3.0915
3
0.3777
14.4995
3
0.0023
13.7239
3
0.0033
5.1700
4
0.2703
10.3489
4
0.0349
4.5179
4
0.3404
3.0008
3
0.3915
1.0857
3
0.7805
3.5252
3
0.3175
8.6022
4
0.0719
11.0818
4
0.0257
9.3911
4
0.0520
6.9689
3
0.0729
10.3171
3
0.0161
8.5828
3
0.0354
14.2015
8
0.0767
22.3021
8
0.0044
12.9177
8
0.1147
9.7689
6
0.1347
10.7919
6
0.0950
11.5267
6
0.0734
14.5893
4
0.0056
20.3783
4
0.0004
7.3556
4
0.1182
13.4024
3
0.0038
20.0171
3
0.0002
7.0104
3
0.0716
(2) Is the price of real bilateral XR risk equal to zero?
H 0 : k c1, j = 0 ∀j (3) Is the price of real bilateral XR risk constant?
H 0 : k c1, j = 0 ∀j > 1 (4) Is the price of real Major currency risk equal zero?
H 0 : k c 2, j = 0 ∀j (5) Is the price of real Major currency risk constant?
H 0 : k c 2, j = 0 ∀j > 1 (6) Are the prices of all currencies risk equal to zero?
H0 : å k
c, j
= 0 ∀c , j
(7) Are the prices of all currencies risk constant?
H0 : å k
c, j
= 0 ∀c , ∀j > 1
(8) Is the price of domestic market risk equal to zero?
H 0 : k d , j = 0 ∀j (9) ) Is the price of domestic market risk constant?
H 0 : k d , j = 0 ∀j > 1
Table 9. Summary Statistics for Equity Premia This table contains averages for the risk premia estimated for the model in table 8. On the left hand side of the panel, we report annualized means, in percent, for the world market premium (WMP), the emerging markets currency premium (EMCP), the major currencies premium (MJCP), the local market risk premium (LP) and the total premium (TP) as the sum of the previous four. On the right hand side, we also report each premium as a percentage of the total in absolute terms.
Brazil Chile Columbia India Korea Malaysia Mexico Philippines Thailand
WMP
EMCP
MJCP
7.57 2.49 0.22 -0.03 4.08 8.88 4.59 10.28 4.75
-0.79 -1.41 -4.16 -1.13 0.90 1.14 -1.56 -2.68 1.66
LP
TP
WMP
EMCP
MJCP
LP
all sample -1.72 7.34 0.00 5.11 -0.50 10.69 -0.40 2.92 -0.71 8.86 0.42 -5.86 0.24 -1.76 -0.76 2.19 -0.86 -0.93
12.39 6.19 6.25 1.36 13.14 4.58 1.51 9.04 4.62
43.4% 27.6 1.4 0.7 28.0 54.5 56.3 64.6 52.0 36.5
4.5% 15.6 26.7 25.7 6.2 7.0 19.2 16.8 20.3 15.8
9.9% 0.0 3.2 9.0 4.9 2.6 2.9 4.8 10.5 5.3
42.1% 56.8 68.7 66.0 60.9 36.0 21.6 13.8 11.3 41.9
-2.49 -1.29 --2.12 -3.67 --7.50 --0.53
Jan 77 - Dec 85 -2.61 5.74 -0.03 -8.67 ---0.65 0.44 -1.15 6.13 --0.36 1.66 ---1.25 -0.17
5.47 -7.53 --1.49 5.87 --2.21 -1.40
30.8% 19.8 -20.8 29.4 -25.6 -63.2 31.6
15.9% 10.4 -52.3 23.6 -58.7 -10.0 28.5
16.6% 0.2 -16.2 7.4 -2.8 -23.5 11.1
36.6% 69.6 -10.8 39.5 -13.0 -3.2 28.8
0.22 -1.75 -3.97 -0.22 6.60 9.11 3.57 -2.74 4.48
Jan 91 - Dec 00 -0.88 6.28 0.34 10.97 -1.36 3.07 -0.04 5.65 0.10 17.13 -1.45 -7.60 0.23 -2.27 -2.92 2.93 -0.56 -1.46
15.73 11.97 -2.25 4.79 27.55 5.78 8.21 5.26 8.12
57.8% 15.6 0.1 9.1 13.5 24.0 52.3 48.2 46.6 29.7
1.3% 11.3 47.2 3.4 24.0 38.1 28.1 16.5 36.8 23.0
5.1% 2.2 16.2 0.7 0.4 6.1 1.8 17.6 4.6 6.1
35.9% 70.9 36.5 86.8 62.2 31.8 17.8 17.7 12.0 41.3
average a
Brazil Chile Columbia b India Korea Malaysia b Mexico Philippinesb Thailand
4.83 2.46 -0.84 4.56 -3.27 -3.35
average
Brazil Chile Columbia India Korea Malaysia Mexico Philippines Thailand
10.12 2.42 0.01 -0.59 3.71 5.73 6.67 7.98 5.66
average Jan 80 – Dec 85;
a
b
data not available.
Table 10. Hypotheses Testing of the Partial Integration Model with T.V. Prices of World, Currency and Domestic Risk - using real EM currency Index Null Hypothesis
χ2
BRAZIL df p-value
χ2
CHILE df p-value
χ2
COLUMBIA df p-value
(1) Is the price of world market risk constant?
H 0 : k w, j = 0 ∀j > 1
31.2561
3
0.0000
29.9115
3
0.0000
17.8096
3
0.0005
10.0094
4
0.0403
7.7103
4
0.1028
15.8923
4
0.0032
9.5499
3
0.0228
7.1244
3
0.0680
3.7945
3
0.2845
0.5810
3
0.9008
10.4973
4
0.0328
40.2787
4
0.0000
0.5120
2
0.7741
9.7270
3
0.0210
40.0313
3
0.0000
(2) Is the price of real EM currency risk equal to zero?
H 0 : kc, j = 0 ∀j (3) Is the price of EM currency risk constant?
H 0 : kc, j = 0 ∀j > 0 (4) Is the price of domestic market risk equal to zero?
H 0 : k d , j = 0 ∀j (5) ) Is the price of domestic market risk constant?
H 0 : k d , j = 0 ∀j > 1
Null Hypothesis
χ2
INDIA df
p-value
χ2
KOREA df p-value
χ2
MALAYSIA df p-value
(1) Is the price of world market risk constant?
H 0 : k w, j = 0 ∀j > 1
22.3668
3
0.0001
20.7864
3
0.0001
19.3551
3
0.0002
9.0349
4
0.0602
7.2575
4
0.1229
5.6477
4
0.2271
9.0263
3
0.0289
5.7206
3
0.1260
0.2977
3
0.9605
2.5506
4
0.6356
11.8566
4
0.0184
12.1086
4
0.0166
1.9302
3
0.5870
11.6974
3
0.0085
11.9956
3
0.0074
(2) Is the price of real EM currency risk equal to zero?
H 0 : kc, j = 0 ∀j (3) Is the price of EM currency risk constant?
H 0 : kc, j = 0 ∀j > 0 (4) Is the price of domestic market risk equal to zero?
H 0 : k d , j = 0 ∀j (5) ) Is the price of domestic market risk constant?
H 0 : k d , j = 0 ∀j > 1
Table 10. cont.
Null Hypothesis
χ2
MEXICO df p-value
χ2
PHILIPPINES df p-value
χ2
THAILAND df p-value
(1) Is the price of world market risk constant?
H 0 : k w, j = 0 ∀j > 1
24.6382
3
0.0000
9.1258
3
0.0277
25.2022
3
0.0000
7.9901
4
0.0919
3.1398
4
0.5347
7.8719
4
0.0964
7.9859
3
0.0463
1.6062
3
0.6580
7.8237
3
0.0498
3.9065
4
0.4188
13.9540
4
0.0074
10.5678
4
0.0319
3.1444
3
0.3699
13.4025
3
0.0038
10.3934
3
0.0155
(2) Is the price of real EM currency risk equal to zero?
H 0 : kc, j = 0 ∀j (3) Is the price of EM currency risk constant?
H 0 : kc, j = 0 ∀j > 0 (4) Is the price of domestic market risk equal to zero?
H 0 : k d , j = 0 ∀j (5) ) Is the price of domestic market risk constant?
H 0 : k d , j = 0 ∀j > 1
Figure 3. Estimated Risk Premia from the Partial Integration Model with bilateral exchange rates and Major currency index (table 8) T V risk prem ia fo r B raz il 15.00
10.00
5.00
00 20
99
98
19
97
19
96
19
95
19
94
19
19
93 19
91
90
19
89
19
88
19
87
19
86
19
85
19
19
84 19
83
82
19
81
19
19
19
80
0.00
-5.00
-10.00 world m k t RP
bilat. ex c hange RP
m ajor ex c hange RP
dom es tic m k t RP
T V risk p rem ia fo r C h ile 15.00
10.00
5.00
2000
1999
1998
1997
1996
1995
1994
1993
1992
1991
1989
1988
1987
1986
1985
1984
1983
1982
1981
1980
1979
1978
1976
0.00
-5.00
-10.00 world m k t RP
bilat. ex c hange RP
m ajor ex c hange RP
dom es tic m k t RP
TV risk p rem ia fo r C o lum bia 15.00
10.00
5.00
0.00 1985 1986 1987 1988 1989 1990 1991 1992 1993 1994 1995 1996 1997 1998 1999 2000 -5.00
-10.00 world m k t RP
bilat. ex c hange RP
m ajor ex c hange RP
dom es tic m k t RP
TV risk premia for India 15.00
10.00
5.00
2000
1999
1998
1997
1996
1995
1994
1993
1992
1991
1989
1988
1987
1986
1985
1984
1983
1982
1981
1980
1979
1978
1976
0.00
-5.00
-10.00 world mkt RP
bilat. exchange RP
m ajor exchange RP
dom estic mkt RP
TV risk prem ia for K orea 15.00
10.00
5.00
1999
1998
1997
1996
1995
1994
1993
1992
1991
1990
1989
1988
1986
1985
1984
1983
1982
1981
1980
1979
1978
1977
1976
0.00
-5.00
-10.00 world m k t RP
bilat. ex c hange RP
m ajor ex c hange RP
dom es tic m k t RP
TV risk premia for Malaysia 15.00
10.00
5.00
0.00 1985 1986 1987 1988 1989 1990 1991 1992 1993 1994 1995 1996 1997 1998 1999 2000 -5.00
-10.00 world mkt RP
bilat. exchange RP
major exchange RP
domestic mkt RP
T V risk p rem ia fo r M exico 15.00
10.00
5.00
2000
1999
1998
1997
1996
1995
1994
1993
1992
1991
1989
1988
1987
1986
1985
1984
1983
1982
1981
1980
1979
1978
1976
0.00
-5.00
-10.00 world m k t RP
bilat. ex c hange RP
m ajor ex c hange RP
dom es tic m k t RP
TV risk premia for Philippines 15.00
10.00
5.00
0.00 1985 1986 1987 1988 1989 1990 1991 1992 1993 1994 1995 1996 1997 1998 1999 2000 -5.00
-10.00 world mkt RP
bilat. exchange RP
major exchange RP
domestic mkt RP
TV risk premia for Thailand 15.00
10.00
5.00
2000
1999
1998
1997
1996
1995
1994
1993
1992
1991
1989
1988
1987
1986
1985
1984
1983
1982
1981
1980
1979
1978
1976
0.00
-5.00
-10.00 world mkt RP
bilat. exchange RP
major exchange RP
domestic mkt RP
Appendix 1 Explanation for the use of real exchange rates as currency risk factors
Define S rj as the real exchange rate of currency j vis-à-vis the U$
S rjt = S jt ×
Pjt Pt
⇔ S rjt × Pt = S jt × Pjt
where Sjt is the nominal exchange rate (U$/FCj), Pt is the price level in the US,
Pjt is the price level in country j. We can rewrite the above equation as:
Pjt$ = S rjt × Pt where Pjt$ = S jt × Pjt is the price level in country j expressed in the reference currency (U$). The inflation rate of country j expressed in U$, referred to as π$jt in Adler and Dumas(1983) model, is given by:
∆ ln( Pj$,t ) = ∆ ln( Pt ) + ∆ ln(S rj ,t ) Thus, if we assume inflation in the reference currency (i.e., the change in Pt) is nonstochastic, π$jt can be approximated by the change in the real exchange rate of currency j.
Appendix 2
The trade weighted exchange rate indices computed by the Federal Reserve Board (FRB) giving the foreign exchange value of the US$ are constructed as follows: Nominal Index
I t = I t −1 ∏ (e jt e jt −1 )
w jt
j
Where ejt is the price of the U$ in terms of foreign currency j at time t (FC/U$), and wjt is the weight of currency j at time t in the total competitiveness index for the U$. According to this formulation, an increase in the index gives the appreciation / depreciation of the US$: æ e ö æ I ö logçç t ÷÷ = å w jt logç jt ÷ → weighted average of the appreciation/depreciation of the çe ÷ j è I t −1 ø è jt −1 ø
US$ against all other FCs included in a given index. To get the change in the FC value against the dollar (as should be in the IAPM to be æ 1 e jt ö æI ö ÷ estimated), we can compute: logçç t −1 ÷÷ = å w jt logç ç ÷ 1 e I j è t ø è jt −1 ø 1 e jt = S jt : the exchange rate expressed in U $ / FC j .
Real Index
The FRB uses the following formula to construct the real exchange rate index: æ e P Pjt ö ÷ I = I ∏ ç jt t ç ÷ j è e jt −1 Pt −1 Pjt −1 ø R t
w jt
R t −1
Where Pt is the consumer price index (CPI) for the US at time t and Pjt is the CPI for country j at time t.
æ IR ö So the change in the real FC value against the U$ is given by logçç t −R1 ÷÷ . è It ø w jt
æ Pjt I tR−1 ç = ∏ ç I tR j è e jt Pt
Pjt −1 ö ÷ e jt −1Pt −1 ÷ø
æS P I tR−1 = ∏ çç jt jt R It Pt j è
S jt −1Pjt −1 ö ÷ Pt −1 ÷ø
which can be written as follows: w jt
define Pjt$ = SjtPjt : the CPI in country j expressed in US$, then we can rewrite æ Pjt$ I tR−1 = ∏ çç I tR j è Pt
Pjt$ −1 ö ÷ Pt −1 ÷ø
w jt
æ Pjt$ = ∏ç $ ç j è Pjt −1
Pt ö÷ Pt −1 ÷ø
w jt
é æ Pjt$ ö æ I tR−1 ö æ P öù logçç R ÷÷ = å w jt êlogç $ ÷ − logçç t ÷÷ú = å w jt π$jt − πt ç ÷ j j êë è Pjt −1 ø è It ø è Pt −1 ø úû
[
]
æ Pjt$ ö æ P ö where π = logç $ ÷ and πt = logçç t ÷÷ are, respectively, the rate of inflation of country çP ÷ è Pt −1 ø è jt −1 ø $ jt
j expressed in U$ and the rate of inflation in the US. æ IR ö Finally, we can write logçç t −R1 ÷÷ = å w jt π$jt − πt ; j è It ø
åw
jt
=1
j
So the (log) change in the real index represents a weighted average of the rates of inflation of countries j included in the index expressed in U$ minus the US inflation. In the case of the OITP index (other important trading partners) which covers EMs currencies, it is reasonable to assume that the US inflation term is negligible relative to the other countries inflation. Therefore, we can consider the log change of the real OITP index as computed above as a fairly good approximation of the (average) inflation rates of the EMs expressed in U$.