POJ 4(1):19-24 (2011)
ISSN:1836-3644
Genetic variability in natural Iranian populations of Cupressus sempervirens var. horizontalis in Caspian Sea coastward assessed by SSR markers Soudeh Hafezi Shahroodian1, Davood Azadfar1, Hassan Soltanloo2*, S. Sanaz Ramezanpour2 1
Forestry Dept., Gorgan University of Agricultural Sciences and Natural Resources, Gorgan, Iran Plant Breeding and Biotechnology Dept., Gorgan University of Agricultural Sciences and Natural Resources, Gorgan, Iran
2
*Corresponding author:
[email protected] Abstract The cypress (Cupressus sempervirens var. horizontalis) is one of the east Mediterranean plant elements. This species was evaluated as one of four native conifers in Iran that has high genetic and ecologic value. It was chosen to study due to its initiate importance as one of Iranian genetic resources. This research was carried out by using SSR molecular markers to determine the genetic variation of this species in order to evaluate genetic diversity of cypress species in three sites which are protected as reservoir sites in north of Iran. Results showed that the total diversity was 0.276 in SSR molecular system. All the 8 SSR loci were polymorphic, having a total of 125 alleles among the 60 diploid individuals. The overall mean of expected and observed heterozygosity of populations was 54.18% and 62.93%, respectively. The highest and lowest PIC values were recorded for Cyp101, Cyp139 (0.33) and Cyp257 (0.19) primers. It is found that the average Genetic distance value within Mazandaran and Golestan are higher than that within Gilan. Dendrogram was constructed using UPGMA method and divided all accessions into 8 major groups. Populations were easily discriminated by the first three PCO axes, which explaining 81.41% of total variance. In conclusion, by using SSR marker systems, intra-population diversity was achieved more than inter-population diversity. Keywords: Cypress, genetic diversity, SSR marker, Cluster analysis Introduction unregulated forest utilization, burning, grazing and cypress canker disease (Kayacik et al., 1979; Raddi and Sumer, 1999; Sumer, 1987). Genetic studies on C. sempervirens with isozyme markers showed that genetic variation was higher in natural populations than in domesticated ones (Korol et al., 1997; Papageorgiou et al., 1993, 1994, 2005; Raddi and Sumer, 1999). Genetic markers have also been used to study genetic diversity in other cypress species in the Mediterranean (Bartel et al., 2003; Bechir et al., 2004; Rushforth et al., 2003). However, the genetic structure of C. sempervirens has not yet been investigated with DNA molecular markers at the wide-range scale (Bagnili and Vendramin, 2009). Meanwhile, so far, quantitative information on the gene pool of natural relict stands of C. sempervirens L. is available only for several Greek populations (Papageorgiou et al., 1994; Papageorgiou, 1995); information is lacking on the gene pool of other geographic regions where this species grows naturally. Contrary to a previously published opinion (Liphschitz and Biger, 1989), natural occurrences of this species, that could be used as seed sources, are not known to have existed in Cis Jordan during recent centuries, although this area is included within the phytogeographical range of C. sempervirens L. (Bagnili and Vendramin, 2009; Zohary, 1973). The conservation of what remains of this species should be based on the knowledge of its genetic diversity and characteristics. In the present investigation, microsatellite (simple sequence repeat) variability was surveyed in natural populations of Cupressus sempervirens located in 3 regions at the north of Iran to achieve genetic information useful for gene conservation by
Settlement and development of Mediterranean regions have an ancient history and have often resulted in habitat fragmentation and in a reduction of biological diversity (Franklin, 1992; Harris, 1984; Raddi and Sumer, 1999). Cupressus sempervirens, Cedrus libani, Pinus leucodermis and Abies nebrodensis are some of the Mediterranean tree species, for which millennia of strong human pressure left only small areas of forest (Boscherini et al., 1994; Makkonen, 1967; Raddi and Sumer, 1999; Vendramin et al., 1996). In the Mediterranean region, Cupressus sempervirens L. is a very important forest tree species for multiple purposes in forestry because of its ability to grow in adverse environments such as calcareous, clayish, dry and poor soils (Gallis et al., 2006; Xenopoulos et al., 1990) and has an important role in the landscape, local economy, symbolism and culture (Bagnili and Vendramin, 2009). Due to the importance of C. sempervirens L. for afforestation and ornamental and windbreak plantings all around the Mediterranean region and in other parts of the world, where this species has been introduced, there is considerable interest in the geographic patterns of genetic variation (Korol et al., 1997). No other forest tree has been subjected to such a high level of appreciation by humans in the Mediterranean region (Bagnili and Vendramin, 2009). At present, the natural geographic distribution of Cupressus sempervirens is characterized by disjunct and often relic populations growing in Iran, Syria, Jordan, Lebanon, Libya, the Aegean islands, Crete, Turkey and Cyprus (Zohary, 1973) probably originating from larger areas occupied during the Tertiary (Axelrod, 1958) and reduced mainly by intensive and
19
Table 1. Characteristics of dinuclotide microsatellite loci developed for C. sempervirense (Sebastiani et al., 2005; Valgimigli et al., 2005). Locus name
Primer sequence 5`->3`
Repeated motif
Cyp52 AY854181
F-CATCCACTGCCAATACTTTT R-AGCATCTTCCCATTACTTGA
(GT)21
Cyp84 AY854182
F-CATTTCAATTTGCATAAGTTCT R-GCAATGGGATGACTACAAAA
(GT)13(TC)23
Cyp101 AY854183
F-AGGCCACACTCAAACTTATG R-ATGACAATGGGTGAAGTCAT
(GT)12
Cyp139 AY854184
F-ACAACTAGAGAGGGAGTGAAAA R-TGGTTGAAACAATAAAGGAGA
(GA)19
Cyp250 AY854186
F-ATGGATGCAAGAGATTTTGT R-TGGTCCGATAGAAGTACTCG
(GT)16
Cyp257 AY854187
F- AACTTGCACATTTAGGGATG R-TGATGGAATAACATGGACAG
(GT)10(TA)4
Cyp258 AY854188
F-AATTTGGGCTCATGAAATTA R-TCTAGACCGATTCTATGGTCA
(GT)12
Cyp293 AY854189
F-GGCAAGTAATGAAACTCCAC R-TACAAACATGCATGGCTAAC
(GT)14
(i) estimating levels of genetic diversity, (ii) determining how genetic variation is partitioned among populations and (iii) comparing diversity values between 3 natural cypress populations. Materials and methods Needle samples were collected from 60 cypresses in 3 different natural sites in north of Iran (Fig. 1). Individuals were chosen at random with a diameter larger than 30 cm at the middle of sites and sampling were done from 5 cm long shoot tips at southern direction and same height of crown. Shoot tips were wrapped in aluminum foil, labeled, freezed in liquid nitrogen and then stored in -80°C before DNA isolation. Total genomic DNA was isolated using the DNeasyTM Plant Mini Kit (QIAGEN) (Valgimigli et al., 2005). DNA was qualified on ethidium bromide stained agarose gels and spectrophotometer was used to determine the DNA yield and purity (Doulis et al., 2000). Eight primers developed by Sebastiani et al., (2005) and Valgimigli et al., (2005) were used for genetic analysis on C. sempervirens (Table 1). PCR was performed in a final volume of 12.5 µl, containing 25 ng of DNA, 1x reaction buffer, 0.2 mM of each dNTP, 4mM MgCl2 and 0.8 µM of each primer and 0.75 U Taq polymerase. The following temperature profile was used for amplification: 94°C for 3 min, then 35 cycles of 94°C for 1 min, 60°C for 30 s and 72°C for 1 min, ending with 72°C for 5 min. 5 µl of each PCR product were loaded on 1% agarose gel, run in 1X TAE buffer, stained with ethidium bromide and photographed under UV light to control the success of the amplifications and to qualify fragments. Then PCR products were labeled with SybrGold fluorescent dye (Invitrogen, Canada) and were loaded on 5% polyacrylamide gels in GS2000 (Corbette Australia). Electrophoresis was performed at 1200 volt constant power in TBE (1X) buffer as a running buffer, and stopped depending on the real-time dimension of digital image and expected product size of each primer set. Molecular sizes of the amplified fragments were estimated using a 100-bp ladder. Digitally captured image subjected to future analysis. All the genotypes were scored by
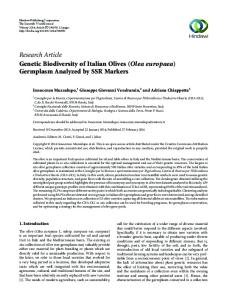
Fig 1. Map of North of Iran and location of Gilan, Mazandaran and Golestan selected as for sample collection. eye, to attribute the exact allele size when ambiguous. Presence and absence of alleles corresponding to SSR markers were scored as 1 and 0, respectively. Proportion of polymorphic loci (P) and allelic polymorphism information content (PIC) were used to assess the genetic diversity. P = the number of polymorphic loci/all of the number loci for all populations. PIC was calculated as described by Anderson et al. (1993): PIC = 1-Σ(Pi)2, where Pi is the proportion of the population carrying the ith allele, calculated for each microsatellite locus. Number of alleles (Na), Number of effective alleles (Ne), F-Statistics and genetic similarity were done with the PopGene Version 1.31 software. Cophentic correlation was used to choose the best clustering method and similarity coefficient. According to cophentic correlation resluts, a similarity matrix was generated using the Nei’s genetic distance (Nei, 1972). Similarity data were processed through unweighted pair-group method (UPGMA) cluster
20
Table 2. Information for each locus Primer Range (bp) Na Ne PIC Ht Hs Gst %He %Ho Cyp52 139-186 23 1.42 0.27 0.27 0.26 0.05 55.38 47.46 Cyp84 226-228 9 1.37 0.23 0.23 0.21 0.09 62.94 37.29 Cyp101 174-210 13 1.59 0.33 0.33 0.30 0.08 47.27 52.23 Cyp139 217-270 20 1.54 0.33 0.31 0.30 0.07 53.98 64.56 Cyp250 136-152 14 1.41 0.28 0.27 0.26 0.03 45.50 40.68 Cyp257 157-183 15 1.27 0.19 0.19 0.18 0.03 71.69 92.59 Cyp258 220-256 18 1.38 0.24 0.24 0.23 0.03 72.83 96.55 Cyp293 179-194 13 1.38 0.25 0.25 0.21 0.12 61.08 96.67 Mean 1.42 0.27 0.26 0.25 0.06 54.18 62.93 Number of alleles (Na), Number of effective alleles (Ne), Polymorphic Information Content (PIC), Total genetic diversity in all populations of a site (Ht), Intrapopulation genetic diversity (Hs), Proportion of genetic diversity residing among populations within a site (Gst), percent of expected heterozygosity over all samples (He), percent of observed heterozygosity over all samples (Ho). Table 3. Nei's genetic identity (above diagonal) and genetic distance (below diagonal) Site Gilan Mazandaran Golestan Gilan **** 0.9645 0.9861 Mazandaran 0.0361 **** 0.9639 Golestan 0.0140 0.0368 ****
Fig 2. The high level of polymorphism resolved on 5% Polyacrylamide gel and amplified DNA fragment generated by Cyp52 primers fluorescently visualized in GS2000. Numbers refer to samples collected from each place. analysis conducted using NTSYSpc 2.02e program (Rohlf, 1998). SAS v.9.1 was used to distinguish the best cut line using CCC plot, pseudo F and T2 parameters . Principal Coordinate Analysis (PCO) was conducted by using GenAlex v.6.2. This multivariate approach was chosen to complement the cluster analysis information, because cluster analysis is more sensitive to closely related individuals, whereas PCO is more informative regarding distances among major groups (Hauser and Crovello, 1982).
shown in Tab. 2. Total genetic diversity (Ht) among all the populations and all primers was highest in Cyp101 (0.33) and lowest in Cyp257 (0.19). Intrapopulation genetic diversity (Hs) in populations and all primers was highest in Cyp101 and Cyp139 showed the highest (0.30) and Cyp257 (0.18) lowest intrapopulation genetic diversity allover populations. The proportion of the total diversity among populations (Gst) was high in Cyp293 (0.12); its mean value was 0.06. The PIC value was also estimated, as shown in Tab. 2, and the highest and lowest values of 0.33 and 0.19 were recorded for Cyp101, Cyp139 and Cyp257, respectively. As shown in Tab. 3, the average genetic distance value within Mazandaran and Golestan are higher than that within Gilan. This suggests that there should be a much higher genetic diversity within Mzandaran and Golestan. It can also be seen that the average genetic distance value between Golestan and Gilan is lower than those between Mazandaran and Gilan, Mazandaran and Golestan. These indicate that there might be a much closer relationship between Golestan and Gilan than that between Mazandaran, Golestan, and Mazandaran, Gilan. To study the genetic relationships of Golestan, Gilan, and Mazandaran, the Nei's genetic identity matrix was used for cluster analysis, by using the UPGMA method (Fig. 3). A dendrogram was constructed, which divided all accessions into 8 major groups, group I containing some individuals of the Gilan, and
Results PCR amplifications produced results for all 8 SSR loci in all individuals. Fig. 2 showed amplified DNA fragment generated by Cyp52 primers fluorescently visualized in GS2000. One to two alleles were detected in each sample by using 8 SSR markers. All the 8 loci were polymorphic, having a total of 125 alleles among the 60 diploid individuals. The number of observed alleles in all the population per locus varied from 9 to 23 (Tab. 2). The average number of effective alleles per locus was 1.42 (range from 1.27 to 1.59); the overall mean for expected heterozygosity of populations was 54.18% (range from 45.50% to 72.83%); and average of observed heterozygosity of populations was 62.93% (range from 37.29% to 96.67%). Parameters of genetic diversity are
21
3 2 3
1
3 1
2
3 2 3 1 Fig 3. UPGMA dendrogram based on SSR Nei’s genetic distance matrix.1:some individuals of Golestan population; 2: some individuals of Mazandaran population; 3: some individuals of Gilan population. group II containing individuals of Gilan, Golestan and Mazandaran, group III containing some individuals of Mazandaran, group (4) containing two individuals and group (5) containing one individual of Gilan, group (6) containing one individual of Mazandaran and two individuals of Gilan. Group (7) containing one individual of Gilan and group (8) containing one individual of Golestan. This suggested that Golestan and Gilan had a closer relationship, but their relationship with Mazandaran was distant. Using PCO analysis, based on the same matrix, we had a better representation of genetic relationship between population and individuals (Fig. 4). Gilan, Mazandaran and Golestan were easily discriminated by the first three PCA axes (21.74%, 18.60% and 41.07% of the total variance explained respectively, in total was 81.41%). Mazandaran turned out to
be widely scattered and groups of populations are not strictly defined on the basis of geographic distance, for example: individuals from Golestan are more similar to the Gilan individuals. Mazandaran individuals cluster on one side of the graphic are fairly distant. Discussion Among plants, conifers stand out as wind-pollinated, longlived and highly fecund taxa. Studies of geographic variation in conifers with genetic markers have revealed that most have high levels of genetic variation within populations and little differentiation among populations. Typically, 90% or more of the total genetic variation is found within populations (Bucci and Menozzi, 1995; Hamrick et al., 1989). This study
22
represents the first large-scale analysis with nuclear molecular markers to assess genetic diversity of Cupressus sempervirens in Iran, a Mediterranean tree. The 8 loci analyzed differed greatly in the level of variability, from loci with few variants for allele to others with abundant polymorphism for alleles widely differing in size. The microsatellites allele frequency distributions of the eight SSR was very different from a distribution “under stepwise mutation model”, and seemed affected by drift and selection that have removed some alleles sizes while randomly selecting others to be greatly over-represented. Less common alleles could represent introduction of foreign plants or more recent mutations (Valgimigli et al., 2005). All the 8 loci were polymorphic, having a total of 125 alleles among the 60 diploid individuals. Previous studies conducted on cypress based on ISSR analysis using 10 primers was carried out on 92 different samples in China. At the species level, 136 polymorphic loci were detected (Bingqing et al., 2006) and SSR analysis using 8 primers have a total of 104 alleles among the 598 individuals (Valgimigli et al., 2005). With Comparing He and Ho calculated on loci developed for C. sempervirens L. by Sebastiani et al., (2005) and Valgimigli et al., (2005) with the results obtained in this study, several differences were revealed. The expected and observed heterozygosity in the Iranian populations was higher than the one previously estimated by Sebastiani et al., (2005) and Valgimigli et al., (2005). This may indicate that the Iranian populations are more variable than the “potentiality” of this species (Fig. 3). This should be very useful for future study on clonal identification (Ledig, 1992). The expected mean for genetic diversity among Iranian populations found with SSR (H exp = 0.27) were on the same order than the one found with isoenzymes polymorphic loci in Turkish, Greek and Israeli populations of C. sempervirens where interpopulation variability averaged respectively Hexp = 0.350, 0.400 and 0.479. (Raddi and Sumer, 1999; Schiller and Leonid, 1997; Sumer, 1987). A dendrogram was constructed based on Nei’s genetic distance between populations with the UPGMA method and a PCO was performed on the same matrix to have better two-dimensional representation of relationship between populations. Populations were divided into eight main clusters that roughly reflect geographic distribution. There is no possibility of genetic transferring between the geographic distances of the populations. The little variety of the genetic between the populations may be because of being the same original species. In conclusion, by using SSR marker systems, intra-population diversity was achieved more than inter-population diversity. SSR is a very good molecular tool to investigate genetic variability of C. sempervirens. To increase knowledge about the cypress genetic structure we also recommend further analysis using dominant molecular markers such as AFLP to have a better resolution power.
Bagnili G, Vendramin G (2009) Is Cupressus sempervirens native in Italy? An answer from genetic and palaeobotanical data. Mol Ecol 18: 2276–2286 Bartel JA, Adams RP, James SA, Mumba LE, Pandey RN (2003) Variation among Cupressus species from the western hemisphere based on random amplified polymorphic DNAs. Biochem Syst Ecol 31: 693–702 Bechir A, El Mousadik A, Pichot C (2004) Allozyme diversity of natural and introduced cypress stands in Morocco: consequences for management of genetic resources. Ann For Sci 61: 669–676 Bingqing H, Wang L, Mu L, Yao L, Zhang R, Tang M, Bao W (2006) A Study of Conservation Genetics in Cupressus chengiana, an Endangered Endemic of China, Using ISSR Markers. J Biochem Genet 44: 29-43 Boscherini G, Morgante M, Rossi P, Vendramin GG (1994) Allozyme and chloroplast DNA variation in Italian and Greek populations of Pinus leucodermis. Heredity 73: 284290 Bucci G, Menozzi P (1995) Genetic Variation of Rapd Markers in a Picea Abies Karst. Population. Heredity 75: 188-197 Doulis AG, Harfouche AL, Aravanopoulos FA (2000) Rapid, High Quality DNA Isolation from Cypress (Cupressus sempervirens L.) Needles and Optimization of the RAPD Marker Technique. Plant Mol Biol Rep 17: 1–14 Franklin JF (1992) Scientific basis for new perspectives in forests and streams. In: Naiman RJ (Ed) Watershed Management: Balancing Sustainability and Environmental Change. Springer, New York Gallis AT, Doulis AG, Papageorgiou AC (2006) Variability of Cortex Terpene Composition in Cupressus sempervirens L. provenances grown in Crete, Greece. Silvea Genet 56 (6): 294- 299 Hamrick JL, Godt MJW (1989) Allozyme diversity in plant species. In: Brown AHD, Clegg MT, Kahler AL, Weir BS (Eds) Plant Population Genetics, Breeding and Genetic Resources, Sinauer, Sunderland MA Harris LD (1984) The Fragmented Forest: Island Biogeography Theory and the Preservation of Biotic Diversity. University of Chicago Press, Chicago, IL Hauser LA, Crovello TJ (1982) Numerical analysis of genetic relationships in Thelypodieae (Brassicaceae). Syst Bot 7: 249–268 Kayacik H, Yaltirik F, Elicin G (1979) The floristic composition of the Italian cypress (Cupressus sempervirens L.) forest within the Antalyas region in Turkey. Webbia 34: 145-153 Korol L, Kara N, Isik K, Schiller G (1997) Genetic differentiation among and within natural and planted Cupressus sempervirens L. eastern Mediterranean populations. Silvae Genet 46: 151– 155 Ledig FT (1992) Human impacts on genetic diversity in forest ecosystem. Oikos 63: 87-108 Liphschitz N, Biger G (1989) Cupressus sempervirens in Israel during antiquity. Israel J Bot 38: 35–45 Makkonen O (1967) Ancient forestry. An historical study. Part I. Facts and information on trees. Acta For Fennica 82: 1-84 Nei M (1972) Genetic distance between populations. Am Naturalist 106: 283 – 292 Papageorgiou AC, Bergmann F, Gillet E, Hattemer HH (1993) Genetic analysis of isozyme variation in Mediterranean cypress (Cupressus sempervirens L.). Silvae Genet 42: 109–111
References Anderson JA, Churchill GA, Autrique JE, Tanksley SD, Sorrells ME (1993) Optimizing parental selection for genetic linkage maps. Genome 36:181−186 Axelrod DI (1958) Evolution of the Madro Tertiary geoflora. Bot Rev 24: 433-509 Barrett SCH, Kohn JR (1991) Genetic and evolutionary consequences of small population size in plants: implications for conservation. In: Falk DA, Holsinger KE (Eds) Genetics and Conservation of Rare Plants. Oxford University Press, New York
23
Papageorgiou AC, Panetsos KP, Hattemer HH (1994) Genetic differentiation of natural Mediterranean cypress (Cupressus sempervirens L.) populations in Greece. For Genet. 1:1–12. Papageorgiou AC (1995) Genetische Untersuchungen zur Züchtung und Generhaltung bei der Mittelmeerzypresse (Cupressus sempervirens L.) in Griechenland. Ph. D.Dissertation, The Georg- August University, Goettingen. Goettingen Research Notes in Forest Genetics, 138 pp Papageorgiou AC, Finkeldey R, Hattemer HH, Xenopoulos S (2005) Genetic differences between autochthonous and breeding populations of common cypress (Cupressus sempervirens L.) in Greece. Eur J For Res 124: 119–124 Raddi S, Sumer S (1999) Genetic diversity in natural Cupressus sempervirense L. populations in Turkey. Biochem Syst Ecol 27: 799-814 Rohlf FJ (1998) NTSYS-pc, Numerical taxonomy and multivariate analysis system, version 2.02. Exeter Software, New York, USA. Rushforth K, Adams RP, Zhong M, Ma XQ, Pandey RN (2003) Variation among Cupressus species from the eastern hemisphere based on random amplified polymorphic DNAs. Biochem Syst Ecol 31: 17–24 Sebastiani F, Buonamici A, Fineschi S, Racchi ML, Raddi P, Vendramin GG (2005) Novel polymorphic nuclear microsatellites in C. sempervirens L. Mol Ecol Notes 5: 393-395
Schiller G, Leonid K (1997) Electrophoretic analysis of diversity within C. sempervirens L. growing in Israel. Israel J Plant Sci 45: 1-8 Sumer S (1987) The Distribution of Cypress (Cupressus L.) In Turkey and the current status in its pests and diseases, especially cypress canker disease. Istanbul Universities Orman Fakultesi Dergisi. Seri a 37: 46-66 Valgimigli MC, Monaco LH, Furini A, La Porta N (2005) Genetic variability in Italian populations of Cupressus sempervirens L. by SSR and RAPD markers. Dottorato Di Ricerca in Biotecnologie Molecolari Industrialie Ambintali. Universita Degli Studi Di Verona. Vendramin GG, Michelozzi M, Lelli L, Tognetti R (1996) Genetic variation in Abies nebrodensis: a case study for a highly endangered species. For Genet 2: 171-175 Xenopoulos S, Anderoli C, Pancones A, Pinto Ganhao J, Tuset JJ (1990) Importance of cypress In: Progress in EEC Research on Cypress Diseases. Agrimed Research Programme. Commission of the Eur. Communities, Agriculture, Report, EUR 12493 EN. pp 1–13. Zohary M (1973) Geobotanical Foundation of the Middle East. Gustav Fischer Verlag, Stuttgart.
24