Turkish Journal of Field Crops, 2012, 17(2):145-150
GENETIC DIVERSITY OF COMMON BEAN (Phaseolus vulgaris L.) LANDRACES GROWN IN NORTHEAST ANATOLIA OF TURKEY ASSESSED WITH SIMPLE SEQUENCE REPEAT MARKERS Maya Izar KHAIDIZAR1, Kamil HALILOGLU2, Erdal ELKOCA2*, Murat AYDIN2, Faik KANTAR3 1
Strategic Resource Research Center Development Institute (MARDI), Kuala Lumpur, MALAYSIA 2 Department of Agronomy, Faculty of Agriculture, Ataturk University, Erzurum, TURKEY 3 Department of Agricultural Biotechnology, Faculty of Agriculture, Akdeniz University, Antalya, TURKEY *Corresponding author:
[email protected] Received: 24.04.2012 ABSTRACT
Simple sequence repeat (SSR) marker system was used to analyze the genetic diversity of 38 common bean landraces grown in Northern Anatolia Region and their relationship to twelve nationally registered cultivars. A total of 72 DNA fragments across all materials were scored using 30 primers pairs. More than 97% of the amplification products showed polymorphism, indicating high variation at the DNA level among these accessions. Pair-wise genetic similarity ranged from 0.218 to 0.759, with a mean of 0.585. Based on the SSR markers, two major clusters were formed of 50 genotypes investigated. A majority of the commercial cultivars (66.6%) and landrace accessions (84.2%) were clustered into second group, whereas, small portion of commercial cultivars (33.4%) and landrace accessions (15.7%) were clustered in to first group. A Mantel's test showed significant correlation between SSR distance matrix and cophenetic matrices. Considerable variation existed within the genotypes collected from Northeast Anatolia Region and registered cultivars that can be exploited for breeding programs. Key words: Genetic relationships, molecular markers, UPGMA
INTRODUCTION Crop plants rely on the broad genetic base of variation in order to adjust and adapt themselves for ever changing environments and pathogens. Characterization of germplasm using molecular marker techniques provides quantitative estimates of genetic diversity and the information which is essential for a rational utilization of germplasm in breeding programs. Common bean is a crucial food legume consumed worldwide. Genetic diversity in common bean have been studied using different molecular markers such as allozymes (Singh et al., 1991; Santalla et al., 2002), AFLP (Lioi et al., 2005; Svetleva et al., 2006), RAPD (Ocampo et al., 2005, Martins et al., 2006; Marotti et al., 2007), RFLP (Nodari et al., 1992), and ISSR (Svetleva et al., 2006; Marotti et al., 2007). Simple sequence repeats (SSRs), also termed microsatellites, are widely scattered at many different loci throughout the genome (Tautz and Renz, 1984; Kandemir et al., 2010). These small repetitive DNA sequences provide the basis for a PCR-based, multi-allelic, codominant genetic marker system (Saghai Maroof et al., 1994). Polymorphisms revealed by PCR amplification are due to the variation in the number of repeats in a defined region of the genome. The utility of SSR markers is due to their abundant distribution and high polymorphism in the
whole genome and power to distinguish between closely related genotypes. Simple sequence repeats (SSRs) have been used to construct a PCR-based genetic map (Blair et al., 2003), to identify genetic variability (Gomez et al., 2005; Blair et al., 2006; Buso et al., 2006; Sarikamis et al., 2009), and to develop multiplex SSR-PCR in common bean (Masi et al., 2003). In Turkey, dry beans are an important staple food and Turkey is an important producer in the world with annual production of 212,758 tons (FAO, 2010). There are limited molecular characterization studies that partially screened the common bean genotypes collected from the Black Sea region (Balkaya, 1999; Balkaya and Yanmaz, 2002) and Ercis – Gevas distric of Van province (Sarikamis et al., 2009). Northeast Anatolia of Turkey is one of main players of the common bean production in the country. However, genetic characterization of the common bean genotypes from this region has not been determined yet. Northeast Anatolia of Turkey differs significantly from the Black Sea region and Van province in terms of climate and elevation. Therefore, it is important to characterize the common bean germplasm from this region and determine the agronomically important genes that can potentially be integrated into future bean breeding programs.
145
The purpose of this study was to evaluate the level of genetic diversity present in the ecotypes from this region and compare them with twelve nationally registered cultivars. We believe that the information presented here will benefit in selection program and increase the efficiency of bean breeding programs. MATERIALS AND METHODS Plant material
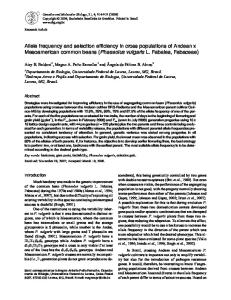
collected as part of The Scientific and Technological Research Council of Turkey (TUBITAK) supported project (Collection and Evaluation of Dry Bean Gene Resources from Northeastern Anatolia and Çoruh Valley TOVAG 107O400) from Northeast Anatolia of Turkey (Elkoca et al., 2010). A total of 38 common bean genotypes together with twelve nationally registered cultivars were used for SSR analysis (Table 1, 2 and Figure 1).
The common bean genotypes used in this study were Table 1. List of common bean genotypes by collection and coordinates. Accession No 3 31 40 51 58 63 69 77 91 106 107 115 142 188 240 242 244 252 254 257 264 268 275 278 296 302 303 308 318 320 328 332 335 338 351 358 361 368
Location
Latitude
Longitude
Altitude (m)
Kuruçalı Village Narman/Erzurum Yanıktaş Village Narman/Erzurum Kaleboğazı Village Oltu/Erzurum Burnaz Village Karaçoban/Erzurum Alacayar Village Narman/Erzurum Penek Village Şenkaya/Erzurum Gözalan Village Şenkaya/Erzurum Alabalık Village Narman/Erzurum Yeniköy Village Otlukbeli/Erzincan Şekerli Village Narman/Erzurum Çatalsöğüt Village Oltu/Erzurum Çatalsöğüt Village Oltu/Erzurum Kilimli Village Narman/Erzurum Petekli Village İspir/Erzurum Burnaz Village Karaçoban/Erzurum Hınıs/Erzurum Ortaköy Village Hınıs/Erzurum Konursu Village /Bayburt Konursu Village /Bayburt Konursu Village /Bayburt Ballıkaya Village /Bayburt Nişantaşı Village /Bayburt Cevizli Village Uzundere/Erzurum Çağlayan Village Uzundere/Erzurum Arılı Village Tortum/Erzurum Doruklu Village Tortum/Erzurum Esendurak Village Tortum/Erzurum Kemerkaya Village Tortum/Erzurum Olur/Erzurum Olur/Erzurum Torul/Gümüşhane Torul/Gümüşhane Aşağıçayırlı Village Olur/Erzurum Aşağıçayırlı Village Olur/Erzurum Altunkaya Village Olur/Erzurum Altunkaya Village Olur/Erzurum Altunkaya Village Olur/Erzurum Çayırçukur Village Kürtün/Gümüşhane
40.393° 40.274° 40.523° 39.364° 40.282° 40.662° 40.639° 40.430° 39.999° 40.313° 40.405° 40.405° 40.327° 40.418° 39.364° 39.360° 39.403° 40.403° 40.403° 40.403° 40.371° 40.356° 40.627° 40.667° 40.369° 40.381° 40.326° 40.319° 40.820° 40.820° 40.550° 40.550° 40.876° 40.876° 40.877° 40.877° 40.877° 40.665°
41.907° 41.858° 41.899° 41.994° 41.895° 42.288° 42.262° 41.936° 40.114° 41.925° 42.005° 42.005° 41.992° 40.914° 41.994° 41.700° 41.642° 40.267° 40.267° 40.267° 40.389° 40.048° 41.718° 41.689° 41.480° 41.443° 41.448° 41.442° 42.130° 42.130° 39.290° 39.290° 42.279° 42.279° 42.248° 42.248° 42.248° 39.141°
1615 1650 1485 1580 1690 1185 1489 1560 1790 1625 1595 1595 1770 1480 1580 1720 1905 1620 1620 1620 1480 1605 1205 970 1450 1749 1525 1715 1330 1330 933 933 1755 1755 1520 1520 1520 1232
Table 2. List of nationally registered common bean cultivars used in this study. Cultivars Sahin 90 Yakutiye 98
Gungor Tezibaba
Sehirali 90 Kantar 05
Onceler 98 Akman 98
Goynuk 98 Elkoca 05
Aras 98 Eskisehir 855
DNA Extraction Bulk immature unifoliate leaves from each genotype were used for extracting DNA as described by Dellaporta et al. (1983). SSR analysis
Figure 1. Locations of 38 common bean genotypes collected from Northeast Anatolia.
Thirty SSR primer pairs were selected from previous studies based on their reliable amplification patterns and high polymorphic information contents (Table 3). The reactions were performed in 0.2 µl tubes in Mastercycler personel apparatus (Eppendorf, Germany) programmed to cycle 45 times under the following conditions: for the first two cycles, denaturation for 30 s at 94oC, annealing for 60 s at 37oC, and elongation for 2 min at 72oC; second two 146
cycles, denaturation for 30 s at 94oC, annealing for 60 s at 50oC, and elongation for 2 min at 72oC; the subsequent 41 cycles were run with the denaturation temperature reduced to 93oC, followed by a 4-min hold at 72oC. After amplification, the reaction products were separated by
electrophoresis in 3% agarose gels, stained with ethidium bromide, and photographed under ultraviolet light with Nikon Coolpix5000. A total of 30 SSR primer pairs were used based on the band resolution and polymorphism they provided.
Table 3. Thirty SSR primers were used for diversity screening. The list of primer is as follows: Marker Name
Motifs
Forward (5’ – 3’)
Backward (5’ – 3’)
Source; Year
BMd-1 BMd-15 BMd18 BM053 BM114 BM137 BM141 BM143 BM152 BM153 BM154 BM156 BM160 BM161 BM167 BM175 PV-CTT001 PV-AT001 PV-AG004 PVBR14 BM183 BM187 BM188 BM199 BM200 BM209 BM210 BM211 BMd-42 GATS91
(AT)9
CAAATCGCAACACCTCACAA TTGCCATCGTTGCTTAATTG AAAGTTGGACGCACTGTGATT TGCTGACCAAGGAAATTCAG AGCCTGGTGAAATGCTCATAG CGCTTACTCACTGTACGCACG TGAGGAGGAACAATGGTGGC GGGAAATGAACAGAGGAAA AAGAGGAGGTCGAAACCTTAAATCG CCGTTAGGGAGTTGTTGAGG TCTTGCGACCGAGCTTCTCC CTTGTTCCACCTCCCATCATAGC CGTGCTTGGCGAATAGCTTTG TGCAAAGGGTTGAAAGTTGAGAG TCCTCAATACTACATCGTGTGACC CAACAGTTAAAGGTCGTCAAATT GAGGGTGTTTCACTATTGTCACTGC GGGAGGGTAGGGAAGCAGTG TTGATGACGTGGATGCATTGC ACGCCATCCACCATCCTT CTCAAATCTATTCACTGGTCAGC TTTCTCCAACTCACTCCTTTCC TCGCCTTGAAACTTCTTGTATC AAGGAGAATCAGAGAAGCCAAAAG TGGTGGTTGTTATGGGAGAAG CAACCAATGAATGCTGACAATG ACCACTGCAATCCTCATCTTTG ATACCCACATGCACAAGTTTGG TCATAGAAGATTTGTGGAAGCA GAGTGCGGAAGCGAGTAGAG
GTCGGAGCCATCATCTGTTT TTGGAGGAAGCCATGTATGC TCGTGAGGTAGGAGTTTGGTG GGAGGAGGCTTAAGCACAAA CATGCTTGTTGCCTAACTCTCT CCGTATCCGAGCACCGTAAC CTCACAAACCACAACGCACC ATGTTGGGAACTTTTAGTGTG CCGGGACTTGCCAGAAGAAC TGACAAACCATGAATATGC CTGAATCTGAGGAACGATGACCAG TGCTTGCATCTCAGCCAGAATC CGCGGTTCTGATCGTGACTTC TTCCAATGCACCAGACATTCC CCTGGTGTAACCCTCGTAACAG CCACTCTTAGCATCAACTGGA TTCATGGATGGTGGAGGAACAG GCGAACCACGTTCATGAATGA AAAGGGCTAGGGAGAGTAAGTTGG TGAGAAAGTTGATGGGATTG TCTTACAGCCTTGCAGACATC TGTGTTTGTGTTCCGAATTATGA CCCTTCCAGTTAAATCAGTCG TGAGGAATGGATGTAGCTCAGG ATTTGTCTCTGTCTATTCCTTCCAC CAATTTCTTGATTGAAAGGCAAT CCCTCATCCTCCATTCTTATCG CCACCATGTGCTCATGAAGAT TGAGACACGTACGAGGCTGTAT TGTCACCTCTCTCCTCCAAT
Yu et al. 2000 Blair et al. 2003 & 2006 Blair et al. 2003 & 2006 Blair et al. 2003 & 2006 Blair et al. 2003 & 2006 Blair et al. 2003 & 2006 Blair et al. 2003 & 2006 Blair et al. 2003 & 2006 Blair et al. 2003 & 2006 Blair et al. 2003 & 2006 Blair et al. 2003 & 2006 Blair et al. 2003 & 2006 Blair et al. 2003 & 2006 Blair et al. 2003 & 2006 Blair et al. 2003 & 2006 Blair et al. 2003 & 2006 Yu et al. 1999 Yu et al. 1999 Blair et al. 2003 & 2006 Buso et al.2006 Gaitan-Solis et al. 2002 Gaitan-Solis et al. 2002 Gaitan-Solis et al. 2002 Gaitan-Solis et al. 2002 Gaitan-Solis et al. 2002 Gaitan-Solis et al. 2002 Gaitan-Solis et al. 2002 Gaitan-Solis et al. 2002 Blair et al. 2003 & 2006 Blair et al. 2003 & 2006
(TA)8(GT)10 (CT)33 (GA)29 (GA)35 (GA)31 (CA)5(TG)(CA)3CG(CA)10(TA)4 (CT)17 (CT)32 (GA)15(GAA)5 (GA)7(GA)8 (GA)19 (AT)5(GA)19 (CTT)3 (T)3 (CTT)6 (AT)22 (AG)8 (AG)23 (TC)14 (CT)10T(CT)14 (CA)18(TA)7 (GA)15 (AG)10 (TA)4(TG)16 (CT)15 (CT)16 (AT)5 (GA)17
Data analysis The DNA bands were scored as 0 (absence) or 1 (presence). Genetic similarity between two cultivars i and j was estimated following the formula of Nei and Li (1979). Based on the genetic similarity matrix (denoted GS), UPGMA cluster analysis were used to assess pattern of diversity among the bean entries. Dendrograms were created with the TREE program of NTSYS. All calculations were performed using the NTSYS-pc version 2.1 software (Rohlf, 2000). RESULTS Simple sequence repeat (SSR) marker system was used to analyze the genetic diversity of 38 common bean landraces grown in Northern Anatolia Region and their relationship to twelve nationally registered cultivars. A total of 72 alleles were detected. The number of alleles per locus ranged from one for Bmd-15 to 6 for BM-160 with an average number of 2.4 alleles per locus. A range of alleles of expected fragment sizes were obtained by different primer pairs with strong amplifications. Figure 2 shows SSR markers detecting different alleles. More than 97% of the amplification products showed polymorphism, indicating high variation at the DNA level among these accessions.
Pairwise genetic dissimilarity estimated among 50 genotypes was presented in Table 4. Pairwise genetic similarity ranged from 0.211 to 0.796. Based on dissimilarity index, A-320 and A-268 were the closest ones showing 79.6% similarity. On the other hand, genotype pairs A-351 and A-252 were the most dissimilar ones showing only 21.1% similarity. Based on the SSR markers, two major clusters were formed of 50 genotypes investigated (Figure 3). A majority of the commercial cultivars (66.6%) and landrace accessions (84.2%) were clustered into second group, whereas, small portion of commercial cultivars (33.4%) and landrace accessions (15.7%) were clustered in to first group.
Figure 2. Example of amplification products of primer BM200 detecting different alleles in 50 bean genotypes
147
A-278
A-358
A-31
A-296
A-240
A-106
A-51
A-188
A-77
A-242
A-252
A-332
A-302
A-361
A-351
A-142
A-115
A-264
A-58
A-320
A-275
A-63
A-268
A-107
A-338 A-278 A-358 A-31 A-296 A-240 A-106 A-51 A-188 A-77 A-242 A-252 A-332 A-302 A-361 A-351 A-142 A-115 A-264 A-58 A-320 A-275 A-63 A-268 A-107 A-318 A-91 Sahin-90 A-254 A-257 Yakutiye-98 A-40 Gungor Terzibaba A-368 Sehirali-90 Kantar-05 A-335 Onceler Akman E-5855 Goynuk Elkoca-05 A-328 A-3 Aras-98 A-244 A-69 A-308 A-303
A-338
Table 4. Pairwise genetic dissimilarity index among 50 common bean genotypes based SSR data.
0,00 0,74 0,67 0,69 0,72 0,69 0,71 0,51 0,73 0,60 0,74 0,47 0,73 0,72 0,72 0,75 0,68 0,72 0,69 0,65 0,71 0,54 0,74 0,72 0,70 0,67 0,44 0,71 0,63 0,51 0,66 0,73 0,46 0,51 0,68 0,67 0,58 0,67 0,69 0,55 0,66 0,68 0,66 0,70 0,65 0,68 0,63 0,62 0,51 0,59
0,00 0,54 0,39 0,44 0,42 0,39 0,73 0,39 0,63 0,44 0,74 0,42 0,37 0,41 0,39 0,53 0,37 0,59 0,63 0,46 0,75 0,41 0,47 0,50 0,54 0,75 0,51 0,55 0,69 0,53 0,46 0,75 0,73 0,53 0,51 0,68 0,51 0,51 0,63 0,55 0,44 0,55 0,50 0,54 0,53 0,60 0,66 0,69 0,73
0,00 0,55 0,59 0,60 0,58 0,63 0,55 0,55 0,59 0,69 0,58 0,61 0,61 0,60 0,68 0,59 0,71 0,65 0,60 0,74 0,59 0,63 0,61 0,65 0,71 0,65 0,66 0,66 0,61 0,62 0,68 0,77 0,70 0,60 0,73 0,67 0,65 0,71 0,61 0,61 0,68 0,68 0,65 0,61 0,63 0,67 0,72 0,74
0,00 0,39 0,44 0,41 0,68 0,37 0,62 0,46 0,73 0,37 0,46 0,49 0,47 0,54 0,46 0,62 0,60 0,44 0,77 0,42 0,46 0,51 0,58 0,73 0,60 0,59 0,68 0,59 0,53 0,74 0,72 0,59 0,53 0,71 0,53 0,55 0,69 0,57 0,51 0,57 0,57 0,53 0,57 0,61 0,67 0,70 0,68
0,00 0,42 0,35 0,71 0,26 0,63 0,41 0,74 0,35 0,37 0,41 0,46 0,53 0,44 0,61 0,63 0,39 0,75 0,37 0,41 0,50 0,57 0,75 0,54 0,53 0,71 0,58 0,51 0,71 0,73 0,58 0,42 0,68 0,51 0,54 0,72 0,50 0,50 0,58 0,53 0,57 0,53 0,55 0,61 0,67 0,67
0,00 0,33 0,74 0,41 0,62 0,39 0,75 0,37 0,35 0,46 0,37 0,51 0,39 0,62 0,58 0,37 0,72 0,46 0,35 0,42 0,41 0,76 0,55 0,49 0,66 0,49 0,41 0,68 0,68 0,42 0,44 0,67 0,44 0,41 0,69 0,51 0,46 0,51 0,49 0,44 0,51 0,46 0,67 0,68 0,66
0,00 0,72 0,29 0,62 0,39 0,73 0,29 0,31 0,39 0,37 0,49 0,35 0,58 0,58 0,33 0,74 0,31 0,35 0,42 0,47 0,76 0,47 0,49 0,70 0,49 0,47 0,72 0,70 0,51 0,37 0,71 0,50 0,47 0,71 0,51 0,39 0,51 0,51 0,44 0,54 0,54 0,65 0,70 0,70
0,00 0,72 0,61 0,69 0,49 0,70 0,76 0,76 0,74 0,71 0,73 0,61 0,68 0,77 0,60 0,73 0,78 0,73 0,77 0,54 0,68 0,71 0,60 0,73 0,75 0,53 0,62 0,75 0,63 0,61 0,75 0,70 0,61 0,69 0,73 0,73 0,76 0,72 0,67 0,71 0,68 0,60 0,65
0,00 0,62 0,39 0,73 0,29 0,35 0,35 0,44 0,54 0,42 0,60 0,60 0,37 0,74 0,31 0,39 0,46 0,53 0,75 0,53 0,54 0,70 0,54 0,50 0,74 0,74 0,57 0,44 0,71 0,53 0,53 0,73 0,51 0,49 0,59 0,54 0,53 0,54 0,57 0,62 0,68 0,72
0,00 0,66 0,62 0,67 0,61 0,63 0,67 0,68 0,61 0,67 0,62 0,62 0,74 0,61 0,66 0,66 0,69 0,71 0,58 0,66 0,54 0,68 0,62 0,68 0,72 0,70 0,58 0,71 0,69 0,69 0,71 0,70 0,66 0,72 0,68 0,65 0,68 0,70 0,69 0,72 0,74
0,00 0,77 0,31 0,44 0,47 0,35 0,50 0,37 0,59 0,61 0,51 0,73 0,41 0,50 0,44 0,49 0,75 0,51 0,55 0,73 0,47 0,46 0,69 0,73 0,50 0,46 0,66 0,51 0,49 0,68 0,55 0,47 0,58 0,47 0,51 0,50 0,50 0,68 0,69 0,69
0,00 0,75 0,75 0,72 0,80 0,70 0,74 0,67 0,65 0,73 0,57 0,74 0,74 0,70 0,75 0,50 0,71 0,68 0,59 0,72 0,78 0,51 0,57 0,74 0,67 0,65 0,71 0,73 0,62 0,74 0,72 0,72 0,74 0,69 0,70 0,68 0,67 0,59 0,63
0,00 0,39 0,42 0,41 0,49 0,42 0,58 0,60 0,41 0,75 0,31 0,39 0,42 0,47 0,75 0,53 0,57 0,72 0,51 0,50 0,72 0,72 0,57 0,47 0,71 0,53 0,50 0,71 0,54 0,46 0,57 0,54 0,50 0,57 0,54 0,67 0,68 0,68
0,00 0,33 0,31 0,50 0,37 0,61 0,61 0,31 0,75 0,33 0,33 0,47 0,54 0,75 0,49 0,50 0,69 0,47 0,46 0,73 0,67 0,47 0,46 0,66 0,42 0,46 0,68 0,50 0,41 0,50 0,47 0,46 0,55 0,53 0,63 0,69 0,69
0,00 0,46 0,50 0,41 0,61 0,63 0,39 0,71 0,37 0,41 0,47 0,57 0,72 0,49 0,50 0,67 0,47 0,51 0,71 0,67 0,53 0,51 0,63 0,51 0,54 0,68 0,50 0,41 0,55 0,47 0,49 0,53 0,58 0,61 0,67 0,67
0,00 0,54 0,35 0,62 0,62 0,41 0,72 0,39 0,42 0,46 0,50 0,76 0,50 0,54 0,72 0,46 0,41 0,74 0,70 0,46 0,47 0,65 0,44 0,47 0,65 0,54 0,42 0,51 0,46 0,47 0,51 0,54 0,69 0,72 0,68
0,00 0,44 0,57 0,63 0,51 0,73 0,47 0,50 0,53 0,54 0,74 0,57 0,44 0,65 0,55 0,59 0,65 0,67 0,60 0,57 0,63 0,59 0,51 0,66 0,58 0,53 0,47 0,58 0,59 0,58 0,55 0,66 0,69 0,67
0,00 0,54 0,57 0,39 0,73 0,33 0,41 0,41 0,49 0,75 0,46 0,47 0,69 0,47 0,42 0,71 0,71 0,44 0,46 0,63 0,46 0,49 0,68 0,53 0,41 0,53 0,41 0,46 0,53 0,50 0,63 0,69 0,69
0,00 0,62 0,60 0,63 0,54 0,59 0,57 0,62 0,69 0,55 0,61 0,66 0,59 0,67 0,63 0,70 0,61 0,60 0,62 0,67 0,58 0,71 0,57 0,57 0,63 0,61 0,60 0,59 0,63 0,50 0,63 0,70
0,00 0,58 0,63 0,59 0,57 0,57 0,53 0,67 0,65 0,59 0,66 0,61 0,62 0,66 0,63 0,68 0,62 0,71 0,65 0,58 0,73 0,61 0,63 0,61 0,66 0,65 0,61 0,61 0,65 0,68 0,68
0,00 0,72 0,31 0,20 0,39 0,50 0,75 0,55 0,51 0,70 0,49 0,50 0,72 0,68 0,51 0,47 0,69 0,47 0,50 0,71 0,51 0,42 0,54 0,54 0,44 0,59 0,51 0,62 0,68 0,66
0,00 0,76 0,71 0,67 0,70 0,54 0,72 0,69 0,65 0,65 0,74 0,53 0,62 0,69 0,68 0,59 0,70 0,66 0,66 0,65 0,71 0,69 0,69 0,70 0,62 0,67 0,63 0,58 0,62
0,00 0,37 0,41 0,54 0,74 0,49 0,55 0,71 0,50 0,51 0,75 0,71 0,55 0,46 0,70 0,51 0,54 0,70 0,55 0,41 0,58 0,53 0,46 0,60 0,58 0,63 0,69 0,71
0,00 0,37 0,49 0,75 0,57 0,53 0,71 0,53 0,51 0,71 0,69 0,50 0,51 0,68 0,49 0,46 0,72 0,53 0,47 0,55 0,55 0,46 0,60 0,53 0,63 0,67 0,62
0,00 0,46 0,74 0,54 0,55 0,69 0,53 0,51 0,67 0,69 0,50 0,51 0,63 0,51 0,46 0,70 0,55 0,44 0,55 0,47 0,49 0,55 0,50 0,61 0,67 0,65
148
A-303
0,00 0,50 0,54 0,53 0,53 0,63 0,65 0,69
A-308
0,00 0,44 0,37 0,35 0,50 0,50 0,61 0,65 0,69
A-69
0,00 0,53 0,53 0,55 0,57 0,55 0,50 0,51 0,60 0,62
A-244
0,00 0,68 0,63 0,66 0,68 0,65 0,68 0,72 0,71 0,63 0,59
Aras-
0,00 0,71 0,51 0,51 0,49 0,57 0,53 0,54 0,49 0,60 0,66 0,70
A-3
Elkoca-05
0,00 0,55 0,67 0,54 0,51 0,57 0,42 0,44 0,57 0,46 0,65 0,66 0,63
A-328
Goynuk
0,00 0,65 0,67 0,58 0,68 0,66 0,63 0,63 0,67 0,61 0,68 0,65 0,63 0,66
E-5855
0,00 0,69 0,58 0,50 0,71 0,54 0,46 0,57 0,54 0,50 0,54 0,49 0,60 0,66 0,70
Akman
0,00 0,59 0,63 0,39 0,51 0,63 0,55 0,50 0,55 0,41 0,42 0,60 0,50 0,66 0,65 0,65
Onceler
0,00 0,67 0,72 0,54 0,66 0,68 0,42 0,67 0,65 0,62 0,69 0,61 0,69 0,69 0,68 0,65 0,60
A-368
Terzibaba
Gungor 0,00 0,53 0,67 0,63 0,57 0,70 0,63 0,54 0,62 0,69 0,69 0,71 0,68 0,62 0,60 0,59 0,60 0,58
A-335
0,00 0,72 0,74 0,42 0,50 0,69 0,44 0,47 0,67 0,54 0,51 0,59 0,46 0,53 0,54 0,51 0,65 0,68 0,72
Kantar-05
0,00 0,57 0,65 0,65 0,55 0,54 0,63 0,57 0,51 0,66 0,58 0,41 0,53 0,53 0,46 0,50 0,50 0,61 0,69 0,73
A-40
0,00 0,65 0,68 0,65 0,65 0,67 0,66 0,68 0,70 0,66 0,63 0,67 0,62 0,60 0,65 0,61 0,58 0,67 0,61 0,60 0,69
Yakutiye98
0,00 0,53 0,50 0,54 0,65 0,67 0,53 0,54 0,68 0,54 0,49 0,68 0,50 0,47 0,41 0,50 0,54 0,47 0,50 0,59 0,60 0,67
Sehirali-90
0,00 0,51 0,61 0,54 0,55 0,70 0,70 0,57 0,50 0,65 0,55 0,60 0,69 0,59 0,42 0,59 0,49 0,50 0,57 0,59 0,62 0,68 0,72
A-257
0,00 0,75 0,70 0,61 0,68 0,75 0,54 0,54 0,70 0,75 0,60 0,69 0,73 0,55 0,68 0,68 0,72 0,70 0,65 0,72 0,68 0,62 0,49 0,61
A-254
0,00 0,73 0,60 0,51 0,70 0,49 0,47 0,68 0,68 0,54 0,58 0,67 0,55 0,50 0,69 0,57 0,54 0,57 0,54 0,55 0,59 0,49 0,65 0,66 0,68
Sahin-90
A-91
A-318 A-91 Sahin-90 A-254 A-257 Yakutiye A-40 Gungor Terzibaba A-368 Sehirali Kantar-05 A-335 Onceler Akmen E-5855 Goynuk Elkoca-05 A-328 A-3 Aras-98 A-244 A-69 A-308 A-303
A-318
Table 4. Continue
0,00 0,46 0,47 0,47 0,59 0,65 0,65
0,00 0,59 0,51 0,62 0,63 0,66
0,00 0,55 0,57 0,69 0,67
0,00 0,57 0,58 0,67
0,00 0,54 0,70
0,00 0,62
0,00
be potentially incorporated into future studies that examine the diversity within a larger collection of bean genotypes from diverse regions. We also hope that the results of this study will benefit current bean breeding efforts in Turkey as well as maintain the genetic integrity of the genetic resources.
A-338 A-91 A-252 Gungor A-51 A-275 A-308 Terzibaba Akmen Kantar-05 A-303 A-278 A-115 A-296 A-188 A-106 A-332 A-63 A-242 A-240 A-302 A-351 A-320 A-268 A-361 A-31 A-107 Sehirali Yakutiye-98 Goynuk A-3 A-328 A-40 A-368 A-335 A-318 Onceler A-244 Sahin-90 A-142 A-254 Elkoca-05 Aras-98 E-5855 A-58 A-264 A-69 A-358 A-77 A-257
Yakutiye-98MW
0.69
0.57
0.45
0.33
LITERATURE CITED
0.20
Coefficient
Figure 3. Phenogram constructed using the UPGMA method.
DISCUSSION Information about the genetic variability of genotypes helps decision making for conservation activities, which range from collecting and managing through identifying genes to adding value to genetic resources and for breeding purposes, to predict the ability to combine or to rapidly verify the breeding material (Vicente et al., 2005). Therefore, assessment of genetic variability of germplasm is a first step, named as pre-breeding, for improvement and development of superior cultivars. A range of molecular techniques can assess crop genetic diversity, however among the most ideal for distinguishing closely related germplasm are microsatellites, which are highly informative markers that detect length polymorphisms at loci with simple sequence repeats (Powell et al., 1996). Their advantages for diversity studies include uniform genome coverage, high levels of polymorphism, codominance, and an easy-toimplement, specific PCR-based assay (Pejic et al., 1998). In this study, genotypes collected from Northeast Anatolia of Turkey were evaluated at molecular level via SSR marker system. Though common bean genotypes collected from the Black Sea region (Balkaya, 1999; Balkaya and Yanmaz, 2002) and Van province region (Sarikamis et al., 2009) were previously characterized, the common bean ecotypes from Northeast Anatolia of Turkey had not been genetically characterized before. Therefore, these are important first steps regarding better understanding and maintenance of common bean germplasm of the region. Genomic SSRs selected on the basis of high polymorphism information content (Blair et al. 2003, 2006; Yu et al., 1999, 2000; Gaitan-Solis et al. 2002) successfully helped discriminate genotypes in the present study. Successful amplifications of expected sizes were obtained. The results of this study indicate that SSR analysis could be successfully used for the estimation of genetic diversity among common bean genotypes and can
Balkaya, A., 1999. A Research on Collection of Genetic Resources, Determination of Phenological and Morphological Characteristics and Selection of Suitable Types for Fresh Consumption by Pedigree Selection in Green Bean (Phaseolus vulgaris L.) in the Black Sea Region. PhD Thesis, Ondokuz Mayis University, Samsun, Turkey. Balkaya, A., R. Yanmaz, 2002. Morphological properties of cultivar nominates selected Black Sea Region bean populations and identification by protein markers. Ankara Univ. J. Agric. Sci. 9: 182-188. Blair M.W., F. Pedraza, H.F. Buendia, E. Gaitan-Solis, 2003. Development of a genome-wide anchored microsatellite map for common bean (Phaseolus vulgaris L.). Theor. Appl. Genet. 107: 1362-1374. Blair, M.W., M.C. Giraldo, H.F. Buendia, E. Tovar, M.C. Duque, S.E. Beebe, 2006. Microsatellite marker diversity in common bean (Phaseolus vulgaris L.). Theor. Appl. Genet. 113: 100-109. Buso, G.S.C., Z.P.S. Amaral, R.P.V. Brondani, M.E. Ferreira, 2006. Primer note: microsatellite markers for the common bean Phaseolus vulgaris. Molecular Ecology Notes 6: 252– 254. Dellaporta, S.L., J. Wood, J.B. Hicks, 1983. A plant DNA minipreparation: version II. Plant Molecular Biology Reporter 1: 19-21. Elkoca, E., K. Haliloglu, F. Kantar, C. Eken, F. Donmez, M. Aydin, 2010. Genetic diversity of common beans (Phaseolus vulgaris L.) grown in the northeast region of Turkey based on morphological traits. 5th International Food Legumes Research Conference (IFLRC V) & 7th European Conference on Grain Legumes (AEP VII), Legumes for Global Health, Legume Crops and Products for Food, Feed and Environmental Benefits, 26-30 April, 2010, Antalya, Turkey, pp: 36. FAO, 2010. http://faostat.fao.org/ Gaitan-Solis E., M.C. Duque, K.J. Edwards, J. Tohme, 2002. Microsatellite repeats in common bean (Phaseolus vulgaris): Isolation, characterization, and cross-species amplification in Phaseolus ssp. Crop Sci. 42: 2128-2136. Gomez, O.J., M.W. Blair, B.E. Frankow-Lindberg, U. Gullberg, 2005. Comparative study of common bean (Phaseolus vulgaris L.) landraces conserved ex situ in genebanks and in situ by farmers. Genetic Resources and Crop Evolution 52: 371-380. Kandemir, N., G. Yılmaz, Y.B. Karan, D. Borazan, 2010. Isolation of different genotypes in ‘başçiftlik beyazı’ potato landrace using ssr markers. Turkish Journal of Field Crops 15(1): 84-88. Lioi, L., A.R. Piergiovanni, D. Pignone, S. Puglisi, M. Santantonio, G. Sonnante, 2005. Genetic diversity of some surviving on-farm Italian common bean (Phaseolus vulgaris L.) landraces. Plant Breeding 124: 576-581. Marotti, I., A. Bonetti, M. Minelli, P. Catizone, G. Dinelli, 2007. Characterization of some Italian common bean (Phaseolus vulgaris L.) landraces by RAPD, semirandom and ISSR molecular markers. Genetic Resources and Crop Evolution 54: 175-188.
149
Martins, S.R., F.J. Vences, L.E.S. Miera, M.R. Barroso, V. Carnide, 2006. RAPD analysis of genetic diversity among and within Portuguese landraces of common white bean (Phaseolus vulgaris L.). Scientia Horticulturae 108: 133142. Masi, P., P.L.S. Zeuli, P. Donini, 2003. Development and analysis of multiplex microsatellite markers set in common bean (Phaseolus vulgaris L.). Molecular Breeding 11: 303313. Nei, M., W.H. Li, 1979. Mathematical model for studying genetic variation in terms of restriction endonucleases. Proc. Natl. Acad. Sci. USA 76: 5269-5273. Nodari, R.O., E.M.K. Koinange, J.D. Kelly, P. Gepts, 1992. Towards an integrated linkage map of common bean: 1. Development of genomic DNA probes and levels of restriction fragment length polymorphism. Theor. Appl. Genet. 84: 186-192. Ocampo, C.H., J.P., Martin, M.D. Sanchez-Yelamo, J.M. Ortiz, O. Toro, 2005. Tracing the origin of spanish common bean cultivars using biochemical and molecular markers. Genetic Resources and Crop Evolution 52: 33-40. Pejic I., P. Ajmone-Marsan, M. Morgante, V. Kozumplick, P. Castaglioni, G. Taramino, M. Motto, 1998. Comparative analysis of genetic similarity among maize inbred lines detected by RFLPs, RAPDs, SSRs and AFLPs. Theor. Appl. Genet. 97: 1248-1255. Powell W., M. Morgante, C. Andre, M. Hanafey, J. Vogel, S. Tingey, A. Rafalski, 1996. The comparison of RFLP, RAPD, AFLP and SSR (microsatellite) markers for germplasm analysis. Molecular Breeding 2: 225-238. Rohlf, F.J., 2000. NTSYS-pc: Numerical Taxonomy and Multivariate Analysis System. Version 2.1 Exeter Publications, New York, USA.
Saghai Maroof, M.A., R.M. Biyashev, G.P. Yang, Q. Zhang, R.W. Allard, 1994. Extraordinarily polymorphic microsatellite DNA in barley: species diversity, chromosomal locations, and population dynamics. Proc. Natl. Acad. Sci. USA 91: 5466-5470. Santalla, M., A.P. Rodino, A.M. De Ron, 2002. Allozyme evidence supporting southwestern Europe as a secondary center of genetic diversity for the common bean. Theor. Appl. Genet. 104: 934-944. Sarikamis, G., F. Yasar, M. Bakir, K. Kazan, A. Ergul, 2009. Genetic characterization of green bean (Phaseolus vulgaris) genotypes from eastern Turkey. Genetics and Molecular Research 8(3): 880-887. Singh, S.P., R. Nodari, P. Gepts, 1991. Genetic diversity in cultivated common bean: I. allozymes. Crop Sci. 31: 19-23. Svetleva, D., G. Pereira, J. Carlier, L. Cabrita, J. Leitao, D. Genchev, 2006. Molecular characterization of Phaseolus vulgaris L genotypes included in Bulgarian collection by ISSR and AFLP analyses. Scientia Horticulturae 109: 198206. Tautz, D., M. Renz, 1984. Simple sequences are ubiquitous repetitive components of eukaryotic genomes. Nucleic Acids Research 12: 4127-4138. Vicente, M.C., F.A. Guzman, J. Engels, V. Ramanatha Rao, 2005. Genetic characterization and its use in decision making for the conservation of crop germplasm. The Role of Biotechnology, 5-7 March, 2005, Villa Gualino, Turin, Italy, pp: 122-128. Yu K., S.J. Park, V. Poysa, 1999. Abundance and variation of microsatellite DNA sequences in beans (Phaseolus and Vigna). Genome 42: 27-34. Yu K., S.J. Park, V. Poysa, P. Gepts, 2000. Integration of simple sequence repeat (SSR) markers into a molecular linkage map of common bean (Phaseolus vulgaris L.). Journal of Heredity 91: 429-434.
150


![Diversity analysis of sweet potato (Ipomoea batatas [L.] Lam) germplasm from Burkina Faso using morphological and simple sequence repeats markers](https://kipdf.com/img/300x300/diversity-analysis-of-sweet-potato-ipomoea-batatas_5aea51427f8b9a33028b4647.jpg)