´ INSTITUTO NACIONAL DE MATEMATICA PURA E APLICADA
GAS-SOLID COMBUSTION IN INSULATED POROUS MEDIA
Autor: Grigori Chapiro Orientador: Prof. Dr. Dan Marchesin Co-orientadores: Dr. Alexei A. Mailybaev Prof. Dr. Johannes Bruining March 30, 2009
Abstract There is a renewed interest in using combustion for medium viscosity oil recovery. In-situ combustion involves the injection of air, pure oxygen or air enriched with oxygen or nitrogen to enable the combustion of oil and other consecutive reactions within the reservoir formation leading to the release of heat. Heat is conducted ahead of the combustion front, reduces the oil viscosity and leads to in situ distillation (upgrading). Carbon dioxide created during combustion can also assist the recovery by increasing pressure and by mixing with the oil, thus reducing its viscosity and enhancing flow. To perform computations with the model we need data on the combustion process, which is described in terms of chemical and transport aspects. Data on the combustion process must be converted to a form that can be used in the modeling. We describe in detail how this can be done. In this work one dimensional gas-solid combustion is studied with the combustion rate described by the first order mass action law combined with the Arrhenius’ law. We consider a thermally insulated cylindrical porous rock containing solid fuel. Standard simplifications are made in order to formulate the physical model, for example, the gas thermal capacity is considered small. The reactive flow of air in porous rock containing solid fuel is governed by a system of balance laws for gas mass, oxygen mass and enthalpy. We are interested in examining the Riemann solutions for the parabolic partial differential equations governing the system, which support a combustion traveling wave. The Riemann problem for adiabatic forward combustion between gas and solid fuel is solved and the combustion wave profile is obtained. In order to solve the Riemann problem we use an asymptotic expansion to construct a first order approximation of the traveling wave for a given combustion wave speed. Thus we obtain the internal structure of the combustion traveling wave. The results are validated with numerical simulations using a time-step adaptive, hybrid finite difference scheme.
Key words: porous media, combustion wave, traveling wave, singular perturbation, finite difference scheme.
i
Resumo H´a um renovado interesse na utiliza¸ca˜o da t´ecnica de combust˜ao para recupera¸ca˜o de ´oleo de viscosidade m´edia. A combust˜ao in-situ consiste na inje¸ca˜o de ar, oxigˆenio puro, ou ar enriquecido com oxigˆenio ou nitrogˆenio no reservat´orio. Assim, gera-se combust˜ao e outras rea¸c˜oes qu´ımicas, al´em da liberta¸c˜ao de calor. O calor ´e transportado para a frente da zona de combust˜ao, reduzindo a viscosidade do ´oleo, produzindo destila¸c˜ao de componentes leves do ´oleo. O di´oxido de carbono criado durante a combust˜ao ajuda na recupera¸c˜ao atrav´es do aumento da press˜ao no reservat´orio e, ao dissolver-se no ´oleo, reduzindo sua viscosidade. Para trabalhar com o modelo precisamos de dados sobre o processo de combust˜ao descrito ´ necess´ario converter estes dados para uma forma que permita seu uso em termos qu´ımicos. E na modelagem do processo. Neste texto descrevemos detalhadamente como isso ´e feito. Estudamos um modelo de combust˜ao g´as-s´olido sob escoamento unidimensional, com a taxa de rea¸ca˜o descrita pela lei da a¸ca˜o das massas de primeira ordem, combinada com a lei de Arrhenius. Consideramos um cilindro longo de rocha porosa contendo o combust´ıvel s´olido; o cilindro ´e isolado termicamente pelos lados. Para formular o modelo f´ısico, outras simplifica¸c˜oes comuns s˜ao feitas, por exemplo a capacidade t´ermica do g´as ´e desconsiderada frente `a capacidade t´ermica da rocha porosa. O fluxo no meio poroso ´e governado por um sistema de leis de balan¸co relativas `a massa de combust´ıvel, massa de g´as, massa de oxigˆenio e entalpia. Queremos estudar solu¸co˜es de Riemann para as equa¸co˜es diferenciais parciais que governam o sistema. O problema de Riemann para o problema de combust˜ao g´as-s´olido foi resolvido neste trabalho e o perfil da onda viajante de combust˜ao foi obtido. Para resolver o problema Riemann, usamos uma expans˜ao assint´otica at´e a primeira ordem para obter uma aproxima¸c˜ao da onda viajante. Assim, obtivemos a estrutura interna da onda de combust˜ao. Os resultados foram validados atrav´es da simula¸ca˜o num´erica, usando um m´etodo de diferen¸cas finitas h´ıbrido adequado `as peculiaridades do sistema de equa¸co˜es diferencias parciais.
Palavras chave: Meios porosos, ondas de combust˜ ao, ondas viajantes, perturba¸c˜ ao singular, esquemas de diferen¸cas finitas
ii
Acknowledgements Many people contributed in the past four years to the completion of this thesis. I am very thankful to everyone and sincerely sorry for all those who are not cited here explicitly. First of all I would like to thank my advisor Prof. Dan Marchesin for the support during all my time at IMPA, for the research problems he shared with me and for the guiding sentence: “The only useless knowledge is the one you do not possess”. I thank my co-advisor Dr. Alexei Mailybaev for the hours of discussions and for all the valuable advise and suggestions he gave me. I thank my co-advisor Prof. Johannes Bruining for explaining me the Chemistry that I would never understand without him. I thank Professors Andr´e Nachbin, Aparecido J. de Souza, Carlos Tomei and Jorge Zubelli for participating of the thesis committee. Special thanks to Prof. Aparecido J. de Souza for our collaborative work, his suggestions and careful reading of this text. Special thanks go to my friend Gustavo Hime for developing the PDE simulator “NITRO” and for helping me with C programming. I thank my girlfriend Sara, my parents and my little brother for the patience, support and for accepting that I dedicated much less time to them during the past years than they deserve. I thank my roommates Iuri, Jairo, Villa, Renat˜ao, Flavinho and Silvio. I thank all my friends and colleagues at IMPA. I would like to thank separately the people I met in the Fluid laboratory, my friends from the Visgraf laboratory, our small volleyball community for our regular Friday sport breaks and the snooker group for the after lunch amusement. Special thanks to my friends from room 405, Duilio, Jhon, Almir and Maria. In the last years I spent more time with you than in anywhere else. Special thanks also go to my friends Jean, Elias, Geisa, Dimas, Emilio, Ives and Julio Daniel for our long conversations about subjects far from mathematics. I would like to thank all my professors at IMPA for everything I learned during these years and IMPA’s staff for the excellent and incomparable support. Finally, I thank the CAPES and ANP-PRH32 for the financial support during these years.
iii
Contents 1 Introduction
1
2 Physical formulation
6
2.1
Mathematical model . . . . . . . . . . . . . . . . . . . . . . . . . . . . . . . . .
2.2
The nondimensionalization . . . . . . . . . . . . . . . . . . . . . . . . . . . . . . 10
2.3
Improving the model . . . . . . . . . . . . . . . . . . . . . . . . . . . . . . . . . 12
2.4
Other values of dimensionless parameters . . . . . . . . . . . . . . . . . . . . . . 13
3 Geometrical singular perturbation
7
15
3.1
Introduction . . . . . . . . . . . . . . . . . . . . . . . . . . . . . . . . . . . . . . 15
3.2
Quasi-stationary limit . . . . . . . . . . . . . . . . . . . . . . . . . . . . . . . . 16
3.3
Asymptotic series expansion . . . . . . . . . . . . . . . . . . . . . . . . . . . . . 17
4 Coflow combustion
21
4.1
Introduction . . . . . . . . . . . . . . . . . . . . . . . . . . . . . . . . . . . . . . 21
4.2
The combustion wave . . . . . . . . . . . . . . . . . . . . . . . . . . . . . . . . . 22 4.2.1
Parameter analysis . . . . . . . . . . . . . . . . . . . . . . . . . . . . . . 24
4.2.2
Combustion wave profile . . . . . . . . . . . . . . . . . . . . . . . . . . . 24
4.2.3
Physical reasonability . . . . . . . . . . . . . . . . . . . . . . . . . . . . . 33
4.3
Wave sequences . . . . . . . . . . . . . . . . . . . . . . . . . . . . . . . . . . . . 34
4.4
Conclusion . . . . . . . . . . . . . . . . . . . . . . . . . . . . . . . . . . . . . . . 35
5 Non-diffusive combustion waves in porous media
36
5.1
Introduction . . . . . . . . . . . . . . . . . . . . . . . . . . . . . . . . . . . . . . 36
5.2
Simplified combustion model . . . . . . . . . . . . . . . . . . . . . . . . . . . . . 37 5.2.1
The Rankine-Hugoniot locus . . . . . . . . . . . . . . . . . . . . . . . . . 38 iv
5.2.2 5.3
Combustion wave profile . . . . . . . . . . . . . . . . . . . . . . . . . . . 39
Testing the solution within the combustion wave . . . . . . . . . . . . . . . . . . 41 5.3.1
Monotonicity . . . . . . . . . . . . . . . . . . . . . . . . . . . . . . . . . 41
5.3.2
Verifying the characteristic inequalities . . . . . . . . . . . . . . . . . . . 42
5.4
Non-combustion waves and wave sequences . . . . . . . . . . . . . . . . . . . . . 42
5.5
Conclusion . . . . . . . . . . . . . . . . . . . . . . . . . . . . . . . . . . . . . . . 44
6 Numerical methods 6.1
6.2
Introduction . . . . . . . . . . . . . . . . . . . . . . . . . . . . . . . . . . . . . . 46 6.1.1
Crank-Nicolson method
6.1.2
Box scheme . . . . . . . . . . . . . . . . . . . . . . . . . . . . . . . . . . 51
6.1.3
Boundary conditions . . . . . . . . . . . . . . . . . . . . . . . . . . . . . 52
6.1.4
Solution of the block tridiagonal system . . . . . . . . . . . . . . . . . . 53
6.4
. . . . . . . . . . . . . . . . . . . . . . . . . . . 48
Limitations of the Crank-Nicolson scheme . . . . . . . . . . . . . . . . . . . . . 54 6.2.1
6.3
46
Application to the physical model . . . . . . . . . . . . . . . . . . . . . . 54
The hybrid finite difference scheme . . . . . . . . . . . . . . . . . . . . . . . . . 56 6.3.1
Inicialization particularities . . . . . . . . . . . . . . . . . . . . . . . . . 58
6.3.2
Application to the physical model . . . . . . . . . . . . . . . . . . . . . . 59
Conclusions . . . . . . . . . . . . . . . . . . . . . . . . . . . . . . . . . . . . . . 62
7 Stability analysis of combustion waves 7.1
7.2
7.3
Co-flow combustion traveling wave . . . . . . . . . . . . . . . . . . . . . . . . . 67 7.1.1
Rankine-Hugoniot condition . . . . . . . . . . . . . . . . . . . . . . . . . 67
7.1.2
Approximate profile for the combustion wave . . . . . . . . . . . . . . . . 68
7.1.3
Numerical simulations . . . . . . . . . . . . . . . . . . . . . . . . . . . . 69
Perturbations of the approximate traveling wave . . . . . . . . . . . . . . . . . . 70 7.2.1
Constructing the evolution operator . . . . . . . . . . . . . . . . . . . . . 72
7.2.2
Left limit case . . . . . . . . . . . . . . . . . . . . . . . . . . . . . . . . . 73
7.2.3
Right limit case . . . . . . . . . . . . . . . . . . . . . . . . . . . . . . . . 75
7.2.4
Solutions that match the limit cases . . . . . . . . . . . . . . . . . . . . . 76
Conclusions . . . . . . . . . . . . . . . . . . . . . . . . . . . . . . . . . . . . . . 78
8 Introduction to reaction kinetics 8.1
65
79
Specific surface area . . . . . . . . . . . . . . . . . . . . . . . . . . . . . . . . . 80
v
8.2
Order of reaction . . . . . . . . . . . . . . . . . . . . . . . . . . . . . . . . . . . 80
8.3
Distribution of petroleum coke in the porous media . . . . . . . . . . . . . . . . 81
8.4
Effectiveness factor . . . . . . . . . . . . . . . . . . . . . . . . . . . . . . . . . . 82 8.4.1
Effectiveness factor for flat particles . . . . . . . . . . . . . . . . . . . . . 84
8.4.2
Effectiveness factor for spherical particles . . . . . . . . . . . . . . . . . . 86
8.5
Activation energy and frequency factor . . . . . . . . . . . . . . . . . . . . . . . 86
8.6
The balance law equation . . . . . . . . . . . . . . . . . . . . . . . . . . . . . . 89
Bibliography
90
vi
List of Figures 1.1
Schematic representation of ISC process. . . . . . . . . . . . . . . . . . . . . . .
2
2.1
Schematic representation of the one-dimensional model for ISC. . . . . . . . . .
7
3.1
Heteroclinic orbit in quasi-stationary approximation: a) dependence of x0 on y 0 , b) dependence of y 0 on tˆ. . . . . . . . . . . . . . . . . . . . . . . . . . . . . . . . 16
4.1
Regions in parameter space T res × v i corresponding to small epsilon. The region that satisfies the first inequality of (4.20) is printed in dark gray. The region that satisfies the second inequality of (4.20) is printed in light gray. Here we use the parameter values from Tables 2.1 and 2.2. . . . . . . . . . . . . . . . . . . . 25
4.2
Regions in parameter space T res × v i corresponding to small epsilon. The region that satisfies the first inequality of (4.20) is printed in dark gray. The region that satisfies the second inequality of (4.20) is printed in light gray. Here we use the parameter values from Tables 2.3 and 2.4. . . . . . . . . . . . . . . . . . . . 25
4.3
Zero-order approximation of the traveling wave. We used dimensionless parameter values from Table 2.2.
4.4
. . . . . . . . . . . . . . . . . . . . . . . . . . . . . 27
Zero-order approximation of the traveling wave (monotone) and the combustion rate Φ (hump) scaled by 2 · 107 . In (a) γ = 2.0 and α = 1.6 · 10−6 were used. In (b) the original dimensionless values from Table 2.3 were used.
4.5
. . . . . . . . . 28
The plot represents the first order correction η 1 (η 0 ), θ1 (η 0 ) and Y 1 (η 0 ) corresponding to zero-order approximation from Figure 4.3. Here we have used the dimensionless parameter values from Table 2.2.
4.6
. . . . . . . . . . . . . . . . . . 29
The plot represents the first order correction η 1 (η 0 ), θ1 (η 0 ) and Y 1 (η 0 ) corresponding to zero-order approximation from Figure 4.4. Here we have used the dimensionless parameter values from Table 2.3.
vii
. . . . . . . . . . . . . . . . . . 29
4.7
The numerical solution of (4.24) (solid), the analytical solution (4.43) of the approximate ODE (4.34) (circles) and the logarithmic approximation (4.46) (dotted). We use γ = 2.0.
4.8
. . . . . . . . . . . . . . . . . . . . . . . . . . . . . . . . 32
The numerical solution of (4.24) (solid), the analytical solution (4.43) of the approximate ODE (4.34) (circles) and the numerical solution of (4.47) (dotted). We use γ = 2.0.
5.1
. . . . . . . . . . . . . . . . . . . . . . . . . . . . . . . . . . . 33
On the left: the traveling wave solution of the system (5.26). On the right: the first order approximation of the traveling wave of the system (2.16)-(2.19) from [18]. Variables: θ (segmented line), Y (dotted), η (circles) and combustion rate Φ (solid line) as functions of ξ. We use γ = 2. . . . . . . . . . . . . . . . . . . . 40
5.2
Regions separated by immobile, thermal and combustion waves in the Riemann solution. Values of θ, Y , η and v in each region. . . . . . . . . . . . . . . . . . . 45
6.1
Black squares - stencil for the Crank-Nicolson scheme on the left and for the Box scheme on the right. We indicate auxiliary points with circles. . . . . . . . . . . 48
6.2
In this simulation using the hybrid scheme we use initial data as shown on the left. On the right we compare the combustion wave profile at time t = 2 · 107 obtained through the numerical simulation from Figure 6.3 (circles) with the semi-analytical one obtained solving (4.24) (lines). Here we use parameter values from Table 2.3. . . . . . . . . . . . . . . . . . . . . . . . . . . . . . . . . . . . . 61
6.3
Numerical simulation using the hybrid method for system (2.23)-(2.26) at dimensionless time t = 2 · 107 showing the formation of thermal and combustion waves (Y and η coincide). The initial data is plotted on the left side in Figure 6.2. Here we use parameter values from Table 2.3, except γ = 2. . . . . . . . . . 61
6.4
Numerical simulation using the hybrid method for system (2.23)-(2.26) with parameter values from Table 2.2 showing the formation of thermal and combustion waves. Figures (a) - initial data, (b) - after 30.000 time steps, (c) - after 200.000 time steps and (d) - after 510.000 time steps. Initial value for the variable θ at the injection end was taken as 2, the thermal wave is almost indistinguishable because of the diffusion effect. Notice that the combustion wave has a thin reaction layer where all the oxygen and fuel are consumed and thick thermal layer where only thermal conduction occurs. Compare with Figure 6.5. . . . . . . . . 63
viii
6.5
Numerical simulation using the hybrid method for system (2.23)-(2.26) with parameter values from Table 2.2 showing the formation of thermal and combustion waves. Figures (a) - initial data, (b) - after 50.000 time steps, (c) - after 200.000 time steps and (d) - after 510.000 time steps. Initial value for the variable θ at the injection end was taken as 2.5, the thermal wave is smooth due the diffusion effect. Notice that the combustion wave has a thin reaction layer where all the oxygen and fuel are consumed and thick thermal layer where only thermal conduction occurs. Compare with Figure 6.4.
7.1
. . . . . . . . . . . . . . . . . . . 64
Numerical simulation using the Crank-Nicolson scheme with adaptative time step for the system (7.1)-(7.3) with the parameter values c = 0.2, q = 0.9, v = 1.2, K = 10−4 , µ = 2 and γ = 4. The initial data is plotted on the left. Simulation results after 2 · 107 time units showing the formation of thermal and combustion waves are plotted on the right. . . . . . . . . . . . . . . . . . . . . . . . . . . . . 69
7.2
Singular perturbation approximation (7.19) on the left and the combustion wave profile obtained by Crank-Nicolson simulation from Figure 7.1 on the right. Both plots are on the same scale. We use parameter values c = 0.2, q = 0.9, v = 1.2, K = 10−4 , µ = 2 and γ = 4. . . . . . . . . . . . . . . . . . . . . . . . . . . . . . 70
7.3
Schematic representation of the degrees of freedom in different regions of λ for ξ → −∞. . . . . . . . . . . . . . . . . . . . . . . . . . . . . . . . . . . . . . . . 75
7.4
Schematic representation of the degrees of freedom in different regions of λ for ξ → ∞. . . . . . . . . . . . . . . . . . . . . . . . . . . . . . . . . . . . . . . . . 76
7.5
Schematic representation of matching three types of solutions in the intervals (−∞, −M ], [−M, M ] and [M, ∞].
. . . . . . . . . . . . . . . . . . . . . . . . . 77
7.6
Schematic representation of the degrees of freedom in different regions of λ. . . . 77
8.1
Left: schematic representation of the porous media particle. Right: surface tension forces in the porous media and the contact angle. . . . . . . . . . . . . . 83
ix
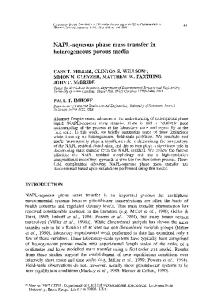
Chapter 1 Introduction Frequent high oil prices have renewed interest in heavy oil recovery techniques such as in situ combustion (ISC). This technique involves the injection of pure oxygen or air, or air enriched with oxygen or nitrogen to enable combustion of oil and other consecutive reactions within the reservoir formation leading to the release of heat. Heat is conducted ahead of the combustion front, reduces the oil viscosity and leads to in situ distillation (upgrading). Carbon dioxide created during combustion can also assist the recovery by increasing pressure and by mixing with the oil reducing its viscosity and enhancing flow, see [9, 37]. Another thermal recovery technique is steam injection. It is of interest to compare the advantages and disadvantages of these two thermal recovery techniques. Steam is formed by passing treated water through a boiler system which comprises a considerable energy cost. ISC avoids these heat-related costs, but requires compressors for the injected air. ISC has other benefits relative to steam injection. For example, steam generation produces CO2 at the surface, representing a significant environmental impact, and heat is lost during its transport to the formation. ISC produces CO2 downhole, which will be partially sequestered in the formation, see [37]. The primary limitation of ISC is that the combustion front is hard to control. This difficulty supports the research interest in this subject in different areas such as Engineering, Physics, Computer Science and Mathematics. We summarize the literature on chemical processes occurring during ISC. We use the schematic division of the ISC processes shown in Figure 1.1, see [24]. Following upstream the flow (right to left or from the production to the injection well) we can separate the light hydrocarbons (HC) zone, the steam zone, the cracking zone, the coke formation zone and the 1
coke combustion zone.
Figure 1.1: Schematic representation of ISC process.
According to [1] there are three overlapping processes caused by temperature elevation due to heat transfer downstream the reaction zone. The first process is distillation (evaporation) of light oil components, which occurs at lower temperatures. Next, we separate the “visbreaking” stage that occurs at mild temperatures and breaks the initial oil into low volatile components and a “visbroken” oil (with smaller viscosity and specific gravity). Finally, the severe cracking (coking) reaction transforms the visbroken oil into coke and some lighter components. Condensation of all light oil that has been produced elsewhere occurs inside the light hydrocarbon zone. In some cases, oxygen can break through the coke zone and come into contact with the light hydrocarbons where the reaction is described by the “Low Temperature Oxidation” (LTO) mechanism, see [27]. In addition to initial water in the reservoir, which evaporates due to high temperature, steam is formed from the combustion products. This water condenses inside the steam zone downstream of the combustion process. Heat released during condensation elevates the reservoir temperature and increases the evaporation of light oil components. Continuing upstream we find the cracking zone, where visbreaking and coking stages [1] occur and the coke zone that has only formation of coke, which is consumed during the combustion reaction. The processes occurring inside the cracking zone influence the distribution of coke inside the reservoir. This distribution is related to surface tensions between rock, viscous oil and gas coexisting before the combustion. Because of the high temperature, inside the coke and cracking zones there is no significant quantity of water and light components of oil. 2
Inside the combustion zone the residual coke reacts with the injected oxygen. The microporous structure of coke and related parameters, such as reactive area of coke particles and transport of oxygen into the pores, are important to describe this process, see [8] and [35]. There is abundant literature, for example [22, 44], focusing on the reaction kinematics for general materials containing carbon. However, the reaction rates for general carbon containing materials can vary by up to some orders of magnitude. The situation for petroleum coke is more clear. We explain in detail the reaction happening inside this zone in Chapter 8. The combustion zone is typically tens of feet wide and the temperature of the combustion front is usually around 430-540o C. In this work, we model ISC in a 1D configuration. There are reasons to do so, besides simplicity. One of them is that due to gravitation the oxygen tends to occupy the top part of the reservoir, thus we can consider a thin layer containing most of the oxygen. To complete the model we can take into account heat losses to other layers of the porous media. These losses have no significant effect on the combustion zone because it is thin and the reaction is fast, but they will influence the thermal wave that trails the combustion wave. In this text we study only the processes happening inside the combustion zone. We assume that the porous medium is filled with petroleum coke and the only chemical reaction occurring is the coke oxidation (combustion). The combustion wave at the reservoir side can be controlled by the lack of oxygen or by low temperature. Most of the literature studies the phenomenon controlled by low temperature, which is more common in practice. This case is not so amenable to analysis as oxygen controlled case. The techniques used to study the combustion wave controlled by low temperature are very different from presented here. For example, in [11] an approximate solution was obtained, it is a slowly varying transient wave. In this text we address the fuel and oxygen controlled case. For the model described in Chapter 2 there are two possible types of motion for the combustion wave. In co-flow combustion the ignition takes place at the injection end of the cylinder and propagates in the same direction as the injected gas. The analysis of this situation is made in Chapter 4. From the Engineering point of view this method is more practical, see Figure 1.1. The second possibility is counter-flow combustion, for which the ignition occurs on the production end of the cylinder and the combustion wave moves in the opposite direction to the injected gas. The advantage of this technique is temperature increase near the production well, where it can increase the recovery. We do not study this technique here, however one can find 3
details in [21, 40]. This work is organized as follows. In Chapter 2 we introduce two physical models describing the ISC process. First we present the physical model in terms of mass balances [2] and explain its limitations. Next, we formalize a model in terms of molar balance, which is better in many respects. The equations for both models have the same dimensionless form. In Chapter 3 we apply the geometrical singular perturbation method developed in [31] in order to obtain an approximation of the heteroclinic orbit joining two equilibria of certain ordinary differential equations that describe the profile of the combustion wave. The case of our interest corresponds to a system of ODEs where one of the flux functions is much smaller than the remaining ones. In Chapter 4 we review briefly the literature on combustion waves in porous media. The Riemann problem for the system describing the physical model with reaction rate given by the Arrhenius’ law is formulated. Next, we use the singular perturbation method developed in Chapter 3 in order to obtain the combustion wave profile in the form of an asymptotic series expansion. We obtain the zero-order approximation and validate it by analyzing the first order correction. In this chapter we present strong evidence of the existence of such traveling wave solution. In Chapter 5 we give a physical interpretation to the zero-order approximation obtained in Chapter 4. We present a simplification of the physical model [2]. In this simplification, all diffusive and conductive terms are neglected. We obtain the exact traveling wave solution for the combustion wave of this non-diffusive system. It turns out that the combustion wave profile of such system coincides with the zero-order approximation of the diffusive model obtained in Chapter 4. In Chapter 6 we show that the the classical Crank-Nicolson scheme is not indicated to simulate the physical model [2]. We develop a hybrid finite difference scheme to circumvent this difficulty and simulate this system numerically. The numerical results confirm the combustion wave profile obtained in Chapter 4 by means of the singular perturbation technique. In Chapter 7 we introduce a simpler model for the ISC process. This model possesses some properties of the physical model [2]. For example, the wave sequence in the Riemann solution possesses three contact waves for both models. However, it is more amenable to analysis and it can be simulated using the classical Crank-Nicolson finite difference scheme. We obtain the combustion traveling wave profile for this simpler model using the singular perturbation technique and validate it by numerical simulations. Next we present some heuristic calculations 4
for this simpler model and discuss the stability of the combustion wave obtained using the singular perturbation method. Finally, in Chapter 8 one can find an introduction to chemistry of coke combustion with a brief literature review and a description of the reaction kinetics.
5
Chapter 2 Physical formulation In this chapter we formulate physical models used to study combustion fronts in in-situ combustion and compare them to models in the literature. First of all we restrict our efforts to one dimensional models. Some works formulate mathematical theory on the interaction between the combustion zone and other zones as represented in Figure 1.1. For example, in [11] the interaction of combustion and steam zone is discussed. However this work ignores the existence of the cracking zone and the chemical processes that occur. In [12] the interaction of combustion and cracking zones is considered. Here we will discuss only the behavior of the combustion zone. Let us introduce certain physical hypotheses common to all models discussed in this text. We consider a thin cylindrical tube filled with porous medium containing coke, schematically represented on Figure 2.1. As we are interested in the combustion zone, it is assumed that there is no liquid phase in the porous medium and that the only chemical reaction is the oxidation of coke. In formulating the conservation equations we make the following assumptions: the pore space and the solid matrix are in thermal equilibrium so that a one-temperature model is used for the energy balance; heat transfer by radiation, energy source terms due to pressure increase, and work from surface and body forces are all negligible; the ideal gas law is the equation of state for the gas phase; thermodynamic and transport properties, such as conductivity, diffusivity, heat capacity of the solid, heat of reaction, etc., all remain constant. We also neglect heat loss to the surrounding rock formation. We assume that gas heat capacity is negligible with respect to the rock heat capacity. The heat loss will be taken to be zero as we study only the adiabatic case. We assume that pressure changes within any wave are negligible compared to 6
Figure 2.1: Schematic representation of the one-dimensional model for ISC.
the pressure drop across the system, so that in the ideal gas law and in other physical properties the pressure can be approximated by a constant. Next we introduce and discuss some models used in this work.
2.1
Mathematical model
The original model, which is formulated in terms of mass conservation, can be found in [2]. Here we present the simplified version of this model used in [46]. We assume that air is injected at the leftmost part of a porous rock cylinder containing solid fuel, so that all wave propagation is one dimensional. Balance equations are written for the total energy, the total gas mass, the oxygen mass and the fuel mass. For the latter, we define the fuel density per total volume ρf and introduce the extent of conversion depth, η(˜ x, t˜) = 1 − ρf (˜ x, t˜)/ρof (ρof is the initial fuel concentration), such that η = 0 corresponds to complete availability of fuel (denoted by superscript o) and η = 1 to the complete lack of fuel (the latter may occur because the fuel was never present or because it was completely consumed). The primary dependent variables are the temperature, T˜(˜ x, t˜), the oxygen concentration in terms of mass fraction, Y˜ (˜ x, t˜) and the fuel conversion depth η(˜ x, t˜). The gas density ρg (T˜, p˜ ) is expressed by the ideal gas equation of state in terms of temperature, gas composition and total gas pressure p˜(˜ x, t˜).
7
The dimensional form (indicated by the superscript tilde) of the energy balance, the oxygen mass balance, the gaseous phase mass balance and the combustion kinetics equations are: ∂(cs ρs T˜) ∂(cg ρg v˜T˜) ˜ ∂ 2 T˜ + = λ 2 + Qρof W, ˜ ∂ x˜ ∂ x˜ ∂t à ! ∂(ρg Y˜ ) ∂(ρg v˜Y˜ ) ∂ ∂ Y˜ φ + = DM ρg −µ ˜ρof W, ˜ ∂ x ˜ ∂ x ˜ ∂ x ˜ ∂t (1 − φ)
φ
∂(ρg ) ∂ (ρg v˜) + =µ ˜g ρof W, ∂ x˜ ∂ t˜ ∂η = W, ∂ t˜
(2.1) (2.2) (2.3) (2.4)
where W is the reaction rate. The four equations (2.1)-(2.4) correspond to the three primary unknowns T˜, Y˜ , η and the secondary unknown v˜, which is the volumetric flow rate of the gas phase. In the above, cg , cs denote the average specific heat capacity of gas or solid at ˜ is the effective thermal constant pressure, ρg , ρs are the volumetric densities of gas or solid, λ conductivity, Q is the heat released due to reaction (per unit mass of solid). Other constants are explained in Table 2.1. Changes in the porosity φ are considered to be negligible so that φ is constant. DM is an effective diffusion coefficient in the gas phase (DM = φD, where D is the molecular diffusion coefficient), while µ ˜ = γ˜ Mo /Mf and µ ˜gp = γ˜gp Mgp /Mf are mass-weighted stoichiometric coefficients for oxygen and for combustion gaseous products, respectively. Mo , Mf and Mgp are the molecular weight of oxygen, fuel and gaseous products, respectively. The net gas mass production is determined from µ ˜g = µ ˜gp − µ ˜, so that positive or negative sign for µ ˜g correspond to net gaseous phase mass production or consumption, respectively. We will assume µ ˜g > 0. For the rate of reaction, we use the first order law of mass action and Arrhenius’ Law: ˜
W = kc e−E/RT Y˜ (1 − η),
(2.5)
with activation energy E and pre-exponential factor kc given by: kc = k0
as p0 , RT˜0
(2.6)
where as is the specific surface area of the coke particles (see Table 2.1 for the typical values of k0 , as , p0 , R and T˜0 ), more details on the Chemistry of coke combustion are found in Chapter 8. We use the ideal gas equation of state in terms of density: p˜Mg = ρg RT˜, 8
(2.7)
Table 2.1: Typical values of dimensional parameters. Source: [2]. Physical quantity
Symbol
Value
Unit
heat release due to reaction
Q
39542
kJ/kg
activation energy
E
7.35 · 104
universal gas constant
R
8.314
ko T˜o
0.00224 373.15
K
po Y˜ i
101325
Pa
pre-exponential
factor2
initial reservoir temperature initial total gas
pressure2
(1 atm)
inlet oxygen mass concentration effective molecular diffusion coefficient
kJ/kmole kJ/kmole-K kW-m/Pa-kmole
1.0
(kg/kg) 10−6
m2 /s
2.014 ·
effective thermal conductivity
DM ˜ λ
8.654 · 10−4
kW/m-K
volumetric heat capacity of the gas
cg ρig
1.2339
kJ/m3 -K
initial fuel concentration
ρof
19.2182
volumetric heat capacity of the matrix
(1 − φ)cs ρs
2.012 · 103
mass of oxygen/unit mass of fuel
µ ˜
3.018
(kg/kg)
net mass production of gas/unit mass of fuel
µ ˜g
1.000
(kg/kg)
molecular weight of gaseous products1
Mg
0.044
kg/mole
molecular weight of coke
Mf
0.235
kg/mole
gaseous products density1
ρig
1.98
kg/m3
coke particles specific surface area
as
1.41 · 105
m2 /m3
porosity of the medium
φ
0.3
m3 /m3
kg/m3 kJ/m3 -K
where R is the universal gas constant, while Mg is the effective molecular weight of the gas phase. Notice that Mg and ρg depend on the molecular weight of the gas, i.e. Mg = Mg (Y ) and ρg = ρg (Y ) as the only reaction occurring is the oxidation of coke. In the models analyzed in Chapters 4, 5 and 7 we neglect the effect of changes in these variables resulting from composition changes due to the reaction, and we approximate Mg by constant so that ρg does not depend on Y . Notice that if we replace the system (2.1)-(2.4) in terms of molar densities instead of mass densities the equation (2.7) becomes exact. We discuss it in detail in Section 2.3. All the dimensional constants used in this section are given in Table 2.1. In [2] the injected gas was pure oxygen Y˜ i = 1. 1 2
These values where taken for CO2 gas at 1 atm pressure. In [2] the pressure was given in [atm], the value of k0 was 227 [kW · m/atm · kmole].
9
2.2
The nondimensionalization
The nondimensionalization of the problem is performed as follows. One introduces characteristic value for the speed v ∗ , from which we define the reference length1 l∗ = αs /v ∗ and time t∗ = l∗ /v ∗ . ˜ Following [2], we define scaled effective thermal diffusivity αs = λ/((1 − φ)cs ρs ) [m2 /s]. These quantities are defined in such way that the coefficient of the diffusion term in the energy conservation equation is one. In short, the nondimensional variables are: v=
v˜ ; v∗
θ=
T˜ ; T˜0
t=
t˜v ∗2 t˜ = ; t∗ αs
x=
x˜ x˜v ∗ = ; l∗ αs
Y =
Y˜ ; Y˜ i
η =1−
ρf ; ρ0f
ρ=
ρg . (2.8) ρig
where Te0 is the prevailing reservoir temperature, Ye i is the injected oxygen fraction in the total gas mass, ρ0f is the initial fuel concentration and ρig is the produced gas concentration. The variables with tilde are physical: Te is temperature in [K], Ye is oxygen fraction in the total gas and v˜, t˜, x˜ are the gas speed [m/s], time [s] and length [m]. Substituting (2.8) into (2.1)-(2.4) with some simple manipulations we obtain: Qρof cg ρig ∂θ ∂(ρvθ) ∂2θ + = + t∗ W, ∂t (1 − φ)cs ρs ∂x ∂x2 (1 − φ)cs ρs T˜0 µ ¶ µ ˜ρof ∗ ∂(Y ρ) ∂(ρvY ) DM t∗ ∂ ∂Y φ + = ∗ 2 ρ − t W, ∂t ∂x (l ) ∂x ∂x ρig Y˜i µ ˜g ρof ∗ ∂ρ ∂(ρv) φ + = i t W, ∂t ∂x ρg ∂η = t∗ W, ∂t Using (2.8) with (2.5) we obtain the nondimensional reaction rate Φ: ˜ Φ = t∗ W = kc Y˜i t∗ Y (1 − η)e−(E/RT0 )/θ .
(2.9) (2.10) (2.11) (2.12)
(2.13)
Finally, applying (2.8) for T and ρg in (2.7), where we approximate the pressure by a constant (p0 = 1 [atm]), we obtain the dimensionless ideal gas equation: ρθ =
p0 Mg . Rρig T˜0
(2.14)
We collect all the nondimensional constants of (2.9)-(2.14), obtaining: a=
1
Qρof µ ˜ρof µ ˜g ρof cg ρig (l∗ )2 αs , q= , Le = = , µ = , µ = , g (1 − φ)cs ρs DM t∗ DM ρig (1 − φ)cs ρs T˜0 ρig Y˜i b = p0 Mg /(Rρig T˜0 ), γ = E/RT˜0 , α = kc t∗ Y˜i .
(2.15)
Notice that the name characteristic length will be used later to denote the length of the combustion wave.
10
Table 2.2: Values of dimensionless parameters given in (2.15) corresponding to Table 2.1. Physical quantity
Symbol
Value
Volumetric heat capacity ratio of the filtrating gas
a
6.13 · 10−4
Heat transfered to porous medium due to the reaction
q
1.012
Lewis number (ratio of thermal and molecular diffusion)
Le
0.21
Stoichiometric coefficient for oxygen
µ
29.29
Net stoichiometric coefficient for gas production
µg
9.71
Scaled ideal gas constant
b
0.73
Arrhenius number (dimensionless activation energy)
γ
23.69
Reaction coefficient1
α
828.15
The values of these quantities are shown in Table 2.2; they are calculated using Table 2.1. Using (2.15) we rewrite (2.1)-(2.4) and (2.7) in nondimensional form: ∂θ ∂(aρvθ) + ∂t ∂x ∂(Y ρ) ∂(ρvY ) φ + ∂t ∂x ∂ρ ∂(ρv) φ + ∂t ∂x ∂η ∂t ρθ
∂2θ + qΦ, ∂x2 µ ¶ 1 ∂ ∂Y = ρ − µΦ, Le ∂x ∂x
=
(2.16) (2.17)
= µg Φ,
(2.18)
= Φ,
(2.19)
= b.
(2.20)
The equations (2.16)-(2.18) were obtained in [2] exactly in this form. Equation (2.19) was written in [2] in a similar form but equation (2.20) was written in [46] with b replaced incorrectly by 1. The nondimensional reaction rate Φ(θ, Y, η) is: γ
Φ = αY (1 − η)e− θ .
(2.21)
The nomenclature and typical values of the nondimensional parameters given in (2.15) are found in Table 2.2. The basic dependent variables are the temperature, θ(x, t), the oxygen mass concentration Y (x, t) and the fuel conversion depth η(x, t) (recall that η = 0 corresponds to complete avail1
This reaction coefficient corresponds to injection gas speed v i = 200 m/day. In [2] injection speeds in the
range 0 < v i < 500 m/day are considered.
11
ability of fuel and η = 1 to the complete lack of fuel). Eq. (2.20) allows expressing the gas density ρ in terms of temperature. The Darcy velocity v is the volumetric flow of gas per unit area. The physical domain of the variables (θ, Y, η, v) is given by: θ ≥ 0,
0 ≤ Y ≤ 1,
0 ≤ η ≤ 1,
v > 0.
(2.22)
In order to find the time evolution of the system (2.16)-(2.21) we extract ρ from (2.20) and substitute it into (2.16)-(2.19), obtaining: ∂θ ∂v + ab ∂t ∂x ∂(Y /θ) ∂(vY /θ) φb +b ∂t ∂x ∂ 1 ∂(v/θ) φb +b ∂t θ ∂x ∂η ∂t
∂ 2θ + qΦ, ∂x2 µ ¶ b ∂ 1 ∂Y − µΦ, = Le ∂x θ ∂x =
(2.23) (2.24)
= µg Φ,
(2.25)
= Φ.
(2.26)
Remark 2.1 (Extra difficulty) One notices that the system (2.23)-(2.26) presents an extra peculiarity. The variable v does not appear inside any derivative in time. It follows that when we are solving a Cauchy problem for this system, we cannot define the value for the variable v except at a single point for t = 0.
2.3
Improving the model
As we explained before, the equation (2.20) (as it is obtained from (2.7)) is only approximately valid because during the chemical reaction the molar densities of different gas components vary. When the reaction can be regarded as being C + O2 → CO2 , the total number of moles in the gas does not change during the reaction. Thus the ideal gas equation of state for the mixture in terms of gas molar density ρm g now is exact: ˜ p˜ = ρm g RT .
(2.27)
Notice that stoichiometric coefficients corresponding to moles of generated gas and to moles of consumed oxygen are equal to one, thus there is no net molar generation of gas during the −1 and reaction. We rewrite the system (2.1)-(2.4) in terms of molar densities of gas ρm g = ρg Mg −1 o of fuel ρm f = ρf Mf : 2˜ ˜T˜) cg ρm ∂(cs ρs T˜) ∂(˜ g v ˜ ∂ T + Qρm Mf W, (1 − φ) =λ + f ∂ x˜ ∂ x˜2 ∂ t˜
12
·
¸ J , m3 s
(2.28)
˜ ∂(ρm ∂(ρm ˜Y˜ ) ∂ g Y) g v φ + = DM ˜ ∂ x˜ ∂ x˜ ∂t
Ã
∂ Y˜ ρm g ∂ x˜
!
· −
µ ˆ ρm f W,
¸ mole , m3 s
· ¸ ∂(ρm ˜) ∂ρm mole g Mg v g φ + = 0, , ∂ x˜ m3 s ∂ t˜ · ¸ ∂η 1 = W, , s ∂ t˜
(2.29) (2.30) (2.31)
where we have introduced the stoichiometric coefficient µ ˆ=µ ˜Mf /Mg and specific heat capacity of gas c˜g = cg Mg in terms of moles. The reaction rate is governed by the Arrhenius’ law (2.5). One has to notice that when we used the equation (2.20) to eliminate the variable ρ from the system (2.16)-(2.19) to obtain system (2.23)-(2.26) we introduced an error due to the fact that the equation (2.7) in terms of mass is only an approximation of the equation of state for mixtures of ideal gases. This error is avoided by using the exact ideal gas law in terms of molar density (2.27). The term c˜g ρm g in (2.28) is the average heat capacity of the gases in the mixture at constant pressure. As O2 and CO2 are linear molecules they have the same number of degrees of freedom and their molar heat capacity (at constant pressure) is practically the same. Therefore, as O2 reacts and is replaced by the same number of moles of CO2 , the average molar heat capacity of the mixture stays (practically) constant. That was not the case in (2.1) where the specific heat of the mixture was written in terms of mass rather than in terms of moles. As for the physical mass conservation model (2.1)-(2.5) we nondimensionalize (2.27)-(2.31) using (2.8), obtaining the system in dimensionless form (2.16)-(2.20) with dimensionless constants given by (2.15) except that µg = 0. There is no formal differences between the approximate physical model written in terms of mass densities or the exact model written in terms of molar densities.
2.4
Other values of dimensionless parameters
In [46] the values for dimensionless constants used were different, see Table 2.3. These values can be obtained from the data presented in Table 2.4 instead of Table 2.1.
13
Table 2.3: Values of dimensionless parameters (2.15) used in [46]. Physical quantity
Symbol
Value
Volumetric heat capacity ratio of the filtrating gas
a
6.13 · 10−4
Heat transfered to porous medium due to the reaction
q
1.0121
Lewis number (ratio of thermal and molecular diffusion)
Le
0.214
Stoichiometric coefficient for oxygen
µ
205.8
Net stoichiometric coefficient for gas production
µg
68.19
Scaled ideal gas constant
b
1.0
Arrhenius number (dimensionless activation energy)
γ
23.69
Reaction coefficient
α
0.027
Table 2.4: Values of dimensional parameters compatible with the values of dimensionless parameters used in [46] and given in Table 2.3. Physical quantity
Symbol
Value
inlet oxygen mass concentration
Y˜ i
1.0
molecular weight of gaseous products
Mg
0.0086 kg/mole
gaseous products density
ρig
0.2818
kg/m3
coke particles specific surface area
as
1000
m2 /m3
gas injection speed
vi
2950
[m/day]
14
Unit (kg/kg)
Chapter 3 Geometrical singular perturbation 3.1
Introduction
Many different works describe and use singular perturbation methods in order to study multiple scale and stiff problems [23, 30, 31, 50]. In this chapter we follow the singular perturbation theory presented in [31]. However, here we will apply this theory in order to obtain stable heteroclinic orbits of the dynamical system given by the system of ODEs, which were not studied in [31]. This chapter use slightly different notation as we describe later. Consider an autonomous system of ODEs for x ∈ Rn and y ∈ R: dx = f (x, y) dt dy = ²g(x, y), dt
(3.1)
where f = (f 1 , . . . , f n )T and g are smooth (C 1 ) functions of x and y, and ² is a small positive parameter (bold indicates vectors). The parameter ² implies that the change of y is small when compared to the change of x. Let us assume that (3.1) has two isolated equilibria named (−) and (+): f (x− , y − ) = f (x+ , y + ) = 0 and g(x− , y − ) = g(x+ , y + ) = 0.
(3.2)
Let us assume the existence of an heteroclinic orbit x(t), y(t) of system (3.1), which connects (x− , y − ) at t = −∞ to (x+ , y + ) at t = +∞. We are interested in finding tjhis orbit. We consider the case y − 6= y + when the slow component y(t) undergoes a finite change. It is convenient to introduce the slow time tˆ = ²t and using the notation x˙ = dx/dtˆ, one rewrites
15
the system (3.1) as
(
²x˙ = f (x, y) y˙ = g(x, y).
(3.3)
Geometric aspects of such singularly perturbed equation were studied in [23, 31]. Quantitative study in the case of three equations was done in [18, 19].
3.2
Quasi-stationary limit
Let us denote by (x0 (tˆ), y 0 (tˆ)) the quasi-stationary limit ² → 0 of the heteroclinic solution (x(tˆ), y(tˆ)). By taking ² = 0 in system (3.3), we obtain f (x0 , y 0 ) = 0,
(3.4)
y˙ 0 = g(x0 , y 0 ).
(3.5)
Notice that (3.4) is a system of n scalar algebraic equations with n + 1 unknowns. We assume that this system defines a curve Γ0 in the space (x, y), which connects the equilibria (−) and (+), see Fig. 3.1a. We also assume that det fx 6= 0 on Γ0 ,
(3.6)
where fx = [∂f /∂x] is the Jacobian matrix of the function f (x, y) for fixed y. By the implicit function theorem, equation (3.4) has a solution x0 = ϕ(y 0 ) such that the curve Γ0 is parametrized as (ϕ(y 0 ), y 0 ) for y 0 between y − and y + . Of course, ϕ(y ± ) = x± .
Figure 3.1: Heteroclinic orbit in quasi-stationary approximation: a) dependence of x0 on y 0 , b) dependence of y 0 on tˆ. 16
By substituting ϕ(y 0 ) into Eq. (3.5), we obtain a scalar ODE for y 0 : y˙ 0 = g(x0 (y 0 ), y 0 ).
(3.7)
According to (3.2), g(ϕ(y 0 ), y 0 ) = 0 at y 0 = y ± . Hence, there exists a solution y 0 (tˆ) such that y 0 → y ± as tˆ → ±∞ if and only if (y + − y − )g(x0 , y 0 ) > 0 along Γ0 , except at (x, y)± ,
(3.8)
of course g(x, y)± = 0. This solution is a monotone function of tˆ, see Fig. 3.1b. The function y 0 (tˆ) is a heteroclinic orbit of scalar ODE (3.7). Since the heteroclinic orbit of an autonomous system is invariant under translations in time, equation (3.7) can be solved with the initial condition y 0 (0) = yˇ0 ,
(3.9)
where yˇ0 is an arbitrary number between y − and y + . Thus we recover the asymptotic heteroclinic solution as follows in terms of the slow time tˆ = ²t. The above discussion can be used as proof of the following proposition. Proposition 3.1 Let us assume that the equation f (x0 , y 0 ) = 0 determines a curve Γ0 = (ϕ(y 0 ), y 0 ) connecting the equilibria (x− , y − ) to (x+ , y + ), satisfying the hypotheses (3.6), (3.8). Then the asymptotic heteroclinic solution of system (3.1) in the quasi-stationary limit ² → 0 is given by (x0 (tˆ) = ϕ(y 0 (tˆ)), y 0 (tˆ)), where y 0 (tˆ) is a solution of equation (3.7) with initial condition (3.9).
3.3
Asymptotic series expansion
The approximate solution given by Prop. 3.1 is sufficient for many purposes. For example, if ² is very small, then the higher order approximations contain little useful information. However, in order to obtain more accuracy or estimate the error of approximation, one has to find higher order correction terms. Let us look for a solution of system (3.3) as an asymptotic power series in ²: x(tˆ) = x0 (tˆ) + ²x1 (tˆ) + ²2 x2 (tˆ) + · · · , y(tˆ) = y 0 (tˆ) + ²y 1 (tˆ) + ²2 y 2 (tˆ) + · · · .
(3.10)
By substituting the expansions (3.10) into the functions f (x, y) and g(x, y), after expanding them in a power series in ², we obtain f (x, y) = f 0 + ²fx x1 + ²fy y 1 + · · · ,
g(x, y) = g 0 + ²gx x1 + ²gy y 1 + · · · . 17
(3.11)
Here f 0 = f (x0 , y 0 ), g 0 = g(x0 , y 0 ) and 1 1 ∂f ∂f ∂f 1 · · · ∂x1 ∂xn . ∂y .. .. .. .. fx = , f = . . y . n ∂f n ∂f n · · · ∂f ∂x1 ∂xn ∂y
h , gx =
∂g ∂x1
···
∂g ∂xn
i
h i , gy =
∂g ∂y
,
(3.12)
are functions of tˆ evaluated at (x0 (tˆ), y 0 (tˆ)). Substituting (3.10)–(3.11) into (3.3), we obtain ²(x˙ 0 + ²x˙ 1 + · · · ) = f 0 + ²fx x1 + ²fy y 1 + · · · (3.13) y˙ 0 + ²y˙ 1 + · · · = g 0 + ²gx x1 + ²gy y 1 + · · · . Since, for any ², x(tˆ) → x± and y(tˆ) → y ± as tˆ → ±∞, the components of the expansions (3.10) must satisfy the following conditions for all k = 1, 2, . . .: x0 → x± , y 0 → y ± , xk → 0, y k → 0 as tˆ → ±∞.
(3.14)
Equating terms with the same power of ², we obtain a series of equations for the unknown functions x0 (tˆ), x1 (tˆ), . . . and y 0 (tˆ), y 1 (tˆ), . . .. For the zero-th order terms we recover equations (3.4) and (3.5); thus, x0 (tˆ) and y 0 (tˆ) are given by Prop. 3.1. For the first order terms in ², (3.13) yields: x˙ 0 = fx x1 + fy y 1 , y˙ 1 = gx x1 + gy y 1 .
(3.15)
The solution of this system is given in the following proposition. Proposition 3.2 Let us assume the hypotheses of Prop. 3.11 . Then the first order terms x1 (tˆ) and y 1 (tˆ) in the asymptotic expansion (3.10) have the form ¡ ¢ x1 (tˆ) = fx −1 (tˆ) x˙ 0 (tˆ) − fy (tˆ)y 1 (tˆ) , Z
tˆ
y (tˆ) = g (tˆ) 1
0
B(tˆ) = gx (tˆ)fx −2 (tˆ)fy (tˆ).
B(τ )dτ ,
(3.16) (3.17)
0
Proof: Let us write (3.15) as:
1
x˙ 0 − fy y 1 = fx x1 ,
(3.18)
y˙ 1 = gx x1 + gy y 1 .
(3.19)
in particular it means that the function g 0 (tˆ) is monotone for large |tˆ|.
18
Then (3.16) follows from (3.18) from multiplication by the inverse of the matrix fx (which is nonsingular by the assumptions of Prop. 3.1). Using (3.4), (3.5) and the chain rule one obtains x˙ 0 = −fx −1 fy y˙ 0 = −fx −1 fy g 0 .
(3.20)
Substituting this expression into (3.16) and using the result in (3.19) one gets y˙ 1 = −gx fx −1 (fx −1 fy g 0 + fy y 1 ) + gy y 1 .
(3.21)
Now using (3.20) with the chain rule, we find the expression g˙ 0 = gx x˙ 0 + gy y˙ 0 = −gx fx −1 fy g 0 + gy g 0 ,
(3.22)
which can be used in (3.21) to get
µ ¶ d y1 = −B, dtˆ g 0 where B is defined in (3.17). Solving (3.23) one obtains Z tˆ 1 0 ˆ 0 ˆ y = cg (t) + g (t) B(τ )dτ ,
(3.23)
(3.24)
0
where c is an arbitrary constant. The term cg 0 corresponds to the time-translations of the heteroclinic orbit. Thus, we can take c = 0, yielding (3.17). Now we have to prove that x1 and y 1 given by (3.16) and (3.17) satisfy the conditions (3.14). As fx is nonsingular, B = gx fx −2 fy is a smooth (C 1 ) function of tˆ with finite limits as tˆ → ±∞. Thus, B is bounded: |B(tˆ)| < Bmax for some Bmax . Then y 1 satisfies the inequalities ¯ ¯ Z tˆ ¯ ¯ ¯ ¯ ¯ ¯ ¯¢ ¡¯ ¯ 0 ˆ ¯ 1 ˆ |y (t)| = ¯g (t) B(τ )dτ ¯ ≤ Bmax ¯g 0 (tˆ)tˆ¯ ≤ Bmax ¯g 0 (tˆ)T ¯ + ¯g 0 (tˆ)(tˆ − T )¯ ≤ ¯ ¯ ¯Z ¯! à 0 ¯ ¯ ¯ 0 ¯ ¯ tˆ 0 ¯ ¯ ¯¢ ¡¯ ¯ ¯ ¯ ˆ ≤ Bmax g (t)T + ¯ g (τ )dτ ¯ ≤ Bmax ¯g 0 (tˆ)T ¯ + ¯y 0 (tˆ) − y 0 (T )¯ , ¯ T ¯
(3.25)
where tˆ and T are arbitrary (large) numbers belonging to the region where g 0 (tˆ) is monotone by the hypothesis of the proposition. Here we also used the relation y˙ 0 = g 0 . Now keeping T fixed and taking the limit tˆ → ±∞ in (3.25), we obtain limtˆ→±∞ |y 1 (tˆ)| ≤ Bmax |y ± − y 0 (T )|. Since y 0 (T ) → y ± as T → ±∞, then y 1 → 0 as tˆ → ±∞. By using this property in (3.16), it is straightforward to show that x1 → 0 as tˆ → ±∞. ¤ Similarly, under the same assumptions, one could find formulae for higher order correction terms in the expansions (3.10). 19
Remark 3.1 The hypothesis of monotonicity of g 0 (tˆ) for large tˆ in Prop. 3.2 is very natural: it is equivalent to the monotonicity of the function g(ϕ(y), y) in the neighborhood of y ± . It holds, for example, if g(ϕ(y), y) has nonzero derivative (of any order) with respect to y at y ± . In this work, we deal with the (exotic) non-hyperbolic case where all the derivatives of g(ϕ(y), y) vanish at y + . However, the monotonicity condition is satisfied.
20
Chapter 4 Coflow combustion 4.1
Introduction
A large number of studies on the structure of the combustion front have been reported since the 1950s, see [2, 4, 5, 7, 10, 32, 40], for instance. However, these studies present two peculiarities. First, they do not take into account other waves that occur in the combustion problem. As there are interactions between the combustion wave and these other waves, the solution of the Riemann problem taking into account all possible waves is relevant. Secondly, the combustion wave at the reservoir side (see Figure 2.1) can be controlled by the lack of oxygen or by low temperature. The works cited above study the more common temperature controlled case, which is not so amenable to analysis as the oxygen controlled case. The techniques used to study the combustion wave controlled by low temperature are very different from those presented here. For example, in [11] the approximate solution is a transient wave, i.e., this wave has a profile which changes very slowly. In this text we address the oxygen controlled case. A first step in this direction was taken in [46] for flow in reservoirs at relatively high temperatures: we now summarize the main results in [46]. Under the assumption that the combustion front governed by (2.23)-(2.26) moves forward exhausting all oxygen and fuel, i.e., the combustion reaction is fuel deficient behind the front and oxygen deficient ahead of it, the following theorem was proved in [46]: assuming that the combustion front has a traveling wave profile, given the injection and the reservoir conditions, then the constant states and the speeds of all waves in the wave sequence defining the Riemann solution are uniquely determined. The theorem quoted above is scientifically incomplete, since it does not address the existence 21
of the traveling wave profile for the combustion wave: this is the main issue of this chapter. We performed numerical simulations for the model, obtained the traveling wave profile and compared it to the quasi–stationary approximation calculated semi-analytically. In this sense, this text completes the results of [46]. In Chapter 2 we presented the physical model (2.1)-(2.4), (2.7) in terms of masses and improved it by constructing analogous model (2.28)-(2.31), (2.27) in terms of molar masses. Both models generate the same dimensionless system of equations (2.23)-(2.26). From the mathematical point of view the difference between these two models is that the scaled stoichiometric coefficient µ is equal to 0 for the model in terms of molar masses. In order to maintain the generality we keep µ for our analysis in this chapter and also in Chapters 5 and 6.
4.2
The combustion wave
We consider the forward combustion wave with speed V > 0. Physically, there is no combustion ahead or behind this front, i.e, the reaction rate Φ must vanish. We consider that there is lack of fuel behind the combustion front, which is translated by condition (4.1); ahead of the combustion front, we consider oxygen deficiency as given by condition (4.2):
θu = 1,
Y b = 1,
η b = 1,
v b > 0,
(4.1)
Y u = 0,
η u = 0,
v u > 0.
(4.2)
The superscripts b and u stand for burned and unburned. Of course, the reaction rate defined in (2.21) vanishes for the boundary conditions (4.1)–(4.2). The combustion front is modeled as a steady traveling wave of system (2.23)–(2.26) with propagation speed V . The states along such a traveling wave depend only on the moving ˆ coordinate ξ = x − V t, i.e, θ(x, t) = θ(ξ), Y (x, t) = Yˆ (ξ) and η(x, t) = ηˆ(ξ). Then Eqs. (2.23)– (2.26) are transformed into (4.3)-(4.6), with hats omitted (for simplicity we use b = 1): d d2 θ d (av − V θ) = 2 − q (V η), dξ dξ dξ ¶ µ µ ¶ 1 d 1 dY d 1 d (v − φV )Y = + µ (V η), dξ θ Le dξ θ dξ dξ ¶ µ d d 1 (v − φV ) = −µg (V η), dξ θ dξ d (V η) = −Φ(θ, Y, η), dξ 22
(4.3) (4.4) (4.5) (4.6)
where Eq. (2.20) was used to eliminate ρ. Integrating the equations (4.3)-(4.5) from ξ to +∞ we obtain: dθ − qV η − av + V θ = −qV η u − av u + V θu ; dξ 1 dY v − φV v u − φV u + µV η − Y = µV η u − Y ; Le θ dξ θ θu v − φV v u − φV + µg V η = + µg V η u . θ θu
(4.7) (4.8) (4.9)
A traveling wave modeling the combustion front is an orbit of system (4.6),(4.7)-(4.9), connecting the burned state (4.1) to the unburned state (4.2). Using the fact that the burned and the unburned states must be equilibria of the system (4.3)-(4.6) we obtain: dθ − qV η − av + V θ = −av u + V ; dξ v − φV 1 dY + µV η − Y = 0; Le θ dξ θ v − φV + µg V η = v u − φV. θ
(4.10) (4.11) (4.12)
We can use (4.12) to obtain the volumetric flow rate v of the gas phase: v = φV + θ(v u − φV ) − V θµg η.
(4.13)
Substituting (4.13) in (4.10) we obtain: dθ = a(φV + θ(v u − φV ) − V θµg η) − (av u − V ) + qV η − V θ. dξ
(4.14)
Now we use (4.12) in (4.11) to obtain: 1 dY = Y (v u − φV − µg V η) − µV η. Le θ dξ
(4.15)
Using the condition (4.1) and manipulating the equations (4.13)–(4.15) we obtain the following expressions for the combustion wave speed V , the scaled temperature θb and the gas speed v b : V =
vu , (µ + µg + φ)
θb =
1 + q − a(µ + µg ) 1 − aµ
and v b = φV + θb V µ.
(4.16)
These relations coincide with the Rankine–Hugoniot shock conditions for system (2.23)–(2.26) with left and right states defined by (4.1)–(4.2): they show that the injection gas speed v u , the production gas speed v b and the combustion wave speed V are proportional, and that the 23
nondimensional temperature behind the combustion front does not depend on the injected gas speed. Using the relations (4.16), we derive from (4.14), (4.15) and (4.6) the traveling wave system of ordinary differential equations that models the combustion front: ¡ ¢ dθ = f θ ≡ V a(θ(µ + µg − µg η) − µ − µg ) + 1 + qη − θ , dξ ¡ ¢ dY = f Y ≡ V Le θ (µ + µg − µg η)Y − µη , dξ dη 1 = f η ≡ − Φ(θ, Y, η), dξ V
(4.17) (4.18) (4.19)
where the notation f θ , f Y , and f η will be used later.
4.2.1
Parameter analysis
As we have shown in Chapter 3, in order to apply the singular perturbation method to solve system (4.17)–(4.19), the right-hand sides of equations (4.17)–(4.19) have to satisfy the relations: f η ¿ f θ,
fη ¿ fY .
We define the parameter ² as: α ² = exp V
µ
−γ θb
(4.20)
¶ .
(4.21)
Thus the inequality f η < ² is always satisfied. Among all the parameter that appear in the problem the reservoir temperature T res and gas injection speed v i are more likely to vary. In Table 2.1 the reservoir temperature was fixed T res = T˜0 , however it typically varies between 273K and 1000K [37], the typical value for v i is between 200 [m/day] and 500 [mday], see [2]. We compare the value of the parameter ² with the largest terms in f θ , f Y using the values of Table 2.2 and 2.3. The regions in parameter space T res × v i that correspond to first and second inequality of (4.20) are plotted respectively with dark and light colors. Figure 4.1 corresponds to parameter values used in [2] summarized in Tables 2.1 and 2.2. Figure 4.2 corresponds to parameter values used in [46] summarized in Tables 2.3 and 2.4.
4.2.2
Combustion wave profile
In Chapter 3 we proved several results on singular perturbation theory that will be used here. The difference between the application to combustion waves in this section and the theory 24
650 600 550 500 T [K]
450 400 350 300 250 200
400
600
800
1000 1200 vi [m/day]
1400
1600
1800
2000
Figure 4.1: Regions in parameter space T res × v i corresponding to small epsilon. The region that satisfies the first inequality of (4.20) is printed in dark gray. The region that satisfies the second inequality of (4.20) is printed in light gray. Here we use the parameter values from Tables 2.1 and 2.2.
700
600
500 T [K] 400
300
200 0
500
1000
1500 vi [m/day]
2000
2500
3000
Figure 4.2: Regions in parameter space T res × v i corresponding to small epsilon. The region that satisfies the first inequality of (4.20) is printed in dark gray. The region that satisfies the second inequality of (4.20) is printed in light gray. Here we use the parameter values from Tables 2.3 and 2.4.
25
described in Chapter 3 is that here we have decided to maintain the small parameter ² hidden inside the field component f η . This change of notation does not affect any result. Another notational difference is that in system (7.1) we have used (x1 , x2 , y), (f 1 , f 2 , ²g), and t instead of (θ, Y, η), (f θ , f Y , f η ) and ξ in (4.17)-(4.19). The quasi-stationary combustion wave According to (3.4), for a fixed value of V the quasi-stationary approximation of the system (4.17)-(4.19) is obtained by neglecting dθ/dξ and dY /dξ, yielding: θ0 (η 0 ) =
1 + qη 0 − a(µ + µg ) , 1 − a(µ + µg − µg η 0 )
Y 0 (η 0 ) =
µη 0 . µ + µg − µg η 0
(4.22)
The quasi-stationary approximation of the heteroclinic orbit parameterized by η 0 is: ¡ ¢ Γ0 = θ0 (η 0 ), Y 0 (η 0 ), η 0 .
(4.23)
We want Γ0 to be a connected curve joining the equilibria of the vector field in (4.17)–(4.19). Thus we need the denominators in (4.22) not to vanish for any η 0 ∈ [0, 1]; this is true for the parameter values given in Table 2.3. In order to obtain the approximate solution of system (4.17)-(4.19), we have to find η 0 in terms of ξ in (4.23). For this purpose, we substitute expressions in (4.22) for θ0 and Y 0 into (4.19) and solve the resulting ODE for η 0 (ξ) with arbitrary initial data η 0 (ξ = 0) taken in the interval (η u , η b ) = (0, 1). µ ¶ dη 0 α µη 0 (1 − η 0 ) 1 − a(µ + µg − µg η 0 ) η = f (Γ0 ) ≡ − exp −γ dξ V µ + µg − µg η 0 1 + qη 0 − a(µ + µg ) 0 η (0) = 0.5
(4.24)
Once the problem parameters are specified, this initial value problem can be solved (at least numerically). The numerical solutions for the parameter values from Tables 2.3 and 2.2 are shown in Figures 4.3 and 4.4 respectively. First order approximation for combustion waves We use the notation ∂θ f θ (ξ), ∂Y f θ (ξ), ∂η f θ (ξ), ∂θ f Y (ξ), . . . for the partial derivatives evaluated along the quasi-stationary solution (θ0 (ξ), Y 0 (ξ), η 0 (ξ)). These derivatives can be easily calculated, see [14]. Let us look at the first order approximation of the solution as a perturbation of 26
2.5 θ Y η
2 1.5 1 0.5 0 −5000
0
5000 ξ
10000
15000
Figure 4.3: Zero-order approximation of the traveling wave. We used dimensionless parameter values from Table 2.2.
the quasi-stationary one. θ(ξ) = θ0 (ξ) + θ1 (ξ), Y (ξ) = Y 0 (ξ) + Y 1 (ξ), η(ξ) = η 0 (ξ) + η 1 (ξ).
(4.25)
The equations for the first order corrections θ1 , Y 1 , η 1 obtained from the system (4.17)-(4.19) take the form: θ˙0 = (∂θ f θ )θ1 + (∂Y f θ )Y 1 + (∂η f θ )η 1 ,
(4.26)
Y˙ 0 = (∂θ f Y )θ1 + (∂Y f Y )Y 1 + (∂η f Y )η 1 ,
(4.27)
η˙ 1 = (∂θ f η )θ1 + (∂Y f η )Y 1 + (∂η f η )η 1 ,
(4.28)
(see (3.15) in Chapter 3, where the equations (4.26), (4.27) correspond to (3.18), and (4.28) corresponds to (3.19)). Using (4.22) one obtains ∂Y f θ = ∂θ f Y = 0. Thus (4.26), (4.27) can be rewritten as: "
θ1 Y
1
#
" =
(∂θ f θ )−1
# Ã"
0 Y −1
0
(∂Y f )
θ˙0 Y˙ 0
#
" −
∂η f θ ∂η f
Y
#
! η1 .
(4.29)
Using (4.22) and (4.24) in (4.29) we obtain explicitly θ1 and Y 1 as linear functions of η 1 . Now substituting θ1 and Y 1 into Eq. (4.28) we obtain the ODE for η 1 (ξ). As it is shown in Prop. 3.2, the solution of the resulting ODE has the form: Z η 1 (ξ) = f η
B(τ )dτ , 0
i
h
ξ
B=−
∂θ f η ∂Y f η 27
"
∂θ f θ
∂Y f θ
∂θ f Y
∂Y f Y
#−2 "
∂η f θ ∂η f Y
# .
(4.30)
θ Y η Φ
2 1.5 1 0.5 0
0
5
(a)
ξ
10
15
20 5
x 10
2 1.5 θ Y η Φ
1 0.5 0 −5
0
5
(b)
ξ
10
15
20 5
x 10
Figure 4.4: Zero-order approximation of the traveling wave (monotone) and the combustion rate Φ (hump) scaled by 2 · 107 . In (a) γ = 2.0 and α = 1.6 · 10−6 were used. In (b) the original dimensionless values from Table 2.3 were used. It is possible to evaluate B explicitly, (see [14]). The equations (4.29) and (4.30) make sense if the Jacobian determinant ∂(f θ , f Y )/∂(θ, Y ) (denoted det(fx ) in Chapter 3) does not vanish for appropriate parameters. It can be shown that: " # 0 0 ∂θ f θ ∂Y f θ 2 0 (µ + µg − µg η )(K + qη ) det = −V L , e (K + aµg η ) K − aµg η 0 ∂θ f Y ∂Y f Y
(4.31)
where K = 1 − a(µ + µg ). For V given in (4.16) and the parameter values given in Table 2.3 the factors in (4.31) do not vanish and the first order approximation of the combustion wave is well defined. We have plotted the corrections η 1 (η 0 ), θ1 (η 0 ) and Y 1 (η 0 ) in Figures 4.5 and 4.6. We have shown that the amplitude of the first-order approximation is small. This means that the parameter ² is indeed small as described in Propositions 3.1 and 3.2 and that the zero-order approximations shown in Figures 4.4 and 4.3 are good approximations of the combustion wave profile. 28
0.1 0.08
1
θ
Y1 η1
0.06 0.04 0.02 0 −0.02 0
0.1
0.2
0.3
0.4
0.5 η0
0.6
0.7
0.8
0.9
1
Figure 4.5: The plot represents the first order correction η 1 (η 0 ), θ1 (η 0 ) and Y 1 (η 0 ) corresponding to zero-order approximation from Figure 4.3. Here we have used the dimensionless parameter values from Table 2.2. −4
20
x 10
15
θ1
10
Y
1
η1
5 0 −5 0
0.2
0.4
0.6
0.8
1
η0
Figure 4.6: The plot represents the first order correction η 1 (η 0 ), θ1 (η 0 ) and Y 1 (η 0 ) corresponding to zero-order approximation from Figure 4.4. Here we have used the dimensionless parameter values from Table 2.3.
Monotonicity ¡ ¢ In order to use Proposition 3.2 we have to verify that f η θ0 (η 0 (ξ)), Y 0 (η 0 (ξ)), η 0 (ξ) is monotone in ξ in the neighborhood of the equilibria. However, the quasi-stationary approximation of the traveling wave solution of (2.16)–(2.19) coincides with the solution of the model solved in Chapter 5. We prove the monotonicity hypotheses in Section 5.3.1. 29
Explicit formulae of the approximate solution In Section 4.2.2 we have solved the ODE (4.24) numerically. Here we obtain explicitly an approximation of the solution using the fact that a 0 and Φ = 0, for θ ≤ 0. Here we focus on the forward combustion front with propagation speed V > 0. The boundary conditions for the combustion wave are the same as in (4.1)-(4.2):
θu = 1,
Y b = 1,
η b = 1,
Y u = 0,
η u = 0,
v b > 0, v u > 0;
where the superscripts b and u mean burned and unburned. The states along such a traveling wave depend only on the moving coordinate ξ = x − V t, ˆ i.e, θ(x, t) = θ(ξ), Y (x, t) = Yˆ (ξ) and η(x, t) = ηˆ(ξ). Then Eqs. (5.1)–(5.5) are transformed into (5.6)-(5.9), with hats omitted: d (av − V θ) = qΦ, dξ µ ¶ d Y (v − φV ) = −µΦ, dξ θ µ ¶ d v − φV = µg Φ, dξ θ d (V η) = −Φ, dξ
37
(5.6) (5.7) (5.8) (5.9)
where Eq. (5.5) was used to eliminate ρ. The boundary conditions for system (5.6)–(5.9) are the conditions (4.1) at −∞ and (4.2) at +∞. Notice that (5.6)-(5.9) is a first-order ODE system, which can be rewritten in a matrix form as:
−V
0 (V φ − v) V + 2 θ aθ 0
0
0
Vφ−v −θ
0
0
0
0
−V
a
θξ
q
0 Y −µ − Y µg ξ = q η µg − 0 ξ aθ vξ 1 0
Φ.
(5.10)
The matrix on the left-hand side of Eq. (5.10) can be inverted, provided that: V 6= 0 ≡ λη , V 6= v/φ ≡ λY , V 6= av/(θ + aφ) ≡ λθ ,
(5.11)
We will prove that the ODE system of Eq. (5.10) has a solution with boundary conditions defined by (4.1) and (4.2) for certain values of V .
5.2.1
The Rankine-Hugoniot locus
In order to obtain relations between the boundary conditions (4.1) and (4.2) so that system (5.10) has a solution, we substitute (5.9) into (5.6)-(5.8) obtaining: d (av − V θ + qV η) = 0, dξ µ ¶ d (v − φV )Y − µV η = 0, dξ θ µ ¶ d v − φV + µg V η = 0. dξ θ
(5.12) (5.13) (5.14)
This means that the quantities inside the derivatives are constant in ξ, thus their value at some finite ξ is the same as the one at ξ → ∞: av − V θ + qV η = av u − V − qV η u , φV Y vY − − µV η = v u Y u − φV Y u − µV η u , θ θ v φV − + µg V η = v u − φV + µg V η u . θ θ
(5.15) (5.16) (5.17)
Next we can take the limit ξ → −∞ on the left hand side of Eqs. (5.15)-(5.17) and substitute condition (4.1) on the left hand side and condition (4.2) on the right hand side of the resulting 38
system to obtain: av u − V = av b − V θb + qV, v b − φV 0= − µV, θb v b − φV v u − φV = + µg V. θb
(5.18) (5.19) (5.20)
Physically, it is reasonable to assume that we know the Darcy velocity (v b ) of the injected gas (this choice will be useful in Section 5.4), so we have three unknowns θb , v u , V and three equations (5.18)-(5.20). We perform the same analysis as in Section 4.2 to obtain: V =
vu , (µ + µg + φ)
θb =
1 + q − a(µ + µg ) 1 − aµ
and v b = φV + θb V µ.
These relations coincide with (4.16).
5.2.2
Combustion wave profile
In this section we use the boundary conditions defined in the introduction of Section 5.2 and the equations (5.12)-(5.14) to obtain θ, Y, v as functions of η and of the parameters, and substitute the result in the equation for ηξ in (5.10). Then we compare these results to the solutions for the system (2.16)-(2.20) obtained by singular perturbation techniques in Chapter 4. From equations (5.15)-(5.17) we obtain: av − V θ = av u − V − qV η, (v − φV ) Y = µV η, θ v = φV − µg V ηθ + θ(v u − φV ) = φV − µg V ηθ + V θ(µ + µg ),
(5.21) (5.22) (5.23)
where we have used (4.16) to obtain (5.23). Substituting v from (5.23) and v u from (4.16) into (5.21), dividing by V and simplifying, we obtain: θ=
a(µ + µg ) − 1 − qη . a(µ + µg − µg η) − 1
(5.24)
µη . µ + µg − µg η
(5.25)
Using (5.23) in (5.22) we get: Y =
Finally, using (5.24), (5.25) and (2.21) we can rewrite the equation for ηξ in (5.10) as: µ µ ¶ ¶ αY (1 − η) −γ 1 − a(µ + µg − µg η) −αµη(1 − η) ηξ = exp exp γ = . −V θ (µ + µg − µg η)V a(µ + µg ) − 1 − qη 39
(5.26)
We can solve this ODE with any initial condition η(0) = η 0 , where 0 < η 0 < 1 and substitute the result into the equations (5.23), (5.24) and (5.25) for θ, Y , v and obtain the combustion wave profile. Solving these equations with Matlab with initial condition η 0 = 0.5 we obtain the wave profile shown on the left side of Figure 5.1. The result coincides with the quasi-stationary approximation given in Chapter 4.
Figure 5.1: On the left: the traveling wave solution of the system (5.26). On the right: the first order approximation of the traveling wave of the system (2.16)-(2.19) from [18]. Variables: θ (segmented line), Y (dotted), η (circles) and combustion rate Φ (solid line) as functions of ξ. We use γ = 2.
Approximate explicit solution We have solved the ODE (5.26) numerically, but sometimes it is useful to have an explicit approximation for the solution. However, the traveling wave solution of (5.1)-(5.4) coincides with the quasi-stationary approximation studied in Chapter 4. Thus, the implicit solution of ODE (4.34) using the exponential integral function is (4.45) and its logarithmic approximation is (4.46). The dimensional solution In this section, we study the non-dimensional equations and perform non-dimensional analysis, however for applications it is important to know the characteristic values of our solution in actual units. As the traveling wave solution of (5.1)-(5.4) coincides with the quasi-stationary 40
approximation studied in Chapter 4, the dimensional analysis coincides with that done in Section 4.2.3. The characteristic length of the combustion wave is x˜ ≈ 0.07 [m]. This result is compatible with experimental data [22].
5.3
Testing the solution within the combustion wave
In order to solve the linear system (5.10), the restrictions (5.11) need to be satisfied for V . On the other hand our physical model imposes other restrictions related to the boundary conditions (4.1) and (4.2) for the combustion waves. Verifying these restrictions is the goal of this section. We perform this analysis using data from Table 2.3; for the Table 2.2 the calculations are analogous.
5.3.1
Monotonicity
Here we will prove that the solutions θ(ξ), Y (ξ) and η(ξ) of system (5.10) are monotonic in ξ. The combustion rate defined by (2.21) is always positive, thus from (5.10) or (5.26) we see that η(ξ) is monotone decreasing. In order to prove that θ(ξ) is monotonic we use (5.24) obtaining: dθ −q(a(µ + µg − µg η) − 1) + (a(µ + µg ) − 1 − qη)aµg (q − aµg )(1 − a(µ + µg )) = = . 2 dη (a(µ + µg − µg η) − 1) (a(µ + µg − µg η) − 1)2 (5.27) The numerator of (5.27) is independent of η and it is positive for the parameter values from Table 2.3 and the denominator is positive. As η(ξ) is monotonic, θ(ξ) is monotone decreasing and thus θb from (4.16) satisfies θb > θu . In order to prove the monotonicity of Y (ξ) we use (5.25) to obtain dY /dη: dY µ(µ + µg − µg η) − µη(−µg ) µ(µ + µg ) = = . dη (µ + µg − µg η)2 (µ + µg − µg η)2
(5.28)
As the numerator of (5.28) is constant in η and the denominator is always positive, the function Y (ξ) is monotonic. As Y u < Y b we conclude that Y (ξ) is monotone decreasing. For the gas speed v(η), given by (5.23) we will prove that it is monotonic close to the equilibria. Using (4.16) we obtain that v u − φV = V (µ + µg ). From (5.23) we obtain: dθ d (v − φV ) = V (µ + µg − µg η) − θV µg . dη dη 41
(5.29)
Using (5.27) and substituting the parameter values from Table 2.3 we obtain that v(η) is monotonic close to the equilibria corresponding to the burned (η = 1) and unburned (η = 0) states. At this point we have proved that the functions θ(ξ), Y (ξ), η(ξ) are monotonic for −∞ < ξ < ∞ and v(ξ) is monotonic close to the equilibria, so they satisfy the boundary conditions given in (4.1) and (4.2). In other words, the wave speed V is physically admissible.
5.3.2
Verifying the characteristic inequalities
In this subsection we want to prove that V defined in (4.16) satisfies the restrictions (5.11). Obviously, V satisfies (5.11a). For (5.11b,c) we will show: av(η) v(η) 0, v i > 0 and scaled reservoir temperature θu = 1, the constant states and the speeds of all waves in the wave sequence (5.42) are uniquely determined. Proof. First of all, analogously to [46], the characteristic pair (5.40) corresponds to a contact discontinuity and there is a relationship between the injection conditions U i and the burned state U b :
vi vb a i =a b . (5.43) θ + aφ θ + aφ Now we get four independent relationships (4.16) and (5.40) between the parameters θb , θi , V , v b , v u and v i , so the result of the theorem is to be expected. In Figure 5.2 we see that the speeds and the intermediate states in the wave sequence (5.42) are determined as follows. Substituting θb from (4.16) into (5.43) and simplifying we obtain the burned gas speed v b as function of v i and θi : vb =
1 + q + a(φ − aφµ − µ − µg ) i v. (1 − aµ)(θi + aφ)
(5.44)
Next we use (5.44) with the equations for v b from (4.16) in order to obtain the combustion wave speed V as function of v i and θi . Finally, we substitute the resulting V into the first equation in (4.16) and obtain v u as function of v i and θi . This completes the proof of Theorem 5.1.
5.5
Conclusion
In this chapter we describe an interesting and simple non-diffusive gas-solid co-flow combustion model. We obtain the wave profile and solve the corresponding Riemann problem. Comparing 44
Figure 5.2: Regions separated by immobile, thermal and combustion waves in the Riemann solution. Values of θ, Y , η and v in each region.
these results to the ones obtained previously for the more general model we conclude that the diffusion terms do not affect qualitatively the propagation of the combustion wave. This property can be generalized in the following way. Let us assume that it is possible to obtain a traveling wave solution for a system of conservation laws by using the singular perturbation technique as it was done in Chapter 4. In this case the traveling wave solution of the simplified system obtained by neglecting the diffusive terms is a good approximation to the original traveling wave solution. The main part of this Chapter was published in [20].
45
Chapter 6 Numerical methods 6.1
Introduction
When for some reason the explicit solution for the partial differential equations is not obtainable and we want to understand the behavior of the solution, numerical simulation is the best option. This is our case: usually, systems of partial differential equations of the Convection-DiffusionReaction type appearing in the physical formulation in Chapter 2 do not have explicit solutions. Many different numerical methods were developed in order to solve systems of PDEs: Finite Elements Methods, Boundary Element Methods, Finite Difference Methods and others. As all the flows we consider in this work are one dimensional, our choice is the Finite Difference Method. One of the physical phenomena we want to study is the formation of stable combustion waves, which may require simulation for long times. Large time steps are required for practical simulation. Thus we discard all explicit schemes because of CFL condition and focus only on implicit finite difference schemes with second order accuracy, see [47]. Our main goal here is to simulate numerically the systems of PDEs introduced in Section 2.1 and Chapter 7. In general, they can be written as systems of reaction-convection-diffusion equations:
µ ¶ ∂ ∂ ∂ ∂W G(W ) + F (W ) = H(W ) + Ψ(W ), (6.1) ∂t ∂x ∂x ∂x depending on the number of equations the model we are simulating possesses the matrix H can be 4 × 4 for the model with four equations introduced in Section 2.1, or 3 × 3 for the simplified combustion model with three equations that we will introduce in Chapter 7. The vectors W , G, F , Ψ will be 4 × 1 or 3 × 1 respectively. 46
The system (2.23)-(2.26) with b = 1 from Section 2.1 is a particular case of (6.1) with: θ θ av 1 0 0 0 q Y φY /θ vY /θ 0 L1 θ 0 0 −µ e W = η , G = φ/θ , F = v/θ , H = 0 0 0 0 , Ψ = µ Φ, g v η 0 0 0 0 0 1 (6.2) where Φ is given by Arrhenius’ law (7.4). The system (7.1)-(7.3) from Chapter 7 is another particular case of (6.1) with T T W = Y , G = Y η η
aT
1 0 0
q
, F = vY , H = 0 0 0 , Ψ = −µ Φ. 0 0 0 0 −1
(6.3)
In this chapter we recall the classical (linear or nonlinear) Crank-Nicolson scheme and show why for the models of the type (2.23)-(2.26) this scheme cannot be applied. Next we introduce the Box scheme and combine it with the Crank-Nicolson scheme to construct two other schemes (called the splitting scheme and the hybrid scheme) which can be used to simulate the models of the type (2.23)-(2.26). Nonlinear implicit finite difference method require the usage of Newton method in each time step. The detailed analysis of this method, its convergence rate can be found in [26]. For implementation details, see [38]. Notation We introduce the notation used in this chapter. Following [47], the space direction denoted by x is discretized into M grid points with index m = 1 . . . M , where m = 1 and m = M correspond to the boundaries of the interval where the calculation takes place. The grid position m corresponds to x = (m − 1)h, where h is the grid size. We work with uniform grids (h does not depend on m). Analogously the time is denoted by t with time index denoted by n and the time step is k. However, we consider timestep-adaptative finite difference schemes, so k may change from one grid level to another. Generally we get k = k(n) and the time index n P corresponds to t = ni=1 k(i). As all the numerical schemes we analyze are two time levels n and n + 1 dependent, we sim¯ m instead of Wmn+1 . Another simplification plify the notation and use Wm in place of Wmn and W (l) ¯m useful for Newton’s method is used frequently. The notation X will mean the iteration l of
47
Newton’s method to find the solution at position m and time n + 1. There are many functions (l) ¯ m ) by F¯m , G(W ¯ m+1 depending on W evaluated at different grid points. We indicate F (W ) by ¯ (l) ¯ (l) G m+1 and so on. Finally, the derivatives in W of function F at point (Wm ) is indicated by (l) (DW F¯ )m .
6.1.1
Crank-Nicolson method
The Crank-Nicolson finite difference scheme is centered at position (m, n + 1/2) and uses a six point discretization, see Figure 6.1 for its stencil. Following [47], we discretize the system (6.1) as: £
1 4h2 1 4h2
1 k
¡
¢ ¯ m − Gm + G
1 4h
¡
¢ F¯m+1 − F¯m−1 − Fm−1 + Fm+1 =
¤ ¯ m+1 + H ¯ m )(W ¯ m+1 − W ¯ m ) − (H ¯m + H ¯ m−1 )(W ¯m − W ¯ m−1 ) + (H
(6.4)
[(Hm+1 + Hm )(Wm+1 − Wm ) − (Hm + Hm−1 )(Wm − Wm−1 )] + ¡ ¢ 1 ¯ Ψm + Ψm . 2
Figure 6.1: Black squares - stencil for the Crank-Nicolson scheme on the left and for the Box scheme on the right. We indicate auxiliary points with circles.
Using λ = k/h and µ = k/h2 we rewrite (6.4): ¢ ¡ ¯ m − Gm + G µ 4 µ 4
£
λ 4
¡
¢ F¯m+1 − F¯m−1 − Fm−1 + Fm+1 =
¤ ¯ m+1 + H ¯ m )(W ¯ m+1 − W ¯ m ) − (H ¯m + H ¯ m−1 )(W ¯m − W ¯ m−1 ) + (H
[(Hm+1 + Hm )(Wm+1 − Wm ) − (Hm + Hm−1 )(Wm − Wm−1 )] + ¢ ¡ k ¯ Ψm + Ψm . 2
48
(6.5)
In the general case H, F , G and Ψ are non-linear functions of W . In order to solve these equations we use Newton’s method, which consists in linearizing H, F , G and Ψ for ¯ (l) . The next approximation is defined by the time (n + 1) over an approximate solution W ¯ (l+1) = W ¯ (l) + ∆W (l) ; we will use ∆W (l) as the unknown rather than W (l) : W ¯ (l+1) = G ¯ (l) + (DW G) ¯ (l) ∆W (l) , G m m m m
(l) ¯ (l+1) ¯ (l) ¯ (l) G m+1 = Gm+1 + (DW G)m+1 ∆Wm+1 ,
(6.6)
and proceed similarly for F , H and Ψ. In order to simplify notation we will write ∆W instead of ∆W (l) . Linearizing we rewrite (6.5) as: ³ ´ ¯ (l) ¯ (l) G m + (DW G)m ∆Wm − Gm + ³ ´ (l) (l) (l) (l) λ F¯m+1 + (DW F¯ )m+1 ∆Wm+1 − F¯m−1 − (DW F¯ )m−1 ∆Wm−1 − Fm−1 + Fm+1 = 4
µ ¯ (l) (Hm+1 4
¯ (l) ¯ (l) ¯ (l) + (DW H) m+1 (∆Wm+1 ) + Hm + (DW H)m (∆Wm )) (l) ¯ m(l) − ∆Wm )− ¯ m+1 (W + ∆Wm+1 − W
µ ¯ (l) (Hm 4
¯ (l) ¯ (l) ¯ (l) + (DW H) m (∆Wm ) + Hm−1 + (DW H)m−1 (∆Wm−1 ))
(6.7)
(l) ¯ m−1 ¯ m(l) + ∆Wm − W − ∆Wm−1 )+ (W µ 4
[(Hm+1 + Hm )(Wm+1 − Wm ) − (Hm + Hm−1 )(Wm − Wm−1 )] + ´ ³ (l) k ¯ ¯ (l) ∆W + Ψ + (D Ψ) Ψ m m m m . W 2
¯ (l) ¯ is a tri-linear form. For example, (DW H) ¯ (l) One has to notice that DW H m (∆Wm ) · Wm is a ¯ (l) ¯ (l) ¯ (l) ¯ (l) vector, and (DW H) m (∆Wm )· Wm is written as h(DW H)m , ·, Wm i∆Wm when necessary. Using this notation we rewrite the system (6.7) as: h i (l) (l) (l) (l) (l) ¯m ¯ m−1 ¯ (l) ¯ ¯ − λ4 (DW F¯ )m−1 − µ4 (H +H ) + µ4 h(DW H) , ·, ( W − W )i ∆Wm−1 + m m−1 m−1 h µ ¯ (l) ¯ (l) ¯ (l) ¯ (l) ¯ (l) (DW G) m + 4 (Hm + Hm+1 + Hm + Hm−1 )− i (l) (l) µ k ¯ m−1 ¯ m+1 ¯ m(l) + W ¯ (l) ¯ m ∆Wm + )i − , ·, ( W − 2 W h(D H) (D Ψ) m W W 4 2 h i (l) (l) (l) (l) (l) µ ¯ (l) µ λ ¯ ¯ ¯ ¯ ¯ (D F ) − ( H + H ) − h(D H) , ·, ( W − W )i ∆Wm+1 = m m W W m+1 m+1 m+1 m+1 4 4 4 λ ¯ (l) ¯ (l) ¯ (l) −(G m − Gm ) − 4 (Fm+1 − Fm−1 + Fm+1 − Fm−1 )+
h i (l) (l) (l) (l) (l) (l) (l) (l) ¯ ¯ ¯ ¯ ¯ ¯ ¯ ¯ (Hm+1 + Hm )(Wm+1 − Wm ) − (Hm + Hm−1 )(Wm − Wm−1 ) + h i µ k ¯ (l) [(H + H )(W − W ) − (H + H )(W − W )] + Ψ + Ψ . m m+1 m m+1 m m m−1 m m−1 m 4 2 µ 4
49
(6.8)
The system (6.8) ia s block tridiagonal linear system of the form:
B2
C2 .. .
0
Am Bm 0
Cm .. . AM −1 BM −1
∆Wm .. . ∆WM −1
(M −2)×(M −2)
∆W2 .. .
M −2
T2 .. .
= Tm . . . TM −1
.
(6.9)
M −2
Assuming the coefficient matrix is nonsingular, this system can be solved with the method explained in Section 6.1.4 were the blocks are given by: h i (l) (l) (l) (l) (l) ¯ ¯m ¯ m−1 ¯ (l) ¯ ) + µ4 h(DW H) , ·, ( W )i , +H − W Am = − λ4 (DW F¯ )m−1 − µ4 (H m m−1 m−1 h µ ¯ (l) ¯ (l) ¯ (l) ¯ (l) Bm = (DW G) m + 4 (Hm−1 + 2Hm + Hm+1 )− h Cm =
µ ¯ (l) ¯ (l) h(DW H) m , ·, (Wm+1 4 (l) λ (DW F¯ )m+1 4
i (l) ¯ m(l) + W ¯ m−1 ¯ m , − 2W )i − k2 (DW Ψ)
i (l) (l) (l) (l) ¯ m+1 ¯m ¯ (l) ¯ ¯ +H ) − µ4 h(DW H) )i , − µ4 (H , ·, ( W − W m m+1 m+1
h
(6.11) (6.12)
λ ¯ (l) ¯ (l) ¯ (l) Tm = −(G m − Gm ) − 4 (Fm+1 − Fm−1 + Fm+1 − Fm−1 )+
i (l) (l) (l) (l) (l) (l) ¯ m−1 ¯ m−1 ¯ m(l) − W ¯m ¯ m+1 ¯ m(l) ) − (H ¯ m+1 ¯m ) + +H )(W )(W −W (H +H i h µ k ¯ (l) + Ψ [(H + H )(W − W ) − (H + H )(W − W )] + Ψ m m . m+1 m m+1 m m m−1 m m−1 4 2 µ 4
(6.10)
(6.13)
The terms T2 and TM −1 are a somewhat different: in order to obtain T2 one has to substitute W1 , H1 by Wl , Hl and for TM −1 one has to substitute WM , HM by Wr , Hr respectively. The terms W1 , H1 and Wr , Hr are left and right Dirichlet boundary conditions. Newton’s method is applied to the system (6.9) until ||∆W || < ²C /||W ||, where ²C is a tolerance value; here we use the Euclidean norm || · ||. Stability and accuracy Usually, it is difficult to show stability of finite difference schemes for non-linear systems. In [47] it was shown that Crank-Nicolson scheme is stable when applied to certain linear partial differential equations with constant coefficients. One has to notice that is not our case. Also in [47] one can find that this scheme has second order of accuracy in space and in time.
50
6.1.2
Box scheme
As it will be shown in Section 6.2, the classical Crank-Nicolson scheme as described in Section 6.1.1 cannot be applied to the system (2.23)-(2.26) because of the nature of equation (2.25) in the context of whole system. We are saying that v is not an evolutionary variable, i.e., the equation we have for v does not provide its time derivative. The ensuing difficulty is explained in detail in Section 6.2.1. To solve this difficulty, we use the second order accuracy Box scheme for the following kind of equation, see [33, 42]: ∂ ∂ G(W ) + F (W ) = Ψ(W ). ∂t ∂x
(6.14)
For the solution of the equation (6.14) we will use an implicit box scheme centered at the point (m + 1/2, n + 1/2), see Figure 6.1, right. This scheme can be solved almost explicitly. Following the notation introduced in Section 6.1 and taking into account the right stencil in Figure 6.1 we see that (6.14) at position (m + 1/2, n + 1/2) can be approximated by: à à ¯n+1/2 ¯n+1/2 ! ¯n ¯n+1 ! 1 ∂G(W ) ¯¯ ∂G(W ) ¯¯ 1 ∂F (W ) ¯¯ ∂F (W ) ¯¯ + + + = 2 ∂t ¯m ∂t ¯m+1 2 ∂x ¯m+1/2 ∂x ¯m+1/2 1¡ n n+1 ¢ Ψ|m + Ψ|nm+1 + Ψ|n+1 + Ψ| = m m+1 . 4 Approximating the derivatives we obtain a second order accuracy scheme: ¡ ¢ ¡ ¢ 1 ¯m + G ¯ m+1 − Gm − Gm+1 + 1 F¯m+1 − F¯m − Fm + Fm+1 = G 2k 2h ¡ ¢ 1 ¯ ¯ m + Ψm + Ψm+1 . Ψ + Ψ m+1 4
(6.15)
(6.16)
Looking at Figure 6.1 one realizes that the system (6.16) with boundary conditions at the left can be solved at time level (n + 1) from left to right. That is why we construct Newton’s method for solving system (6.16) at the point (m + 1, n + 1). The iteration using Newton’s ¯ (l+1) = W ¯ (l) + ∆W ; we start the method is analogous to that presented in Section 6.1.1, i.e., W (0) ¯ m+1 ¯l iteration with W = Wm+1 . Let us assume that we know the iterate solution W m+1 for time ¯ m at (m, n + 1), then we can linearize the equation (6.16) around (n + 1) and the solution W (l) ¯ m+1 W , obtaining:
´ (l) (l) ¯ ¯ ¯ Gm + Gm+1 + (DW G)m+1 ∆Wm+1 − Gm − Gm+1 + ³ ´ (l) 1 ¯m+1 ¯ )(l) ¯ F + (D F ∆W − F − F + F = W m+1 m m m+1 m+1 2h ³ ´ (l) 1 ¯ (l) ¯ ¯ Ψ + (D Ψ) ∆W + Ψ + Ψ + Ψ . W m+1 m m m+1 m+1 m+1 4
1 2k
³
51
(6.17)
System (6.17) can be rewritten as follows, with λ = k/h: ³ ´ ³ ´ (l) (l) (l) (l) k k ¯ ¯ ¯ ¯ ¯ (DW G)m+1 + λ(DW F )m+1 − 2 (DW Ψ)m+1 ∆Wm+1 = 2 Ψm+1 + Ψm + Ψm + Ψm+1 ³ ´ ³ ´ (l) (l) ¯ ¯ ¯ ¯ − Gm + Gm+1 − Gm − Gm+1 − λ Fm+1 − Fm − Fm + Fm+1 . (6.18) We emphasize that the Box scheme is valid only if the left boundary condition is given. In such a case it is implicit, however it can be solved by solving many small systems, so it is computationally advantageous. In [33], general stability of this scheme for linear equation is proved and some implementation particularities are discussed. A more detailed discussion of application of the Box scheme to system (6.14) can be found in [34].
6.1.3
Boundary conditions
In this section we show two possibilities for boundary conditions and discuss it implementation. In our simulations we need to use both Dirichlet and Neumann boundary conditions. Dirichlet B.C. The Dirichlet condition consists in defining the value of the depending variable on the boundary. Numerically for the system of the form (6.1) or (6.14) this condition corresponds to: W (x1 ) = WL ;
W (xM ) = WR ,
(6.19)
where WL and WR are given values. Thus we have M − 2 unknowns and thus at each Newton’s iteration we need to solve the linear system of M − 2 equations, where the boundary conditions will appear only in the first and the last blocks of the block matrix in Newton’s method (6.9). Neumann B.C. The Neumann boundary condition consists of defining flow condition at the boundary of the domain of interest (e.g at the points x1 and xM ). For the one-dimensional numerical schemes it will be
∂W ˙ L ; ∂W (xM ) = W ˙ R, (x1 ) = W ∂x ∂x ˙ L and W ˙ R are given values. In order to use Neumann boundary conditions numerically where W we use the ghost point method. It consists of creating one ghost (fictitious) point for each 52
boundary, indicated by x0 at the left and xM +1 at the right. Now we calculate the value of W (x0 ) and W (xM +1 ) at each time step so that the discretization gives the value of derivatives automatically. For example, if we use the Crank-Nicolson scheme the derivatives are, with second order accuracy: ∂W W (x2 ) − W (x0 ) ˙ L; (x1 ) = =W ∂x 2h
∂W W (xM +1 ) − W (xM −1 ) ˙ R. (xM ) = =W (6.20) ∂x 2h ˙ R + W (xM −1 ). The Thus the function value at the ghost point xM +1 is W (xM +1 ) = 2hW procedure for the point x0 is analogous. This method is easy to implement because in Newton’s method we can use the same matrices as for Dirichlet boundary conditions. The only difference will be the dimension of the problem, which is M instead of M − 2. Finally one has to notice that the same problem can use different boundary conditions for the left and right sides.
6.1.4
Solution of the block tridiagonal system
We will apply the standard LU decomposition to solve the following system with the assumption that det Bm 6= 0 for m = 1, 2, . . . , M , B1 C1 0 ··· 0 A2 B2 C2 ··· 0 .. .. .. 0 ... . . . 0 ··· A M −1 BM −1 CM −1 0 ··· 0 AM BM This system is equivalent ¯1 B 0 0 0 0
X1 .. . X M
T1 . = .. . TM
(6.21)
to: C1 0 ¯2 C2 B .. .. . . ···
0
···
0
···
0
··· 0 .. .. . . ¯M −1 CM −1 B ¯M 0 B
X1 .. . X M
T¯1 . = .. , ¯ TM
(6.22)
where ¯1 = B1 , T¯1 = T1 , B
(6.23)
¯ −1 Tm−1 . ¯ −1 Cm−1 , T¯m = Tm − Am B ¯m = Bm − Am B B m−1 m−1
(6.24)
and for 1 < m < M :
53
The system (6.22) can be solved by backward substitution: ¯M XM = T¯M , B
(6.25)
¯m Xm = T¯m − Cm−1 T¯m−1 . B
(6.26)
and for 1 < m < M we have:
6.2
Limitations of the Crank-Nicolson scheme
In this section we explain why the Crank-Nicolson scheme cannot be applied directly to the system of equations (2.23)-(2.26). In the next section we propose an alternative scheme for this system.
6.2.1
Application to the physical model
In order to apply the Crank-Nicolson scheme to the system (2.23)-(2.26) we need to find the blocks Am , Bm and Cm given in (6.10)-(6.13) with W , G, F , H and Ψ from (6.2). The derivatives DW G and DW F are: 1 0 −φY /θ2 φ/θ DW G = −φ/θ2 0 0 0
0 0
0 0 , 0 0 1 0
0
0
0
a
−vY /θ2 v/θ 0 Y /θ DW F = −v/θ2 0 0 1/θ 0 0 0 0
.
(6.27)
The derivative of H is a trilinear form, so we can obtain a formula when it is applied on a vector U = (U1 , U2 , U3 , U4 )T : 0 0 0 − L 1θ2 V1 e hDW H, V, U i = 0 0 0 0
0 0
U1
0
0 0 0
1 0 0 U2 = − Le θ2 U2 0 0 0 0 0 0 0 0 0 U3 0 0 0 0 0 0 U4
where V = (V1 , V2 , V3 , V4 )T , so we will use the notation 0 − L 1θ2 U2 e hDW H, ·, U i = 0 0 54
V1
V2 V , 3 V4
hDW H, ·, U i to mean 0 0 0 0 0 0 . 0 0 0 0 0 0
(6.28)
(6.29)
Substituting (6.2) and (6.27)-(6.29) into (6.10)-(6.13) we obtain: − µ2 0 ¶ µ (l) (l) (l) (l) (l) λvm−1 Ym−1 µ(Ym −Ym−1 ) −λvm−1 µ 1 − − 4Le (l) + (l)1 (l) (l) (l) 4(θm−1 )2 4Le (θm−1 )2 4(θm−1 )2 θm θm−1 Am = (l) λvm−1 0 (l) 2 4(θ m−1 ) 0 0
1+µ
0
0 0
(l) B1 1 B1 2 0 0 kαe−γ/θ Bm = − φ − (l) 2 0 0 0 2 (θm ) 0 0 1 0
qY (1−η)γ θ2 µY (1−η) − θ2 µg Y (1−η) θ2 Y (1−η) θ2
0
,
(l)
4θm−1
0
−λ (l) 4θm−1
0
0
q(1 − η)
λa 4 (l) −λYm−1
0
−qY
0
(6.30)
(l)
µg (1 − η)
µg Y
(1 − η)
−Y
0 , 0 0
2
1
−µ(1 − η) −µY
(6.31)
m
where (l)
(l)
B1 1 = −
φYm (l)
(θm )2
+
(l)
(l)
µ(Ym−1 − 2Ym + Ym+1 ) (l)
4Le (θm )2
, B1 2 =
φ (l)
θm
− µ2
(l) (l) (l) (l) λvm+1 Ym+1 µ(Ym+1 −Ym ) − + (l) (l) 4(θm+1 )2 4Le (θm+1 )2 Cm = (l) λv − (l)m+1 2 4(θm+1 ) 0
µ + 4Le
Ã
1
(l)
−
(l)
4θm+1
(l)
θm
+
0
λa 4
0
λYm+1
0
0
λ
0
0
0 µ
λvm+1
+
(l)
θm−1
µ 4Le
¶ 1 (l)
θm
+
1 (l)
θm+1
(l)
(l)
4θm+1 (l)
4θm+1
!
(l)
θm+1
, (6.32)
.
(6.33)
0
Also
(l)
θm − θm
Y (l) φ( m − Ym(l) ) θm θm Tm = 1 φ( 1 − (l) ) θm θm (l) ηm − ηm
−
(l)
(l)
a(vm+1 − vm−1 + vm+1 − vm−1 )
v(l) Y (l) (l) (l) ( m+1 m+1 ) − ( vm−1 Ym−1 ) + ( vm+1 Ym+1 ) − ( vm−1 Ym−1 ) (l) (l) θm+1 θm−1 λ θm+1 θm−1 4 ( vθ )m + ( vθ )m+1 0 q T1 µ T2 k −µ ¯ (l) ( Φ + Φ ) + m m 2 4 , µg 0 1 0
+
(6.34) where (l)
(l)
(l) T1 = 2(θm−1 − 2θm + θm+1 ) + 2(θm−1 − 2θm + θm+1 ),
55
(6.35)
T2 = ³
1 Le
1 Le 1
θm+1
³
´ ³ ´ 1 1 1 + (Y − Y ) − + (Ym − Ym−1 )+ m+1 m θm+1 θ θ θm+1 ´(l) m ³ m ´(l) 1 + θ1m (Ym+1 − Ym )(l) − θ1m + θm+1 (Ym − Ym−1 )(l) . 1
(6.36)
Now we notice that the last column of the matrix Bm in (6.31) vanishes, so Bm is singular and the methods described in Section 6.1.4 cannot be applied here. This problem occurs because the original system (2.23)-(2.26) is not “complete” as a system of conservation laws, i.e., there is no time evolution term for v. We believe this problem cannot be circumvented by considering other finite difference schemes similar to the Crank-Nicolson scheme.
6.3
The hybrid finite difference scheme
In this section we describe a numerical method for the solution of the system (2.23)-(2.26). The solution of this system through finite differences presents two difficulties. First, we need to obtain the long time profile of the combustion wave, which can take a long simulation time to form. Explicit schemes can only use very small time steps because of the CFL restriction. Implicit schemes allow for larger time steps and may be unconditionally stable, but are computationally more expensive. As the quality of the solution is tied to its stability, we choose to solve the system implicitly. We avoided making any compromise between speed and accuracy by performing our simulations using a high performance parallel solver for the large linear systems to be solved, see details in [28]. Second, the system (2.23)-(2.26) does not possess any evolution term for the variable v, which represents the gas speed. This particularity does not allow the usage of any implicit symmetric three-point finite difference scheme, such as Crank–Nicolson, as has been shown in Section 6.2. The equation (2.25) requires the Box scheme. Instead of using the Box scheme on the whole system, we can use a hybrid scheme which consists in applying the Crank–Nicolson discretization on equations (2.23), (2.24), (2.26) and the Box discretization on (2.25). The resulting scheme is fully implicit. The notation used in this section is different from that used in the rest of this chapter. This is so because here we follow the notation used in the documentation of the software for simulations of systems similar to (2.23)-(2.26) developed in the Fluid Dynamics Laboratory at IMPA [29]. We apologize to the reader for the inconvenience. The equations (2.23), (2.24) and (2.26) can be written as a system of three equations of the
56
form:
µ
∂h(u) ∂f (u) ∂ + = ∂t ∂x ∂x
∂u g(u) ∂x
¶ + q(u),
(6.37)
where the 4-component variable u and the functions h, f , g, h are equivalent to the variable W and functions G, F , H, Ψ from (6.1) respectively. On the other hand, equation (2.25) can be written as:
˜ ∂ h(u) ∂ f˜(u) + = q˜(u). (6.38) ∂t ∂x We denote with tilde the function that follow the Box scheme discretization, and functions without tilde follows the Crank-Nicolson discretization. So for (6.37), we use the Crank-Nicolson discretization analogous to (6.4): n+1 n+1 fi+1 − fi−1 hn+1 i + − k 4h
¢ qin+1 1 ¡ n+1 n+1 n+1 n+1 n+1 n+1 n+1 n+1 n+1 n+1 (g + g )u − (g + 2g + g )u + (g + g )u i+1 i i+1 i+1 i i i i i−1 i−1 − 4h2 2 n n n fi+1 − fi−1 hi = − + k 4h ¡ ¢ qin 1 n n n n n n n n n n (g + g )u − (g + 2g + g )u + (g + g )u + . i+1 i i+1 i+1 i i i i i−1 i−1 4h2 2
(6.39)
For (6.38), we use the Box scheme analogous to (6.16): ˜ n+1 + h ˜ n+1 f˜n+1 − f˜n+1 q n+1 + q n+1 ˜n + h ˜ n f˜n − f˜n q˜n + q˜n h h i+1 i i i i i i + i+1 − i+1 = i+1 − i+1 + i+1 . 2k 2h 4 2k 2h 4
(6.40)
We group the LHS and RHS terms into the functions F (corresponding to time step n + 1) and y (corresponding to time step n) respectively, obtaining: G = 0,
(6.41)
n+1 n n G(un1 , . . . , unM , un+1 , . . . , un+1 , . . . , un+1 1 M ) ≡ F (u1 M ) − y(u1 , . . . , uM ).
(6.42)
where
Now Newton’s method for solving the problem (6.41) can be written in the form analogous to (6.9) with δu corresponding to ∆W as: · u
(l+1)
=u
(l)
+ δu,
We need to calculate the matrix
∂G(u) . ∂u
where
∂G(u) ∂u
¸ δu = −G(u(l) ).
(6.43)
u(l)
Inspecting (6.39)-(6.40) we see that it is a system with
block tridiagonal form with blocks of 4 lines, see [29] for details. The first three lines of each 57
block involve the matrices: f0 g 0 (ui+1 − ui ) + gi+1 + gi ∂Gi = i+1 − i+1 ; ∂ui+1 4h 4h2 ∂Gi h0 g 0 (ui+1 − 2ui + ui−1 ) − gi+1 − 2gi − gi−1 qi0 Ai = = i− i − ; ∂ui k 4h2 2 0 0 fi−1 gi−1 (ui−1 − ui ) + gi + gi−1 ∂Gi Bi = =− − , ∂ui−1 4h 4h2 Ci =
(6.44)
where we denote h0 , f 0 , g 0 and q 0 the matrices dh/du, df /du, dg/du and dq/du. The last line of each block has a different form: ˜0 h f˜0 q˜0 ∂ G˜i = i+1 + i+1 − i+1 ; C˜i = ∂ui+1 2k 2h 4 0 ˜0 ˜0 ˜i ∂ G h f q ˜ A˜i = = i − i − i; ∂ui 2k 2h 4 ˜ ˜i = ∂ Gi = 0. B ∂ui−1
(6.45)
All the blocks are calculated for the generic l-th iteration of Newton’s method to obtain the solution at time step (n+1). For the system (2.23)-(2.25) we recall that:
θ
θ
Y , h = φY /θ u= η η φ/θ v
av
, f = vY /θ 0 v/θ
1
, g = 0 0 0
0 1 Le θ
0 0
0 0
q
0 0 , q = −µ 0 0 1 µg 0 0
Φ. (6.46)
If we put the line numbers as [·], schematically the blocks A, B and C will be:
···
··· Ci = ··· ···
[1]
Ci
[2]
Ci
[3]
Ci [4] C˜ i
···
··· , ··· ···
[1]
···
Ai
··· Ai = ··· ···
[2]
Ai
[3]
Ai [4] A˜ i
···
··· , ··· ···
···
··· Bi = ··· ···
[1]
Bi
[2]
Bi
[3]
Bi ˜ [4] B i
···
··· , ··· ···
where the indices [1], [2], [3] corresponds to each of the three lines in (6.44) and the index [4] correspond to (6.45).
6.3.1
Inicialization particularities
Equation (2.25) has to be taken into account to initialize the variable v at time zero. In this section, we show a simple way to initialize the variable v using a one time step discretization. 58
For example, we can use a central-space forward-time scheme. In this case equation (2.25) gives: φ k
µ
1 1 − 1 0 θm θm
1 + 2h
µ
0 0 vm+1 vm−1 − 0 0 θm+1 θm−1
¶ = µg Φ0m .
(6.47)
1 0 Assuming that the temperature at the first time step do not change much we consider θm = θm ,
obtaining:
0 0 vm+1 vm−1 0 0 − = 2hµg Φ0m = 2hµg αYm0 (1 − ηm ) exp(−γ/θm ). 0 0 θm+1 θm−1
(6.48)
Thus, we can initialize v 0 to be compatible with the data θ0 , Y 0 and η 0 as functions of x.
6.3.2
Application to the physical model
In the current version of software the function g(u) in (6.37) corresponding to the viscosity term has to be constant. Fortunately the only component of g that is not constant for the model we are considering corresponds to the term g2,2 = ρ/Le . Using (2.20) we transform it into g2,2 = 1/(θLe ). As the function θ varies in small interval 1 < θ < θb , in our simulations we use 1/(θb Le ) ≤ g2,2 ≤ 1/(Le ). We made simulations for g2,2 equal to the maximum and the minimum value in the previous inequality. Since the results of these simulations were visually indistinguishable we make g2,2 constant, corresponding to θ = (1 + θb )/2. As explained, we consider g 0 = 0 and gi = gi+1 = gi−1 = g. Thus for the lines r = 1, 2, 3 (corresponding to (2.23), (2.24), (2.26)): [r]0
[r] Ci
f g [r] = i+1 − 2 ; 4h 2h
[r] Ai
[r]0
[r]0
[r]0
h q = i − i ; k 2
[r] Bi
f g [r] = − i−1 − 2 . 4h 2h
(6.49)
For the line 4 (corresponding to (2.25)): [4]0
[4] Ci
[4]0
[4]0
h f q = i+1 + i+1 − i+1 ; 2k 2h 4
[4] Ai
The matrices used above are: 1 0 0 0 −φY /θ2 φ/θ 0 0 h0 = −φ/θ2 0 0 0 0 0 1 0
[4]0
,
[4]0
[4]0
h f q = i − i − i ; 2k 2h 4
0
[4]
Bi = 0.
0
0
a
−vY /θ2 v/θ 0 Y /θ f0 = −v/θ2 0 0 1/θ 0 0 0 0
59
(6.50)
.
(6.51)
For the combustion rate we use Υ = α exp(−γ/θ) (then Φ = Y (1 − η)Υ):
qγ(1 − η)Y /θ2
q(1 − η)
−qY
−µγ(1 − η)Y /θ2 −µ(1 − η) µY q = γ(1 − η)Y /θ2 (1 − η) −Y µg γ(1 − η)Y /θ2 µg (1 − η) −µg Y 0
0
0 Υ. 0 0
(6.52)
For y, in Newton’s method all functions are calculated at the time n, we use the equation (6.53) for r = 1, 2, 3 and the equation (6.54) for r = 4: [r]
y
[r]
[r]
[r] fi+1 − fi−1 qi[r] hi = − + , k 4h 2
(6.53)
˜ [4] f˜[4] − f˜[4] q˜[4] + q˜[4] ˜ [4] + h h i+1 i i i y = − i+1 + i+1 . (6.54) 2k 2h 4 Our simulations for the parameter values taken from Table 2.3 can be seen in Figures 6.2 [3]
and 6.3. Notice that for this choice of parameter values we are inside the region where ² is small as plotted in Figure 4.2. We studied the interval [0, 104 ] with 103 grid points and the activation energy constant γ = 2.0. The initial data for the simulation is shown on the left side of Figure 6.2. Figure 6.3 shows the profile of the numerical solution of the system (2.23)-(2.26) at time t = 2 · 107 . We observe the presence of the thermal wave (the small increment in the variable θ corresponding to the temperature near ξ = 2000) and the combustion wave. The thermal and combustion waves shown in Figure 6.3 appear in the Riemann solution of the system (2.23)(2.26) as schematically represented in Figure 5.2. On the right side of Figure 6.2 we show the combustion wave taken from Figure 6.3 on the same scale as the quasi-stationary approximation (4.24). This Figure shows reasonable agreement between the simulated combustion wave and that obtained by using singular perturbation technique. The discrepancy between two waves is not caused by the difference between the zero order approximation and the exact solution because in this case the correction parameter from (4.21) is ² ≈ 10−4 . We speculate that the discrepancy is due to the long time that the solution requires to converge to its traveling form. The simulation of the system (2.23)-(2.26) with parameter values taken from Table 2.2 for different initial data are plotted in Figures 6.4 and 6.5. In these simulations we use fixed time step length equal to 1, thus the number of time steps indicated in each figure coincides with the dimensionless time of the simulation. Analogously to Figure 6.3 one observes the formation of the thermal and combustion waves. 60
Figure 6.2: In this simulation using the hybrid scheme we use initial data as shown on the left. On the right we compare the combustion wave profile at time t = 2 · 107 obtained through the numerical simulation from Figure 6.3 (circles) with the semi-analytical one obtained solving (4.24) (lines). Here we use parameter values from Table 2.3.
2 T Y η
1.5
1
0.5
0 2000
4000
ξ
6000
8000
10000
Figure 6.3: Numerical simulation using the hybrid method for system (2.23)-(2.26) at dimensionless time t = 2 · 107 showing the formation of thermal and combustion waves (Y and η coincide). The initial data is plotted on the left side in Figure 6.2. Here we use parameter values from Table 2.3, except γ = 2.
61
The parameter θb (temperature of the combustion wave) allows an easy comparison between the semi-analytical solution and the numerical simulation. We find its exact value by solving the corresponding Riemann problem, obtained in second equation in (4.16), substituting the parameter values from Table 2.2; it is θb = 2.0651. Of course, this value coincides with that obtained by using the zero order approximation as plotted in Figure 4.3 (from the output data we obtain θb = 2.0651). Observing Figures 6.4 and 6.5 one can see that the combustion wave profile requires a long time to stabilize, this is why we performed two simulations. The first one (plotted in Figure 6.4) started with the initial data for the variable θ as 2. This simulation yields a combustion wave temperature equal to 2.069. The second (plotted in Figure 6.4) started with the initial data for the variable θ as 2.5. This simulation yields a combustion wave temperature equal to 2.07. As we see the numerical simulation supports the theoretical result with relative error close to 0.2%.
6.4
Conclusions
In this chapter we developed a hybrid finite difference scheme to solve numerically the system (2.23)–(2.26), which cannot be solved by the Crank-Nicolson scheme. The combustion wave profile obtained numerically was compared to the zero-order approximation of the analytical solution from Chapter 4 in Figure 6.2 showing good agreement and supporting the usage of singular perturbation method. The simulations plotted in Figures 6.4 and 6.5 show the formation of the thermal and combustion waves as predicted theoretically through the solution of corresponding Riemann problem illustrated in Figure 5.2. Finally, the value for the combustion temperature θb obtained solving the Riemann problem agrees well with the value obtained by numerical simulations. The results discussed in this Chapter were published in part in [16, 17].
62
2
2 T Y η v
1.5
1.5
1
1
0.5
0.5
0 0
1000
2000
ξ
3000
4000
T Y η v
0 0
5000
1000
(a)
2
1.5
1
1
0.5
0.5
ξ
4000
5000
3000
4000
T Y η v
2
1.5
2000
3000
2.5
T Y η v
1000
ξ
(b)
2.5
0 0
2000
0 0
5000
(c)
1000
2000
ξ
3000
4000
5000
(d)
Figure 6.4: Numerical simulation using the hybrid method for system (2.23)-(2.26) with parameter values from Table 2.2 showing the formation of thermal and combustion waves. Figures (a) - initial data, (b) - after 30.000 time steps, (c) - after 200.000 time steps and (d) - after 510.000 time steps. Initial value for the variable θ at the injection end was taken as 2, the thermal wave is almost indistinguishable because of the diffusion effect. Notice that the combustion wave has a thin reaction layer where all the oxygen and fuel are consumed and thick thermal layer where only thermal conduction occurs. Compare with Figure 6.5.
63
2.5
2.5 T Y η v
2
1.5
1.5
1
1
0.5
0.5
0 0
1000
2000
ξ
3000
4000
T Y η v
2
5000
0 0
1000
(a)
ξ
3000
4000
5000
4000
5000
(b) 2.5
2.5 T Y η v
2
2
1.5
1.5
1
1 T Y η v
0.5
0.5
0 0
2000
1000
2000
ξ
3000
4000
5000
(c)
0 0
1000
2000
ξ
3000
(d)
Figure 6.5: Numerical simulation using the hybrid method for system (2.23)-(2.26) with parameter values from Table 2.2 showing the formation of thermal and combustion waves. Figures (a) - initial data, (b) - after 50.000 time steps, (c) - after 200.000 time steps and (d) - after 510.000 time steps. Initial value for the variable θ at the injection end was taken as 2.5, the thermal wave is smooth due the diffusion effect. Notice that the combustion wave has a thin reaction layer where all the oxygen and fuel are consumed and thick thermal layer where only thermal conduction occurs. Compare with Figure 6.4.
64
Chapter 7 Stability analysis of combustion waves In this chapter we introduce a simplified model for gas-solid combustion, which can be obtained from (2.16)-(2.20). There are reasons to do so. (1) We do not know how to perform the stability analysis of system (2.16)-(2.20). (2) Other simplifications described in Remark 7.2 have been subject to mathematical analysis, yet they are not physical as they consider infinite supply of oxygen and absolute zero temperature inside the reservoir, our simpler model is more physical. (3) As shown in Chapter 6, the numerical simulations for system (2.16)-(2.20) are not easy. Most importantly, the simplified model is more likely to be amenable to analysis. The simplifications we will perform consist in considering the Lewis number so high that 1/Le can be replaced by 0. Instead of the ideal gas law (2.20) we assume that ρ is constant. It follows that the gas speed v > 0 is also constant. We introduce by c = av. Thus the system (2.16)-(2.20) can be rewritten as follows. The dependent variables are temperature θ, oxygen fraction Y and fuel χ = 1 − η, where η is the dimensionless fuel depth defined in Section 2.1: ∂θ ∂θ ∂ 2θ +c = + qΦ, ∂t ∂x ∂x2 ∂Y ∂Y +v = −µΦ, ∂t ∂x ∂χ = −Φ. ∂t
(7.1) (7.2) (7.3)
The combustion rate is described by Arrhenius’ law: Φ = KY χe−γ/θ .
(7.4)
In Chapters 4 and 5 we find the combustion wave profile in the form of traveling wave for certain ISC models. In Chapter 6 we present numerical evidence that these waves exist 65
supporting our analysis. However, stability analysis of the combustion waves is such a delicate issue that a mathematical study is necessary. Unfortunately, the system (2.16)-(2.20) is difficult to work with, that is why in this chapter we present our efforts towards proving the stability of the combustion wave using the simplified model. In Section 7.1 we apply the singular perturbation method to obtain the combustion wave profile for the simple model. In Section 7.2 we provide heuristic calculation for the continuous spectrum of the perturbation around the approximate solution obtained in Section 7.1. Finally, in Section 7.3 we summarize all we did in this chapter. Remark 7.1 (Non-combustion waves) It is easy to perform the analysis of the hyperbolic behavior of the system (7.1)-(7.3) as we did in Section 5.4. The characteristic speeds and corresponding characteristic modes of the resulting system are: λθ = c;
(1, 0, 0)T ;
λY = v;
(0, 1, 0)T ;
λχ = 0;
(0, 0, 1)T .
(7.5)
We can see that the Riemann problem possesses three non-combustion contact waves. The slowest one is an immobile fuel wave λχ = 0, the intermediate one is a thermal wave with speed λθ = c and the fastest one is the oxygen composition wave with speed λY = v. Remark 7.2 (Simplest model) There is another possible way to simplify the model (2.16)(2.20). We can make the previously mentioned simplifications except the Lewis number is not considered large. Another simplification is to assume infinite availability of fuel (equivalently one can consider infinite availability of oxygen). In this case the variables are θ - temperature and Y - concentration of oxygen. There are two constants Le - Lewis number, β - reaction rate: ∂θ ∂2θ = + Y e−1/θ , ∂t ∂x2 ∂Y 1 ∂ 2Y = − βY e−1/θ . 2 ∂t Le ∂x
(7.6) (7.7)
This model has the following difficulty. The associated ODE system for traveling wave possesses only two equilibria, one for Y = 0 and another for θ = 0. From the physical point of view considering θ = 0, or equivalently 0o K, does not make sense. However this model is amenable to detailed mathematical analysis, see [6, 25].
66
7.1
Co-flow combustion traveling wave
Of course the singular perturbation analysis as performed in Chapter 4 for the traveling wave in the physical model is applicable to the simplified model (7.1)-(7.4) discussed here. Next we obtain the zero-order approximation of the traveling wave solution of the system (7.1)-(7.3) and compare it to the numerical solution.
7.1.1
Rankine-Hugoniot condition
Analogously to Chapter 4 we solve the Riemann problem with the following boundary conditions for the combustion wave: Left: θ− ,
Y− = 1,
Right: θ+ ,
χ− = 0;
Y+ = 0,
χ+ = 1.
(7.8) (7.9)
Let us assume that the variables θ, Y and χ from (7.1)-(7.3) depend only on ξ = x − V t, i.e., with some abuse of notation we write θ = θ(ξ) = θ(x − V t), etcetera. The traveling wave associated to (7.1) reads:
−V θ˙ + cθ˙ = θ¨ + qΦ −V Y˙ + v Y˙ = −µΦ −V χ˙ = −Φ.
(7.10)
Here the dot represents derivatives with respect to ξ. After one time integration we have: θ˙ + V θ − cθ + qV χ + K1 = 0;
(7.11)
−V Y + vY + µV χ + K2 = 0;
(7.12)
1 Φ. V Substituting the left boundary conditions (7.8) into (7.11)-(7.12) one obtains χ˙ =
(V − c)θ− + K1 = 0; (v − V ) + K2 = 0.
(7.13)
(7.14)
Substituting the right boundary conditions (7.9) into (7.11)-(7.12) we get (V − c)θ+ + qV + K1 = 0; µV + K2 = 0. 67
(7.15)
From (7.14)-(7.15): K1 = (c − V )θ− ;
K2 = V − v;
V =
v ; 1+µ
θ− = θ+ +
qv , v − c(1 + µ)
(7.16)
where the last two equations correspond to the Rankine-Hugoniot relations. Notice that from the third equation of (7.16) follows that V > 0.
7.1.2
Approximate profile for the combustion wave
Substituting (7.16) into (7.11)-(7.13) one obtains the following system of two differential equations and one algebraic equation describing the traveling wave solution: ˙ θ = (c − V )(θ − θ− ) − qV χ; χ˙ = V1 Φ; Y = 1 − χ.
(7.17)
As we already know, the zero-order approximation of the system (7.17) is (θ0 (χ0 ), Y0 (χ0 ), χ0 ), such that:
(c − V )(θ0 − θ− ) − qV χ0 = 0; (7.18)
Y0 = 1 − χ 0 ; χ˙ = 1 Φ(θ , Y , χ ), 0 0 0 0 V
where χ0 = χ0 (ξ) and χ˜ = χ0 (0). This system provides equations for θ0 and Y0 in terms of χ0 and an implicit equation for χ0 in terms of ξ: qV χ0 (ξ) θ ; 0 (ξ) = θ− + c−V Y0 (ξ) = 1 − χ0 (ξ); ¶ µ Z χ0 Kξ γ(c − V ) dχ = . exp V (c − V )θ− + qV χ χ(1 − χ) χ ˜ Defining A=
θ− , γ
B=
qV , γ(c − V )
x˜ =
1 , A + B χ˜
x0 =
1 A + Bχ0
(7.19)
(7.20)
the last equality can be written as: ¶ µ ¶¶ ¶ µ ¶¶ µ µ µ µ 1 1 1 1 Kξ 1 1 = e A E1 − x˜ − E1 − x0 − e A+B E1 − x˜ − E1 − x0 . V A A A+B A+B (7.21) The equations (7.20) and (7.21) define χ0 = χ0 (ξ) implicitly. 68
7.1.3
Numerical simulations
In this section we apply the Crank-Nicolson scheme with adaptative time step as described in Section 6.1.1 to simulate the simplified combustion model given by the system (7.1)-(7.3) with combustion rate (7.4). For the details about implementation see [28]. In this simulation we use up to 10.000 grid points and to control numerical oscillations we add a small fixed diffusion term in (7.2). We use the parameter values c = 0.2, q = 0.9, v = 1.2, K = 10−4 , µ = 2 and γ = 4. The initial data for the simulation is shown on left side of Figure 7.1. We show the profile of the numerical solution of the system (7.1)-(7.3) at time t = 2 · 107 on the right side in Figure 7.1. The formation of the thermal wave (near ξ = 5 · 106 ) and the combustion wave (near ξ = 8 · 106 ) are clearly visible. These waves were predicted by hyperbolic analysis in Remark 7.1. Immediately after the thermal wave we see a small elevation in the variable θ: it is a transient (not numerical) effect which disappears with time.
Figure 7.1: Numerical simulation using the Crank-Nicolson scheme with adaptative time step for the system (7.1)-(7.3) with the parameter values c = 0.2, q = 0.9, v = 1.2, K = 10−4 , µ = 2 and γ = 4. The initial data is plotted on the left. Simulation results after 2 · 107 time units showing the formation of thermal and combustion waves are plotted on the right.
On the left side in Figure 7.2 we show the quasi-stationary approximation of the combustion wave profile obtained by numerical integration of (7.19) with χ ˜ = 0.5. On the right side in Figure 7.2 we plot the combustion wave taken from Figure 7.1 on the same scale as the quasi69
Figure 7.2: Singular perturbation approximation (7.19) on the left and the combustion wave profile obtained by Crank-Nicolson simulation from Figure 7.1 on the right. Both plots are on the same scale. We use parameter values c = 0.2, q = 0.9, v = 1.2, K = 10−4 , µ = 2 and γ = 4.
stationary approximation. Both plots are visually indistinguishable.
7.2
Perturbations of the approximate traveling wave
Let us consider the system (7.1)-(7.3) in traveling wave coordinates: ∂t θ − V ∂ξ θ + c∂ξ θ = ∂ξξ θ + qΦ ∂t Y − V ∂ξ Y + v∂ξ Y = −µΦ ∂ χ − V ∂ χ = −Φ. t
(7.22)
ξ
We can rewrite this system as: ∂t U + Lξ (U ) = Ψ(U ),
(7.23)
where U = (θ, Y, χ)T , Lξ is a linear second order differential operator in ξ and Ψ is a general source term. Now we recall that the singular perturbation for the solution U of the system (7.23) yields U = U0 + ²U∗ + O(²2 ), where U0 and U∗ do not depend on t. Thus (7.23) can be rewritten as: ²∂t U∗ + Lξ (U0 ) + ²Lξ (U∗ ) = Ψ(U0 ) + ²ΨU (U0 )U∗ + O(²2 ).
70
(7.24)
Now we rename the first order approximation of the solution U1 = ²U∗ obtaining: ∂t U1 + Lξ (U0 ) + Lξ (U1 ) = Ψ(U0 ) + ΨU (U0 )U1 + O(|U1 |2 ).
(7.25)
We can rewrite it as: (∂t + Lξ − ΨU (U0 ))U1 = Ψ(U0 ) − Lξ (U0 ) + O(|U1 |2 ).
(7.26)
Notice that since the zero-order approximation U0 (ξ) satisfies the boundary conditions (7.8) and (7.9), then U1 (ξ) is a correction term; this correction term satisfies: lim U1 (ξ) = 0.
(7.27)
ξ→±∞
In what follows we replace the RHS of (7.26) by zero (this is equivalent to assuming that the zero-order approximation satisfies the system (7.22)). Remark 7.3 Notice that, as (7.24) shows, the RHS of (7.26) is not zero. In fact the zeroorder solution does not satisfy the system (7.22) exactly. However the singular perturbation in Chapter 4 was derived by expanding the system (7.1) as power series in ² and then equating all terms with the same order in ². If this analysis is valid, the right hand side of (7.26) has order ²2 , so we neglect it relative to the left hand side, which has order ². Neglecting the O(²2 ) terms and using U = U0 + U1 , (7.22) in (7.26), where the right hand side of equation (7.26) is replaced by zero, one obtains: ∂t θ1 − V ∂ξ θ1 + c∂ξ θ1 = ∂ξξ θ1 + qΦθ θ1 + qΦY Y1 + qΦχ χ1 ∂t Y1 − V ∂ξ Y1 + v∂ξ Y1 = −µΦθ θ1 − µΦY Y1 − µΦχ χ1 ∂ χ − V ∂ χ = −Φ θ − Φ Y − Φ χ . t 1
ξ
1
θ 1
Y
1
(7.28)
χ 1
The functions Φθ , ΦY and Φχ depend on χ0 : γY0 χ0 Φθ = Υ(χ0 ); ΦY = χ0 Υ(χ0 ); Φχ = Y0 (χ0 )Υ(χ0 ); Υ(χ0 ) = K exp θ0 (χ0 )2
µ
−γ θ0 (χ0 )
¶ . (7.29)
where Φθ , ΦY and Φχ are functions of ξ using χ0 = χ0 (ξ) that is given implicitly by equations (7.20)-(7.21). The functions θ0 (χ0 ) and Y0 (χ0 ) are given in (7.19).
71
7.2.1
Constructing the evolution operator
Now we assume that our variables (θ1 , Y1 , χ1 ) depend on t and ξ in the following way: (θ1 (t, ξ), Y1 (t, ξ), χ1 (t, ξ)) = eλt (θˆ1 (ξ), Yˆ1 (ξ), χˆ1 (ξ)),
(7.30)
where we are looking for real λ. In the following we will omit the hats, keep the subscript 1, and substitute (7.30) into system (7.28), obtaining the eigenvalue ODE problem: λθ1 + (c − V )dξ θ1 = dξξ θ1 + qΦθ θ1 + qΦY Y1 + qΦχ χ1 λY1 + (v − V )dξ Y1 = −µΦθ θ1 − µΦY Y1 − µΦχ χ1 λχ − V d χ = −Φ θ − Φ Y − Φ χ , 1
ξ
1
θ 1
Y
1
(7.31)
χ 1
with the boundary conditions defined by (7.27). The second order system above can be reduced to a first order system by introducing the variable θ10 = dξ θ1 : dξ θ10 = λθ1 + (c − V )θ10 − qΦθ θ1 − qΦY Y1 − qΦχ χ1 0 dξ θ1 = θ1 λV µ dξ Y1 = + (qΦθ θ1 + qΦY Y1 + qΦχ χ1 ) V −v V −v dξ χ1 = λ χ1 + 1 (qΦθ θ1 + qΦY Y1 + qΦχ χ1 ). V V
(7.32)
In order to simplify notation we drop the subindex 0, so we write Y , θ, χ instead of Y0 (ξ), θ0 (ξ), χ0 (ξ). Thus the system (7.32) can be rewritten as: −qχΥ (c − V ) λ − qγΦ θ2 θ10 1 0 0 θ1 dξ Y = µγΦ µχΥ + λ 1 0 θ2 (V − v) V −v χ1 χΥ γΦ 0 θ2 V V
−qY Υ
0 µY Υ V −v YΥ+λ V
θ10
θ1 . Y1 χ1
(7.33)
From the general ODE theory we know that given any initial condition the system (7.33) possesses a unique solution for all ξ. In order to perform the analysis of the boundary value problem we calculate the solution of the ODE in three subregions. First we analyze the limit cases: ξ > M and ξ < −M , for some large M > 0. Then we study the behavior of U1 for −M < ξ < M . 72
7.2.2
Left limit case
First let us consider the case ξ < −M . If M is large enough, in the interval (−∞, −M ) the operator (7.33) can be approximated using the left boundary condition (7.8) (Y → 1, χ → 0) obtaining:
θ1 dξ Y = 1 χ1 θ10
c−V
λ
1
0
0
0
0
0
−1 where Υ− = K exp(−γθ− ). We rename the
D− = Λ−1 − A− Λ− , where: λ V −v 0 D− = 0 0
−qΥ−
θ0 1 0 0 θ1 , (7.34) λ µ Υ− Y 1 V −v V −v Υ− + λ χ1 0 V matrix in (7.34) as A− and diagonalize it using
0 Υ− + λ V 0 0
∆1 = −
0
0
0
0
0
1 (c − V − ∆) 0 2 1 0 (c − V + ∆) 2
Υ− + λ 0 V 0 1 Λ− = 1 ∆1
c−V −∆ 2 1
0
0
∆2
0
µ(cV (Υ− + λ) − (Υ+ λ)2 − V 2 Υ− ) , qV (Υ− V − Υ− v − vλ)
,
∆=
p
(V − c)2 + 4λ,
c−V +∆ 2 1 , with 0 0
∆2 = −
µ(cV (Υ− + λ) − (Υ+ λ)2 − V 2 Υ− ) . qΥ− V 2
Thus the general solution of (7.34) is: [θ10 (ξ), θ1 (ξ), Y1 (ξ), χ1 (ξ)]T = Λ−1 − exp(D− ξ) Λ− B− ,
(7.35)
where B − = [B1− , . . . , B4− ]T is a vector of real constants to be determined later. As the matrix Λ− is constant in ξ and has full rank, we define the vector of constants C− = [C1− , . . . , C4− ]T = Λ− B− and rewrite (7.35) as: [θ10 (ξ), θ1 (ξ), Y1 (ξ), χ1 (ξ)]T = Λ−1 − exp(D− ξ) C− , where C− needs to be determined later. 73
(7.36)
The boundary condition (7.27) implies: lim θ10 (ξ) = 0,
ξ→±∞
lim θ1 (ξ) = 0,
ξ→±∞
lim Y1 (ξ) = 0,
ξ→±∞
lim χ1 (ξ) = 0.
ξ→±∞
(7.37)
Therefore we look for solutions θ10 , θ1 , Y1 and χ1 that decay to 0 as ξ → −∞. Notice that the 0 matrix Λ−1 − in (7.36) is constant in ξ. Then θ1 , θ1 , Y1 and χ1 are linear combinations of the
elements of the vector exp(D− ξ) C− , so we just need to analyze the behavior of this vector as ξ tends to −∞: exp(D− ξ) C− = · ¸ ¡ λ ¡ Υ− + λ ¢ ¡c − V − ∆ ¢ ¡c − V + ∆ ¢ T ¢ − − − − C1 exp ξ , C2 exp ξ , C3 exp ξ , C4 exp ξ . V −v V 2 2 (7.38) The analysis is quite simple: if the sign of the coefficient of ξ (which is an eigenvalue) inside the exponent is positive, the solution decays as ξ → −∞ and the corresponding coefficient Cj represents one degree of freedom for the solution (i.e., Cj does not need to vanish). If the sign is negative, the corresponding coefficient Cj must be zero. In the case when the coefficient of ξ is zero we cannot conclude anything. From the third equation of (7.16) we get V − v < 0. It follows that if λ < 0 then C1− is a free parameter, and if λ > 0 then C1− = 0. If λ > −Υ− then C2− is a free parameter, and if λ < −Υ− then C2− = 0. For two last eigenvalues the analysis is more delicate. The eigenvalues are real only if λ > −(V − c)2 /4, let us consider this situation first. Based on the results for the physical model studied in Chapter 4, we may assume c < V , thus for the eigenvalue corresponding to C3− to be positive it is necessary that c − V − ∆ > 0, as c < V and ∆ > 0 we conclude that C3− = 0 for all λ > −(V − c)2 /4. If λ ≤ −(V − c)2 /4 we need the real part of the eigenvalue to be positive, however Re(∆) = 0 in this case and as c < V we get C3− = 0. An analogous analysis yields C4− = 0 for λ < 0, and C4− is a free parameter for λ > 0. We can associate the constants Cj− to the degrees of freedom that the system (7.34) possesses when the boundary conditions (7.37) at −∞ are imposed. Schematically we can represent the number of degrees of freedom or the nonzero constants Cj− for different regions of λ in Figure 7.3.
74
Figure 7.3: Schematic representation of the degrees of freedom in different regions of λ for ξ → −∞.
7.2.3
Right limit case
Now we consider the case ξ > M . If M is large enough the operator (7.33) can be approximated in the interval (M, ∞) using the right boundary conditions (7.9), obtaining: c − V λ −qΥ 0 + 0 θ θ10 1 0 0 0 θ1 θ1 1 µ Υ+ + λ dξ Y , Y = 0 0 0 1 1 V −v Υ λ + χ1 χ1 0 0 V V
(7.39)
−1 where Υ+ = K exp(−γθ+ ). We denote the matrix in (7.39) by A+ and diagonalize it using
D+ = Λ−1 + A+ Λ+ , where: λ 0 V 0 µΥ+ + λ V −v D+ = 0 0 0 0
0
0
0
0
1 (c − V − ∆) 0 2 1 0 (c − V + ∆) 2
µΥ+ + λ V −v 0 1 Λ+ = 0 ∆3 1 ∆4 0
,
c−V −∆ 2 1
c−V +∆ 2 1
0
0
0
0
∆=
p
(V − c)2 + 4λ,
, with
(V − v)(λ(c − v) + µΥ+ (c − V )) − (µΥ+ + λ)2 ∆3 = , qΥ+ (v − V )2 ∆4 =
(v − V )(λ(v − c) + µΥ+ (V − c)) − (µΥ+ + λ)2 . q(v − V )(V µΥ+ + λv)
Analogously to the left limit case the solution of (7.39) is given by: [θ10 (ξ), θ1 (ξ), Y1 (ξ), χ1 (ξ)]T = Λ−1 + exp(D+ ξ) Λ+ B+ , 75
(7.40)
Figure 7.4: Schematic representation of the degrees of freedom in different regions of λ for ξ → ∞. where B + = [B1+ , . . . , B4+ ]T is a vector of real constants to be determined later. As the matrix Λ+ is constant in ξ and has full rank, we define the vector of constants C+ = [C1+ , . . . , C4+ ]T = Λ+ B+ and rewrite (7.35) as: [θ10 (ξ), θ1 (ξ), Y1 (ξ), χ1 (ξ)]T = Λ−1 + exp(D+ ξ) C+ ,
(7.41)
where C+ needs to be determined later. Because of the boundary conditions (7.37) we want θ10 , θ1 , Y1 and χ1 to decay to 0 as ξ → ∞. Then θ10 , θ1 , Y1 and χ1 are linear combinations of the terms of the vector exp(D+ ξ)C+ and we just need to analyze the behavior of this vector as ξ tends to −∞: exp(D+ ξ)C+ = · ¸ ¡ λξ ¢ ¡ µΥ+ + λ ¢ ¡c − V − ∆ ¢ ¡c − V + ∆ ¢ T + + + + C1 exp , C2 exp ξ , C3 exp ξ , C4 exp ξ . V V −v 2 2 (7.42) In this case we need the coefficients of ξ (eigenvalues) to be negative. If λ < 0 then C1+ is a free parameter, and if λ > 0 then C1+ = 0. Since V − v < 0 it follows that if λ > −µΥ+ then C3+ is a free parameter, and if λ < −µΥ+ then C3+ = 0. For two last eigenvalues the analysis is similar. When λ > −(V − c)2 /4 it follows that ∆ is real and thus c−V −∆ < 0 and C3+ is a free parameter. If When λ ≤ −(V − c)2 /4 we need the real part of the eigenvalue corresponding to C3+ to be negative. As in this case Re(∆) = 0 and c < V this always happens and C3+ is a free parameter for all λ. An analogous analysis results that if λ < 0, then C4+ is a free parameter and if λ > 0 then C4+ = 0. We associate the constants Ci+ to the degrees of freedom that the system possesses and represent them schematically in Figure 7.4.
7.2.4
Solutions that match the limit cases
Now we can show evidence that the system (7.33) possesses a solution for all ξ. Since all functions involved are smooth we expect that there is some real number M , such that for 76
Figure 7.5: Schematic representation of matching three types of solutions in the intervals (−∞, −M ], [−M, M ] and [M, ∞].
Figure 7.6: Schematic representation of the degrees of freedom in different regions of λ. |ξ| > M the solution of the system is close to the solutions of the limit cases described before. According to the general ODE theory we know that the system (7.33) possesses a fundamental matrix (the solutions of this ODE forms a basis at any ξ) in the interval [−M, M ], see [45]. So we need this solution to match the solutions obtained from the limit cases as shown on Figure 7.5. In order to do the match we perform the following heuristic analysis. We need to match the solutions for the limit cases in ξ in the 4D space of states (θ0 , θ, Y, χ). So we need to match 4 components of the vector U1 . In Figure 7.6 we combine Figures 7.3 and 7.4 to show schematically how many degrees of freedom the system (7.33) possesses. The system (7.33) is autonomous, thus the solutions are obtained up to some constant and we need to fix the value at some point ξ for at least one variable θ0 , θ, Y or χ. So we need to use one degree of freedom to fix this constant. Thus we need five free parameters (or degrees of freedom) to match together the solutions at different ξ-intervals. As represented in Figure 7.6, this happens only inside the interval [−Υ− , 0]. Inside the interval [−µΥ+ , 0] we get one extra free parameter. We conjecture that it is associated with the geometric multiplicity of eigenvalues. Taking these facts into account we can expect that the spectrum of (7.33) is the interval [−Υ− , 0] and that it has geometric multiplicity 2 in the interval [−µΥ+ , 0].
77
7.3
Conclusions
In this chapter we have introduced the gas-solid combustion model described by the system (7.1)-(7.3), which is a simplification of the physical model (2.16)-(2.20). However, this system still possesses the same wave sequence as the original one. We solve the Riemann problem for (7.1)-(7.3) with boundary conditions (7.8), (7.9) and use Singular Perturbation method in order to obtain an approximation of the combustion wave profile. Next, we have performed some heuristic calculations and we state a conjecture about the operator governing the evolution of perturbations around the combustion wave profile. The conjecture is that this operator possesses the spectrum [−Υ− , 0], i.e., it satisfies a necessary condition for stability of the combustion wave profile. For the solution obtained with the Singular Perturbation technique the spectrum has geometric multiplicity of two in the interval [−µΥ+ , 0], see Figure 7.6. Unfortunately, we cannot conclude anything about the point 0 of the spectrum. Of course, numerical simulations support the stability conjecture.
78
Chapter 8 Introduction to reaction kinetics The main purpose of this work is to study certain models for the combustion wave occurring during the ISC process. However, the input of the combustion models requires many data, which can be found scattered in the literature. The reaction rate Rc of coke combustion with oxygen is usually given by:
µ Rc =
kc Cgm
exp
−E RT
¶ [1/s],
(8.1)
where m is the reaction order, Cg is the ratio of the oxygen partial pressure and atmospheric pressure, E is the activation energy, R is the ideal gas constant. The coefficient kc is given by: kc = ηAg k˜c [1/s],
(8.2)
where η is an efficiency factor, Ag [m2 /kg − coke] - specific surface area, k˜c [kg/m2 s] is the frequency factor of the reaction. This chapter serves two purposes. First we want to give a rationale for meaning of coefficients in equations (8.1), (8.2) and secondly we want to obtain a uniform basis for a comprehensive data set. For more details see [15]. Remark 8.1 (gas transfer effects) The reaction inside the particle produces other gases that are expelled out of the particle. Thus the concentration of oxygen in the bulk gas layer Cg and the concentration of oxygen on the particle surface Cs can be different due to external masstransfer limitations. This effect slows down the reaction rate. In [22, 44] this correction is neglected, in our analysis we also neglect it.
79
8.1
Specific surface area
In the literature it is often assumed that carbon based fuel has a porous structure. In order to react, the oxygen present in the air has to contact the fuel present inside this porous structure. A porous coke particle has a specific external surface area, which is of the order of the inverse particle diameter. However, the larger contact area is within the particle. It is also referred as the internal surface area. The internal surface area can be one to several hundreds square meters per gram. It is clear that in such a case we can also consider that the oxygen is dissolving inside the coke particle as the space available to the oxygen will be of the order of molecular size. We will ignore these complications and talk about internal and external surface. In the literature there is a concept of catalytical (reacting) surface of the particle as the surface where the reaction occurs: it contains the internal and external surface areas. The catalytical surface area Ag of the particle is obtained by injecting nitrogen close to the boiling point in a sample of fuel and fitting it to a BET isotherm (using BET method) [13]. It can be found in the literature [22, 44] for different materials in units of square meters of surface area per kilogram of fuel. During the reaction the surface area can change, see [35]. Here we are not considering this possibility by assuming that the catalytical surface area remains constant.
8.2
Order of reaction
The carbon-containing molecules on the particle surface are geometrically distributed in some way. In order to react, oxygen has to be absorbed onto the catalytical surface of the particle. To take the Langmuir absorption into account we have to approximate the reaction rate in a concentration range of interest as being proportional to the oxygen concentration to some fractional power and by introduce the order of reaction. Following [36], we define the order of reaction in the following way. If the rate of reaction can be expressed by an empirical differential equation that contains a factor of the form k[A]α [B]β . . ., where [A], [B], etc., are the reactant concentrations, α and β are constant exponents (independent of concentration and time) and k is a (rate) coefficient independent of [A], [B], etc., then the reaction is said to be of order α with respect to A, of order β with respect to B, ... , and of total order m = α + β + . . .. In general the exponents α, β, ... can be positive or negative, integer or not. It is also possible to consider the order α, etc., of the reaction to depend on time and to change
80
with the concentration ranges. There are two common ways to use the reaction order. One considers all the elementary reactions that appear during the combustion. In this case the elementary reaction orders coincide with the integer stoichiometric coefficients, however, one needs to know all the elementary reactions that occur in the combustion and put them into the system of conservation laws describing the physical model. Even in ideal cases this is rather complex. As the composition of petroleum coke can vary, the elementary reactions can vary substantially. Moreover the resulting system of conservation laws is very difficult to work with. Finally, using this formulation it is not clear how the geometrical properties of the particle pores mentioned before influence the elementary reaction orders. That is why in this text we consider the experimentally obtained reaction order. In the case of combustion we are interested in, the coke changes slowly. Thus we consider only the reaction order corresponding to the oxygen concentration (rate between the oxygen pressure on the surface and reference pressure, in our case atmospheric pressure) on the catalytical surface. It coincides with the total reaction order and we denote it by m. This quantity is dimensionless and its range is usually 0.3 ≤ m ≤ 1 for coke combustion, [44].
8.3
Distribution of petroleum coke in the porous media
Let us consider the reservoir under the effects of the thermal wave when the water has already evaporated and the reservoir is filled with oil and gas. We indicate the surface tension forces between oil and rock, oil and gas, gas and rock by FOR , FOG and FGR , the adherence force that attracts oil to rock surface by FA and the contact angle by θ. Figure 8.1 indicates the tension forces with the corresponding subscripts acting on the three-phase contact line. The surface force balance equation (Young law) is written as FRG − FOR = FOG cos(θ), or equivalently: cos(θ) =
FRG − FOR ≡ Kθ . FOG
(8.3)
We recall that the surface tension γ is defined as derivative of the Gibbs free energy G with respect to the surface area A:
µ γ=
∂G ∂A
¶ ,
(8.4)
P,T,n
where the subscript P, T, n means that the derivative is taken at constant pressure, temperature and molar concentration. For a displacement ∆x perpendicular to a three phase contact line 81
of length l we obtain:
dG F = , (8.5) ldx l where F is the resulting surface tension force. As the three phase contact line is the same for γ=
oil and gas we can rewrite (8.3) for surface tensions: cos(θ) =
γRG − γOR ≡ Kθ . γOG
(8.6)
One can interpret this law as resulting from the minimum energy principle. Using (8.3) we see that during the evaporation process some possibilities can occur. If γRG > γOR + γOG the petroleum coke covers the sand grains. Assume that all the sand grains are spherical and have the same radius R. It is now possible to estimate the thickness of the coke layer δ around the grain for the situation of interest to us, see Figure 8.1. From the experimental data we get the average particle radius R, coke density inside the porous media ρ0f [kg−coke/m3 −porous media] and coke density ρcoke [kg − coke/m3 − coke]. Thus, the ratio between ρ0f and ρcoke is equal to the fraction of volume occupied by coke in each particle inside porous medium: ρ0f 4πR2 δ (1 − φ) = . 4/3πR3 ρcoke
(8.7)
We get the approximate thickness of the coke layer: δ=
ρ0f R [m]. 3(1 − φ)ρcoke
(8.8)
Taking values R = 6.7 · 10−5 [m], ρ0f = 20 [kg/m3 ] from Table 8.3, φ = 0.3 from Table 2.1 and ρcoke = 500 [kg/m3 ]1 , we get δ ≈ 1.28 · 10−6 [m]. If γRC < γOR + γOG , the oil may form a globule encompassing various grains before cracking and this has profound influence on the effectiveness factor discussed below.
8.4
Effectiveness factor
It has often been stated that the molar mass of consumed carbon and the amount of released energy during the reaction in high temperature oxidation mode (combustion) depend on the consumed molar mass of oxygen but not on the nature of the carbon-containing material [44]. This is why it is important to know how the oxygen diffuses into the carbon-containing particles. 1
Value taken from the site http://www.simetric.co.uk/si materials.htm
82
Figure 8.1: Left: schematic representation of the porous media particle. Right: surface tension forces in the porous media and the contact angle.
The ratio between the real reaction rate and the idealized one with complete gas access inside and outside the particle is called the effectiveness factor, see [8]. There are two main effects responsible for the effectiveness factor. The first of them tends to decrease the effectiveness factor; it is related to the entrance of oxygen into the particle. We explain this factor in more detail later. The second one tends to increase the effectiveness factor; The effectiveness factor is enhanced by temperature effects inside the particle as the coke oxidation reaction is exothermic. All of this depends on diffusion rates, characteristic pores size and particle size. The correct way of defining and estimating the effectiveness factor taking into account both effects is still under discussion, see [48]. Also in [48] some examples of materials with effectiveness factor greater than 1 can be found. In this text we follow the references [8, 22, 44] and neglect the thermal part of the effectiveness factor. Some reasons for doing so are: the layer occupied by the fuel is thin (as described in Section 8.3 if γRC > γOR + γGC ) and if the oil spreads over the grain, then the temperature inside this layer can be considered homogeneous; certain experiments with petroleum coke (see [49]) indicate that the thermal effect is negligible for gas diffusion inside small particles; there is no comprehensive theory on this effect. Following [8], we introduce the effectiveness factor in a generally accepted way by using the Thiele modulus. This method is based on the hypothesis that the displacement of oxygen occurs only due to diffusion and that the oxygen leaves the system only because of the reaction. Then
83
it is assumed that the particles have some well defined shape (spherical, flat, long cylindrical, etc.) and the effectiveness factor is obtained form the balance equation of the reacting oxygen diffusing through the particle. In this case the factor is always smaller than 1.
8.4.1
Effectiveness factor for flat particles
Consider a “flat particle” as an infinite layer 0 ≤ x ≤ L on the yz plane in xyz space. We assume that the oxygen enters the flat particle from the side x = 0. We consider the first order chemical reaction with constant (average) reaction rate k” [35], where the double prime indicates a reaction rate per unit surface area. We also assume that the diffusion coefficient D is constant. Thus, the balance equation for the oxygen concentration c(x, t) inside the particle is:
∂c ∂c ∂ 2c +v = D 2 − k”Ag c ∂t ∂x ∂ x
·
¸ kgair , m3p s
(8.9)
where Ag [m2p /kg] is the catalytical surface area of the particle, with mp indicated unit length inside the pore. We define the boundary conditions for the oxygen concentration to c0 at x = 0 and in such way that there is no mass flux at x = L. Next we assume that the displacement of oxygen inside the particle occurs only due to diffusion (v ≪ D) and look for stationary solutions (c(x, t) = c(x)) of (8.9): D
d2 c = k”Ag c, dx2
c(0) = c0 ;
dc (L) = 0. dx
(8.10)
The solution of (8.10) is √ √ c(x) = c1 sinh( αx) + c2 cosh ( αx). where α = k”Ag /D. Using the boundary conditions we obtain the solution: √ cosh( α(L − x)) √ c(x) = c0 . cosh( αL) In order to study the oxygen flux trough the particle boundary we introduce: Z L C(t) = c(x, t)dx
(8.11)
(8.12)
(8.13)
0
as the total amount of oxygen in the system per unit surface area. Using (8.9) we obtain the total accumulation of the oxygen inside the particle: ¯L Z L Z L Z L 2 Z L dC(t) ∂c(x, t) ∂ c ∂c ¯¯ − k”Ag cdx, = dx = D dx − k”Ag cdx = D 2 dt ∂t ∂x ¯0 0 0 0 ∂x 0 84
(8.14)
where the terms on the right hand side represent oxygen flux through the boundary and the consumption of oxygen due to the reaction inside the layer. If we consider stationary solution of (8.9), the accumulation term on the left hand side of (8.14) vanishes and the flux of the oxygen through the boundary is equal to the consumption rate of oxygen inside the pore: ¯L ¯ √ √ √ sinh( α(L − x)) ¯L √ sinh( αL) ∂ c(x) ¯¯ ¯ = Dc0 α √ √ WR = D = −Dc0 α . (8.15) ∂x ¯0 cosh( αL) ¯0 cosh( αL) In order to obtain the “ideal” oxygen flux through the partice surface x = 0, we imagine that the concentration of oxygen is constant inside the particle, c(x) = c0 . For the stationary solution of (8.14) the flux of oxygen to the particle in this case: Z
L
W0 = k”Ag
c0 xdx = Lk”Ag c0 ,
(8.16)
0
We want to compare the flux W0 with the oxygen flux WR obtained from (8.14). Following [8], we define the effectiveness factor η as the ratio: √ √ WR Dc0 α sinh( αL) sinh ϕ √ η= = = [·], (8.17) W0 Lk”Ag c0 cosh( αL) ϕ cosh ϕ p where dimensionless parameter ϕ = L k”Ag /D is the Thiele modulus. In order to obtain its value we consider L to be the coke layer thickness δ given in (8.8) and approximate the reaction rate k” by k˜c exp(−E/(RT )). The values of the frequency factor k˜c and specific surface area A are given in Table 8.3. The temperature T and the diffusion coefficient are considered to be constant in the ranges 700 ≤ T ≤ 1300 and 10−14 ≤ D ≤ 10−8 [m2 /s]. The corresponding effectiveness factors are close to 1.0 as presented in Table 8.1. Table 8.1: Effectiveness factor for the flat particles of petroleum coke for different temperatures and diffusion coefficients, based on data from Table 8.3 for [44] D �T 7000 C 9000 C 11000 C 13000 C 10−8
1.0000
1.0000
1.0000
1.0000
−10
1.0000
1.0000
1.0000
1.0000
10−12
1.0000
1.0000
1.0000
1.0000
10−14
1.0000
1.0000
0.9999
0.9982
10
85
8.4.2
Effectiveness factor for spherical particles
We consider homogeneous spherical particle of fuel with radius R. Let us assume that the oxygen on the external surface has concentration c(r) = c0 and some constant concentration as the center c(0) = cL . Analogously to the flat particle case we assume that oxygen transport occurs only by diffusion and that the reaction is of first order, so that the oxygen balance equation is:
µ ¶ 1 d 2 dc(r) D 2 r = −k 00 Ag c(r). (8.18) r dr dr This equation can be solved using the boundary conditions c(0) = cL , c(r) = c0 specified above using substitution r → f = rc(r): p R sinh(r k 00 Ag /D) p . c(r) = c0 r sinh(R k 00 Ag /D)
(8.19)
The oxygen flux trough the surface of the particles: ¯ dc ¯¯ 2 WR = 4πR D ¯ = 4πRDc0 (1 − ϕ coth ϕ) , (8.20) dr r=R p where ϕ = R k 00 Ag /D is the Thiele modulus. We can estimate the ideal flux as the maximum oxygen consumed if the (catalytical) surface were completely exposed to the reaction: W0 =
4πR3 00 k Ag c0 . 3
(8.21)
We find the effectiveness factor ([8]): η=
WR 3 = 2 (ϕ coth ϕ − 1). W0 ϕ
(8.22)
Analogously to flat particle case we approximate the reaction rate k” by k˜c exp(−E/(RT )). The values of the frequency factor kc , specific surface area A and particle radius R are given in Table 8.3. The temperature T and the diffusion coefficient D are considered to be constant in the ranges 700 ≤ T ≤ 1300 and 10−14 ≤ D ≤ 10−8 . Typical values for coal are D = 10−11 [m2 /s], see [41] and T < 1100 [K], see [8]. The corresponding effectiveness factors are close to 1 as presented in Table 8.2.
8.5
Activation energy and frequency factor
Finally, the quantity most interesting to us is the observed (true) reaction rate, which represents the quantity of carbon consumed by the reaction per current carbon concentration 86
Table 8.2: Effectiveness factor for the spherical particles of petroleum coke for different temperatures and diffusion coefficients. Data from Table 8.3 for [44] D �T 7000 C 9000 C 11000 C 13000 C 10−8
1.0000
1.0000
1.0000
1.0000
10−10
1.0000
1.0000
0.9999
0.9999
−12
1.0000
0.9999
0.9898
0.8364
10−14
1.0000
0.9870
0.5679
0.1586
10
per time unit, denoted by Rc [1/s]. The definition of the observed reaction rate varies from text to text. For example in [22, 44] it is defined as the consumption rate of carbon mass per unit time per external surface area of the particle. On the other side in [39] it is defined per particle volume instead of per surface area. The observed reaction rate depends on all particle properties explained above, thus in [44] the concept of intrinsic reaction rate (reactivity) is introduced. It is the reaction rate that occurs if all the carbon containing molecules inside the particle were to contact the oxygen at total concentration. The intrinsic reaction rate, indicated by Ri , is defined in terms of carbon mass per catalytical surface area per unit time: µ ¶ −E Ri = k˜c exp RT
[
kg ]. m2 s
(8.23)
The probability that after collision of molecules the reaction occurs is given by Arrhenius’ law, which contains the activation energy in the exponential. The activation energy is indicated by E [J/mole] and it is the energy necessary to “start” the reaction. Following [22, 44], the intrinsic reaction rate is similar for combustion of any material containing carbon (e.g: coal, graphite, diamond). In this text we use the intrinsic reaction rates originating from several experiments, [43, 44, 49, 39]. Specimens of carbon produced from different original materials, or in different ways from the same material, are found to burn at very different rates under otherwise similar conditions. The speed at which an individual carbon particle of given size or mass burns depends on the rate of oxygen transfer from the bulk gas to the particle, and on the particle reactivity. This reactivity depends on (i) the extent and accessibility to oxygen of the pores within the particle, and on (ii) the rate of chemical reaction between oxygen and the pore surface. The latter factor, when properly defined, may be termed the intrinsic reactivity of carbon. In this section we 87
Table 8.3: Translating intrinsic reactivity coefficient into nondimensional reaction rate. Source
2R [m]
[2]
−5
kg σa [ m 3]
Ag [ m ] kg
k˜c [ mkg2 s ]
J EA [ mole ] η
m
Cgini
kg ηfres [ m kc [ 10s ] 3]
1950
7050
1.44
73500
1
1
1.0
20
2
6
0.0102
[43]
6.7 · 10
1730
-
200
76150
1
1
0.20 17
-
[44]
1.3 · 10−5
-
1000
3050
179400
1
1
0.20 -
3.05
[49]
2.9 · 10−3
1640
900
2216.7
167000
1
0.59
0.21 -
1.995
1660
1000
2216.7
159000
1
0.6
0.21 -
2.217
-
1600
2216.7
159000
1
0.59
0.21 -
3.547
[49] [49]
9 · 10
−4 −4
2.2 · 10
summarize the results for intrinsic reactivity from different sources. • In [44], based on the analysis of 33 different experiments from 23 papers it was shown that the intrinsic reactivity of carbon Ri obeys the Arrhenius’ law with some average activation energy E = 43[kcal/mole] ≈ 179.4[kJ/mole] and the corresponding frequency factor was k˜c = 3050 [kg/m2 /s]. The activation energies were spread through the interval of 30−70[kcal/mole]. These results were explained theoretically in [22]. • Some work investigating ISC, for example [2, 46], use an activation energy of 17[kcal/mole], however there are few volatile mixtures of coal that possess such a small activation energy. • The values for frequency factor and activation energy in [44] were obtained by analyzing the slope and displacement of the linear approximation for the intrinsic reactivity data plotted as log(Ri ) against 104 /T . This method can generate many errors in the parameters of our interest; the data for petroleum coke is parallel but at some distance from the linear approximation obtained using the least squares method onto all other carbon data. We took only the data for petroleum coke and using the least squares method obtained the frequency factor k˜c = 12100 [kg/m2 s] and activation energy E = 159.5 [kJ/mole]. The standard deviation for the activation energy was R2 = 0.98. We note that the expectation of kc , E(kc ), is larger than exp(E(ln(kc ))). In view of the small variance of the petroleum coke data we neglect this effect. • In [49], the intrinsic reactivity of petroleum coke was studied and the parameter values were k˜c = 2216.7 [kg/m2 s] and EA = 158.6[kJ/mole]. We summarize the results in Table 8.3. Remark 8.2 In [39, 43, 49] the experiments were made with petroleum coke provided by a commercial aluminium producer and prepared by the CSIRO (Australian Commonwealth Sci88
entific and Research Organization) Division of Fossil and Fuels, the results were compared with other experiments and the data for coke looks well defined.
8.6
The balance law equation
Now we are able to formulate the combustion rate of solid fuel RS in terms of molar mass of fuel per cubic meter of porous media: µ RS = ηAg k˜c ρm
PO2 Patm
¶m
µ exp
−E RT
¶ [
mole ], m3 s
(8.24)
where ρm [mole/m3 ] is molar density of fuel in porous media. We define the dimensionless oxygen concentration Cg = PO2 /Patm and scale it as Cg = Y Cgini , where Cgini is the initial dimensionless concentration of oxygen. We need the reaction rate in terms of moles of fuel per cubic meters of porous medium per second. First, we define the “dimensionless” reaction rate coefficient: kc = ηAg (Cgini )m k˜c [1/s],
(8.25)
and formulate the balance equation in terms of molar mass: ∂ρm = −kc ρm Y m exp (−E/RT ) ∂t
[
mole ]. m3 s
(8.26)
In order to nondimensionalize (8.26) we follow [2] and define the dimensionless value for specific molar density η in such way that η = 1 − ρm /ρ0m , where ρ0m is the initial fuel concentration in the porous medium. We rewrite (8.26) as: ∂η = kc (1 − η)Y m exp (−E/RT ) ∂t
[s−1 ].
(8.27)
If we follow [2] and consider m = 1, the equation (8.27) coincides with (2.4): ∂η = kc (1 − η)Y exp (−E/RT ) ∂t
[s−1 ].
(8.28)
We summarize the relevant constants in Table 8.3. Remark 8.3 In Table 2.1 we give the initial fuel concentration as ρ0f = 19.2182 [kg/m3 ] in order to obtain ρ0m we use the effective molecular weight of coke Mf from Table 2.1 and obtain ρ0m = ρ0f · (Mf )−1 ≈ 4.51 [mole/m3 ]. 89
Bibliography [1] S.A. Abu-Khamsin, E. Brigham, and H.J. Ramey, Jr. Reaction kinetics of fuel formation for in-situ combustion. SPE Reservoir Engeneering, SPE 15736-PA, 1988. [2] I.Y. Akkutlu and Y.C. Yortsos. The dynamics of in-situ combustion fronts in porous media. J. of Combustion and Flame, 134:229–247, 2003. [3] I.Y. Akkutlu and Y.C. Yortsos. Steady-state propagation of in-situ combustion fronts with sequential reactions. SPE International Petroleum Conference in Mexico, Puebla, Mexico, 2004. SPE 91957. [4] A.P. Aldushin, I.E. Rumanov, and B.J Matkowsky. Maximal energy accumulation in a superadiabatic filtration combustion wave. J. of Combustion and Flame, 118:76–90, 1999. [5] H.R. Baily and B.K. Larkin.
Conduction-convection in underground combustion.
Petroleum Trans. AIME, 217:321–331, 1960. [6] S. Balasuriya, G.A. Gottwald, J. Hornibrook, and S. Lafortune. High Lewis number combustion wavefronts: a perturbative melnikov analysis. SIAM J. on App. Math., 67(2):464– 486, 2007. [7] A.L. Benham and F.H. Poettmann. The thermal recovery process – an analysis of laboratory combustion data. Petroleum Trans. AIME, 213:406–408, 1958. [8] R.B. Bird, W.E. Stewart, and E.N. Lightfoot. Transport Phenomena. Wiley, New York, 2nd edition, 2002. [9] T.C. Boberg. Thermal Methods of Oil Recovery. An Exxon Monograph Series, 1988. [10] I.S. Bousaid and H.J. Ramey Jr. Oxidation of crude oil in porous media. SPE Journal, pages 137–148, June 1968. SPE 1937. 90
[11] J. Bruining, A.A. Mailybaev, and D. Marchesin. Filtration combustion in wet porous medium. in preparation, 2009. [12] J. Bruining, A.A. Mailybaev, and D. Marchesin. Filtration combustion with pyrolysis in porous medium. in preparation, 2009. [13] E. Brunauer and PH Emmett. Teller. J. Am. Chem. Soc, 60:309, 1938. [14] G. Chapiro. Singular perturbation applied to combustion waves in porous media (in portuguese). Master’s thesis, IMPA, 2005. [15] G. Chapiro, J. Bruining, and D. Marchesin. Chemistry of coke combustion transmuted into mathematics. in preparation, 2009. [16] G. Chapiro, G. Hime, A. A. Mailybaev, D. Marchesin, and A.J. Souza. Global asymptotic effects of the structure of combustion waves in porous media. In To appear in the proceedings of 12th International Conference on Hyperbolic Problems: Theory, Numerics, Applications, 2009. College Park, USA. [17] G. Chapiro, G. Hime, and D. Marchesin. Numerical simulation of combustion waves in porous media. In Proceedings of XXIX CILAMCE, November, 4-7, 2008. Macei´o, Brasil. [18] G. Chapiro, A. A. Mailybaev, D. Marchesin, and A.J. Souza. Long time asymptotic solution for forward filtration combustion. In preparation, 2009. [19] G. Chapiro, A. A. Mailybaev, D. Marchesin, and A.J. Souza. Singular perturbation in combustion waves for gaseous flow in porous media. In Proceedings of XXVI CILAMCE, October, 19-21, 2005. Guarapari, Brasil. [20] G. Chapiro and D. Marchesin. Non-diffusive combustion waves in insulated porous media. BJPG, 2(2):18–28, 2008. [21] G. Chapiro, D. Marchesin, and A.J. Souza. Asymptotic expansions for combustion fronts in porous media. In Proceedings of CMNE/CILAMCE, June, 13-15, 2007. Porto, Portugal. [22] H.R. Essenhigh. Fundamentals of Coal Combustion, as chapter in ”Chemistry of Coal Utilization”, Secondary supplementary volume. Willey-Interscience publication, New York, 1981.
91
[23] N. F´enichel. Geometric singular perturbation theory for ordinary differential equations. Journal of Differential Equations, 31:53–98, 1979. [24] C.F. Gates and H.J. Ramey Jr. Field Results of South Belridge Thermal Recovery Experiment. Petroleum Transactions, AIME, 213:236–244, 1958. SPE 1179-G. [25] A. Ghazaryan, Y. Latushkin, S. Schecter, and A. J. Souza. Stability of gasless combustion fronts in one-dimensional solids. Submitted to Archive for Rational Mechanics and Analysis, 2009. [26] G.H. Golub and C.F. Van Loan. Matrix computations. Johns Hopkins University Press, 1996. [27] B. He, Q. Chen, L.M. Castanier, and A.R. Kovscek. Improved in-situ combustion performance with metallic salt additives. SPE Western Regional Meeting, 2005. SPE 93901-MS. [28] G. Hime. Parallel solution of nonlinear balance systems. Master’s thesis, LNCC. Brazil, 2007. [29] G Hime and D Marchesin. Nitro: a parallel solver of nonlinear balance systems. Technical report, IMPA, 2009. [30] S. Johnson, R. Singular Perturbation Theory, mathematical analytical techniques with applications to engineering. Springer, New York, 2005. [31] C.K.R.T. Jones. Geometric singular perturbation theory in dynamical systems. Lecture Notes in Math., Springer, Berlin, 1609:44–118, 1995. [32] M. Kumar and A.M. Garon. An experimental investigation of the fireflooding combustion zone. Soc. Pet. Eng. Res. Eng., 6(1):55–61, 1991. [33] Morton K.W. and Mayers D.F. Numerical Solutions of Partial Differential Equations. Cambridge University Press, 2nd edition, 2005. [34] Mitchell S. L., Morton K. W., and Spence A. Analysis of box schemes for reactive flow problems. SIAM Journal on Scientific Computing, 27(4):1202–1225, 2006. [35] O. Levenspiel. Chemical reaction engineering. Wiley, New York, 3rd edition, 1999.
92
[36] A. D. McNaught and A. Wilkinson. online version of the IUPAC Compendium of Chemical Terminology. Royal Society of Chemistry, Cambridge, UK, 2nd edition, 1997. [37] M. Prats. Thermal Recovery. SPE of AIME, 1982. [38] W.H. Press at al. Numerical recipes in C: the art of scientific computing. Cambridge University Press, 1992. [39] W. Rybak. Intrinsic reactivity of petroleum coke under ignition conditions. Fuel, 67, 1988. [40] D. A. Schult, A. Bayliss, and B. J. Matkowsky. Traveling waves in natural counterflow filtration combustion and their stability. SIAM J. Appl. Math, 58(3):806–852, 1998. [41] N. Siemons, K.H.A.A. Wolf, and J. Bruining. Interpretation of carbon dioxide diffusion behavior in coals. International Journal of Coal Geology, 72(3-4):315–324, 2007. [42] J. D. M. Silva. Esquemas num´ericos para filtra¸ca˜o em meios porosos (in portuguese). Master’s thesis, IMPA, 2007. [43] I.W. Smith. Kinetics of combustion of size-graded pulverized fuels in the temperature range 1200-2270 k. Combustion and Flame, 17:303–314, 1971. [44] I.W. Smith. The intrinsic reactivity of carbons to oxygen. Fuel, 57(7):409–414, 1978. [45] J. Sotomayor. Li¸c˜ oes de equa¸c˜ oes diferenciais ordin´ arias. IMPA, Rio de Janeiro, Brasil, 1979. [46] A. J. Souza, D. Marchesin, and I. Y. Akkutlu. Wave sequences for solid fuel adiabatic in-situ combustion in porous media. Comp. Appl. Math, 25(1):27–54, 2006. [47] C. Strikwerda, J.
Finite Difference Schemes and Partial Differencial Equations.
Wadsworth & Brooks, 1989. [48] E.M. Tavera. Analytical expression for the non-isothermal effectiveness factor: the nthorder reaction in a slab geometry. Chemical Engineering Science, 60:907–916, 2005. [49] R.J. Tyler. Intrinsic activity of petroleum coke to oxygen. Fuel, 65:235, 1986. [50] W.R. Wasow. Asymptotic expansions for ordinary differential equations. Dover, 1987.
93