GRDC Project No CSO 00029 Residue Management, Soil Organic Carbon and Crop Performance
-
Functions of Soil Organic Matter and the Effect on Soil Properties Evelyn S. Krull, Jan O. Skjemstad Jeffrey A. Baldock
CSIRO Land & Water PMB2 Glen Osmond SA 5064
Dissolved material
Charcoal Particulate material
Humus
200 100 0 Chemical Shift (ppm) 200 100 0 Chemical Shift (ppm)
200 100 0 Chemical Shift (ppm)
200 100 0 Chemical Shift (ppm)
Disclaimer:
Any recommendations, suggestions or opinions contained in this publication do not necessarily represent the policy or views of the Grains Research and Development Corporation. No person should act on the basis of the contents of this publication without first obtaining specific, independent professional advice.
The Grains Research and Development Corporation will not be liable for any loss, damage, cost or expense incurred or arising by reason of any person using or relying on the information in this publication.
2
Contents:
page
1. Summary ………………………………………………………………………. 4
2. Introduction: a. What is soil organic matter? …………………………………………… 5 b. Soil quality and the role of SOC ………………………………… …….. 5 c. Do generic critical threshold values exist for SOC? .…………….…….. 7 d. Overview of principal functions of SOM in soils ………………..…….. 11
3. Soil carbon fractions and SOC analytical methods ……………………………... 13
4. Role of SOM on soil functions a. Physical functions: i. Soil structure and aggregate stability ….……………………….. 21 ii. Water-holding capacity …...……………………………………. 47 iii. Soil Colour ……………………………………………………… 55
b. Chemical functions: i. Cation exchange capacity (CEC) ……………………………….. 59 ii. Buffering capacity (BC) and pH ………………………………... 77 iii. Adsorption and complexation …………………………………... 85
c. Biological functions: i. SOM as a source of energy ……………………………………... 94 ii. SOM as a source of nutrients ……………………………............ 98 iii. Soil resilience and organic matter ………………………………. 106
5. The worth of SOC ………………………………………………………………… 107 6. Conclusion ………………………………………………………………………... 110
Appendix: List of abbreviations ………………………………………………………. 112 References …………………………………………………………………………….. 114
3
SUMMARY
Soil organic matter (SOM) and specifically soil organic carbon (SOC) are known to play important roles in the maintenance as well as improvement of many soil properties. While agriculture is the area most concerned with key functions and critical levels of SOC, forestry and grazing as well as groundwater contamination and C sequestration are areas where knowledge about the functions of SOC is vital.
This literature review aims to provide a comprehensive assessment of the current state of knowledge of the functions of SOC and its effect on the physical, chemical and biological properties of soil. Particular emphasis of this report, in context with the GRDC project, is placed on the effect of SOC on soil structure (aggregate stability), on cation exchange capacity (CEC) and buffer capacity (BC) of soils and on the soil’s water holding capacity (WHC). Although these properties are discussed separately, it is important to emphasise the dynamic and interactive nature of the soil system and that changes in one property will likely affect other soil properties as well. Thus, functions of SOC almost always affect several different properties and engage in multiple reactions.
While this review primarily focuses on the effect of SOC on physical, chemical and biological soil properties, it was vital to include a brief discussion on soil methodology to provide a summary of methods currently used and their respective advantages and shortcomings. Furthermore, the rationale for separating SOM into discrete organic pools by particle size separation is discussed. Specifically, we highlight that total SOC is often not a good indicator for assessing soil properties. Frequently, such properties are affected by specific pools with particular properties. Only by studying these pools separately and in conjunction with a specific function is it possible to understand what the key impacts of a SOC pool are.
The last part of the review examines the value of SOC in an ecological sense and reviews the cost and effectiveness of the carbon trading scheme, particularly with respect to mitigation of greenhouse gases.
4
INTRODUCTION
What is soil organic matter?
The term “Soil organic matter” (SOM) has been used in different ways to describe the organic constituents of soil. In this report, SOM will be used as defined by Baldock and Skjemstad (1999) as “all organic materials found in soils irrespective of origin or state of decomposition”. Since SOM consists of C, H, O, N, P and S, it is difficult to actually measure the SOM content and most analytical methods determine the soil organic carbon (SOC) content and estimate SOM through a conversion factor.
The amount of SOC that exists in any given soil is determined by the balance between the rates of organic carbon input (vegetation, roots) and output (CO2 from microbial decomposition). However, soil type, climate, management, mineral composition, topography, soil biota (the socalled soil forming factors) and the interactions between each of these are modifying factors that will affect the total amount of SOC in a profile as well as the distribution of SOC contents with depth. It is important to note that any changes made to the natural status of the soil systems (e.g. conversion to agriculture, deforestation, plantation) will result in different conditions under which SOC enters and exits the system. Therefore, perturbed systems may still be in the process of attaining a new equilibrium C content and any measurements of SOC have to take into account that the soil is in the process of re-estabilishing equlibrium, which could take >50 years (Baldock and Skjemstad, 1999).
Soil quality and the role of SOC
It is now widely recognised that SOC plays an important role in soil biological (provision of substrate and nutrients for microbes), chemical (buffering and pH changes) and physical (stabilisation of soil structure) properties. In fact, these properties, along with SOC, N and P, are considered critical indicators for the health and quality of the soil. Since Lal’s (1993) initial definition of soil quality as the capacity of soil to produce economic goods and services and to regulate the environment, the term “soil quality” has been refined and expanded by scientists and policy makers to include its importance as an environmental buffer, in protecting watersheds and groundwater from agricultural chemicals and municipal wastes and sequestering carbon that
5
would otherwise contribute to a rise in greenhouse gases and global climate change (Reeves, 1997). Doran and Parkin (1994) and Doran and Safley (1997) initially distinguished between “soil quality” and “soil health” before inclusively using the term “soil health” and defining it as “the continued capacity of soil to function as a vital living system, within ecosystem and land-use boundaries, to sustain biological productivity, promote the quality of air and water environments, and maintain plant, animal and human health”. However, the general perception of a healthy or high-quality soil is one that adequately performs functions, which are important to humans, such as providing a medium for plant growth and biological activity, regulating and partitioning water flow and storage in the environment and serving as an environmental buffer in the formation and destruction of environmentally hazardous compounds. Considering this wide variety of performance indicators, Karlen et al. (2003) and Norfleet et al. (2003) pointed out that soil quality needs to be assessed with regard to what the soil is used for, as a particular soil may be of high quality for one function and may perform poorly for another.
In particular, the suitability of soil for sustaining plant growth and biological activity is a function of physical (porosity, water holding capacity, structure and tilth) and chemical properties (nutrient supply capability, pH, salt content), many of which are a function of SOM content (Doran and Safley, 1997). Similarly, Elliott (1997) indicated that SOM was a key indicator of soil health but further suggested that particulate organic matter (POM) could be used as an indirect measure of soil health because of its short turnover time. Swift and Woomer (1993) regarded POM as the “organic fertiliser” property of SOM. In general, increases in SOM are seen as desirable by many farmers as higher levels are viewed as being directly related to better plant nutrition, ease of cultivation, penetration and seedbed preparation, greater aggregate stability, reduced bulk density, improved water holding capacity, enhanced porosity and earlier warming in spring (Carter and Stewart, 1996; Lal, 2002). Reeves (1997) noted that “SOC is the most often reported attribute from long-term agricultural studies and is chosen as the most important indicator of soil quality and agronomic sustainability because of its impact on other physical, chemical and biological indicators of soil quality”. However, Janzen et al. (1992) pointed out that the relationship between soil quality indicators (e.g. SOC) and soil functions does not always comply to a simple relationship increasing linearly with magnitude of the indicator and that therefore “bigger is not necessarily better”.
6
Do generic critical threshold values exist for SOC?
SOM concentrations are often cited as major indicators of soil quality. However, only few studies attempt to discuss minimum or maximum threshold values of soil carbon, above or below which the beneficial effect of SOC is diminished. For example, Janzen et al. (1992) showed from the relationship between SOC in the uppermost 15cm and soil productivity, an upper threshold of SOC existed, beyond which no further increases in productivity were achieved (Fig. 1). The threshold value for SOC for these dryland sites in Alberta, Canada, was at 2% SOC, which is in accordance with the observations by Howard and Howard (1990), who estimated that the threshold value for most soils was at 2% SOC (equivalent to 3.4% SOM), below which most soils are prone to structural destabilisation and crop yields are reduced. 10000
8000
6000
4000
2000
0 0
1
2
3
4
5
6
7
8
9
Soil organic carbon (%)
Figure 1: Relationship between organic C concentration in the surface 0-15cm of soil and soil productivity as determined by total dry matter yield at dryland sites in Alberta, Canada (redrawn from Janzen et al., 1992).
Kay and Angers (1999) and Greenland et al. (1975) observed similar relationships between SOC content and aggregate stability. Using the Emerson crumb test, Greenland et al. (1975) found that at SOC 2.5%. Carter (1992) also found that maximum structural stability was obtained at 4.5% SOC. However, Doran and Safley (1997) argued that different soil types are
7
likely to have different threshold values. For example, threshold values established for highly weathered Ultisols in the southeastern US indicate that surface SOC levels of 1.2% are sufficient to attain maximum productivity. By comparison, the same value for Mollisols under grasslands in the Great Plains would be regarded as an indicator for degraded conditions, limiting soil productivity. Baldock and Skjemstad (1999) showed that different soil types not only have different total SOC contents but that the distribution of SOC with depth varies according to soil type. Similarly, Körschens et al. (1998) found that soils with different clay contents reach different SOC equilibria. In a 90 year field trial, they found that sandy soils containing 3% clay equilibrated at 0.7% SOC and soils with 21% clay reached 2.0% SOC; however, the mineralisable carbon content for both soil types was 0.4-0.5%. Based on their data, the authors proposed lower and upper limits for total SOC for soils with different clay contents to maintain optimum crop production. For soils with 4% clay, the lower and upper limit was proposed to be at 1% and 1.5% and for soils with 38% the respective limits were 3.5 and 4.4%.
Baldock and Skjemstad (1999) proposed contents of SOC which are considered to be low, medium and high for various climatic and management combinations and soil types. The influence of climate and management on SOC levels was evident and demonstrated that attributes such as “low” or “high” can only be used in a relative sense. They further pointed out that the amount of C required to perform a specific function is likely to be different as, for example, the amount required to ensure an adequate nutrient supply is likely to differ from the amount required to ensure structural stability. In conclusion, it is apparent from the studies discussed here, that soil type and climatic setting can affect the individual SOC threshold values. However, irrespective of soil type it appears that if SOC contents are below 1%, it may not be possible to obtain potential yields (Kay and Angers, 1999).
To effectively increase SOC, the rate of input must exceed the rate of loss from decomposition and leaching processes. In most agricultural cases, this is achieved by stubble retention, rotating crops with pasture, or the addition of organic residues such as animal manure, litter or sewage sludge. For example, Johnston (1991) showed that SOC of a sandy soil could be increased from 0.7 to 0.9% over 6 years by return of crop residues, which was associated with a consistent increase in arable crop and sugar beet yields. Subsequent annual applications of farmyard manure (FYM) increased SOC from 1% to 3.4% whereas long-term application of fertiliser N had no measurable effect on SOC levels. Similarly, Paustian et al. (1992) showed in a 30-year-long Swedish field trial that biannual additions of various organic carbon residues (straw, sawdust,
8
green manure, and FYM) had positive effects on soil C levels (Fig. 2). The highest accumulations occurred with sawdust plus N and manure amendments. It was suggested that the quality of the amendments was related to these trends as lignin contents were high for sawdust and FYM (30%) and low for straw (15%). This is in accordance with a study by Grace et al. (1995) at the Waite Permanent Rotation Trial, showing that residues high in lignin and with high C/N ratios were more resistant to decomposition than low lignin residues. However, Paustian et al.’s (1992) study also showed that green manure had only 6% lignin but had higher C accumulation compared with straw. In turn, this was related to higher crop productivity and returned inputs due to the higher N content supplied by green manure.
Fallow No addition Fertilizer N Straw Straw + N Green manure FYM Sawdust Sawdust + N
50
25
0
+ + +
-25
+ -50
0
50
100 150 200 C input (g m-2 yr-1)
250
300
Figure 2: Effect of amendment carbon input rate and type on soil C accumulation (0-20cm) in a 30 year old Swedish field experiment (redrawn from Paustian et al., 1992).
The positive effect of FYM addition on SOC content, its effect after discontinued application and the comparative effect with NPK fertilisation was summarised by Haynes and Naidu (1998). A long-term field trial at the Hoosfield continuous barley experiment showed that plots that had received annual NPK fertilisation had a 15% higher SOC content than unfertilised plots. FYM application resulted in an exponential increase over the 140-year period, at which time the soil approached a new SOC equilibrium level, which was three times that of the unfertilised plot (Fig. 3). When FYM additions ceased, SOC content immediately started to decline; however, even 104 years after the last addition, the plot contained more SOC than the control plot. The rapid decline together with the levelling off at levels higher than the control plot was attributed to the initial
9
rapid loss of labile carbohydrate material and the increased level of long-term stabilised humic material. FYM 75
50
FYM discont. 1871 NPK fertilizer
25 control
0 1850
1900
1950
2000
Time (years)
Figure 3: Changes in SOC content on the Hoosefield continuous barley experiment with no fertiliser applied (control), annual application of NPK fertiliser, annual application of FYM (35 t ha-1) and FYM applied from 1852-1871 (modified from Haynes and Naidu, 1998).
The importance of examining threshold values at which organic carbon becomes effective and asserts a positive influence on soil properties should not be underestimated, as detrimental effects can occur if too much carbon is added to the soil. Therefore, although carbon increase is usually helpful to improve soil functions (especially in Australian soils, which are poor in carbon), more is not always better. For example, too much carbon can result in surface crusting, increased detachment by raindrops and decreased hydraulic conductivity (Haynes and Naidu, 1998). One reason for structural breakdown is a high content of monovalent cations, which can occur if too much animal waste is added. Similarly, high additions of NH4+ fertiliser may accumulate and both high organic and N additions could cause not only environmental problems but would contribute to increased dispersive effects (summarised in Haynes and Naidu, 1998). As a rule of thumb, waste applications of over 100 t ha-1 are considered a possible hazard (Haynes and Naidu, 1998). Water-repellencey is another possible consequence of too much organic matter application (Olsen et al., 1970). It is important to note, however, that alkyl carbon is a major contributor to water-repellent attributes and it is therefore possible that water repellent soils do not contain particularly high amounts of organic matter but are rather dominated by alkyl carbon (Shepherd et al., 2001).
10
Overview of principal functions of SOM in soils
The functions of SOM can be broadly classified into three groups: biological, physical and chemical (Fig. 4). These groups are not static entities and dynamic interactions occur between these three major components.
Biological Functions - provides source of energy (essential for biological processes) - provides reservoir of nutrients (N, P, S) - contributes to resilience of soil/plant system
Functions of SOM Chemical Functions
Physical Functions
- contributes to the cation exchange capacity
- improves structural stability of soils at various scales
- enhances ability of soils to buffer changes in pH - influences water-retention properties of soils and thus water-holding capacity
- complexes cations (enhanced P availability), reduces concentrations of toxic cations, promotes binding of SOM to soil minerals
- alters soil thermal properties
Figure 4: Functions ascribed to SOM. Note that interactions occur between the different soil functions modified from Baldock and Skjemstad, 1999).
It is these interactions among the soil functions, the different requirements for optimal SOM levels for each function and the individual soil mineralogical characteristics that preclude a generic number for optimal SOM levels. Furthermore, SOM is a highly heterogenous substance and varies in its chemical and physical properties, depending on the soil forming factors listed previously.
SOC requirements are likely to differ according to function and soil type. Figure 5 illustrates how soil type (represented by clay content) relates to requirements of SOC to perform specific functions. For example, for CEC SOC is of greater importance in sandy compared with clayey soils. SOC is required in larger amounts in sandy soils because most clayey soils can provide a substantial proportion of CEC through charge derived from clay minerals. For biological (energy
11
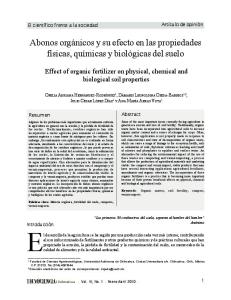
for biological processes and provision of nutrients) and thermal properties, SOC is required irrespective of clay content. Baldock and Skjemstad (1999) and Skjemstad (2002) noted that total SOC may not be a good indicator for assessing how well a particular soil function is likely to perform; mainly because the different pools, which make up the bulk SOC, vary considerably in their physical and chemical properties. Figure 5 illustrates the selective importance of SOC pools in performing specific functions. For example, the humic fraction is considered the principal pool in contributing to the soil’s CEC, whereas soil structure is provided and maintained by both the humic and particulate organic carbon (POC) fractions. Here, the POC fraction plays a greater role in sandy soils as a means of physically binding particles together. For soils with a higher clay content, both humic materials and POC are required to develop optimal structural support as both chemical and physical binding play critical roles. By comparison, POC is most important in providing energy for biological processes and humus is an important source of essential soil nutrients. Soil thermal properties (i.e. the ability to warm up quickly in cold climates) are a function of colour, and the inert carbon pool, which consists of highly aromatic structures such as charcoal, plays the most important role here.
Figure 5: The optimal expression of each SOM function requires different proportions of soil organic carbon pools (soluble, particulate, humus and inert). To which degree SOM can influence a particular function may also vary by soil type (represented by clay content).
12
Soil carbon fractions and SOC analytical methods
Due to the difficulties in measuring SOM directly, it is substituted by measurement of SOC (Baldock and Skjemstad, 1999). A convenient way to calculate SOM is by multiplying the percentage of organic carbon by a factor; however, conversion factors vary between 1.4 and 3.3 (Kuntze, 1988, Rasmussen and Collins, 1991) and this large range is due to the inherent differences between soils. Most commonly, a conversion factor of 1.72 is used (Baldock and Skjemstad, 1999). Therefore, to ensure consistency and allow reliable comparison of data, it is advantageous to report results as SOC rather than as SOM.
SOM studies have included 1) detailed study of humus chemistry to elucidate the chemical structure of SOM via fractionation schemes, 2) empirical methods to quantify effects of SOM by evaluating field experiments, and 3) simulation by soil models (Körschens et al., 1998). Determination of SOC can be made by various methods and a comprehensive review can be found in Nelson and Somners (1996). Determination of SOC by wet oxidation is typically made by acid dichromate oxidation (Kalembasa and Jenkinson, 1973), also known as the WalkleyBlack method (no heating) or Heanes method (externally heated and addition of concentrated sulphuric acid). However, several workers have found that the Walkley-Black method does not determine organic C quantitatively and depending on soil type, recoveries can vary from 56% to 100% (summarised in Skjemstad and Taylor, 1999). Determination of SOC by dry combustion converts all carbon in the presence of oxygen to CO2 during a heating process. The most commonly used dry oxidation method is done by a LECO Carbon Analyzer (Merry and Spouncer, 1988). Kalembasa and Jenkinson (1973) reviewed both dry and wet oxidation methods and concluded that dry oxidation methods were more accurate. Similarly, Baldock and Skjemstad (1999) recommended analysis of SOC by dry combustion and measurement of CO2 with an infrared detector.
An important, but often overlooked, issue in SOC studies is the question of to what depth should soil profiles be sampled and at what intervals. Because there is no agreed standardised sampling protocol across disciplines, sampling intervals commonly vary from 5, 10, 15, 20 to 30 cm. More importantly, while many studies refer to “surface samples” as the uppermost 10 cm, some studies use the uppermost 15 or 20 cm. Unger (1995), on the other hand, suggested that sampling of the surface soil should be confined to the uppermost 4 cm, as the most significant changes in SOC content are apparent in this interval and deeper sampling would obscure these effects.
13
Wilhem (2001) pointed out that while high organic matter levels in soils are vital to productivity and sustainability, the current estimates (commercial soil tests, e.g. Walkley-Black organic carbon test) are not sensitive to subtle changes in composition, as they measure total organic carbon levels. Franzluebbers (2002) further concluded that SOM was an unreliable predictor of soil and crop performance because SOM includes several different pools of organic carbon, and specific pools are relevant to structural stability, nutrient provision and cation exchange capacity. Thus, analysis of total organic carbon dilutes vital information with regard to organic pools that are sensitive to management practices and makes it difficult to quantitatively assess the effects of SOM constituents.
Current characterisation of SOM has largely moved away from definitions based solely on chemical extraction procedures, such as humic and fulvic acids (Reeves, 1997). Instead, definitions based on physical fractionations are preferred as physical separation of SOM relates better to the role that organic matter plays in soil structure and soil function (Christensen, 1992; Hassink, 1995 and reviewed by Collins et al., 1997).
A systematic categorisation of SOM is necessary to divide SOM into discrete, measurable and biologically significant entities, so-called “pools”. Separation of SOM into biologically significant pools is commonly done by size and/or density fractionation. However, it is important to note that separation of soil into different size fractions is not just a mere separation into sand, silt and clay categories, but aims to partition SOM into components that differ in their life time (“turnover time”), chemistry (size of molecules, types of functional groups), and origin (plantderived versus microbially-derived). The separation of SOC by a standard scheme into biologically significant pools is important to provide scientists from different geographic regions with a tool that allows their measurements to be comparable. It may also provide data that can be applied in soil carbon models.
Typically, SOC is divided into fractions having different properties and rates of turnover. For example, a commonly used separation scheme is to fractionate SOM into four pools: dissolved organic matter (DOM), particulate organic matter (POM), humus and inert organic matter (Fig. 6).
14
Non-living soil organic matter Humus: Particulate organic amorphous organic matter (POM): materials organic fragments with recognizable structure (>53µm)
Dissolved organic matter (DOM)
Inert organic matter (IOM): highly carbonized organic materials, incl. charcoal
non-humic biomolecules (identifiable chemical structures, e.g. polysaccharids, proteins, waxes, lignin
Litter
Macro-organic matter
Light fraction (density separation)
humic substances (no identifiable chemical structure; humic acids, humin)
Figure 6: Composition of soil organic matter (modified from Baldock and Skjemstad, 1999).
DOM constitutes the 53µm as well as the light fraction, which in turn can be separated by floatation or density separation. Humus constitutes usually the largest pool of SOM and includes non-humic and humic substances. Finally, inert organic matter (IOM) is mainly comprised of highly aromatic materials, such as charcoal or geologic forms of carbon. Figure 7 illustrates a fractionation scheme as devised by Skjemstad et al. (1996).
The light fraction and POC pool are often considered the active pool and have a relatively fast turnover time of 53µm fraction
53µm and SOC adsorbed onto soil mineral particles >53µm Density fractionation using heavy liquids density >1.6 Mg/m3
CO2 (humified carbon) POC >53µm
inert C mainly charcoal and charred plant residues
SOC adsorbed to particles >53µm
Figure 7: Modification of the fractionation scheme used by Skjemstad et al. (1996) to quantify the contents of POC, humus and inert organic carbon content of soils (redrawn from Baldock and Skjemstad, 1999).
The importance of analysing soil carbon fractions, particularly with respect to monitoring changes in land use management, is illustrated in a review by van Noordwijk et al. (1997) (Fig. 8). Deforestation was followed by long-term sugarcane cultivation and the data show that the decline in forest-derived SOM continued during the 50 years of the study and that the apparent equilibrium value of the total SOC content of the soil is based on the balance between gradual build-up of sugarcane SOM and decay of forest-derived SOM. By comparison, when forest was converted to pasture, the decline of labile forest-derived SOM was much faster; however, the accumulation of labile pasture-derived C returned the total SOC content to its original level 7 years after conversion.
16
Pasture
Sugarcane
100
100
80
80
Labile crop C Labile forest C
60
60
40
40
20
20
0
Stable forest C
0 0
2
4
6
8
10
0
Years after forest conversion
20
30
40
50
Years after forest conversion
Figure 8: Time course of total soil carbon stocks and its components, stable and labile forest C and labile crop C after conversion of forest to pasture (left) and sugarcane (right) (redrawn from van Noordwijk et al., 1997).
Measurement of the degree of structural stability of a soil is often reported as being related to SOC content and a high degree of structural stability is desirable for adequate plant growth. However, there is no single standardised method that is universally used to determine aggregate stability, which makes it problematic if one wants to compare results from the literature obtained by different analytical processes. In particular, the energy applied (to determine stable from unstable particles) and the particle size class used to determine macro- from micro-aggregates need to be standardised in order to quantitatively compare results from different studies with each other (Feller et al., 1996). Three main approaches are used to study soil aggregates (Feller et al., 1996):
1) Single or multiple sieve techniques (wet and dry sieving): Most workers consider the 250µm fraction as the defining boundary between macro- and micro-aggregates; the process of disaggregation is problematic: slaking or dispersion? 2) Measurement of the ‘dispersed’ fraction (0-2 or 0-20µm; for soils rich in swelling clays) 3) Whole aggregate analysis from the macro-aggregates to dispersed 0-2µm fraction of the same sample and taking into account energy input level (used by Oades and Waters, 1991)
17
Using the wet sieving method, Haynes and Swift (1990) observed that air-drying aggregates before wet sieving increased the aggregate stability of pasture samples but decreased aggregate stability of arable samples. Wet sieving without air-drying first showed the same trend (greater aggregate stability of pasture compared with arable samples) but less pronounced, which suggests that air-drying accentuated the differences in stability. Boix-Fayos et al. (2001) stressed that the use of aggregate size distribution to assess the soil condition or degree of degradation, must be used with caution. For example, large aggregates (>10, 10-5, 5-2mm) were found in the most arid areas of their study due to presence of earthworm casts. They termed these “untruthful” aggregates as they did not improve soil structure but increased bulk density (Db) and decreased water retention capacity. This implies that the structure of a soil is not necessarily improved by the presence of large aggregates. By comparison, small aggregates (1-0.105 and 0.5mm
Different soil types Sandy soils under grass
% soil aggregate stability MWD of air-dried aggregates
Response of soil aggregate stability to amendments sandy loam silt loam clay loam Silty loam (Udic Dystrochrept)
MWD of air-dried samples (wet sieving) MWD of field moist samples (wet sieving) SOC% in aggregates
Conversion to grass
WSA
Clover intercropped with maize in clay and sandy soils Canadian silty loam under different land uses Different soil types
%aggregates>0.25mm
Black soils under agriculture
Table 1: Synopsis of studies that defined algorithms to relate aggregate stability to SOM content. Included are also studies that failed to find a significant correlation between aggregate stability and SOM content.
Thus, the lack of a consistent analytical scheme and a standard way of reporting result in limited usability of some published data, as it might only applicable to the particular study from which they were derived.
The concept of aggregation as a process involving different organic binding agents at different scales was pioneered by Tisdall and Oades (1982) and based on their work, Oades and Waters (1991) introduced the concept of aggregate hierarchy. Large aggregates (>2000µm) were hypothesised to be held together by a fine network of roots and hyphae in soils with high SOC content (>2%), while 20-250µm aggregates consist of 2-20µm particles, bonded together by various organic and inorganic cements. Water stable aggregates of 2-20µm size, in turn, consist of 0.25 mm) and MWD were greater under ZT than CT in coarse-textured soils to a depth of 12.5 cm, macro-aggregation and MWD increased with increasing clay content under CT. Thus, the potential of ZT to improve macro-aggregation in soils with high clay content was reduced. SOC was greater in macroaggregates of coarse-textured soils but lower in micro-aggregates under ZT compared with CT, while clay-rich soils did not show a significant difference between aggregate classes. This suggests that the potential of ZT to increase SOC was found to be greatest (in cold semiarid climates) for coarse-textured soils.
Carter (1992) used two indices to determine changes in SOM and microbial biomass carbon in comparison with structural stability for several different soils (0-5cm) under different management types and tillage practices: mean weight diameter (MWD) and aggregation index (AI). AI assigns a weight factor to aggregate size ranges based on a value for plant germination and root growth, which is an agronomic value in providing optimum air-water conditions. He found that direct drilling and reduced tillage resulted in greater SOC contents (10-17%) compared with mouldboard ploughing and that under these less invasive practices, organic carbon content was greater in the 1-2 and 4.75-9 mm aggregates compared with the whole soil. This suggests that direct drilling or reduced tillage, opposed to mouldboard ploughing, can aid in the improvement of soil structure and SOC content.
Douglas and Goss (1982) investigated the effects of different tillage treatments (direct drilling, shallow tine cultivation, mouldboard ploughing) on aggregate stability and organic matter content on soils with different clay contents. Soil organic carbon content was greater in soils with higher clay content but the effects of different tillage techniques on aggregate stability followed the same trend: greatest loss in aggregate stability occurred under mouldboard ploughing whereas direct
39
drilling had the least detrimental effects. Similarly, Shukla et al. (2003) found that no tillage (NT), compared with mouldboard ploughing and chisel ploughing, had more SOC and N in 0-10 cm and had a greater amount of WSA in 0-10 and 10-20 cm. Importantly, they noted that mouldboard and chisel ploughing had lasting effects on soil physical properties: 20 months after the last tillage, the NT plot still had greater amounts of WSA, MWD and N compared with mouldboard and chisel ploughed fields.
Many studies that investigated the effect of SOC on aggregate stability overlook the fact that increased aggregate stability is most likely driven by several factors, often synergistically enhancing one another. For example, Rose (1991) stressed that the application of FYM increased not only aggregate stability by up to 20% but also increased the soil’s water holding capacity. Accordingly, they attributed the change in aggregate stability to changed flow rates and a reduction in intra and inter-aggregate porosity. Idowu (2003) examined 72 surface (0-10cm) soil samples from Alfisols under different cultivation practices in Nigeria for their aggregate stability. In order to relate soil functions to aggregate stability, he devised an aggregate stability index (ASI) by calculating the total kinetic energy required to shatter a given mass of soil:
ASI (J/kg) = (n x Ke)/m, where Ke = kinetic energy per drop (7.4 x 10⁻⁴J) and m = mass of aggregates (kg).
He found that SOM, pH, Db, silt, coarse and fine sand, and gravimetric moisture content were linearily correlated with ASI. Surprisingly, relationships between ASI and clay content were not significant. This could have been due to the relatively low clay content of the soils, ranging from 3.1-11%, since previous studies had shown that a clay content of about 15% was required before it could contribute significantly to soil aggregation. The fact that moisture content gave a positive relationship with ASI could be explained by the fact that the air-dried moisture content of soil is strongly dependent on SOM content and thus the response of moisture content to ASI may be an indirect reflection of the influence of SOM rather than being a direct causal factor. This was confirmed by a positive correlation between SOM and moisture content. ASI was also found to be related to pH and decreased with increasing pH (pH ranging from 4.5-7). The greater stability at lower pH values could be related to the presence of Al and Fe in soil solution, which contribute to the formation of organic matter complexes. A stepwise multiple regression was used to determine four variables (SOM, Db, pH and moisture content) which were significant in predicting ASI, and
40
SOM was the variable contributing most as additional variables improved the predictions by only 8%. Principal component analysis with subsequent multiple regression was performed with ASI as the dependent variable. Results indicated that pH and SOM were most influential in determining ASI, represented by the following equation:
ASI = 2.234 + 0.602 SOC + 0.213 pH,
with SOC having a partial correlation coefficient of 0.76 while pH had –0.3. Idowu (2003) concluded that SOM was the property most closely related to aggregate stability.
The influence of water potential and organic carbon on the sensitivity of soil to mechanical disturbance was shown by Watts and Dexter (1997) (Fig. 18). Their study showed that soils become more sensitive to mechanical damage when wetter and the most dramatic effect is observed for soils with 200µm POC fraction was reached, suggesting that this could be a critical threshold value and that an increase in POC content through return of crop residues could reduce clay dispersion. Figure 20 shows averaged data for SOC content over each year, illustrating an increase in SOC under pasture and decrease under wheat with a larger effect for the >200µm than the 53-200µm fraction. WDC showed a similar trend of declining values under pasture and increasing values under wheat, suggesting that upon pasture establishment, SOM increases, soil structure improves and clay dispersibility decreases. 20
200
15
>200µm 53-200µm POC dispersible clay
10 5
150 100 50
0
0 1P
2P
3P
4P
1W
2W
Rotation
Figure 20: Changes in annual averages in >200µm and 53-200µm fractions and total POC and dispersible clay (modified from Skjemstad, 2002).
However, Martins et al. (1991) showed that increased clay dispersion occurred after 5 years of clearing native rainforest, followed by crop establishment. The increase in dispersibility of clay minerals was 38% and coincided with a decrease of 35% in carbon in the A horizon. Most of the loss in carbon (88%) was from litter and from the 50-2000µm fraction (64%).
The relationship between SOM and dispersible clay and the processes that govern this relationship was investigated by Nelson et al. (1998, 1999). They found that dispersibility of clay was positively correlated with Na and negatively correlated with SOM and it was a function of amount and type of SOM, CEC, selectivity for cations and particle size. In fact, an interrelationship between decomposition of organic matter, electrolyte concentration and dispersiblity of clay was observed by Nelson et al (1998) as an increase in stability of easily dispersible clay (EDC) during a wetting and drying experiment could be attributed to a change in electrolyte concentration in the soil due to mineralisation of SOM and release of divalent cations. Furthermore, EDC tends to have a lower organic carbon content and a higher proportion of amino acids and proteins than difficult to disperse clay (DDC). These substances could aid in dispersion
43
of clays as amino acids would form complexes with Ca and increase the negative charge of clays (by decreasing the Ca concentration in solution). DDC on the other hand, contained high proportions of aliphatic C in topsoil and carbohydrate C in subsoil, which are known to form complexes with clay minerals via cation bridging. Another possibility to explain the degree of dispersibilty could lie in the relationship between size fraction and type of organic matter. Dispersion might be controlled by particle size and surface charge characteristics and certain types of organic matter might become preferentially adsorbed by larger particles with lower surface charge and vice versa. Another synergistic relationship was observed by Muneer and Oades (1989a,b), who noted that both Ca and organic matter were instrumental in improving soil aggregation (increase in WSA), increasing the resistance of organic matter to decomposition and decreasing the amount of dispersible clay.
The effect of organic amendments on SOM and clay dispersibility was investigated by Debosz et al. (2002). Sandy loam was amended with anaerobically digested sewage sludge and household compost and incubated for 11 months at constant temperature (10ºC). They found that clay dispersibility of the unamended soil increased, indicating progressive destabilisation of soil structure, whereas waste-amended soil remained at initial levels. Biomass C increased by only 0.2% (sludge) and 1% (compost), suggesting that the effects of organic matter on soil properties are more likely to be related to quality not quantity. However, polysaccharide content did not show significant changes, and they argued that this fraction is probably not instrumental in reducing the dispersibility of clay. What was somewhat surprising was the fact that the % wet stable aggregates (>0.25mm) of soil showed an almost immediate increase (25 to 50%) under sludge and a delayed increase in both compost and unamended soils, all of which levelled out thereafter and obtained similar final percentages of WSA. Debosz et al. (2002) suggested that the lack of differentiation of %WSA compared with the trends in dispersible clay might be due to the fact that incubation for 11 weeks might not be long enough for structural changes to manifest in a way that they can be distinguished among treatments. If this is the case, then dispersible clay might be a more sensitive measure of short-term structural changes then WSA.
The effect of vegetation change on clay dispersibilty was investigated by Koutika et al. (1997). They sampled the clayey Oxisols of a pasture chronosequence (at 7, 12 and 17 years) and the original virgin forest soil from Amazonia. They observed an increase in negative surface charges and clay dispersibility with increasing age in the pasture soils. Accordingly, WSA were more stable in the youngest pasture soil (7 years since clearing) and decreased with increasing pasture
44
age. To evaluate what caused these trends, they used the difference in pH values (∆pH) determined in water and in 1M KCl as this value was assumed to be proportional to negative surface charges. ∆pH values were higher in pasture soils compared with those from the virgin forest soil, which was consistent with higher CEC values in the pasture soils. They interpreted this increase in ∆pH to be due to a greater amount of organic acid functional groups after vegetation change. Similarly, Martins et al. (1991) showed a significant co-variation between CEC, fulvic acids and dispersible clays as a consequence of forest clearing. Furthermore, Koutika et al. (1997) illustrated that a relationship existed between WDC/clay and ∆pH (Fig. 21). They suggested that although structural stability, as indicated by increased WDC/clay values, was declining in the older pasture soils, the increased CEC was able to compensate for the degradation in the physical function of soil. Similar to the study by Debosz et al. (2002), they did not find a statistically significant difference between WSA in pasture and forest soils compared with the apparent increase in clay dispersibility with pasture age; however, they noted that there was a clay dispersion threshold at 1%SOC and the fact that SOC contents did not change significantly between pasture and forest soils might have contributed to the lack of change in WSA. 40
30
20
10 Virgin forest Pasture 7 yrs Pasture 12 yrs Pasture 17 yrs
0 -1.0 -0.2
0.0
0.2
0.4
0.6
0.8
∆ pH
Figure 21: Relationship between water-dispersed clay/total clay ratios (WDC/clay) and ∆pH (pHwater – pHKCl) values (modified from Koutika et al., 1997).
45
Summary •
A good correlation exists between SOC content and structural stability.
•
There is no effect on structural stability below a threshold value of 2% SOC content.
•
Carbohydrates (HWC as well as AHC) are important in improving aggregate stability; however, the efficiency might vary by soil type (greater effect in clay soils).
•
In addition to relatively short-lived effects from carbohydrates, humic materials are necessary to ensure long-term stability of aggregates.
•
Hydrophobic components (lipid material) might also aid in improving aggregate stability; however, a large amount of hydrophobic material can contribute to waterrepellency.
•
In agricultural soils, aggregate stability can be improved by reduced tillage, rotations of crops with pasture, and organic amendments; however, peat amendments were not as effective as other organic amendments.
•
Aggregate stability can be assessed by measuring clay dispersibility, which would provide a more consistent methodology compared with the various techniques to directly measure aggregate stability.
46
Water-Holding Capacity
An important indicator of soil physical fertility is the capacity of soil to store and supply water and air for plant growth. The ability of soil to retain water is termed water holding capacity (WHC). In particular, the amount of plant-available water in relation to air-filled porosity at field capacity is often used to assess soil physical fertility (Peverill et al, 1999). Total plant available water (PAW) is the amount of water held between the wettest drained condition (field capacity FC, at matric suction of -10 kPa) and the water content at which plants are unable to extract water (permanent wilting point PWP, at matric suction of -1500 kPa). However, some studies use -10 kPa for coarse textured soils only and use -33 kPa for fine-textured soils (Bauer and Black, 1992). WHC of soils is controlled primarily by the number of pores and pore-size distribution of soils, and by the specific surface area of soils. In turn, this means that with an increase in SOC content, there is increased aggregation and decreased Db, which tend to increase the total pore space as well as the number of small pore sizes (e.g. Khaleel et al., 1981; Haynes and Naidu, 1998). These relationships highlight the interconnectivity between soil structure, Db and WHC. The effect of organic carbon on the WHC of soil is generally assumed to be positive but the types of carbon responsible for this effect and synergistic behaviour with other soil properties is not well understood.
For example, de Jong (1983) and Haynes and Naidu (1998) found an increase in water content with increasing SOC content and Wolf and Snyder (2003) stated that an increase of 1% SOM can add 1.5% additional moisture by volume at FC. Emerson and McGary (2003) showed that per gram of additional carbon at -10 kPa suction, a 50% increase in water content was achieved (Fig. 22). They suggest that the organic carbon from exudates (‘gel’) from ectotrophic mycrorhiza would bond soil particles, which would result in a change in the size of the pores and a change in water retention at -10 kPa.
Calhoun et al. (1973) found that if “organic matter” was added to pedotransfer functions (PTFs) a significant improvement of the PTF for -33 kPa was noted; however, results for -1500 kPa were ambiguous. Notably, PTFs have been used by Kay et al. (1997) to assess the sensitivity of structural characteristics of coarse and medium textured soils to changes in SOC and PAW. These PTFs are based on fitting empirical equations to soil water retention (SWR) characteristics data.
47
4
3
2
1
0 15
20
25
30
35
Water content (% by wt.)
Figure 22: The increase with %C in water retention at 10 kPa suction of silty aggregates (redrawn from Emerson and McGary, 2003).
The empirical equations, in turn, are used to model the SWR characteristics data from a range of soils and multiple linear and non-linear regression analyses are used to develop predictive functions. Their analysis predicted that an increase in SOC content of 0.01 kg kg-1 would increase PAW from 0.02 to 0.04 m3 m-3, with the largest increase occurring in coarse-textured soils. Their predictions further showed that an increase in SOC increased WHC at FC and PWP across a range of clay contents. However, the increase at FC tended to be greater than at PWP and the effect of increasing SOC on PAW diminished as clay content increased. These findings are very similar to results obtained from actual measurements, substantiating the value of PTFs in providing sensible results for large data sets. Baldock (unpublished data) used Kay et al.’s (1997) continuous PTFs to assess the effect of an increase in SOC on the WHC for Red Brown Earths from Australia by utilizing the following equation: θv = a Ψmb , where θv = volumetric water content cm3 cm-3 Ψm = matric potential a = exp (-41518 + 0.6851 ln clay (%) + 0.4025 ln SOC (%) + 0.2731 ln BD)
r2 = 0.94
b = -5456 + 0.1127 ln clay (%) + 0.0223 ln SOC (%) + 0.1013 ln BD
r2 = 0.94
BD = bulk density
His results showed that if organic carbon in soil is increased by 0.01g organic carbon per gram of soil, WHC can be increased by up to 30%, depending on clay content (Fig. 23).
48
0.3
A.
B.
30
0.2 20 0.1
RBE
10
RBE with 1% increase in SOC of total soil mass
0.0 0
10
20
0
30
% increase in WHC when SOM is increased by 0.01 g OC/g soil
0
% clay content
10
20
30
% clay content
Figure 23: WHC (volume basis) of Red Brown Earths as a function of clay content and SOC, using PTFs of Kay (1993) (a) and % change in WHC of Red Brown Earths derived by PTFs of Kay (1993) when SOC is increased by 0.01g organic C g-1 soil (b) (Baldock, unpublished data).
However, reports about relationships between SWR and SOC content can be contradictory. Thomasson and Carter (1989) found that for agricultural top soils, SOC contributed no more than 15% to the variance in soil water content and there was no apparent threshold value with SOC content. Similarly, Loveland and Webb (2003) reported that SOC contributed 5%.
Rawls et al. (2003) attributed the conflicting results between SOC and WHC to the synergistic effects of textural components and SOC. To assess the influence of texture, they used 1200 samples from the Soil Survey Staff, where texture, SOC content, water retention at -33 and -1500 kPa, Db at -33 kPa and taxonomic characterisation were known. These data were analysed using regression trees and group method of data handling (GMDH), which have been recently used to develop PTFs. Based on these GMDH equations, isolines of water content at -33 kPa and -1500 kPa for 1, 2 and 3% SOM and proportions of clay and sand were generated (Fig. 24). These data show that at -33 kPa, SWR tended to increase with increasing SOC and the largest increment in water contents occurred in coarse textured soils. However, a decrease in SWR with SOC increase was observed for fine textured soils with high clay content. The analyses further showed that clay or sand content alone were not good predictors for the effect of SOC on SWR at -33 kPa because the 35% isoline, for example, with 2% SOC was applicable to three combinations: 20% sand/5% clay, 10% sand/20% clay and 20% sand/35% clay (Fig. 24).
49
100 20
80 20
100
Corg = 1% Corg = 2% Corg = 3%
80
25 25
-33 kPa
60
-1500 kPa
60
25 30
40
8
40
30
12 16
30
20
20
35
20
40
35
45
35
24
45
28
0
0 0
20
40
60
80
100
0
20
Clay content (%)
40
60
80
100
Clay content (%)
Figure 24: Isolines of water content at -33 kPa and -1500 kPa in a textural triangle at different organic carbon contents (redrawn from Rawls et al., 2003).
Analyses for the -1500 kPa matric potential showed that soils with low clay content showed the largest increase in SWR with increasing SOC content (Fig. 24). Based on the results from the analyses at -33 kPa, Rawls et al. (2003) assessed the sensitivity of SWR to changes in SOC for different levels of initial SOC content and texture and found that sensitivity decreases as initial SOC content increases (Fig. 25). At low SOC contents (1%), the sensitivity of SWR to changes in SOC is highest and SWR increases with low clay but decreases with high (>50%) clay content. Similar but less sensitive results were achieved at 3% SOC, whereas at 5% SOC there was a small but consistent increase in SWR in all textures. 100
5
100
3
80 60
1
-33 kPa 0 (vol%)
40
60
1
80
2
60
1
0
-3
20
80
40
-2
0
Corg = 5%
3
2
60
-1
20
Corg = 3%
3
80
2
40
0
100
Corg = 1%
4
40
-1
20
100
0
0
20
0
20
40
60
80
100
0
0
20
40
60
80
100
Clay content (%) Figure 25: Changes in soil water content at -33 kPa (vol.%) per 1% change in organic carbon content with various initial carbon contents (Corg) shown in the graph.
50
Based on the predictions from Rawls et al.’s (2003) GMDH data, it appears that a) SOC was an important soil property to improve estimation of SWR, b) SWR of coarse textured soils were more sensitive to changes in SOC than fine textured soils and that c) SWR in heavy clay soils decreased with increasing SOC content.
The effect of texture on soil water content and SOC was investigated by Bauer and Black (1992), using actual field trials. They compared coarse- and fine-textured soils from two cropland management systems (conventionally cultivated and stubble-mulched) and two grassland systems (grazed and relict virgin). Similar to Rawls et al.’s (2003) predictions, they found that the greatest changes in SWR were observed in sandy soils, where the change accounted for 75% of the change in water concentration by weight (Pw) at both FC and PWP. A unit change in SOC content in sandy soils caused a greater change in Pw at FC than at the PWP, but in medium and finetextured soils, the change in Pw at FC was parallel with the change at PWP (Fig. 26).
300
Sandy
FC y = 4.25x + 153
200
100
PWP y = 1.74x + 58
0 300
Medium FC
200
3
y = -1.26x + 0.00075x + 264
PWP
100
3
y = 0.00035x + 128
0 400
FC
Fine
2
3
2
3
y = -9.76x + 0.231x - 0.00131x + 415
300
PWP
y = -6.48x + 0.153x - 0.00079x + 235
200
0 0
10
20
30
40
50
60
Organic Carbon (g kg-1)
Figure 26: Water concentration at field capacity (FC) and the permanent wilting point (PWP) in relation to organic carbon concentrations in three textural soil groups (n = 256) (redrawn from Bauer and Black, 1992).
51
In the medium-textured soils, there was essentially no change in FC and PWP when SOC was < 30g kg–1. In the fine-textured soils, however, the Pw at both FC and PWP was lowest at SOC contents of around 30g kg–1 and the largest change occurred between 40-60 g kg–1. This means that PAW remained constant in sandy and increased in fine-textured soils because the differences in increases between FC and PWP were offset by a concurrent decrease in Db. Increases in SOC can be achieved by adding organic matter (as manure, plant residues or sewage sludge) to the soil and positive effects of organic amendments on WHC have been reported by Khaleel et al. (1981) and Haynes and Naidu (1998). Similar to the results obtained from Rawls et al. (2003), Khaleel et al. (1981) found that the relative increase in WHC became smaller as the amount of organic matter from amendments increased. WHC increased at both FC and PWP with organic waste amendments, but the relative increases varied with soil texture. Fine-textured soils showed a greater increase in WHC at FC than at PWP, whereas for coarse-textured soils, a larger increase in WHC was observed at PWP. Importantly, if an increase in SOC causes an increase in moisture content at both FC and PWP, the net result on PAW may not be greatly affected since PAW is defined as the difference between moisture content at FC and PWP. Furthermore, the decrease in Db in the waste-incorporated soil tended to counterbalance any increase in PAW on a weight basis. The observations by Khaleel et al. (1981) agree with the findings by Haynes and Naidu (1998), who noted that since WHC of soils is generally increased by additions of organic waste at both FC and PWP, PAW is often not greatly affected. However, they differentiated between different processes affecting WHC after SOC amendments at high (PWP) versus low (FC) tensions. An increase in WHC due to SOC amendments at FC was attributed to an increased number of small pores. At PWP, on the other hand, the soil moisture content is determined by surface area and thickness of water films and addition of SOC would increase the specific surface area, resulting in increased WHC at higher tensions. However, the positive effect of organic amendments on WHC is not without contention as, for example, Gupta (1977) reported no significant changes in PAW after application of sewage sludge to a sandy soil. By comparison, large and positive effects of organic amendments on PAW were reported by de Silva et al. (2003), who found that after 16 months of repeated incorporations of both FYM and municipal waste compost (MWC) at 50t ha-1, PAW doubled compared to an unamended soil. MWC proved to be better in conserving soil water than FYM for sandy soils; however, over the 16 months of the experiments, they observed a high variability in SOC contents due to the dynamics between addition of amendments, breakdown of organic matter and translocation to deeper depths and accordingly, the positive results on PAW became apparent only after 12 months.
52
Mapa and de Silva (1994) achieved comparable results: They investigated the effects of adding FYM, rice straw or green manure on soil water content of sandy soils. After the first month, the highest increase in PAW was observed with FYM (10,000 kg ha-1) and the lowest increase occurred under straw. However, after three months, straw and green manure showed increases in PAW whereas the effect of FYM treatments declined (Fig. 27). This was attributed to the low C/N ratio of FYM (10.5), resulting in a faster decomposition rate compared with green manure (intermediate C/N ratio: 13.4) and straw (highest C/N ratio: 15.3). However, the range of C/N ratios is rather narrow and it is uncertain whether the small changes in the ratios or a difference in organic composition (e.g. greater lignin concentration) were responsible for the observed trends. SOC increased after one month for all treatments but showed greatest decline for FYM and least for straw after three months. Thus, positive relationships between SOC and available water could only be established for the first month but were not maintained for three months. Based on the data from these experiments, the authors concluded that it was not possible to verify a consistently positive relationship.
180 160 140
A.
Control FYM Straw GM
5 4
B.
Control FYM Straw GM
3 120 2 100 1
80
0
60 month 1
month 2
month 1
month 3
month 2
month 3
Figure 27: Changes in available water capacity (A.) and SOM (B.) after organic amendments with farmyard manure (FYM), straw and green manure (GM) over a three month period (data from Mapa and de Silva, 1994).
53
Summary •
Most studies show a positive relationship between increase in WHC and increase in SOC; however, the fact that some studies show little or no effect suggests that SOC threshold values and/or specific SOC components are required for WHC to be increased.
•
The effect of SOC on SWR tended to be greater in coarse textured compared with fine textured soils; in fact, SWR in heavy clay soils decreased with increasing SOC content.
•
There is a strong relationship between clay content, SOC content and WHC and it is likely that these factors influence each other synergistically.
•
Low initial SOC content resulted in decreased effects on WHC capacity compared with higher initial SOC contents, suggesting that a lower threshold value exists for SOC content.
•
It is important to note that if an increase in SOC causes an increase in moisture content at both FC and PWP, the net result on PAW may not be greatly affected since PAW is defined as the difference between moisture content at FC and PWP.
54
Soil Colour
Soil colour is often used as the highest categorical level in many soil classification systems, e.g. the concept of the Russian chernozem was centered around the thick dark soils of the Russian steppe and the Mollisol order of the US soil taxonomy is specifically defined to include most soils with relatively thick, dark surface horizons (Schulze et al., 1993). Generally good soil conditions are associated with dark brown colours near the soil surface, which is associated with relatively high organic matter levels, good soil aggregation and high nutrient levels (Peverill et al. 1999). Schulze et al. (1993) found that within similar landscapes and soil texture classes, there was a good linear correlation between Munsell soil colour and SOM for Ap horizons from Indiana and Illinois (Fig. 28). 5
4
3
2
1 0
10
20
30
40
50
60
-1
Organic Matter (g kg )
Figure 28: Relationship between Munsell value (moist) and soil organic matter content for Ap horizons from different landscapes from similar parent materials (loess) (modified from Schulze et al., 1993).
The effect of usually dark brown or black SOM on soil colour is important not only for soil classification purposes, but also for ensuring good thermal properties, which in turn contribute to soil warming and promote biological processes (Baldock and Nelson, 1999). Only about 10% of the solar energy reaching the earth’s surface is actually absorbed by the soil, which can be in turn used to warm the soil. Naturally, dark-coloured soils absorb more energy than light-coloured ones. However, this does not imply that dark-coloured soils are always warmer: since darkcoloured soils usually have a higher amount of organic matter, which holds comparatively larger amounts of water, a greater amount of energy is required to warm darker soils than lightercoloured ones (Brady, 1990). Thus, the thermal property of soil is to a large degree influenced by
55
water content, Db, soil texture (fine versus coarse) and soil colour. In addition, the surface cover of soil affects the heat transfer in and out of a soil, as bare soils warm up and cool off more quickly than those with a vegetation or mulch cover. For example, Sharratt and Flerchinger (1995) investigated the effect of straw colour treatments (black, white and natural colour) on surface temperature, thaw depth and latent, sensible and soil heat flux over a two-year-period. They found that with the black straw cover daily soil temperatures at 0.05 m, soil surface heat flux and thaw depth were 0.5ºC, 0.5MJ m-2, and 10 mm greater compared with the other treatments. Simulations from an atmosphere-snow-straw-soil system model showed that straw colour did not influence the proportion of absorbed radiation utilised in latent heat flux, but black straw treatment had the greatest percentage of net radiation allocated to sensible heat flux. The additional energy absorbed by the soil-black straw surface, however, was largely dissipated through sensible heat loss. Thus, Sharratt and Flerchinger (1995) concluded that only a small gain in soil heat was achieved by the black straw treatment. The results from these studies can be likened to the effect of burning and the generation of charcoal on soil colour. Ketterings and Bigham (2000) proposed a correlation between fire severity, burned soil colour and soil fertility and investigated the effect of fires of different severity (temperature and duration) on soil colour. They found that Munsell colour and chroma decreased with increasing heat severity and that at temperatures >600ºC, much of the surface carbon was depleted and the soil was reddened. By comparison, lightly burned areas (short exposure at 100-250ºC) were characterised by incompletely combusted material and blackened soil. In laboratory experiments, Ketterings and Bigham (2000) studied the effects of duration of exposure at different temperatures on soil colour and found that samples rapidly darkened (lower Munsell value) with heating time at 300ºC but became lighter at 600ºC (Fig. 29). The results from this study highlight the importance of soil chemistry on soil colour: Soils with similar SOC contents may have very different colours (specifically hues) if their respective proportion of charcoal differs.
Konen et al. (2003) investigated 130 Ap horizons to quantify the relationship between soil colour SOC content and particle sizes. As already reported in several other studies (e.g. Hassink, 1997; Hassink et al., 1997) they found good linear relationships between % clay and % sand and SOC contents. Significant relationships were also observed for SOC concentrations and the percentage of reflectance, Munsell value and soil chroma (Fig. 30). However, as observed by Schulze et al. (1993), it was found that unique relationships exist for different soil landscapes as differences in mineralogy, texture and organic carbon composition are likely to cause differences in soil
56
300oC 600oC
7 6 5 4 3 2
A.
1 5 4 3 2 1
B.
0 0
250
500
750
1000
Duration of exposure (min)
Figure 29: Effect of static heat exposure over time of soil samples (Hapludox, under secondary forest) on Munsell value (a) and Munsell chroma (b) (modified from Ketterings and Bigham, 2000).
colour parameters. Despite these differences between soil types and position in the landscapes, the studies by Konen et al. (2003) and Schulze et al. (1993) confirm that a consistent relationship exists between SOC content and soil colour. Thus, the influence of organic matter on thermal properties of soils may not only be affected by its colour but by other soil organic properties as well (e.g. bulk density, structure). For example, Abu-Hamdeh and Reeder (2000) investigated thermal conductivity as a function of texture, moisture content, salt concentration and organic matter.
Moist y = -0.5401 Ln(x) + 2.0246 r2 = 0.68*
2
Air-dry y = -0.7768 Ln(x) +3.2955 r2 = 0.77*
1
0 0
20
40
60
80
Organic C (g kg-1)
Figure 30: Organic carbon and Munsell chroma meter relationships for moist and air-dry soil samples of different soil types from Iowa (redrawn from Konen et al., 2003).
57
Laboratory experiments were carried out on sieved and repacked soils of different textures (sand, sandy loam, loam, clay loam). Thermal conductivity was generally greater in sandy compared with clayey soils and the addition of salts (at a given moisture content) decreased thermal conductivity. Interestingly, when organic matter was increased by the addition of peat moss, thermal conductivity decreased notably (Fig. 31).
0.4
0.3
0.2
0.1 0
5
10
15
20
25
30
35
40
Organic matter content (%)
Figure 31: Soil thermal conductivity of clay loam as a function of organic matter content (as peat moss addition) (redrawn from Abu-Hamdeh and Reeder, 2000).
Finally, soil colour is used as a parameter for Landsat studies and to predict soil properties (e.g. Post et al., 1994; Bishop and McBratney, 2001). Post et al. (1994), in fact, noted that colour characteristics of sparsely vegetated landscapes were more strongly correlated with Landsat digital numbers compared to particle size, slope and vegetation.
Summary •
A good linear correlation exists between soil colour and SOC content
•
While dark-coloured soils absorb more energy than light-coloured soils, dark-coloured soils are not always warmer.
•
Dark-coloured soils with a higher amount of organic matter hold comparatively larger amounts of water, which require a greater amount of energy for heating.
•
The thermal property of soil is largely influenced by a combination of water content, Db, soil texture (fine versus coarse) and soil colour.
58
Chemical Functions Cation Exchange Capacity
Cation exchange capacity (CEC) is defined as the measure of the total capacity of a soil to hold exchangeable cations and indicates the negative charge present per unit mass of soil (Peverill et al., 1999). A high CEC is regarded as favourable as it contributes to the capacity of soils to retain plant nutrient cations. CEC is most commonly expressed as centimols of positive charge per kilogram of soil (cmolc/kg), which provides values that are numerically equivalent to the previous conventional unit of mequiv./100g. Soils can have permanent and variable charge. Permanent charge is derived from certain clay minerals (e.g. smectite) when Mg is replaced by Al or Si is replaced by Al. The strength of variable charge (provided by clay minerals and organic matter) depends on ionic strength and pH and is therefore influenced by the chemical environment of the soil (Fig. 32).
200 Organic colloid
180 160 140 120
Smectite
100 80
pH depend. charge
60 Permanent charge
40 20 4
5
6 Soil pH
8
Figure 32: Influence of pH on CEC of smectite and SOM. Below pH 6 the charge for clay minerals is relatively constant (permanent CEC charge); above pH 6, contribution of the variable charge from clay minerals is evident (ionisation of H+ from hydroxy groups). By comparison, almost all of the charges on the organic colloid are considered to be pH dependent, i.e. variable charge (modified from Brady 1990).
Several different methods exist to measure CEC and it is important to bear in mind the factors influencing CEC (e.g. pH and ionic strength) and degree of variable and permanent charge when choosing a particular method together with the pre-treatment required. For example, if soluble
59
salts are not removed during pre-treatment, the cations obtained are extractable rather than exchangeable cations, which is likely to exceed the actual CEC value (Peverill et al., 1999). Table 2 provides a summary of common methods used for measuring cation exchange capacity (modified from Peverill et al. (1999).
Non-calcareous soils, permanent charge Calcareous soils, permanent charge
Method Exchange with 1M NH4Cl, pH 7 Exchange with 1M NH4COOCH3, pH 7 Exchange with 1M NH4Cl, pH 8.5 Exchange with 1M (OHC2H4)(CH3) 3NCl
Reference Rayment and Higginson (1992) Blakemore et al. (1987) Rayment and Higginson (1992) Tucker (1985)
Variable charge soils
Compulsive exchange with BaCl2/NH4Cl
Gillman and Sumpter (1986); Rayment and Higginson (1992) Blakemore et al. (1987); Rayment and Higginson (1992); Oorts et al. (2003)
Exchange with 0.01M silver thiourea
Exchange acidity determination
Removal of soluble salts
Exchange with 0.01M KCl Exchange with BaCl2 in triethanolamine at pH 8.2 and acid titration of excess triethanolamine Pre-treatment with a solvent
Rayment and Higginson (1992) Blakemore et al. (1987); Rayment and Higginson (1992) Tucker (1985); Rayment and Higginson (1992)
Table 2: Common methods used for measuring CEC (modified from Peverill et al., 1999).
As pointed out by Tan and Dowling (1984) it is important to distinguish between permanent (CECp) and a pH-dependent variable charge (CECv), as it illustrates the contribution of SOM and minerals to soil CEC. Most soils carry both types of charges, which can be seen by the common observation that soil CEC tends to increase with increasing pH, and what is considered the total CEC (CECt) is the one measured at pH 8.2. CECp is considered to be derived from the clay fraction and other mineralogical components (e.g. amorphous oxides) while CECv is regarded to be derived from soil humus and accordingly, the presence of organic matter generally causes the CEC in variable-charge clay soils to be greater. However, some components of SOM are known to be of greater importance in contributing to CECv than others.
Functional groups of SOM have been associated with an increase in CECv (Oades et al., 1989). The importance of the contribution of soil organic matter components to CECv as well as CECt has been highlighted by several studies. For example, Oades et al. (1989) observed a decline of CEC with soil depth along with a decline in SOM but unchanged clay content and composition. Based on further studies, they described the relationship between CECv and organic carbon: CECv = 1.32 + 1.09 SOC (r2 = 0.76),
60
which means that a 1% increase in SOC leads to 1 unit (cmolc kg-1) of increase in CEC in variable charge soils. The effect of SOM on the point-of-zero charge (pH0) of the soil variable-charge component is considered the most important aspect in increasing CECv (Fig. 33). (pH0-pH) -0.5
-1.0
-1.5
-2.0
-2.5 5
7
4
6
3 5 2 4
1
3 1
2
3
4
5
Organic C (%)
Figure 33: Relationship between pH0 and SOC content (filled circles) and increase in CEC of variable charge components (CECv) with increasing negativity (pH0-pH) (open circles) in Oxisols under virgin rainforest from northern Queensland (modified from McBride, 1994).
The point-of-zero charge is defined as the pH value where the number of protonated and deprotonated sites is equal, and higher levels of SOM result in a lowering of the zero point. Therefore, the greater the difference between soil pH and pH0, the greater the net surface charge will be on variable charge components, and if pH0-pH is < 0 the net charge is negative. Organic matter itself generally has a low pH0, which is due to the presence of carboxyl groups (Oades et al., 1989) and here the high molecular weight (HMW) fraction contributes less to CEC (c. 170 cmolc kg-1) compared with the low molecular weight (LMW) fraction (c. 500 cmolc kg-1) (Wolf and Snyder, 2003). Because permanent charge is generally only 1-2 cmolc kg-1, Oades et al. (1989) recommended that it is important to maximise the variable charge by maintaining the highest possible SOC contents. The effect of SOM on the point-of-zero charge was also noted by Gillman (1985), who found that pH0 decreased by 1 pH unit for each 1% increase in organic C, which would equate to 17 t ha-1 of SOM in the 0-10 cm (assuming SOM = 1.7 x organic carbon). Furthermore, the importance of SOM to CEC increases as soils weather and change from 2:1
61
aluminosilicates (CEC = 15-30 cmolc kg-1 soil) to kaolinite and amorphous oxides of Fe and Al (CEC = 2% increased the CEC of surface soils by up to 4 times compared with mineral soil with SOC concentrations < 2%. Furthermore, at SOC contents < 2%, there was no measurable effect on CEC and they suggest that 2% could indicate a minimum threshold value. Parfitt et al. (1995) found in their studies that most of the soil CEC was due to organic matter (carboxyl groups) and, furthermore, that the presence of SOC reduced the CEC of smectite: 1% of SOC reduced the CEC of smectite by about 5.5 cmolc/kg. Loveland and Webb (2003) reported that CEC values for agricultural soils can range from 2-50 cmolc kg-1, and values of around 5.0 - 5.5 r2 = NS
3 2
pH < 5.0 r2 = NS
1 0 0
1
2 3 4 Organic matter (%)
5
6
Figure 36: ECEC as a function of organic matter at various ranges of pH values. Relationships were not significant at pH 5, the influence of organic matter was significant (modified from Lopes and Cox, 1977).
To form functional relationships between different measures of CEC, it is important to understand how CEC of organic and mineral components change with pH. Furthermore, the pH dependence of CEC is also important to assess the buffer capacity of soils as within a pH range of 5-8, the pH buffering in non-calcareous soils is mainly due to CEC reactions (functional groups acting as sinks for H+ and OH-) (Curtin et al., 1996). Therefore, a differentiation of CEC into organic and mineral fractions is necessary because organic and mineral sites differ in their affinity for cations, as SOM shows a strong selectivity for divalent cations over Na and for Ca over Mg compared with clay (Curtin et al., 1998). Curtin and Rostad (1997) suggested that a mathematical expression was needed to describe the relationship between CEC and ECEC. They analysed a large (n = 1622) dataset, from which they developed a relationship to estimate CEC as a function of pH. A regression equation with SOC and clay as independent variables explained 86% of the variability in CEC at pH 8.2 (BaCl2 as buffer) and estimated the CEC of organic matter (assumed to be 58% C) and clay at 213 cmolc kg-1 and 51 cmolc kg-1, respectively (at pH 8.2): buffered CEC (cmolc kg-1) = 23 + 368 SOC kg-kg + 51 clay kg-kg (R2 = 0.861). The intercept (23 cmolc kg-1) is the value of CEC if clay and organic matter were equal to zero. Curtin and Rostad (1997) noted that the buffered CEC could not be fully accounted for by clay and SOM alone (large intercept at 23) and they attributed the difference to the presence of layer silicates in the silt fraction. They concluded that contribution to the buffered CEC from clay was 60%, 25% from SOM and 15% from silt: buffered CEC (cmolc kg-1) = 18 + 362 SOC + 51 clay + 3 silt (R2 = 0.863).
66
They further established a function to describe ECEC, based on the assumption that ECEC of SOM and clay increase linearly as pH increases to 8.2, when SOM and clay reach the respective values of 213 cmolc kg-1 and 51 cmolc kg-1 (R2 = 0.86***):
ECEC = a + [b1 – (8.2 – pH)b2]OC + [b3 – (8.2 – pH)b4]clay, where a is the intercept and b1 and b3 are buffered CECs (pH 8.2) of SOM and clay and b2 and b4 are amounts by which ECEC of SOM and clay change for a unit change in pH. Further analyses showed that the pH-dependency of the organic ECEC was higher than that of the mineral ECEC, which in turn is a measure of the buffer strength of SOM and clay.
The contribution of silt to CEC or ECEC was also noted by Asadu et al. (1997). They conducted a survey of several different soil types from sub-Saharan Africa and found that SOM content accounted for c. 60% of the mean ECEC, and clay, silt and SOM content together accounted for up to 72% of variability. However, there were differences in terms of topographic and climatic zones. In soils of non-humid, lowland humidic and mid-altitude zones, the contribution of silt to ECEC was greater than in subhumid, highland humidic and low altitude zones. Asadu et al. (1997) attributed the greater influence of silt to the formation of clay-OM complexes (OM bonding to smectite or kaolinite via cation bridging) which would reduce exchange sites for both the clay- and organic-associated CEC. They suggest that these processes would be partly influenced by climate and landscape position.
While several studies use clay content as a mesasure to assess CEC, the use of specific surface area (SSA) is often advocated as a better estimate of CEC and to study the effects of SOM on CEC. For example, Curtin and Smilie (1976) found that for a set of 51 soils with variable SOC contents (0.1-8.9%), clay contents (0.4-56%) and pH values (3.8-8.3), CEC was well correlated with SOC and specific surface area (SSA), accounting for 97% of variation in CEC. In comparison, clay content accounted for only 58% of variation and Curtin and Smilie (1976) suggested that SSA measurements were able to account for the presence of phyllosilicates in both the sand, and more importantly, the silt fraction of the soil. Accordingly, they advocate the use of SSA instead of clay content to estimate the inorganic component of soil CEC. In a more detailed study, Thompson et al. (1989) used particle size separation (20-50, 2-20, 0.2-2 and