Fuel Economy in Harris County 2002, 2007 and 2009 By Dr. Graciela Lubertino Houston-Galveston Area Council March 2008
Abstract Due to the fact that taxpayers are only required to report their sales of diesel and gasoline fuel on a statewide basis when they file their Texas Fuel Tax Report, the comptroller receives one fuel tax report per company that includes all their sales in Texas. This includes large companies such as Exxon-Mobil, Shell, B.P., Citgo, etc, as well as medium and small suppliers. The comptroller has neither data nor any way to compile the data, on motor fuel sales in any specific county or city in the state. This lack of real data, prompted Mayor Bill White’s office from the City of Houston to contact the Houston-Galveston Area Council to do a regional fuel economy study for the year 2007. This study’s aim was to determine how much fuel was being consumed daily by time of day, vehicle type, and roadway type, and to better understand the region’s fuel economy and travel pattern characteristics. Due to the success of our first Fuel Economy Study for 2007, the Houston-Galveston Area Council was contacted by Mayor Bill White’s office again to expand the study using a historical and a future year to be able to determine a trend. The years that were selected were 2002 and 2009 respectively. From our results we can conclude the following: • On an average weekday, approximately 5,000,000 gallons of fuel is consumed in Houston. • Gasoline consumption is approximately four times more than diesel consumption. • Light duty gasoline vehicles clearly dominate the VMT and the fuel consumption. • The fuel economy is almost constant during the day, with the best occurring during peak periods and the worst during midday. These facts are primarily due to changes in the proportion of heavy duty and light duty traffic volumes. • Diesel traffic tends to be highest on collectors, while gasoline vehicles tend to travel the most on freeways. • The overall fuel economy improved from 2002 to 2007 by 1.1% due to fleet turnover and an increase in number of LDG vehicles of 1%. • The VMT increased by 10% between 2002 and 2007, which shows an increment of 2% per year. • The total daily fuel consumption increased by 9% from 2002 to 2007 due to the increase in VMT since the increase in fuel economy is almost negligible. • The plots for hourly VMT and fuel economy for 2002 and 2009 follow the same pattern as for 2007. • The overall fuel economy has improved by 0.17% between 2007 and 2009 due to the fleet turn over and increased by 1 % for LDG and decreased by 1% for HDD vehicles. • The VMT has increased by 9.1% between 2007 and 2009, which shows an increment of 4.5% per year due mainly to the opening of a major facility like Interstate-10. • The total daily fuel consumption increased by 8.9% due to the increased in VMT since the increase in fuel economy is almost negligible.
Further Conclusions and Recommendations: The study shows that the effect of fleet turn over on fuel economy is almost negligible due to the fact that the CAFÉ (Corporate Average Fuel Economy) standards have not changed for about 20 years. Between the years 2002 and 2007 the VMT and fuel consumption increased at an average
2
of 2% per year, while between 2007 and 2009 the increase is about 4.5% per year, which gives a total average increase in VMT and fuel consumption of about 3% per year. Due to these facts, and in order to decrease the fuel consumption, we recommend accelerating the implementation of new CAFÉ standards to 2010 instead of 2020 and making them at least 40 mpg based on different sources of information like1: • The Union of Concerned Scientists, in Washington, DC, projects that the savings that will bring the new CAFÉ standard will be largely negated in 2020 by increased driving. •
Reports by the U.S. National Academy of Sciences2, think tanks, and activists show that a combination of existing efficiency options, such as continuously variable transmissions and better tires, can cheaply and easily deliver a 35-miles-per-gallon fleet. (See "Why Not a 40-MPG SUV?")3
•
Europe currently requires 40 miles per gallon average fuel economy and will soon push up to 49 miles per gallon, while Japan is expected to reach 47 miles per gallon in its 2015 standard.
•
California officials estimated that the state standard would yield 35 miles per gallon from new cars by about 2016--four years ahead of CAFE.4
Other recommendations are: • Aggressive implementation of transit • Hybrid vehicles • Commute solution programs Moving more freight by rail to replace trucks when possible throughout our region
3
Fuel Economy in Harris County Year 2007 By Dr. Graciela Lubertino Houston-Galveston Area Council November, 2007
4
Introduction Due to the fact that taxpayers are only required to report their sales of diesel and gasoline fuel on a statewide basis when they file their Texas Fuel Tax Report, the comptroller receives one fuel tax report per company that includes all their sales in Texas. This includes large companies such as Exxon-Mobil, Shell, B.P., Citgo, etc, as well as medium and small suppliers. The comptroller has neither data nor any way to compile the data, on motor fuel sales in any specific county or city in the state. 1 This lack of real data, prompted Mayor Bill White’s office from the City of Houston to contact the Houston-Galveston Area Council to do a regional fuel economy study for the year 2007. This study’s aim was to determine how much fuel was being consumed daily by time of day, vehicle type, and roadway type, and to better understand the region’s fuel economy and travel pattern characteristics.
Calculation Methodology In order to obtain the necessary data, existing parameters and modeling output were further processed to generate vehicle miles traveled (VMT), average fuel economy (miles/gallon), and total fuel consumption (gallons) in the format requested. Specifically, for these calculations we used the 2006 Harris county registration distribution from TxDOT, 2006 regional diesel fractions from TTI, 2007 VMT mix data provided by TTI, MOBILE6.22 (MOBILE6) default miles per gallon data from EPA, the 2007 vehicle miles traveled per hour per roadway type per vehicle type (output from IMPSUM623 program), and the 2007 network of vehicle miles traveled per link per hour (output from the TRANSVMTHSPDWKD4 program) with data provided by H-GAC. Please refer to Appendix A for definitions on what all these parameters and programs are, and to Appendix B for the input data used. The registration distribution is represented originally by an array of 16 composite vehicle classes, which aggregate the gasoline and diesel categories over a 25 year period. The registration distribution needed to be split into diesel and gasoline vehicles using the diesel sales fractions in order to be consistent with the data contained in the MOBILE6 fuel economy matrix. Table 1 shows the 28 disaggregated MOBILE6 vehicle classes according to gross vehicle weight. Table 2 shows the relation between the 16 composite vehicle classes in the registration distribution and the disaggregated vehicle classes.
5
Table 1: MOBILE6 Disaggregated Vehicle Classifications Number 1 2 3 4 5 6 7 8 9 10 11 12 13 14 15 16 17 18 19 20 21 22 23 24 25 26 27 28
Abbreviation LDGV LDGT1 LDGT2 LDGT3 LDGT4 HDGV2b HDGV3 HDGV4 HDGV5 HDGV6 HDGV7 HDGV8a HDGV8b LDDV LDDT12 HDDV2b HDDV3 HDDV4 HDDV5 HDDV6 HDDV7 HDDV8a HDDV8b MC HDGB HDDBT HDDBS LDDT34
Description Light-Duty Gasoline Vehicles (Passenger Cars) Light-Duty Gasoline Trucks 1 (0-6,000 lbs. GVWR, 0-3,750 lbs. LVW) Light-Duty Gasoline Trucks 2 (0-6,000 lbs. GVWR, 3,751-5,750 lbs. LVW) Light-Duty Gasoline Trucks 3 (6,001-8,500 lbs. GVWR, 0-5,750 lbs. ALVW) Light-Duty Gasoline Trucks 4 (6,001-8,500 lbs. GVWR, greater than 5,751 lbs. Class 2b Heavy-Duty Gasoline Vehicles (8,501-10,000 lbs. GVWR) Class 3 Heavy-Duty Gasoline Vehicles (10,001-14,000 lbs. GVWR) Class 4 Heavy-Duty Gasoline Vehicles (14,001-16,000 lbs. GVWR) Class 5 Heavy-Duty Gasoline Vehicles (16,001-19,500 lbs. GVWR) Class 6 Heavy-Duty Gasoline Vehicles (19,501-26,000 lbs. GVWR) Class 7 Heavy-Duty Gasoline Vehicles (26,001-33,000 lbs. GVWR) Class 8a Heavy-Duty Gasoline Vehicles (33,001-60,000 lbs. GVWR) Class 8b Heavy-Duty Gasoline Vehicles (>60,000 lbs. GVWR) Light-Duty Diesel Vehicles (Passenger Cars) Light-Duty Diesel Trucks 1and 2 (0-6,000 lbs. GVWR) Class 2b Heavy-Duty Diesel Vehicles (8,501-10,000 lbs. GVWR) Class 3 Heavy-Duty Diesel Vehicles (10,001-14,000 lbs. GVWR) Class 4 Heavy-Duty Diesel Vehicles (14,001-16,000 lbs. GVWR) Class 5 Heavy-Duty Diesel Vehicles (16,001-19,500 lbs. GVWR) Class 6 Heavy-Duty Diesel Vehicles (19,501-26,000 lbs. GVWR) Class 7 Heavy-Duty Diesel Vehicles (26,001-33,000 lbs. GVWR) Class 8a Heavy-Duty Diesel Vehicles (33,001-60,000 lbs. GVWR) Class 8b Heavy-Duty Diesel Vehicles (>60,000 lbs. GVWR) Motorcycles (Gasoline) Gasoline Buses (School, Transit and Urban) Diesel Transit and Urban Buses Diesel School Buses Light-Duty Diesel Trucks 3 and 4 (6,001-8,500 lbs. GVWR)
6
Table 2: Relation between the 16 composite and the 28 disaggregated vehicle classes Composite MOBILE6 Vehicle Classes
Disaggregated MOBILE6 Vehicle Classes
LDV
LDGV, LDDV
LDT1
LDGT1, LDDT1
LDT2
LDGT2, LDDT2
LDT3
LDGT3, LDDT3
LDT4
LDGT4, LDDT4
HDV2b
HDGV2b, HDDV2b
HDV3
HDGV3, HDDV3
HDV4
HDGV4, HDDV4
HDV5
HDGV5, HDDV5
HDV6
HDGV6, HDDV6
HDV7
HDGV7, HDDV7
HDV8a
HDGV8a, HDDV8a
HDV8b
HDGV8b, HDDV8b
HDBS
HDGBS, HDDBS
HDBT
HDBT
MC
MC
The split of the 16 composite vehicle categories was done as in the following example for light duty gasoline and diesel vehicles: Reg_Dist LDGV = Reg_Dist LDV x (1 – Diesel_Fraction LDV) Reg_Dist LDDV = Reg_ Dist LDV x Diesel_Fraction LDV This calculation was done for all the vehicle categories except for motorcycles (MC) that are considered all gasoline and for heavy duty transit buses that are considered all diesel-fueled. In these two cases their registration distribution was used directly. Since all these data are represented in arrays, the calculations involve matrix operations. The following equations show how the calculations were made; the numbers in parentheses show the matrix dimensions:
7
{ A } x { B }|am, md, pm, ov (25x28) (28x15) { C }t | am,md,pm,ov x { D } (15x25) (25x28)
=
= { C }| am, md, pm, ov (25x15)
equation 1
{ E }| am, md, pm, ov (15x28)
equation 2
Where the matrix descriptions are the following: { A } = matrix of registration distributions, (25x28), which represents the percentage of the 28 different vehicle types for a 25 year distribution. { B } = matrix of VMT mix, (28x15), which represents the percentage of the 28 different vehicle types on the 15 types of roads (facility types) from the travel demand model for each time period: morning peak(am peak), midday (md), afternoon peak (pm), and overnight peak (ov). The 15 facility types are the following: urban interstate, urban other freeway, toll roads, ramps, urban principal arterial, urban other arterial, urban collector, local-centroid connector, rural interstate, rural other freeway, rural principal arterial, rural other arterial, rural major collector, rural collector, and local-intrazonal. Appendix A has the definitions of these facility types. The four time periods are defined as follows: A.M. Peak: 6:01 am – 9:00 a.m. Midday: 9:01 a.m. – 3:00 p.m. P.M. Peak: 3:01 p.m. – 7:00 p.m. Overnight: 7:01 p.m. – 6:00 a.m. { C } = this matrix represents the weighting average of all vehicle types for the 25 years distribution on each facility type for each time period, (25 x 15). { C }t = the transpose of matrix C, (15 x 25). { D } = Fuel economy matrix, (25x28), which represents the miles per gallon (mpg) used for each of the 28 different vehicle types for each of the 25 years distribution, from 1983 to 2007. Please note that the original fuel economy matrix, from 1952 to 2050, had to be cut to be able to use a 25 year distribution. { E } = this matrix (15x28) represents the fuel economy weighting average over the 25 years distribution for the 28 vehicle types on the 15 facility types. Equation 1 represents the matrix multiplication of the Harris county registration distribution times the VMT matrix to get matrix C, the weighted average of all vehicle types for the 25 years distribution on each facility type for each time period. Then, in equation 2, the transpose of matrix C is multiplied by the fuel economy matrix to get matrix E, which represents the fuel economy age weighting average for the 28 different vehicle types on the fifteen different facility types used
8
in the MOBILE6 program for the four time periods. These calculations are done 4 times, one for each time period.
Results and Discussion VMT & Fuel Consumption by Time Period The results from each element of the { E } matrix were inverted and then multiplied by the hourly VMT (vehicle miles traveled) output from the IMPSUM program to calculate the total fuel consumption for each of the 28 vehicle category types for each of the road types for each hour of the day. Then, the fuel consumption results were aggregated into gasoline vehicles and diesel vehicles for presentation clarity. Please refer to Table 3 for 2007 hourly and daily total VMT, fuel consumption according to fuel type, and fuel economy (where the fuel economy was calculated as the ratio of vehicle miles traveled versus gallons of fuel consumed). This table shows that the total daily fuel consumption for the year 2007 is 5,365,554 gallons in Harris County alone. Also, it is evident that gasoline consumption is more than four times that of diesel consumption.
9
Table 3: 2007 Hourly and Daily Total VMT, Fuel Consumption and Fuel Economy By Hour 12:00 AM 1:00 AM 2:00 AM 3:00 AM 4:00 AM 5:00 AM 6:00 AM 7:00 AM 8:00 AM 9:00 AM 10:00 AM 11:00 AM 12:00 PM 1:00 PM 2:00 PM 3:00 PM 4:00 PM 5:00 PM 6:00 PM 7:00 PM 8:00 PM 9:00 PM 10:00 PM 11:00 PM Daily Total
VMT (miles) 642,652.60 425,981.40 391,427.00 371,976.40 630,885.70 1,979,662.80 6,936,735.60 8,162,231.70 6,739,251.70 4,318,154.30 4,194,602.00 4,404,710.30 4,566,049.80 4,689,193.80 5,011,654.70 7,609,070.60 8,442,372.70 9,015,676.20 7,266,495.90 3,242,030.00 2,545,525.20 2,180,939.80 1,689,400.40 1,141,997.30 96,598,678
Gas (gallons) 28,835.00 19,113.25 17,562.75 16,690.01 28,306.98 88,825.02 315,635.00 371,397.52 306,649.10 191,704.78 186,219.67 195,547.47 202,710.15 208,177.13 222,492.80 347,951.44 386,057.08 412,273.41 332,286.02 145,465.75 114,214.50 97,855.96 75,801.26 51,239.95 4,363,012
Diesel (gallons) 6,621.86 4,389.33 4,033.32 3,832.83 6,500.70 20,398.42 61,297.60 72,126.88 59,552.58 62,389.05 60,603.97 63,639.63 65,970.69 67,749.75 72,408.78 61,125.49 67,819.51 72,425.00 58,373.52 33,406.05 26,229.25 22,472.52 17,407.72 11,767.16 1,002,542
Fuel (gallons) 35,456.87 23,502.58 21,596.07 20,522.84 34,807.68 109,223.44 376,932.60 443,524.40 366,201.68 254,093.84 246,823.65 259,187.09 268,680.84 275,926.88 294,901.57 409,076.93 453,876.59 484,698.41 390,659.54 178,871.80 140,443.75 120,328.48 93,208.99 63,007.11 5,365,554
Fuel Economy (miles/gallon) 18.12491304 18.12488179 18.12492218 18.12499831 18.12490014 18.12488956 18.40311913 18.40311744 18.40311511 16.99432906 16.99432798 16.99432734 16.99432611 16.99433464 16.9943301 18.60058594 18.60059085 18.60058964 18.60058463 18.1248804 18.12487395 18.1248843 18.12486598 18.12489511 18
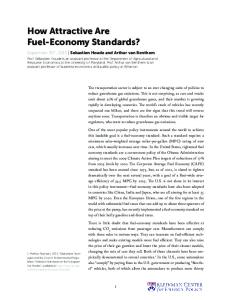
Figure 1 shows a plot of 2007 hourly VMT and fuel economy for a typical weekday. From this plot we can observe that the fuel economy is very similar for all hours of the day with the best average fuel economy occurring during the morning and afternoon peak periods and the worst at midday. To analyze the reason behind these fuel economy results, we have tabulated the VMT mix for arterials, collectors and freeways for the four time periods and the four aggregated vehicle groups, shown in Tables 4-7.
10
Figure 1: 2007 Hourly VMT and Fuel Economy Total VMT
By Hour of the Day
Average Fuel Economy 10,000,000.00
19
9,000,000.00
Vehicle Miles Traveled
7,000,000.00
18
6,000,000.00 5,000,000.00
17.5
4,000,000.00 17
3,000,000.00 2,000,000.00
Average Fuel Economy
18.5
8,000,000.00
16.5
1,000,000.00 11:00 PM
9:00 PM
10:00 PM
8:00 PM
7:00 PM
6:00 PM
5:00 PM
4:00 PM
3:00 PM
2:00 PM
1:00 PM
12:00 PM
11:00 AM
9:00 AM
10:00 AM
8:00 AM
7:00 AM
6:00 AM
5:00 AM
4:00 AM
3:00 AM
2:00 AM
1:00 AM
16 12:00 AM
0.00
Hour of the Day
Freeways Arterials Collectors
Freeways Arterials Collectors
Table 4: 2007 VMT Percentage for the Morning Period LDG LDD HDG HDD 94% 0% 1% 5% 92% 0% 1% 6% 86% 0% 2% 12% Table 5: 2007 VMT Percentage for the Midday Period LDG LDD HDG 89% 0% 1% 87% 0% 2% 83% 0% 3%
HDD 9% 11% 15%
11
Table 6: 2007 VMT Percentage for the Afternoon Period on Selected Vehicles LDG LDD HDG HDD 94% 0% 1% 5% Freeways 93% 0% 1% 6% Arterials 89% 0% 2% 9% Collectors
Freeways Arterials Collectors
Table 7: 2007 VMT Percentage for the Overnight Peak Period LDG LDD HDG HDD 92% 0% 1% 7% 93% 0% 1% 6% 90% 0% 1% 8%
From these tables we can observe that the VMT is distributed in roughly the same pattern across all four time periods, with LDG traffic comprising the vast majority of the region’s VMT throughout the 24-hour day. However, small differences are evident. During the midday period, heavy duty traffic is at its maximum, while the more fuel efficient light-duty traffic has decreased which likely accounts for most of the decrease in average fuel economy during the midday. It is also apparent that heavy-duty vehicles tend to travel on the region’s lower-speed arterials and collectors rather than by freeway, and vice-versa for light-duty vehicles; because most vehicles get better fuel economy in highway driving rather than city driving, and because the light-duty vehicles comprise most of the VMT, this trend likely equates to an increase in overall fuel economy. Also, during the morning and afternoon peak periods, fuel economy is at its highest due to the fact that traffic is dominated by LDG which is also at its highest on the freeways. According to our calculations, differences on vehicle and roadway type dominate the effects on fuel economy rather than changes in congestion levels, perhaps because the travel demand model generally does not capture congestion levels adequately. Table 8 shows the 2007 VMT, the fuel consumption, and fuel economy for the four time periods. Table 8: 2007 Fuel Consumption and Fuel Economy for the four time periods.
AM MD PM OV
VMT (miles) 21,838,219.00 27,184,364.90 32,333,615.40 15,242,478.60
Gas (gallons) 993,681.62 1,206,852.00 1,478,567.95 683,910.43
Diesel (gallons) 192,977.07 392,761.88 259,743.52 157,059.16
Total Fuel (gallons) 1,186,658.69 1,599,613.88 1,738,311.47 840,969.59
Fuel Economy (miles/gallon) 18.40 16.99 18.60 18.12
Figure 2 shows the 2007 percentage of daily fuel consumption by time period. From this information, we can observe that the afternoon peak period (PM peak) is the period with the largest total fuel consumption, which is consistent with table 8 since this period has the largest VMT. Table 8 also shows that diesel fuel consumption is highest during the midday period, which is consistent with Figure 1 and Tables 4-7 since the heavy-duty diesel traffic is at its highest during the midday period.
12
Figure 2: 2007 Daily Fuel Consumption by Time Period Fuel Consumption by Time Period AM MD PM OV
16%
22%
32% 30%
VMT & Fuel Consumption by Roadway Type Table 9 shows the 2007 daily VMT, gasoline and diesel fuel consumption, and the fuel economy according to the road type classification.
13
Table 9: 2007 Daily Fuel Consumption and Fuel Economy according to Road Type from IMPSUM output ROADWAY TYPE
VMT (miles)
URBAN INTERSTATE (Fr)* URBAN OTHER FREEWAY (Fr) TOLL ROADS (Fr) RAMPS (FWY/TOLL/FRNT) (Fr) URBAN PRIN. ART. (Ar)* URBAN OTHER ART. (Ar) URBAN COLLECTOR (Ar) LOCAL (CENT.CONN.) (Co)* RURAL INTERSTATE (Fr) RURAL OTHER FREEWAY (Fr) RURAL PRIN. ART. (Ar) RURAL OTHER ART. (Ar) RURAL MAJOR COL. (Co) RURAL COLLECTOR (Co) LOCAL (INTRAZONAL) (Co) Total
10,549,727.60
474,409.14
99,963.04
574,372.18
Fuel Economy (miles/gallon) 18.36740685
4,326,666.30 6,400,886.40
194,778.85 288,263.41
40,196.84 58,926.88
234,975.69 347,190.30
18.41325049 18.43624792
576,797.90 3,076,334.50 6,571,472.70 386,145.60 7,564,709.50 18,148,519.40
26,006.18 139,293.71 297,584.79 17,348.82 343,406.35 816,476.18
5,907.70 31,889.74 67,835.47 5,718.76 113,183.97 170,313.38
31,913.88 171,183.45 365,420.26 23,067.57 456,590.32 986,789.56
18.07357559 17.97098067 17.98332863 16.7397581 16.56782699 18.39147887
3,502,039.10 9,813,627.60 23,326,864.00 1,335,024.20 746,246.70 273,616.10 96,598,677.60
157,631.09 444,344.14 1,056,521.08 60,624.06 33,902.67 12,421.53 4,363,012.00
32,601.71 101,400.46 239,610.67 19,869.19 11,032.84 4,090.97 1,002,541.63
190,232.80 545,744.60 1,296,131.75 80,493.24 44,935.51 16,512.50 5,365,553.63
18.40922888 17.98208846 17.99729383 16.58554331 16.60706082 16.57024468 18.0034875
Gas (gallons)
Diesel (gallons)
Total Fuel (gallons)
*Where Fr, Ar and Co means freeway, arterial, and collector respectively. Table 10 shows the 2007 daily fuel consumption after the road types have been aggregated into freeway, arterial and collector. It is evident from this data that gasoline consumption is more than 4x that of diesel consumption for freeways and arterials, except for collectors, which is closer to 3x. This latter observation is also consistent with earlier observations in which there is a higher proportion of HDD traffic on collectors than other road types. Table 10: 2007 Daily Fuel Consumption and Fuel Economy for each of the aggregated roadway types Fuel Gas Diesel Total Fuel VMT (miles) Economy (gallons) (gallons) (gallons) (miles/gallon) 43,504,636.70 1,957,564.86 407,909.56 2,365,474.41 18.39 Freeway 43,174,444.40 1,955,092.54 446,455.10 2,401,547.64 17.98 Arterial 9,919,596.50 450,354.61 148,176.97 598,531.57 16.57 Collector Figure 3 shows the 2007 percentage of daily fuel consumption for the aggregated roadway types.
14
Figure 3: 2007 Daily Fuel Consumption by Roadway Type Daily Fuel Consumption by Roadway Type Freeway Arterial Collector
11%
44%
45%
Figure 4 shows the 2007 daily VMT and average fuel economy by roadway type. The lower average fuel economy observed on the collector can be attributed to the higher proportions of HDD traffic. Figure 4: 2007 Daily VMT and Fuel Economy by Roadway Type Daily Total VMT
By Roadway Type
Daily Average Fuel Economy 19.00
50,000,000.00 45,000,000.00 Vehicle Miles Traveled
18.00
35,000,000.00 30,000,000.00
17.50
25,000,000.00 17.00
20,000,000.00 15,000,000.00
16.50
Average Fuel Economy
18.50 40,000,000.00
10,000,000.00 16.00
5,000,000.00 0.00
15.50 Freeway
Arterial
Collector
Roadway Type
15
VMT & Fuel Consumption by Vehicle Type Table 11 shows the 2007 daily vehicle miles travel, fuel consumption, and daily fuel economy for each of the 28 vehicles classes. Table 12 shows this information in an aggregated format, where the vehicle types have been aggregated into light duty gas (LDG), heavy duty gas (HDG), light duty diesel (LDD), and heavy duty diesel (HDD) vehicles. Table 11: 2007 Daily Fuel consumption for each of the 28 EPA’s vehicle classifications Vehicle Class LDGV LDGT1 LDGT2 LDGT3 LDGT4 HDGV2b HDGV3 HDGV4 HDGV5 HDGV6 HDGV7 HDGV8a HDGV8b LDDV LDDT12 HDDV2b HDDV3 HDDV4 HDDV5 HDDV6 HDDV7 HDDV8a HDDV8b MC HDGB HDDBT HDDBS LDDT34 Total
VMT (miles) 58012845.9 5135561.4 17095922.1 5225791.7 2403207.9 655359.5 229724.7 90958.2 32650.2 88626.9 29153.1 33817.9 5829.2 58243.1 3915.7 1398350.6 400025.5 240016.1 170444.7 511337.6 250451.1 507856.7 3466171.8 96598.8 31989.9 111254.1 200225.7 112347.6 96,598,678
Gas (gallons) 2467837.254 281128.2326 935856.0825 372256.1609 171191.0406 66910.3672 25303.86258 10081.1238 4203.946174 11285.11468 4044.97794 4949.753818 895.3699532 0 0 0 0 0 0 0 0 0 0 1975.854178 5092.854557 0 0 0 4,363,012
Diesel (gallons) 0 0 0 0 0 0 0 0 0 0 0 0 0 1842.690906 180.8501489 111718.3158 35523.0158 24279.95112 17825.21435 60557.47342 34155.57141 79747.54268 570533.5099 0 0 26335.15808 33096.43675 6745.899222 1,002,542
Fuel (gallons) 2467837.254 281128.2326 935856.0825 372256.1609 171191.0406 66910.3672 25303.86258 10081.1238 4203.946174 11285.11468 4044.97794 4949.753818 895.3699532 1842.690906 180.8501489 111718.3158 35523.0158 24279.95112 17825.21435 60557.47342 34155.57141 79747.54268 570533.5099 1975.854178 5092.854557 26335.15808 33096.43675 6745.899222 5,365,554
Fuel Economy (miles/gallon) 23.5075655 18.26768288 18.26768284 14.03816041 14.03816398 9.794588304 9.078641622 9.022625035 7.766559953 7.853433708 7.207233373 6.832238782 6.510381524 31.60763415 21.65162718 12.51675332 11.26102306 9.885361746 9.562000023 8.443839729 7.3326573 6.368305316 6.075316769 48.88964027 6.281329977 4.224546503 6.049766068 16.6542067 18.00
Table 12: 2007 Daily Fuel Consumption by Aggregated Vehicle Classes By Vehicle Class LDG HDG LDD HDD
VMT (miles) 87,969,928 1,198,110 174,506 7,256,134
Gas (gallons) 4,230,245 132,767 0 0
Diesel (gallons) 0 0 8,769 993,772
Fuel (gallons) 4,230,245 132,767 8,769 993,772
Fuel Economy (miles/gallon) 21 9 20 7
16
Figure 5 shows the percentage of daily fuel consumption according to the aggregated vehicle types for 2007. The fuel consumption is clearly dominated by LDG. Figure 5: 2007 Daily Fuel Consumption by Vehicle Type Fuel Consumption by Vehicle Type LDG HDG LDD HDD
19% 0% 2%
79%
Figure 6 shows a plot of 2007 daily VMT and fuel economy for the aggregated vehicle types for an average weekday, from which we can observe that the LDG vehicles are the ones with the highest VMT and the highest fuel economies.
17
Figure 6: 2007 Daily VMT and Fuel Economy by Aggregated Vehicle Type Daily Total VMT
By Vehicle Type
Daily Average Fuel Economy
100,000,000
25
80,000,000
20
70,000,000 60,000,000
15
50,000,000 40,000,000
10
30,000,000 20,000,000
5
Average Fuel Economy
Vehicle Miles Traveled
90,000,000
10,000,000 0
0 LDG
HDG
LDD
HDD
Vehicle Type
Mapping of Fuel Consumption for 2007 To calculate the fuel consumption per link, we inverted the fuel economy per road type and multiplied it by the 2007 network of vehicle miles traveled for each link (see Appendix A for link definition) to get the total gallons of fuel consumed per link for each time period. The vehicle miles traveled per link per hour is the output from the TRANSVMTHSPDWKD program, this data is provided by H-GAC. The results were mapped in GIS, and can be seen in the network maps on the following pages. The morning, afternoon, and midday period maps clearly show very high fuel consumption (5011000 gallons) for most of the highway and principal arterial’s links, with some of the links showing consumption greater than 1000 gallons for that time period. As might be expected, the map from the overnight period shows the least fuel consumption. Interestingly, all of the maps show that the highest fuel consumption rates are on the north, west, and northwestern portions of the county. It may also be observed that the highest fuel consumption rates are mostly encompassed within a radius approximately delineated by Highway 6; the notable exceptions to this are I-10 west and I-45 north, which have high fuel consumption rates extending far beyond Highway 6 during all but the overnight period.
18
Montgomery Liberty
§ ¦ ¨ 45
£ ¤
£ ¤
Û
290
59
Hardy Toll
Û BW 8
Harris Waller
! ( 6
§ ¦ ¨ 610
§ ¦ ¨
Fort Bend
45
Chambers
Brazoria
Harris County Daily Total Gallons
0 - 50 Gal 51 - 200 Gal 201 - 500 Gal 501 - 1000 Gal > 1000 Gal
Fuel Consumption Chart - Morning Period Harris County
¯
Montgomery Liberty
§ ¦ ¨ 45
£ ¤
£ ¤
Û
290
59
Hardy Toll
Û BW 8
Harris Waller
! ( 6
§ ¦ ¨ 610
§ ¦ ¨
Fort Bend
45
Chambers
Brazoria
Harris County Daily Total Gallons
0 - 50 Gal 51 - 200 Gal 201 - 500 Gal 501 - 1000 Gal > 1000 Gal
Fuel Consumption Chart - Mid-Day Period Harris County
¯
Montgomery Liberty
§ ¦ ¨ 45
£ ¤
£ ¤
Û
290
59
Hardy Toll
Û BW 8
Harris Waller
! ( 6
§ ¦ ¨ 610
§ ¦ ¨
Fort Bend
45
Chambers
Brazoria
Harris County Daily Total Gallons
0 - 50 Gal 51 - 200 Gal 201 - 500 Gal 501 - 1000 Gal > 1000 Gal
Fuel Consumption Chart - Afternoon Period Harris County
¯
Montgomery Liberty
§ ¦ ¨ 45
£ ¤
£ ¤
Û
290
59
Hardy Toll
Û BW 8
Harris Waller
! ( 6
§ ¦ ¨ 610
§ ¦ ¨
Fort Bend
45
Chambers
Brazoria
Harris County Daily Total Gallons
0 - 50 Gal 51 - 200 Gal 201 - 500 Gal 501 - 1000 Gal > 1000 Gal
Fuel Consumption Chart - Overnight Period Harris County
¯
Conclusions - 2007 From our results we can conclude the following: • • • • •
On an average weekday, approximately 5,000,000 gallons of fuel is consumed in Houston. Gasoline consumption is approximately four times more than diesel consumption. Light duty gasoline vehicles clearly dominate the VMT and the fuel consumption. The fuel economy is almost constant during the day, with the best occurring during peak periods and the worst during midday. These facts are primarily due to changes in the proportion of heavy duty and light duty traffic volumes. Diesel traffic tends to be highest on collectors, while gasoline vehicles tend to travel the most on freeways.
Acknowledgments We will like to thank Dr. Dennis Perkinson from the Texas Transportation Institute for the review of this study, Christine Smith from H-GAC for helping reviewing and setting the spread sheets, and Frank Pagliei and Eric Boulet from H-GAC for the GIS mapping of the fuel consumption.
Bibliography 1-Texas Comptroller communication, November 8, 2007 2-MOBILE6.2, United States Environmental Protection Agency, 2003, http://www.epa.gov/otaq/models.htm. 3-IMSUM62, Texas Transportation Institute, 2003 4-TRANSVMTHSPDWKD, Texas Transportation Institute, 2004.
19
Fuel Economy in Harris County Historical Year Study 2002 Future Year Study 2009 By Dr. Graciela Lubertino Houston-Galveston Area Council March 11, 2008
20
Introduction Due to the success of our first Fuel Economy Study for 2007, the Houston-Galveston Area Council has been contacted by Mayor Bill White’s office from the City of Houston to expand the study using a historical and a future year, to be able to determine a trend. The years that have been selected are 2002 and 2009 respectively. For these years we have used the same calculation methodology as the previous study.
Results and Discussion – Historical Year 2002 For this study it was used the 2002 Harris county registration distribution provided by TxDOT, the 2002 VMT mix data provided by TTI, 2002 diesel fractions provided by TTI, MOBILE6.2 default miles per gallon data from EPA, and the 2002 vehicle miles traveled per hour per roadway type per vehicle type (output from IMPSUM62 program) provided by H-GAC. a) VMT & Fuel Consumption by Time Period Table 1 shows the hourly and daily VMT, fuel consumption and fuel economy for 2002, from where we can observe that the fuel economy increased by 1.1% between 2002 and 2007. Table 1: 2002 Hourly and Daily Total VMT, Fuel Consumption and Fuel Economy Hour 12:00 AM 1:00 AM 2:00 AM 3:00 AM 4:00 AM 5:00 AM 6:00 AM 7:00 AM 8:00 AM 9:00 AM 10:00 AM 11:00 AM 12:00 PM 1:00 PM 2:00 PM 3:00 PM 4:00 PM 5:00 PM 6:00 PM 7:00 PM 8:00 PM 9:00 PM 10:00 PM 11:00 PM Total
VMT (miles) 489,957.60 321,588.90 293,016.20 279,176.00 480,913.60 1,531,432.50 6,864,607.90 8,017,549.60 6,607,080.70 4,386,479.70 4,231,930.90 4,424,809.00 4,567,912.50 4,693,392.40 5,015,496.20 6,432,248.10 7,207,774.00 7,788,465.10 6,195,866.30 2,407,704.20 1,880,907.40 1,606,516.20 1,196,058.00 774,822.60 87,695,706
Gas (gallons) 22,181.21 14,558.91 13,265.41 12,638.78 21,771.60 69,330.65 314,384.76 367,186.98 302,590.45 198,452.63 191,460.41 200,186.61 206,660.92 212,337.88 226,910.39 297,211.17 333,045.44 359,877.01 286,288.74 109,000.84 85,151.89 72,729.81 54,147.65 35,077.57 4,006,448
Diesel (gallons) 4,883.23 3,205.17 2,920.40 2,782.43 4,793.15 15,263.22 59,063.13 68,983.03 56,847.32 64,212.62 61,950.21 64,773.80 66,868.58 68,705.39 73,420.76 51,410.02 57,608.52 62,249.66 49,520.90 23,996.65 18,746.29 16,011.52 11,920.61 7,722.37 917,859
Total Fuel (gallons) 27,064.44 17,764.08 16,185.81 15,421.20 26,564.75 84,593.87 373,447.90 436,170.01 359,437.77 262,665.25 253,410.61 264,960.41 273,529.51 281,043.27 300,331.15 348,621.19 390,653.96 422,126.67 335,809.63 132,997.49 103,898.18 88,741.34 66,068.26 42,799.94 4,924,307
Fuel Economy (miles/gallon) 18.10337221 18.10332786 18.10327519 18.10338891 18.10345117 18.10335168 18.38170181 18.38170762 18.3817094 16.69988611 16.69989595 16.69988735 16.69988944 16.69989232 16.69988692 18.45053677 18.45053341 18.45054027 18.45053183 18.10338017 18.10337232 18.1033582 18.10336749 18.10335787 17.80874167
21
Figure 1: 2002 Hourly VMT and Fuel Economy Total VMT
By Hour of the Day
Average Fuel Economy 19
9,000,000.00
18.5
7,000,000.00 18 6,000,000.00 5,000,000.00
17.5
4,000,000.00
17
3,000,000.00 16.5
Average Fuel Economy
Vehicle Miles Traveled
8,000,000.00
2,000,000.00 16
1,000,000.00
11:00 PM
10:00 PM
9:00 PM
8:00 PM
7:00 PM
6:00 PM
5:00 PM
4:00 PM
3:00 PM
2:00 PM
1:00 PM
12:00 PM
11:00 AM
9:00 AM
10:00 AM
8:00 AM
7:00 AM
6:00 AM
5:00 AM
4:00 AM
3:00 AM
2:00 AM
1:00 AM
15.5 12:00 AM
0.00
Hour of the Day
Figure 1 shows the same trend for 2002 as for 2007. Comparing the VMT mix (tables 2-5) for 2002 with the one for 2007, we observed the following: • an increased by 1% in the number of LDG vehicles for the morning peak period in the freeways from 2002 to 2007. • a decreased by 1% in the number of HDG vehicles for the morning peak period in the arterials from 2002 to 2007. • a decreased by 3% in the number of LDG vehicles for the morning peak period in the collectors from 2002 to 2007. • an increased by 4% in the number of HDD vehicles for the morning peak period in the collectors from 2002 to 2007. • an increased by 1% in the number of LDG vehicles for the midday period in the freeways from 2002 to 2007. • a 1% decreased in the number of HDG vehicles for the midday period in the freeways from 2002 to 2007. • a 1% decreased in the number of HDG vehicles for the midday period in the arterials from 2002 to 2007. • a 3% decreased in the number of LDG vehicles for the midday period in the collectors from 2002 to 2007. • A 4% increased in the number of HDD vehicles for the midday period in the collectors from 2002 to 2007. • A 1% decreased in the number of LDG vehicles for the afternoon period in the freeways from 2002 to 2007. • A 1% decreased in the number of HDG vehicles for the afternoon period in the arterials from 2002 to 2007.
22
• • • • • •
A 2% decreased in the number of LDG vehicles for the afternoon period in the collectors from 2002 to 2007 A 2% increased in the number of HDD vehicles for the afternoon period in the collectors from 2002 to 2007. A 1% decreased in the number of LDG vehicles for the overnight period in the freeways from 2002 to 2007 A 1% increased in the number of LDG vehicles for the overnight period in the arterials from 2002 to 2007 A 3% decreased in the number of LDG vehicles for the overnight period in the collectors from 2002 to 2007 A 3% increased in the number of HDD vehicles for the overnight period in the collectors from 2002 to 2007 Table 2: 2002 VMT Percentage for the Morning Period LDG Freeways Arterials Collectors
LDD 93% 92% 89%
HDG 0% 0% 0%
HDD 1% 2% 2%
5% 6% 8%
Table 3: 2002 VMT Percentage for the Mid-day Period LDG Freeways Arterials Collectors
LDD 88% 87% 86%
HDG 0% 0% 0%
HDD 2% 3% 3%
9% 11% 11%
Table 4: 2002 VMT Percentage for the Afternoon Period LDG Freeways Arterials Collectors
LDD 93% 93% 91%
HDG 0% 0% 0%
HDD 1% 2% 2%
5% 6% 7%
Table 5: 2002 VMT Percentage for the Overnight Period LDG Freeways Arterials Collectors
LDD 93% 92% 93%
HDG 0% 0% 0%
HDD 1% 1% 1%
7% 6% 5%
Table 6 shows the 2002 VMT, fuel consumption, and fuel economy for the four time periods.
23
Table 6: 2002 Fuel Consumption and Fuel Economy for the four time periods
AM MD PM OV
VMT (miles) 21,489,238.20 27,320,020.70 27,624,353.50 11,262,093.20
Gas (gallons) 984,162.20 1,236,008.84 1,276,422.36 509,854.31
Diesel (gallons) 184,893.49 399,931.36 220,789.10 112,245.04
Total Fuel (gallons) 1,169,055.68 1,635,940.20 1,497,211.45 622,099.35
Fuel Economy (miles/gallon) 18.38 16.70 18.45 18.10
Figure 2: 2002 Daily Fuel Consumption by Time Period Fuel Consumption by Time Period AM MD PM OV
13%
24%
30%
33%
Figure 2 shows that for 2002 the midday period is the period with the largest fuel consumption although table 6 shows that the period with the largest VMT is the afternoon period. This is due to the fact that 2002 shows only a slight difference in VMT regarding the afternoon and midday periods and also to the fact that the midday period is the one with worse fuel economy because of the higher percentages of HDD vehicles on the road since the midday period is the one with the largest diesel consumption.
24
b) VMT & Fuel Consumption by Roadway Type Table 7 shows the daily VMT, gasoline and diesel fuel consumption, and the fuel economy according to road type for 2002. Table 7: 2002 Daily Fuel Consumption and Fuel Economy according to Road Type ROADWAY TYPE URBAN INTERSTATE (Fr)* URBAN OTHER FREEWAY (Fr) TOLL ROADS (Fr) RAMPS (FWY/TOLL/FRNT) (Fr) URBAN PRIN. ART. (Ar)* URBAN OTHER ART. (Ar) URBAN COLLECTOR (Ar) LOCAL (CENT. CONN.) (Co)* RURAL INTERSTATE (Fr) RURAL OTHER FREEWAY (Fr) RURAL PRIN. ART. (Ar) RURAL OTHER ART. (Ar) RURAL MAJOR COL. (Co) RURAL COLLECTOR (Co) LOCAL (INTRAZONAL) (Co) Total
VMT (miles) 7,719,038.90
Gas (gallons) 349,314.56
Diesel (gallons) 77,690.01
Total Fuel (gallons) 427,004.57
Fuel Economy (miles/gallon) 17.96303871
2,777,647.20 4,325,418.20
125,739.67 196,000.30
27,732.20 41,623.29
153,471.87 237,623.60
17.962981 17.96301658
535,489.20 2,815,961.20 4,632,839.40 354,676.10
24,332.93 128,660.71 211,707.68 16,592.33
5,687.42 30,625.74 50,059.99 4,076.74
30,020.36 159,286.45 261,767.67 20,669.07
18.0088374 17.83772653 17.83783925 17.5743442
6,975,113.70 17,247,945.90
329,406.98 780,810.25
79,945.79 171,264.80
409,352.77 952,075.05
17.44176307 17.96302367
4,336,952.20 9,582,001.30 24,196,120.50 1,303,055.60 636,900.00
196,402.75 437,858.64 1,105,879.77 61,540.90 30,080.25
42,710.85 102,938.19 258,548.79 14,821.91 7,208.35
239,113.60 540,796.83 1,364,428.56 76,362.81 37,288.60
17.96306408 17.83782285 17.83784299 17.44173532 17.44167915
256,546.00 87,695,705
12,119.97 4,006,448
2,924.91 917,859
15,044.88 4,924,307
17.44166962 17.80874163
*Where Fr, Ar and Co means freeway, arterial, and collector respectively. Table 8: 2002 Daily Fuel Consumption and Fuel Economy for each of the aggregated Road way types Freeway Arterial Collector
VMT (miles) 36,942,491.60 41,581,598.50 9,171,615.30
Gas (gallons) 1,672,600.47 1,900,699.13 433,148.10
Diesel (gallons) 366,708.57 446,249.45 104,900.95
Total Fuel (gallons) 2,039,309.04 2,346,948.58 538,049.05
Fuel Economy (miles/gallon) 17.96 17.84 17.44
Table 8 shows that for 2002 gasoline consumption is more than 4x diesel consumption for freeways, arterials and collectors. This agrees with the fact that from 2002 to 2007 has been an increase in HDD on collectors (see Tables 2-5).
25
Figure 3: 2002 Daily Fuel Consumption by Roadway Type Fuel Consumption by Roadway Type Freeway Arterial Collector
11% 41%
48%
Figure 3 shows that the percentage of daily fuel consumption for the aggregated roadway types increased in freeways by 3% while it decreased in arterials by 3% from 2002 to 2007. This is mainly because the VMT has increased on freeways by 18% from 2002 to 2007, while the VMT on arterials has increased only by 4%.
c) VMT & Fuel Consumption by Vehicle Type Table 9 shows the daily vehicle miles travel, fuel consumption, and daily fuel economy for each of the 28 vehicles classes for 2002. Table 10 shows this information in an aggregated format, where the vehicle types have been aggregated into light duty gas (LDG), heavy duty gas (HDG), light duty diesel (LDD), and heavy duty diesel (HDD) vehicles.
26
Table 9: 2002 Daily Fuel consumption for each of the 28 EPA’s vehicle classifications Vehicle Class LDGV LDGT1 LDGT2 LDGT3 LDGT4 HDGV2b HDGV3 HDGV4 HDGV5 HDGV6 HDGV7 HDGV8a HDGV8b LDDV LDDT12 HDDV2b HDDV3 HDDV4 HDDV5 HDDV6 HDDV7 HDDV8a HDDV8b MC HDGB HDDBT HDDBS LDDT34
VMT (miles) 52690614 4969492.1 16543970.8 3655139.4 1680898.6 776490.6 290249 140637.3 50869.2 134190.2 47188 47188 5898.8 86945.3 14331.2 824188.5 397272 240141.4 157130.9 498071.9 302400.3 545506 3114632.7 87620.9 49252.5 94654.7 147761.6 102972.5 87,695,708
Gas (gallons) 2272124.626 271812.867 904894.2753 259898.4184 119520.2585 80973.96961 32657.36264 15980.44847 6654.321904 17529.94336 6682.430205 7063.759208 932.7035698 0 0 0 0 0 0 0 0 0 0 1800.143857 7922.171955 0 0 0 4,006,448
Diesel (gallons) 0 0 0 0 0 0 0 0 0 0 0 0 0 2778.569223 664.8133887 67365.44216 36092.2351 24691.4789 16745.76255 59917.90023 41545.16529 87534.5747 527027.1587 0 0 22848.28471 24437.4806 6210.115016 917,859
Total Fuel (gallons) 2272124.626 271812.867 904894.2753 259898.4184 119520.2585 80973.96961 32657.36264 15980.44847 6654.321904 17529.94336 6682.430205 7063.759208 932.7035698 2778.569223 664.8133887 67365.44216 36092.2351 24691.4789 16745.76255 59917.90023 41545.16529 87534.5747 527027.1587 1800.143857 7922.171955 22848.28471 24437.4806 6210.115016 4,924,307
Fuel Economy (miles/gallon) 23.19001933 18.28276989 18.28276656 14.06372314 14.06371289 9.589385376 8.887704839 8.800585305 7.644535497 7.654913497 7.06150286 6.680295663 6.324410232 31.29139245 21.55672591 12.23458904 11.00713211 9.725679087 9.383323065 8.312572672 7.278832517 6.23189182 5.909814416 48.67438768 6.217045058 4.142748622 6.046515286 16.58141592 17.80874224
Table 10: 2002 Daily Fuel Consumption by Aggregated Vehicle Classes Vehicle class LDG HDG LDD HDD
VMT (miles) 79,627,736 1,541,964 204,249 6,321,760
Gas (gallons) 3,830,051 176,397 0 0
Diesel (gallons) 0 0 9,653 908,205
Total Fuel (gallons) 3,830,051 176,397 9,653 908,205
Fuel Economy (miles/gallon) 21 9 23 8
27
From Table 10 and Figure 5 we can observe that the LDG and HDD increased by 1%, while the HDG decreased by 2% from 2002 to 2007. Figure 5: 2002 Daily Fuel Consumption by Vehicle Type Fuel Consumption by Vehicle Type LDG HDG LDD HDD
18% 0% 4%
78%
Conclusions - 2002 • The overall fuel economy improved from 2002 to 2007 by 1.1% due to fleet turn over and an increased in number of LDG vehicles of 1%. • The VMT increased by 10% between 2002 and 2007, which shows an increment of 2% per year. • The total daily fuel consumption increased by 9% from 2002 to 2007 due to the increased in VMT since the increase in fuel economy is almost negligible. • The plots for hourly VMT and fuel economy follow the same pattern as for 2007. • The percentage of fuel consumption by vehicle type has increased for LDG and HDD by 1% and decreased for HDG by 2% from 2002 to 2007.
28
Results and Discussion – Future Year 2009 For this study it was used the 2006 Harris county registration distribution provided by TxDOT, the2009 VMT mix data provided by TTI, 2009 diesel fractions provided by TTI, MOBILE6.2 default miles per gallon data from EPA, and the 2009 vehicle miles traveled per hour per roadway type per vehicle type (output from IMPSUM62 program) provided by H-GAC. a) VMT & Fuel Consumption by Time Period Table 1: 2009 Hourly and Daily Total VMT, Fuel Consumption and Fuel Economy Hour 12:00 AM 1:00 AM 2:00 AM 3:00 AM 4:00 AM 5:00 AM 6:00 AM 7:00 AM 8:00 AM 9:00 AM 10:00 AM 11:00 AM 12:00 PM 1:00 PM 2:00 PM 3:00 PM 4:00 PM 5:00 PM 6:00 PM 7:00 PM 8:00 PM 9:00 PM 10:00 PM 11:00 PM Total
VMT (miles) 700,571.30 464,371.10 426,703.10 405,501.20 687,743.80 2,158,076.20 7,600,723.10 8,943,523.00 7,384,336.50 4,697,752.60 4,563,338.30 4,791,915.90 4,967,437.80 5,101,408.40 5,452,216.30 8,306,698.40 9,216,402.40 9,842,268.90 7,932,716.20 3,534,212.90 2,774,935.40 2,377,492.60 1,841,654.80 1,244,917.70 105,416,918
Gas (gallons) 31,402.50 20,814.90 19,126.60 18,176.23 30,827.50 96,733.72 345,413.16 406,436.32 335,579.47 208,240.47 202,282.19 212,414.44 220,195.01 226,133.56 241,684.04 379,458.63 421,014.92 449,605.06 362,374.66 158,417.81 124,383.91 106,568.94 82,550.47 55,802.32 4,755,637
Diesel (gallons) 7,185.70 4,763.03 4,376.54 4,159.21 7,054.30 22,135.23 67,008.00 78,846.20 65,100.26 67,568.15 65,634.89 68,922.60 71,447.04 73,373.87 78,419.65 66,564.89 73,854.74 78,870.17 63,568.00 36,250.32 28,462.45 24,385.96 18,889.80 12,769.05 1,089,610
Total Fuel (gallons) 38,588.20 25,577.93 23,503.15 22,335.44 37,881.80 118,868.95 412,421.16 485,282.52 400,679.72 275,808.62 267,917.08 281,337.05 291,642.05 299,507.43 320,103.69 446,023.53 494,869.66 528,475.22 425,942.66 194,668.13 152,846.36 130,954.89 101,440.27 68,571.37 5,845,247
Fuel Economy (miles/gallon) 18.1550652 18.15514466 18.15514681 18.155057 18.15499233 18.15508824 18.42951771 18.42951814 18.42952382 17.03265325 17.03265159 17.03265166 17.03265313 17.03266051 17.03265673 18.62390195 18.6238986 18.62389844 18.62390627 18.15506646 18.15506361 18.15504984 18.15506685 18.15506594 18.03
From Table 1 we can observe that fuel economy has improved by 0.17% from 2007 to 2009 due to fleet turn over since the VMT mix patterns are about the same between 2007 and 2009 (see Tables 2-5).
29
Figure 1: 2009 Hourly VMT and Fuel Economy Total VMT
By Hour of the Day 12,000,000.00
19
10,000,000.00
18.5
8,000,000.00
18
6,000,000.00
17.5
4,000,000.00
17
2,000,000.00
16.5
11:00 PM
9:00 PM
10:00 PM
8:00 PM
7:00 PM
6:00 PM
5:00 PM
4:00 PM
3:00 PM
2:00 PM
1:00 PM
12:00 PM
11:00 AM
9:00 AM
10:00 AM
8:00 AM
7:00 AM
6:00 AM
5:00 AM
4:00 AM
3:00 AM
2:00 AM
1:00 AM
16 12:00 AM
0.00
Average Fuel Economy
Vehicle Miles Traveled
Average Fuel Economy
Hour of the Day
Figure 1 shows the same trend for 2009 as for 2007. Comparing VMT mix (tables 2-5) for 2009 with the ones for 2007, we observed that the VMT has the same percentages of vehicles categories on the same facilities types since they are only two years apart, and as a consequence the same analysis applies.
Table 2: 2009 VMT Percentages for the morning period Freeways arterials collectors
LDG 94% 92% 86%
LDD
HDG 0% 0% 0%
HDD 1% 1% 2%
5% 6% 12%
Table 3: 2009 VMT Percentages for the midday period Freeways arterials collectors
LDG 89% 87% 83%
LDD
HDG 0% 0% 0%
HDD 1% 2% 3%
9% 11% 15%
30
Table 4: 2009 VMT Percentages for the afternoon period Freeways arterials collectors
LDG 94% 93% 90%
LDD
HDG 0% 0% 0%
HDD 1% 1% 2%
5% 6% 9%
Table 5: 2009 VMT Percentages for the overnight period Freeways arterials collectors
LDG 92% 93% 90%
LDD
HDG 0% 0% 0%
HDD 1% 1% 1%
7% 6% 9%
Table 6: 2009 Fuel Consumption and Fuel Economy for the four time periods VMT (miles) 23,928,582.60 29,574,069.30 35,298,085.90 16,616,180.10
AM MD PM OV
Gas (gallons) 1,087,428.95 1,310,949.72 1,612,453.27 744,804.91
Diesel (gallons) 210,954.45 425,366.19 282,857.81 170,431.58
Total Fuel (gallons) 1,298,383.40 1,736,315.92 1,895,311.07 915,236.49
Fuel Economy (miles/gallon) 18.43 17.03 18.62 18.16
Figure 2 shows the percentage of fuel consumption by time period for the year 2009 which shows the same distribution as 2007. Figure 2: 2009 Daily Fuel Consumption by Time Period Fuel Consumption by Time Period AM MD PM OV
16%
22%
32% 30%
31
b) VMT & Fuel Consumption by Roadway Type for future year 2009 Table 7: 2009 Daily Fuel Consumption and Fuel Economy according to Road Type from Diesel ROADWAY TYPE VMT Gas (gallons) (gallons) 10,977,038.20 493,036.65 103,677.04 URBAN INTERSTATE (Fr)* URBAN OTHER FREEWAY 4,749,862.40 213,566.40 44,028.31 (Fr) 7,106,732.00 319,640.56 65,433.73 TOLL ROADS (Fr) RAMPS (FWY/TOLL/FRNT 636,178.70 28,651.83 6,499.22 (Fr) 3,291,553.90 148,880.41 33,890.69 URBAN PRIN. ART. (Ar)* 7,324,633.10 331,349.81 75,058.04 URBAN OTHER ART. (Ar) 476,817.80 21,394.51 7,043.95 URBAN COLLECTOR (Ar) LOCAL (CENT. CONN.) 8,166,965.80 370,058.59 121,728.05 (Co)* 19,824,388.20 890,921.89 184,996.42 RURAL INTERSTATE (Fr) RURAL OTHER FREEWAY 3,853,112.10 173,219.74 35,793.32 (Fr) 10,457,852.70 472,979.19 107,465.12 RURAL PRIN. ART. (Ar) 25,902,235.10 1,171,834.75 264,747.64 RURAL OTHER ART. (Ar) 1,525,004.40 69,122.32 22,615.05 RURAL MAJOR COL. (Co) 842,609.10 38,204.03 12,437.26 RURAL COLLECTOR (Co) 281,934.70 12,776.18 4,196.20 LOCAL (INTRAZONAL) (Co) 105,416,918 4,755,637 1,089,610 Total
Total Fuel (gallons) 596,713.68
Fuel Economy (miles/gallon) 18.39582112
257,594.71
18.43928567
385,074.29
18.45548306
35,151.05
18.09842728
182,771.10 406,407.85 28,438.46
18.00916001 18.02286325 16.76665513
491,786.65
16.60672543
1,075,918.31
18.42555146
209,013.07
18.43479034
580,444.31 1,436,582.39 91,737.37 50,641.28 16,972.38 5,845,247
18.01697868 18.03045568 16.62359014 16.63877878 16.61138274 18.03463914
*Where Fr, Ar and Co means freeway, arterial, and collector respectively. Table 8 shows the daily fuel consumption after the road types have been aggregated into freeway, arterial and collector. Like for 2007, gasoline consumption on freeways and arterials is more than 4x that of diesel consumption, and for collectors is about 3x, which is consistent with the fact that there is a higher proportion of HDD traffic on collectors than other road types. Table 8: 2009 Daily Fuel Consumption and Fuel Economy for each of the aggregated roadway types- 2009
Freeway Arterial Collector
VMT (miles) 47,147,311.60 47,453,092.60 10,816,514.00
Gas (gallons) 2,119,037.06 2,146,438.66 490,161.12
Diesel (gallons) 440,428.05 488,205.43 160,976.56
Total Fuel (gallons) 2,559,465.11 2,634,644.10 651,137.68
Fuel Economy (miles/gallon) 18.42 18.01 16.61
32
Figure 3 shows the percentage of daily fuel consumption for the aggregated road types, which is the same as for 2007. Figure 3: 2009 Daily Fuel Consumption by Roadway Type Fuel Consumption by Roadway Type Freeway Arterial Collector
11%
44%
45%
Figure 4 shows the daily VMT and average fuel economy by roadway type for 2009, which has the same pattern as for 2007 for the same reasons mentioned above. Figure 4: 2009 Daily VMT and Fuel Economy by Roadway Type Daily Total VMT
By Roadway Type
Daily Average Fuel Economy
50,000,000.00
19.00
45,000,000.00 Vehicle Miles Traveled
18.00
35,000,000.00 30,000,000.00
17.50
25,000,000.00 17.00
20,000,000.00 15,000,000.00
16.50
Average Fuel Economy
18.50 40,000,000.00
10,000,000.00 16.00
5,000,000.00 0.00
15.50 Freeway
Arterial
Collector
Roadway Type
33
c) VMT & Fuel Consumption by Vehicle Type Table 9 shows the daily vehicle miles travel, fuel consumption, and daily fuel economy for each of the 28 vehicles classes for 2009. Table 10 shows this information in an aggregated format, where the vehicle types have been aggregated into light duty gas (LDG), heavy duty gas (HDG), light duty diesel (LDD), and heavy duty diesel (HDD) vehicles. Table 9: 2009 Daily Fuel consumption for each of the 28 EPA’s vehicle classifications Vehicle Class LDGV LDGT1 LDGT2 LDGT3 LDGT4 HDGV2b HDGV3 HDGV4 HDGV5 HDGV6 HDGV7 HDGV8a HDGV8b LDDV LDDT12 HDDV2b HDDV3 HDDV4 HDDV5 HDDV6 HDDV7 HDDV8a HDDV8b MC HDGB HDDBT HDDBS LDDT34 Total
VMT (miles) 63302439.3 5606706.7 18664801.6 5704894.4 2623478.6 715529.9 250816.7 99309.2 35647.4 96763.9 31829.6 36922.8 6364.6 58014.5 894.6 1527377.3 436935.9 262162.8 186171.6 558519 273560.2 554717.2 3780828.4 105416.8 25856.4 121413.7 228077 121466 105,416,916
Gas (gallons) 2685278.829 307443.2839 1023482.876 407200.9884 187257.2607 72704.57834 27494.51615 10946.14546 4572.735465 12252.21056 4396.042716 5377.154781 971.4608204 0 0 0 0 0 0 0 0 0 0 2153.357823 4105.405522 0 0 0 4,755,637
Diesel (gallons) 0 0 0 0 0 0 0 0 0 0 0 0 0 1830.686976 41.26882269 121405.8185 38602.81722 26420.18106 19386.25304 65902.4809 37233.70716 86684.01444 618529.7508 0 0 28611.44261 37669.75004 7291.864427 1,089,610
Total Fuel (gallons) 2685278.829 307443.2839 1023482.876 407200.9884 187257.2607 72704.57834 27494.51615 10946.14546 4572.735465 12252.21056 4396.042716 5377.154781 971.4608204 1830.686976 41.26882269 121405.8185 38602.81722 26420.18106 19386.25304 65902.4809 37233.70716 86684.01444 618529.7508 2153.357823 4105.405522 28611.44261 37669.75004 7291.864427 5,845,247
Fuel Economy (miles/gallon) 23.57387941 18.23655612 18.23655484 14.010021 14.01002338 9.841607177 9.1224264 9.072526977 7.795640109 7.897668714 7.240511991 6.866605389 6.551576622 31.69001623 21.67738117 12.58075864 11.3187568 9.922823747 9.603279169 8.474931328 7.347111553 6.39930215 6.11260557 48.95461352 6.298135437 4.243536464 6.054645963 16.6577425 18.03
Table 10: 2009 Daily Fuel Consumption by Aggregated Vehicle Classes Vehicle Class LDG HDG LDD HDD
VMT (miles)
Gas (gallons)
Diesel (gallons)
Total Fuel (gallons)
Fuel Economy (miles/gallon)
96,007,737 1,299,041 180,375 7,929,763
4,612,817 142,820 0 0
0 0 9,164 1,080,446
4,612,817 142,820 9,164 1,080,446
21 9 20 7
34
Figure 5 shows the percentage of daily fuel consumption according to the aggregated vehicle types for 2009, with the only difference with 2007 results are the 1% increase in LDG traffic and a 1% decrease in HDD traffic on 2009. Figure 5: 2009 Daily Fuel Consumption by Vehicle Type Fuel Consumption by Vehicle Type LDG HDG LDD HDD
18% 0% 2%
80%
Conclusions - 2009 • • • • • •
The overall fuel economy has improved by 0.17% between 2007 and 2009 due to the fleet turn over and the increased by 1 % of LDG and the decreased by 1% of HDD vehicles. The VMT has increased by 9.1% between 2007 and 2009, which shows an increment of 4.5% per year due mainly to the opening of a major facility like Interstate-10. The total daily fuel consumption increased by 8.9% due to the increased in VMT since the increase in fuel economy is almost negligible. The plots for hourly VMT and fuel economy follow the same pattern as for 2007. The plots for fuel consumption by roadway type follow the same pattern as for 2007. The percentage of fuel consumption by vehicle type has increased for LDG by 1% and decreased for HDD by 1% from 2007 to 2009.
35
Further Conclusions and Recommendations The study shows that the effect of fleet turn over is almost negligible due to the fact that the CAFÉ (Corporate Average Fuel Economy) standards have not changed for about 20 years. Between the years 2002 and 2007 the VMT and fuel consumption increased at an average of 2% per year, while between 2007 and 2009 the increase is about 4.5% per year, which gives a total average increase in VMT and fuel consumption of about 3% per year. Due to these facts, and in order to decrease the fuel consumption, we recommend accelerating the implementation of new CAFÉ standards by 2010 instead of 2020 and making them at least 40 mpg based on different sources of information like1: •
The Union of Concerned Scientists, in Washington, DC, projects that the savings that will bring the new CAFÉ standard will be largely negated in 2020 by increased driving.
•
Reports by the U.S. National Academy of Sciences2, think tanks, and activists show that a combination of existing efficiency options, such as continuously variable transmissions and better tires, can cheaply and easily deliver a 35-miles-per-gallon fleet. (See "Why Not a 40-MPG SUV?")3
•
Europe currently requires 40 miles per gallon average fuel economy and will soon push up to 49 miles per gallon, while Japan is expected to reach 47 miles per gallon in its 2015 standard.
•
California officials estimated that the state standard would yield 35 miles per gallon from new cars by about 2016--four years ahead of CAFE.4
Other recommendations are an aggressive implementation of transit, hybrid vehicles, commute solution programs, and moving more freight by rail to replace trucks when possible throughout our region.
References 1. 2. 3. 4.
http://www.technologyreview.com/Energy/20067 http://www.nap.edu/catalog.php?record_id=10172 http://www.technologyreview.com/Energy/12989/ http://www.arb.ca.gov/cc/ccms/ab1493_v_cafe_study.pdf
36
Appendix A Glossary
Roadway Functional Classification Definition Urban Interstate: The urban section of a freeway that crosses state lines. Urban Other Freeway: The urban section of a freeway. Toll Roads: A high-speed road for which a driver pays a fee for use. Ramps: A road junction that typically utilizes grade separation, and one or more roads, to permit traffic on at least one road to pass through the junction without crossing any other traffic stream. It differs from an intersection, at which roads cross at grade. Interchanges are almost always used when at least one of the roads is a freeway, though they may occasionally be used at junctions between two surface streets. Urban Principal Arterial: The urban principal arterial system carries most of the trips entering and leaving the urban area, as well as most of the through movements bypassing the central city. In addition, this class of facility serves significant intra-area travel, such as between central business districts and outlying residential areas, between major inner-city communities, and between major suburban centers. Urban Other Arterial: The minor arterial street system interconnects with and augments the urban principal arterial system. It accommodates trips of moderate length at a somewhat lower level of travel mobility than principal arterials do. This system distributes travel to geographic areas smaller than those identified with the higher system. The minor arterial street system includes all arterials not classified as principal. Urban Collector: The collector street system provides both land access service and traffic circulation within residential neighborhoods and commercial and industrial areas. It differs from the arterial system in that it distributes trips from the arterials through the area to their ultimate destinations. Conversely, the collector street also collects traffic from local streets in neighborhoods and channels it into the arterial system. Local-Centroid Connector: This classification represents pseudo links that load the traffic from a traffic analysis zone (TAZ) to the network. Rural Interstate: The rural section of a freeway that crosses state lines. Rural Other Freeway: The rural section of a freeway. Rural Principal Arterial: 1. Corridor movement with trip length and density suitable for substantial statewide or interstate travel. 2. Movements between all, or virtually all, urban areas with populations over 50,000. 3. Integrated movements without stub connections except where unusual geographic or traffic flow conditions dictate otherwise (e.g., connections to coastal cities).
38
Rural Other Arterial: 1. Linkage of cities, larger towns, and other traffic generators that are capable of attracting travel over similarly long distances. 2. Integrated interstate and inter county service. 3. Internal spacing consistent with inter-county service. 4. Corridor movements consistent with items (1) through (3) with trip lengths and travel densities greater than those predominantly served by rural collector or local systems. Rural Major Collector: 1. Serve county seats not on arterial routes, larger towns not directly served by the higher systems, and other traffic generators of equivalent intra-county importance, such as consolidated schools, county parks, etc. 2. Link these places with nearby larger towns or cities, or with routes of higher classification. 3. Serve the more important intra-county travel corridors. Rural Collector: 1. Spaced at intervals consistent with population density to accumulate traffic from local roads and bring all developed areas within reasonable distance of collector roads. 2. Provide service to the remaining smaller communities. Local-Intrazonal: This classification represents VMT for the trips made inside a traffic analysis zone (TAZ). IMPSUM62 The IMPSUM62 program applies the emissions factors obtained from POLFAC62_3 (or from one of the RATEADJ programs, when used) and VMT mixes (fractions of fleet VMT attributable to each vehicle classification in the study) to the time-of-day fleet VMT and speed estimates to calculate emissions by the specified time periods. The five primary inputs to IMPSUM62 are: • •
• • •
MOBILE6 emissions factors developed with POLFAC62_3 (or a RATEADJ, if used); Link-based hourly VMT and speeds developed using the TRANSVMTHSPDWKD or TRANSVMTHSPDWKE program. For each link, the following information is input to IMPSUM62: county number, roadway type number, VMT on link, operational link-speed estimate, and link distance; VMT mix by time period, county, and roadway type; X-Y coordinates (optional for gridded emissions); and Data records associating the MOBILE6 drive cycle (Freeway, Arterial, Local, and Ramp) emissions factors (or percentages thereof) to specific travel model functional classifications. These MOBILE6 drive cycle emissions factor percentages (valid from zero to 100) must sum to 100 percent for each travel model functional classification.
Using these input data, the VMT for each link is stratified by MOBILE6 drive cycle and the 28 vehicle types. The MOBILE6 emissions factors are matched to link VMT by drive cycle, speed, and vehicle type and are interpolated (for the speed that falls between the 14 MOBILE6 speeds, see the MOBILE6 interpolation methodology below) and multiplied by the link VMT to estimate the mobile source emissions for that link. Emissions factors for 65 mph are used for links with speeds greater than 65 mph, and emissions factors for 2.5 mph are used for links with speeds lower than 2.5 mph. The emissions for the county and emissions type are reported by both roadway type and vehicle type for each of the subject time periods. A data set is produced for
39
subsequent input to the SUMALL62 program. Also, link emissions may be written by county at the pollutant-specific emissions type sub-component level and 28 vehicle types level. A tab delimited output is optionally produced. This output includes all 28 vehicle types (or eight vehicle types in the compressed format) across a single output line. Each field in the output is separated by a tab character. TRANSVMTHSPDWKD The TRANSVMTHSPDWKD program is a TRANSCAD-based utility that post-process TDMs to produce time-of-day specific, on-road vehicle, link VMT and speed estimates. The TRANSVMTHSPDWKD program processes a TDM traffic assignment consisting of four timeof-day assignments by scaling the link volumes by the appropriate HPMS, seasonal, or other VMT factors. Time-of-day factors are then applied to distribute the link VMT to each hour in the day. The Houston speed model is used to estimate the operational time-of-day speeds for each link (or by direction if the assignment is not directional). Since intrazonal links are not included in the TDMs, special intrazonal links are created and the VMT specifically designed for estimating VMT and speeds for weekdays (day types weekdays and Friday). The link VMT and speeds produced by these programs are subsequently input to the IMPSUM62 program for the application of MOBILE6 emission factors. Registration Distribution As with VMT fractions, MOBILE6 allows the entry of registration distributions for 16 vehicle classes, which combine the gasoline and diesel categories. MOBILE6 requires that all entries of registration distributions by vehicle class be in terms of the combined gasoline- and diesel-fuel categories. Diesel Fractions Diesel fractions allow to perform separate calculations for gas and diesel subcategories, which have distinctly different emission rates. Urban/transit buses are assumed to be all diesel-fueled, and motorcycles are assumed to be all gasoline-fueled, so these two categories do not require a diesel fraction. That leaves 14 composite vehicle categories for which users can specify a diesel fraction. The diesel fraction represents the percent of diesels in a composite vehicle category for any vehicle age. VMT Mix The VMT mix specifies the fraction of total highway VMT that is accumulated by each of the 16 composite vehicle types. Each VMT mix supplied as input must consist of a set of 16 fractional values, representing the fraction of total highway VMT accumulated by each of 16 combined vehicle types. All values must be between 0 and 1, and the 16 values must add up to 1.0. MPG Data The EPA mpg data from MOBILE6 was used in this study. This is fuel economy performance data by vehicle class and model year. The first number is a value from 1 thru 28 indicating the MOBILE6 vehicle class to which the record applies. Values 2 thru 100 specify the fuel economy performance of that vehicle class for model years 1952 thru 2050. (The 1952 value is used for model years prior to 1952.)
40
Road Link definition The road network consist of several road segments which are called road links. These must be described with identification numbers, coordinates and name, also defined as the distance between two road nodes.
41
Appendix B Input data
2006 Harris County Registration Distribution REG DIST * Harris County * Vehicle Age Distributions Calculated from Mid-Year (July) 2006 Registrations data * LDV, LDT, MC: based on Harris County data only * HDV: based on 8-county nonattainment area aggregate data (Brazoria, Chambers, Fort Bend, Galveston, Harris, Liberty, Montgomery, Waller) * LDV 1 0.07049 0.07996 0.06939 0.07028 0.07488 0.07479 0.07792 0.06771 0.06274 0.05804 0.04959 0.05006 0.03849 0.03331 0.02679 0.02236 0.01777 0.01268 0.00904 0.00629 0.00487 0.00428 0.00317 0.00201 0.01309 * LDT1 2 0.04938 0.06122 0.06287 0.07629 0.09132 0.08155 0.07379 0.06754 0.06573 0.06539 0.04459 0.04663 0.04182 0.03061 0.02336 0.01911 0.01646 0.01538 0.01173 0.00783 0.00770 0.00684 0.00614 0.00356 0.02316 * LDT2 3 0.04938 0.06122 0.06287 0.07629 0.09132 0.08155 0.07379 0.06754 0.06573 0.06539 0.04459 0.04663 0.04182 0.03061 0.02336 0.01911 0.01646 0.01538 0.01173 0.00783 0.00770 0.00684 0.00614 0.00356 0.02316 * LDT3 4 0.08747 0.11021 0.14584 0.12852 0.10288 0.09459 0.06374 0.07262 0.03007 0.03962 0.02588 0.02538 0.01522 0.01264 0.00913 0.00646 0.00528 0.00459 0.00332 0.00167 0.00214 0.00239 0.00199 0.00124 0.00711 * LDT4 5 0.08747 0.11021 0.14584 0.12852 0.10288 0.09459 0.06374 0.07262 0.03007 0.03962 0.02588 0.02538 0.01522 0.01264 0.00913 0.00646 0.00528 0.00459 0.00332 0.00167 0.00214 0.00239 0.00199 0.00124 0.00711 * HDV2b 6 0.13963 0.19440 0.11952 0.10407 0.08217 0.07976 0.06253 0.04866 0.02384 0.02949 0.01643 0.02006 0.01241 0.01110 0.00890 0.00750 0.00625 0.00497 0.00396 0.00250 0.00405 0.00274 0.00262 0.00167 0.01077 * HDV3 7 0.08955 0.07921 0.07339 0.06345 0.06455 0.08724 0.09587 0.09677 0.03072 0.05973 0.03042 0.05411 0.03745 0.02650 0.01948 0.01646 0.01827 0.01295 0.00994 0.00432 0.00432 0.00532 0.00321 0.00151 0.01526 * HDV4 8 0.08873 0.06957 0.07457 0.07165 0.07769 0.07998 0.11040 0.09623 0.04062 0.06457 0.05520 0.04582 0.02749 0.01812 0.01375 0.01104 0.01146 0.00958 0.00750 0.00375 0.00312 0.00104 0.00354 0.00062 0.01396 * HDV5 9 0.10982 0.11643 0.08336 0.07410 0.07608 0.08568 0.09196 0.10718 0.02812 0.02713 0.01720 0.02547 0.01489 0.01125 0.01886 0.01356 0.01323 0.01059 0.01323 0.00860 0.00728 0.00430 0.00761 0.00364 0.03043 * HDV6 10 0.07729 0.07740 0.06242 0.04318 0.04340 0.07562 0.09720 0.09642 0.07931 0.04172 0.03837 0.05280 0.02617 0.02998 0.01868 0.02394 0.02450 0.01465 0.01342 0.00962 0.00951 0.00783 0.00805 0.00492 0.02360 * HDV7 11 0.04309 0.05354 0.04779 0.05981 0.05171 0.06581 0.08984 0.09482 0.05746 0.06268 0.05876 0.06581 0.03656 0.03238 0.02873 0.03291 0.02847 0.01541 0.01201 0.01149 0.00783 0.00731 0.00862 0.00418 0.02298 * HDV8a 12 0.03568 0.03477 0.02640 0.03124 0.03058 0.03738 0.05359 0.05241 0.05045 0.03751 0.04797 0.07738 0.06431 0.05921 0.04483 0.04836 0.04274 0.04692 0.04143 0.02758 0.01856 0.01934 0.01699 0.00431 0.05006 * HDV8b 13 0.16445 0.10361 0.07700 0.05371 0.03470 0.07224 0.06844 0.09601 0.04515 0.03660 0.03184 0.05133 0.04183 0.01901 0.01046 0.01949 0.01616 0.02614 0.00903 0.00760 0.00380 0.00190 0.00190 0.00000 0.00760 * HDBS is MOBILE6 default * HDBT is MOBILE6 default * MC 16 0.12189 0.13076 0.09300 0.11321 0.09607 0.07752 0.06055 0.04912 0.03603 0.02614 0.02587 0.02146 0.01707 0.01418 0.00868 0.00678 0.00651 0.00632 0.00649 0.00552 0.00945 0.00820 0.00625 0.00596 0.04697
2002 Harris County Registration Distribution REG DIST * Harris County * LDV, LDT, and MC are county level; HDV (except bus) are HGB 8-county area level * Calculated from Mid-Year (July) 2002 Registration data (from TTI) * LDV 1 0.07627 0.09319 0.09265 0.08016 0.07495 0.07056 0.06405 0.06924 0.05598 0.05293 0.04619 0.04286 0.03761 0.03116 0.02468 0.01822 0.01479 0.01283 0.00962 0.00557 0.00414 0.00301 0.00224 0.00283 0.01426 * LDT1 2 0.08992 0.09874 0.08913 0.07863 0.07599 0.07446 0.05400 0.06141 0.06026 0.04917 0.04024 0.03446 0.02894 0.02839 0.02315 0.01653 0.01649 0.01535 0.01317 0.00749 0.00886 0.00667 0.00338 0.00457 0.02062 * LDT2 3 0.08992 0.09874 0.08913 0.07863 0.07599 0.07446 0.05400 0.06141 0.06026 0.04917 0.04024 0.03446 0.02894 0.02839 0.02315 0.01653 0.01649 0.01535 0.01317 0.00749 0.00886 0.00667 0.00338 0.00457 0.02062 * LDT3 4 0.14705 0.18228 0.12654 0.14564 0.05791 0.07428 0.04776 0.04732 0.02870 0.02556 0.01903 0.01517 0.01247 0.01181 0.00922 0.00512 0.00687 0.00692 0.00667 0.00370 0.00445 0.00225 0.00184 0.00314 0.00831 * LDT4 5 0.14705 0.18228 0.12654 0.14564 0.05791 0.07428 0.04776 0.04732 0.02870 0.02556 0.01903 0.01517 0.01247 0.01181 0.00922 0.00512 0.00687 0.00692 0.00667 0.00370 0.00445 0.00225 0.00184 0.00314 0.00831 * HDV2b 6 0.12549 0.14885 0.14233 0.12668 0.08635 0.05306 0.07035 0.03391 0.04193 0.02309 0.02385 0.01715 0.01441 0.01259 0.01113 0.01082 0.00656 0.00771 0.00700 0.00749 0.00359 0.00660 0.00448 0.00310 0.01148 * HDV3 7 0.04688 0.07526 0.10778 0.11846 0.12478 0.03849 0.07928 0.04102 0.07687 0.06182 0.04171 0.03194 0.02631 0.02792 0.01999 0.01666 0.00770 0.00804 0.00965 0.00609 0.00264 0.00437 0.00345 0.00218 0.02068 * HDV4 8 0.06016 0.09553 0.10019 0.14277 0.12434 0.04914 0.08685 0.06397 0.07626 0.03919 0.02881 0.02288 0.01758 0.01695 0.01440 0.00932 0.00551 0.00360 0.00424 0.00466 0.00212 0.00424 0.00339 0.00191 0.02203 * HDV5 9 0.06186 0.09005 0.10650 0.13665 0.15857 0.04542 0.04307 0.03054 0.04150 0.02819 0.02193 0.02467 0.02153 0.02075 0.01879 0.02193 0.01684 0.01410 0.01135 0.01175 0.00901 0.00979 0.01096 0.00783 0.03641 * HDV6 10 0.03500 0.05167 0.08642 0.10604 0.11463 0.07886 0.05334 0.04924 0.07334 0.03590 0.04334 0.02847 0.03398 0.03654 0.02500 0.02090 0.01949 0.01693 0.01641 0.01334 0.00769 0.01244 0.00962 0.00487 0.02654 *HDV7 11 0.04494 0.04805 0.06479 0.08941 0.09897 0.06933 0.06503 0.06240 0.09037 0.04279 0.03514 0.03705 0.05570 0.04375 0.02606 0.02247 0.01721 0.01387 0.01458 0.01458 0.00669 0.00693 0.00837 0.00478 0.01673 *HDV8a 12 0.02072 0.03495 0.03827 0.05153 0.04808 0.04490 0.03468 0.05001 0.07267 0.06314 0.05982 0.04615 0.05443 0.05665 0.06148 0.05057 0.03426 0.02404 0.03081 0.02445 0.00746 0.01534 0.01644 0.01603 0.04311 *HDV8b 13 0.05676 0.04757 0.08054 0.09135 0.13243 0.07351 0.06595 0.03676 0.08973 0.06595 0.05568 0.01892 0.02973 0.02649 0.05405 0.01622 0.01459 0.00865 0.00649 0.00919 0.00162 0.00378 0.00324 0.00162 0.00919 * HDBS is MOBILE6 default * HDBT is MOBILE6 default * MC 16 0.13399 0.14592 0.11404 0.09350 0.06670 0.05159 0.04948 0.04329 0.03351 0.03109 0.01874 0.01266 0.01314 0.01224 0.01245 0.01069 0.02026 0.01566 0.01279 0.01407 0.01781 0.01151 0.01117 0.00927 0.04440
44
2006 Houston-Eight-County Region Diesel sales Fraction Estimates
* Statewide Diesel Sales Fractions Estimates * HDV fractions are estimated from TxDOT registration data (Mid-year July 2006) * LDV, LDT and Bus fractions are EPA defaults * One record per vehicle type. The order of vehicle types is: LDV, LDT1, LDT2, LDT3, LDT4, HDV2B, HDV3, HDV4, HDV5, HDV6, HDV7, HDV8a, HDV8b, HDBS DIESEL FRACTIONS : 0.00090 0.00090 0.00090 0.00090 0.00090 0.00090 0.00090 0.00090 0.00090 0.00090 0.00090 0.00090 0.00060 0.00010 0.00030 0.00060 0.00130 0.00040 0.00040 0.00010 0.00270 0.00320 0.00970 0.01620 0.02410 0.00000 0.00000 0.00000 0.00000 0.00000 0.00000 0.00000 0.00000 0.00070 0.00330 0.00480 0.01200 0.02230 0.00000 0.00000 0.00000 0.00000 0.00000 0.00000 0.00000 0.00000 0.00000 0.00000 0.00000 0.00000 0.00000 0.00000 0.00000 0.00000 0.00000 0.00000 0.00000 0.00000 0.00070 0.00330 0.00480 0.01200 0.02230 0.01260 0.01260 0.01260 0.01260 0.01260 0.01260 0.01260 0.01260 0.01260 0.01260 0.01260 0.01260 0.01150 0.01110 0.01450 0.01150 0.01290 0.00960 0.00830 0.00720 0.00820 0.01240 0.01350 0.01690 0.02090 0.01260 0.01260 0.01260 0.01260 0.01260 0.01260 0.01260 0.01260 0.01260 0.01260 0.01260 0.01260 0.01150 0.01110 0.01450 0.01150 0.01290 0.00960 0.00830 0.00720 0.00820 0.01240 0.01350 0.01690 0.02090 0.76017 0.76017 0.84307 0.84251 0.78277 0.75461 0.70514 0.57915 0.62202 0.52436 0.45371 0.43381 0.20803 0.39742 0.37869 0.36273 0.36193 0.29899 0.25935 0.20173 0.17593 0.18117 0.15677 0.18774 0.15730 0.76301 0.76301 0.71128 0.68870 0.64158 0.64241 0.62779 0.64127 0.61219 0.48276 0.56004 0.52845 0.33472 0.55155 0.55776 0.60948 0.48645 0.57089 0.48730 0.37008 0.25197 0.29870 0.22917 0.22500 0.18018 0.90055 0.90055 0.81739 0.77179 0.73560 0.69790 0.69545 0.72335 0.65187 0.69828 0.74316 0.64837 0.42986 0.64665 0.65988 0.60791 0.69097 0.57237 0.64754 0.23711 0.26897 0.08734 0.11165 0.26744 0.17308 0.91101 0.91101 0.84832 0.88419 0.86117 0.88347 0.85451 0.88665 0.86334 0.68644 0.72423 0.79282 0.50188 0.65098 0.70089 0.65700 0.74336 0.61589 0.59091 0.34944 0.33962 0.23346 0.24887 0.22857 0.25000 0.89299 0.89299 0.88010 0.89139 0.89759 0.90888 0.89029 0.86180 0.82947 0.80299 0.78766 0.80240 0.61830 0.79507 0.77504 0.62887 0.68100 0.73734 0.73977 0.61833 0.69269 0.56734 0.46809 0.49421 0.46831 0.92874 0.92874 0.96480 0.95556 0.98089 0.90539 0.89625 0.90644 0.89547 0.85472 0.77535 0.83566 0.57252 0.84799 0.85854 0.87861 0.88725 0.84466 0.87390 0.81703 0.85127 0.79863 0.78596 0.70455 0.72414 0.97154 0.97154 0.96951 0.94980 0.95519 0.95373 0.94351 0.93533 0.96098 0.95342 0.91217 0.93145 0.76593 0.95473 0.94826 0.95111 0.93274 0.93902 0.94132 0.95172 0.94682 0.91259 0.92426 0.93640 0.88000 0.99331 0.99331 0.99560 0.99012 0.99614 0.98276 0.98540 0.99020 0.98204 0.97851 0.94145 0.99440 0.74603 0.97576 0.97490 0.97333 0.96000 0.92045 0.95050 0.95238 0.94231 0.95833 0.97101 0.94118 0.88889 0.95850 0.95850 0.95850 0.95850 0.95850 0.95850 0.95850 0.95850 0.95850 0.95850 0.95850 0.95850 0.88570 0.85250 0.87950 0.99000 0.91050 0.87600 0.77100 0.75020 0.73450 0.67330 0.51550 0.38450 0.32380
45
2002 Houston-Eight-County Region Diesel sales Fraction Estimates
* 2002 Statewide Diesel Sales Fractions Estimates * HDV fractions are estimated from TxDOT registration data (Mid-year July 2002) * LDV, LDT and Bus fractions are EPA defaults * One record per vehicle type. The order of vehicle types is: LDV, LDT1, LDT2, LDT3, LDT4, HDV2B, HDV3, HDV4, HDV5, HDV6, HDV7, HDV8a, HDV8b, HDBS DIESEL FRACTIONS : 0.00090 0.00090 0.00090 0.00090 0.00090 0.00090 0.00090 0.00060 0.00010 0.00030 0.00060 0.00130 0.00040 0.00040 0.00010 0.00270 0.00320 0.00970 0.01620 0.02410 0.05100 0.07060 0.03900 0.02690 0.01140 0.00000 0.00000 0.00000 0.00000 0.00000 0.00000 0.00000 0.00000 0.00000 0.00000 0.00000 0.00000 0.00000 0.00000 0.00000 0.00070 0.00330 0.00480 0.01200 0.02230 0.06560 0.06160 0.04390 0.03160 0.02590 0.00000 0.00000 0.00000 0.00000 0.00000 0.00000 0.00000 0.00000 0.00000 0.00000 0.00000 0.00000 0.00000 0.00000 0.00000 0.00070 0.00330 0.00480 0.01200 0.02230 0.06560 0.06160 0.04390 0.03160 0.02590 0.01260 0.01260 0.01260 0.01260 0.01260 0.01260 0.01260 0.01150 0.01110 0.01450 0.01150 0.01290 0.00960 0.00830 0.00720 0.00820 0.01240 0.01350 0.01690 0.02090 0.02560 0.00130 0.00060 0.00110 0.00010 0.01260 0.01260 0.01260 0.01260 0.01260 0.01260 0.01260 0.01150 0.01110 0.01450 0.01150 0.01290 0.00960 0.00830 0.00720 0.00820 0.01240 0.01350 0.01690 0.02090 0.02560 0.00130 0.00060 0.00110 0.00010 0.81361 0.75050 0.61397 0.66232 0.57703 0.47784 0.45121 0.20063 0.39808 0.37552 0.32844 0.35352 0.27226 0.22309 0.17730 0.14483 0.20196 0.17056 0.19074 0.17148 0.14044 0.00323 0.00000 0.00382 0.00303 0.68374 0.64723 0.65615 0.64013 0.51450 0.57439 0.54389 0.32661 0.55020 0.58601 0.62333 0.51890 0.51653 0.46856 0.35294 0.25512 0.29752 0.17664 0.22368 0.21759 0.16066 0.03297 0.01508 0.00373 0.00406 0.75174 0.71334 0.72152 0.63857 0.67967 0.73075 0.66667 0.44671 0.70203 0.69632 0.65581 0.65789 0.57317 0.60350 0.35745 0.24855 0.13542 0.12313 0.18852 0.13253 0.17797 0.14583 0.05000 0.03185 0.01034 0.92205 0.86775 0.89367 0.88016 0.75422 0.72991 0.80476 0.45659 0.67857 0.72535 0.65432 0.70483 0.60383 0.59509 0.41699 0.33654 0.25337 0.30960 0.25418 0.28244 0.20767 0.23790 0.14394 0.12340 0.03350 0.92645 0.87176 0.86671 0.86169 0.81933 0.74312 0.78239 0.54923 0.77170 0.75818 0.57117 0.66954 0.72241 0.69427 0.56318 0.62198 0.54717 0.46968 0.43758 0.40440 0.37461 0.43137 0.18953 0.14992 0.04644 0.93134 0.87037 0.90479 0.88593 0.84672 0.75646 0.81899 0.48829 0.82916 0.84387 0.84789 0.85788 0.83389 0.82784 0.81143 0.81176 0.78571 0.74359 0.73051 0.70909 0.63052 0.70608 0.36715 0.27615 0.20888 0.95095 0.93265 0.93355 0.94685 0.94189 0.86917 0.90694 0.67588 0.96360 0.95187 0.94895 0.93046 0.94083 0.94469 0.95000 0.94092 0.91551 0.91340 0.92834 0.91875 0.91908 0.88970 0.56726 0.56641 0.55152 0.98020 0.98603 0.99167 0.98288 0.98189 0.95390 0.99119 0.78746 0.96058 0.98670 0.96262 1.00000 0.95333 0.97500 0.95238 0.92424 0.92958 0.98969 0.95455 0.97143 0.94286 0.96296 0.40000 0.44444 0.51064 0.95850 0.95850 0.95850 0.95850 0.95850 0.95850 0.95850 0.88570 0.85250 0.87950 0.99000 0.91050 0.87600 0.77100 0.75020 0.73450 0.67330 0.51550 0.38450 0.32380 0.32600 0.26390 0.05940 0.04600 0.02910
46
2009 Houston-Eight-County Region Diesel sales Fraction Estimates
* Statewide Diesel Sales Fractions Estimates - 2009 * HDV fractions are estimated from TxDOT registration data (Mid-year July 2005) * LDV, LDT and Bus fractions are EPA defaults * One record per vehicle type. The order of vehicle types is: LDV, LDT1, LDT2, LDT3, LDT4, HDV2B, HDV3, HDV4, HDV5, HDV6, HDV7, HDV8a, HDV8b, HDBS DIESEL FRACTIONS : 0.00090 0.00090 0.00090 0.00090 0.00090 0.00090 0.00090 0.00090 0.00090 0.00090 0.00090 0.00090 0.00090 0.00090 0.00060 0.00010 0.00030 0.00060 0.00130 0.00040 0.00040 0.00010 0.00270 0.00320 0.00970 0.00000 0.00000 0.00000 0.00000 0.00000 0.00000 0.00000 0.00000 0.00000 0.00000 0.00000 0.00000 0.00000 0.00000 0.00000 0.00000 0.00000 0.00000 0.00000 0.00000 0.00000 0.00000 0.00070 0.00330 0.00480 0.00000 0.00000 0.00000 0.00000 0.00000 0.00000 0.00000 0.00000 0.00000 0.00000 0.00000 0.00000 0.00000 0.00000 0.00000 0.00000 0.00000 0.00000 0.00000 0.00000 0.00000 0.00000 0.00070 0.00330 0.00480 0.01260 0.01260 0.01260 0.01260 0.01260 0.01260 0.01260 0.01260 0.01260 0.01260 0.01260 0.01260 0.01260 0.01260 0.01150 0.01110 0.01450 0.01150 0.01290 0.00960 0.00830 0.00720 0.00820 0.01240 0.01350 0.01260 0.01260 0.01260 0.01260 0.01260 0.01260 0.01260 0.01260 0.01260 0.01260 0.01260 0.01260 0.01260 0.01260 0.01150 0.01110 0.01450 0.01150 0.01290 0.00960 0.00830 0.00720 0.00820 0.01240 0.01350 0.80727 0.80727 0.80727 0.80727 0.80727 0.85880 0.79626 0.76336 0.71156 0.57882 0.62666 0.53215 0.45513 0.43053 0.20721 0.39488 0.37150 0.35696 0.36316 0.29108 0.24619 0.18987 0.16935 0.18496 0.15575 0.75422 0.75422 0.75422 0.75422 0.75422 0.69565 0.64314 0.63874 0.63332 0.63221 0.61230 0.48030 0.56752 0.53492 0.32654 0.54201 0.55668 0.61608 0.48880 0.56212 0.49160 0.36852 0.26829 0.32512 0.19953 0.82953 0.82953 0.82953 0.82953 0.82953 0.75912 0.72704 0.68240 0.69571 0.72079 0.65446 0.67783 0.73703 0.65948 0.43887 0.65817 0.67624 0.62701 0.69375 0.57605 0.61423 0.26263 0.24503 0.10700 0.10573 0.82614 0.82614 0.82614 0.82614 0.82614 0.88206 0.85909 0.88344 0.84910 0.88533 0.85240 0.70056 0.72396 0.80220 0.49180 0.63941 0.72500 0.63594 0.73795 0.59627 0.63309 0.33569 0.34450 0.22581 0.30159 0.88811 0.88811 0.88811 0.88811 0.88811 0.88834 0.89974 0.92151 0.87787 0.85887 0.82563 0.78874 0.77934 0.80210 0.60857 0.79070 0.77868 0.60498 0.68447 0.74280 0.73388 0.58797 0.67378 0.57627 0.46954 0.96056 0.96056 0.96056 0.96056 0.96056 0.95136 0.98026 0.89626 0.89382 0.90778 0.88756 0.84000 0.77970 0.83333 0.55516 0.83757 0.85385 0.88809 0.88287 0.85229 0.88219 0.80270 0.83740 0.76855 0.77287 0.96719 0.96719 0.96719 0.96719 0.96719 0.95265 0.95541 0.95288 0.93773 0.93368 0.95825 0.94940 0.90797 0.92862 0.75307 0.95733 0.95373 0.94996 0.93049 0.93216 0.94866 0.95047 0.93968 0.91036 0.91883 0.99150 0.99150 0.99150 0.99150 0.99150 0.98783 0.99435 0.98311 0.98820 0.98844 0.97735 0.98077 0.95736 0.99504 0.76660 0.97368 0.96629 0.97849 0.98291 0.93258 0.94958 0.96970 0.92453 0.93651 0.96250 0.95850 0.95850 0.95850 0.95850 0.95850 0.95850 0.95850 0.95850 0.95850 0.95850 0.95850 0.95850 0.95850 0.95850 0.88570 0.85250 0.87950 0.99000 0.91050 0.87600 0.77100 0.75020 0.73450 0.67330 0.51550
47
48
HGA 2007 Weekday VMT Mix by Time Period and Roadway Functional Classification Group Obs
TP
FC
P_LDGV
P_LDGT1
P_LDGT2
P_LDGT3
P_LDGT4
P_HDGV2b
P_HDGV_3
P_HDGV_4
P_HDGV_5
1
AM_Peak
Art
0.606392
0.054174
0.18034
0.055251
0.025409
0.006187
0.002169
0.000859
0.000308
2
AM_Peak
Col
0.511504
0.059313
0.197448
0.064304
0.029572
0.009773
0.003426
0.001356
0.000487
3
AM_Peak
Fway
0.635466
0.051722
0.172179
0.051473
0.023671
0.005097
0.001787
0.000707
0.000254
4
Mid_Day
Art
0.569791
0.051509
0.17147
0.052611
0.024195
0.010364
0.003633
0.001438
0.000516
5
Mid_Day
Col
0.489634
0.056579
0.188348
0.061355
0.028216
0.013981
0.004901
0.00194
0.000697
6
Mid_Day
Fway
0.606466
0.049329
0.164214
0.049118
0.022588
0.008263
0.002897
0.001147
0.000412
7
Ovr_Nite
Art
0.606257
0.054861
0.182629
0.055867
0.025692
0.004452
0.00156
0.000618
0.000222
8
Ovr_Nite
Col
0.531057
0.062401
0.20773
0.067494
0.031039
0.006817
0.002389
0.000946
0.00034
9
Ovr_Nite
Fway
0.62296
0.050531
0.168215
0.050226
0.023097
0.003996
0.001401
0.000555
0.000199
10
PM_Peak
Art
0.605747
0.054942
0.182899
0.056129
0.025812
0.00615
0.002156
0.000854
0.000306
11
PM_Peak
Col
0.529051
0.061736
0.205514
0.06687
0.030752
0.008595
0.003013
0.001193
0.000428
12
PM_Peak
Fway
0.637333
0.051892
0.172743
0.05173
0.023789
0.004734
0.001659
0.000657
0.000236
Obs
P_HDGV_6
P_HDGV_7
P_HDGV8a
P_HDGV8b
P_LDDV
P_LDDT12
P_HDDV2b
P_HDDV_3
P_HDDV_4
P_HDDV_5
1
0.000837
0.000275
0.000319
0.000055
0.000609
4.13E-05
0.013646
0.003904
0.002342
0.001663
2
0.001322
0.000435
0.000504
8.69E-05
0.000514
4.52E-05
0.023584
0.006747
0.004048
0.002875
3
0.000689
0.000227
0.000263
4.53E-05
0.000638
3.94E-05
0.009939
0.002843
0.001706
0.001212
4
0.001402
0.000461
0.000535
9.22E-05
0.000572
3.93E-05
0.022503
0.006437
0.003862
0.002743
5
0.001891
0.000622
0.000721
0.000124
0.000492
4.31E-05
0.033608
0.009614
0.005769
0.004097
6
0.001118
0.000368
0.000426
7.35E-05
0.000609
3.76E-05
0.016019
0.004583
0.00275
0.001953
7
0.000602
0.000198
0.00023
3.96E-05
0.000609
4.18E-05
0.009802
0.002804
0.001683
0.001195
8
0.000922
0.000303
0.000352
6.06E-05
0.000533
4.76E-05
0.016715
0.004782
0.002869
0.002037
9
0.00054
0.000178
0.000206
3.56E-05
0.000625
3.85E-05
0.007785
0.002227
0.001336
0.000949
10
0.000832
0.000274
0.000317
5.47E-05
0.000608
4.19E-05
0.013475
0.003855
0.002313
0.001643
11
0.001162
0.000382
0.000444
7.65E-05
0.000531
4.71E-05
0.020975
0.006
0.0036
0.002557
12
0.00064
0.000211
0.000244
4.21E-05
0.00064
3.96E-05
0.00921
0.002635
0.001581
0.001123
Obs
P_HDDV_6
P_HDDV_7
1
0.00499
0.002444
0.004956
0.025753
0.001
2
0.008624
0.004224
0.008565
0.049452
0.001
P_HDDV8a
P_HDDV8b
P_MC
P_HDGB
P_HDDBT
P_HDDBS
P_LDDT34
0.000456
0.001585
0.002852
0.001185
0.000884
0.003075
0.005535
0.001298
3
0.003635
0.00178
0.00361
0.024758
0.001
0.000385
0.001337
0.002407
4
0.008229
0.00403
0.008173
0.051377
0.001
0.000176
0.000613
0.001103
0.001127
5
0.01229
0.006019
0.012206
0.059742
0.001
0.000454
0.001579
0.002841
0.001238
6
0.005858
0.002869
0.005818
0.048634
0.001
0.000221
0.000769
0.001384
0.001079
7
0.003585
0.001756
0.00356
0.037665
0.001
0.000174
0.000607
0.001092
0.0012
8
0.006112
0.002994
0.006071
0.040234
0.001
0.000316
0.001099
0.001977
0.001365
9
0.002847
0.001394
0.002827
0.052841
0.001
0.000269
0.000935
0.001683
0.001105
10
0.004928
0.002413
0.004894
0.023508
0.001
0.00034
0.001182
0.002126
0.001202
11
0.00767
0.003757
0.007618
0.0279
0.001
0.000725
0.00252
0.004535
0.001351
12
0.003368
0.00165
0.003345
0.024838
0.001
0.000329
0.001143
0.002056
0.001135
0.001132
HGA 2002 Weekday VMT Mix by Time Period and Roadway Functional Classification Group input to IMPSUM62 Obs TP
TP
P_LDGV
P_LDGT1
P_LDGT2
P_LDGT3
P_LDGT4
P_HDGV2b
P_HDGV_3
P_HDGV_4
P_HDGV_5
FC 1
AM_Peak
Art
0.6087356
0.0577513
0.1922602
0.0425562
0.0195704
0.0074199
0.0027735
0.0013439
0.0004861
2
AM_Peak
Col
0.5238475
0.0668714
0.2226219
0.0545082
0.0250668
0.0105828
0.0039558
0.0019167
0.0006933
3
AM_Peak
Fway
0.6404145
0.0540861
0.1800585
0.0379808
0.0174663
0.0065673
0.0024548
0.0011895
0.0004302
4
Mid_Day
Art
0.5719093
0.0544267
0.1811924
0.0400736
0.0184288
0.0128209
0.0047924
0.0023221
0.0008399
5
Mid_Day
Col
0.5026044
0.0638461
0.2125504
0.0520627
0.0239423
0.0162212
0.0060634
0.0029379
0.0010627
6
Mid_Day
Fway
0.6074268
0.0513717
0.1710219
0.0361381
0.0166189
0.0110513
0.0041309
0.0020016
0.000724
7
Ovr_Nite
Art
0.6082981
0.0582618
0.1939598
0.0429035
0.0197302
0.005308
0.0019841
0.0009614
0.0003477
8
Ovr_Nite
Col
0.5438097
0.0697157
0.2320909
0.0568072
0.0261241
0.0075691
0.0028293
0.0013709
0.0004959
9
Ovr_Nite
Fway
0.6095817
0.0582868
0.194043
0.0429833
0.0197668
0.0076043
0.0028425
0.0013773
0.0004982
10
PM_Peak
Art
0.6095817
0.0582868
0.194043
0.0429833
0.0197668
0.0076043
0.0028425
0.0013773
0.0004982
11
PM_Peak
Col
0.5336237
0.0682929
0.2273542
0.0556555
0.0255945
0.0099779
0.0037297
0.0018072
0.0006537
12
PM_Peak
Fway
0.6404359
0.0542842
0.1807178
0.0382573
0.0175935
0.0064816
0.0024228
0.0011739
0.0004246
Obs
P_HDGV_6
P_HDGV_7
P_HDGV8a
P_HDGV8b
P_LDDV
P_LDDT12
P_HDDV2b
P_HDDV_3
P_HDDV_4
P_HDDV_5
1
0.001301
0.0004575
0.0004575
0.0000572
0.0010029
0.0001673
0.0082776
0.0039899
0.0024118
0.0015781
2
0.0018556
0.0006525
0.0006525
0.0000816
0.0008633
0.0001938
0.0119617
0.0057657
0.0034852
0.0022805
3
0.0011515
0.0004049
0.0004049
0.0000506
0.001055
0.0001567
0.0066315
0.0031965
0.0019322
0.0012643
4
0.002248
0.0007905
0.0007905
0.0000988
0.0009423
0.0001577
0.0141395
0.0068155
0.0041198
0.0026957
5
0.0028442
0.0010002
0.0010002
0.000125
0.0008283
0.000185
0.0185348
0.008934
0.0054004
0.0035336
50
6
0.0019377
0.0006814
0.0006814
0.0000852
0.0010007
0.0001489
0.0110953
0.0053481
0.0032328
0.0021153
7
0.0009307
0.0003273
0.0003273
0.0000409
0.0010022
0.0001688
0.0059433
0.0028648
0.0017317
0.0011331
8
0.0013271
0.0004667
0.0004667
0.0000583
0.0008961
0.000202
0.0086441
0.0041666
0.0025186
0.001648
9
0.0008947
0.0003146
0.0003146
0.0000393
0.0010348
0.0001536
0.0051723
0.0024931
0.001507
0.0009861
10
0.0013333
0.0004689
0.0004689
0.0000586
0.0010043
0.0001689
0.0084594
0.0040776
0.0024648
0.0016128
11
0.0017495
0.0006152
0.0006152
0.0000769
0.0008793
0.0001979
0.011535
0.00556
0.0033609
0.0021991
12
0.0011365
0.0003996
0.0003996
0.00005
0.001055
0.0001573
0.0065309
0.003148
0.0019029
0.0012451
Obs
P_HDDV_6
P_HDDV_7
P_HDDV8a
P_HDDV8b
P_MC
P_HDGB
P_HDDBT
P_HDDBS
P_LDDT34
1
0.0050023
0.0030371
0.0054787
0.0269317
0.001
0.0008021
0.0015415
0.0024064
0.0012024
2
0.0072286
0.0043888
0.0079171
0.0322248
0.001
0.0013495
0.0025936
0.0040487
0.0013922
3
0.0040075
0.0024332
0.0043892
0.0260497
0.001
0.000692
0.0013299
0.0020761
0.0011261
4
0.0085448
0.0051879
0.0093585
0.0530603
0.001
0.0003565
0.0006851
0.0010695
0.0011331
5
0.0112009
0.0068005
0.0122676
0.0404511
0.001
0.0005528
0.0010625
0.0016586
0.0013293
6
0.0067051
0.0040709
0.0073437
0.0505896
0.001
0.0004068
0.0007818
0.0012204
0.0010695
7
0.0035916
0.0021806
0.0039337
0.0401865
0.001
0.0002819
0.0005419
0.0008459
0.001213
8
0.0052238
0.0031716
0.0057213
0.0208743
0.001
0.0002281
0.0004383
0.0006843
0.0014515
9
0.0031257
0.0018978
0.0034234
0.0536903
0.001
0.0004415
0.0008484
0.0013245
0.0011036
10
0.0051122
0.0031038
0.005599
0.0236625
0.001
0.0005417
0.001041
0.0016251
0.0012135
11
0.0069708
0.0042323
0.0076347
0.0178756
0.001
0.0012473
0.0023972
0.0037421
0.0014218
12
0.0039467
0.0023962
0.0043226
0.0261195
0.001
0.0005519
0.0010607
0.0016557
0.0011302
51
EPA Fuel Economy Estimates (miles per gallon) from year 1983 to 2007 for the 28 vehicle classes *Vclass 1 2 3 4 5 6 7 8 9 10 11 12 13 14 15 16 17 18 19 20 21 22 23 24 25 26 27 28
1983 21.9 18.9 18.9 14.5 14.5 8.81 8.16 7.87 7.3 6.83 6.54 6.09 5.43 26.2 24.7 11.13 10.01 9.27 8.78 7.96 7.38 5.79 5.16 50 6.18 3.94 6.29 19
1984 22.2 18.6 18.6 14.3 14.3 8.91 8.26 7.98 7.35 6.93 6.62 6.17 5.55 30.9 25 11.27 10.14 9.34 8.87 8.02 7.39 5.84 5.25 50 6.18 3.94 6.29 19.3
1985 22.9 18.7 18.7 14.4 14.4 9.01 8.35 8.09 7.41 7.03 6.69 6.24 5.64 29.1 23.8 11.41 10.27 9.41 8.95 8.08 7.4 5.9 5.33 50 6.18 3.94 6.29 18.3
1986 23.7 19.6 19.6 15 15 9.11 8.45 8.21 7.47 7.13 6.76 6.32 5.75 34.4 24.4 11.55 10.39 9.49 9.04 8.14 7.41 5.96 5.42 50 6.18 3.94 6.29 18.8
1987 23.8 19.7 19.7 15.2 15.2 9.22 8.54 8.32 7.52 7.23 6.83 6.39 5.91 25.9 23.4 11.69 10.52 9.56 9.12 8.2 7.43 5.96 5.51 50 6.18 3.94 6.29 18
1988 24.3 19.3 19.3 14.8 14.8 9.32 8.63 8.43 7.58 7.33 6.89 6.47 6 31.8 20.3 11.83 10.65 9.63 9.21 8.25 7.44 6.03 5.59 50 6.21 3.99 6.28 15.6
1989 23.9 19.1 19.1 14.7 14.7 9.42 8.73 8.55 7.63 7.43 6.96 6.54 6.09 37.7 20.7 11.97 10.77 9.7 9.29 8.31 7.45 6.1 5.68 50 6.24 4.04 6.27 15.9
1990 23.6 18.9 18.9 14.6 14.6 9.52 8.82 8.66 7.68 7.53 7.03 6.62 6.19 32.4 22.1 12.11 10.9 9.77 9.38 8.37 7.46 6.17 5.77 50 6.27 4.08 6.25 17
1991 23.8 19.4 19.4 14.9 14.9 9.62 8.92 8.78 7.74 7.63 7.1 6.7 6.29 32.4 22.1 12.26 11.03 9.85 9.46 8.42 7.47 6.24 5.86 50 6.3 4.13 6.24 17
Please note that the real EPA table is from 1952 to 2050.
53
continuation *Vclass 1 2 3 4 5 6 7 8 9 10 11 12 13 14 15 16 17 18 19 20 21 22 23 24 25 26 27 28
1992 23.5 19 19 14.6 14.6 9.73 9.01 8.89 7.79 7.73 7.17 6.77 6.38 32.4 22.1 12.4 11.15 9.92 9.54 8.48 7.48 6.31 5.95 50 6.33 4.17 6.23 17
1993 24 19.1 19.1 14.7 14.7 9.83 9.11 9.01 7.85 7.84 7.24 6.85 6.47 32.4 22.1 12.54 11.28 9.99 9.63 8.54 7.49 6.38 6.03 50 6.37 4.22 6.22 17
1994 23.9 18.9 18.9 14.6 14.6 9.93 9.2 9.12 7.9 7.94 7.31 6.92 6.57 32.4 22.1 12.68 11.41 10.06 9.71 8.59 7.51 6.45 6.12 50 6.4 4.26 6.2 17
1995 24.1 18.7 18.7 14.4 14.4 10.03 9.3 9.24 7.95 8.04 7.38 7 6.67 32.4 22.1 12.82 11.53 10.13 9.8 8.65 7.52 6.52 6.21 50 6.42 4.31 6.19 17
1996 24.1 19 19 14.6 14.6 10.13 9.39 9.35 8.01 8.14 7.45 7.07 6.76 32.4 22.1 12.96 11.66 10.2 9.88 8.71 7.53 6.59 6.3 50 6.45 4.36 6.18 17
1997 24.2 18.8 18.8 14.5 14.5 10.13 9.39 9.35 8.01 8.14 7.45 7.07 6.76 32.4 22.1 12.96 11.66 10.2 9.88 8.71 7.53 6.59 6.3 50 6.45 4.36 6.18 17
1998 24.3 19 19 14.6 14.6 10.13 9.39 9.35 8.01 8.14 7.45 7.07 6.76 32.4 22.1 12.96 11.66 10.2 9.88 8.71 7.53 6.59 6.3 50 6.45 4.36 6.18 17
1999 24 18.7 18.7 14.4 14.4 10.13 9.39 9.35 8.01 8.14 7.45 7.07 6.76 32.4 22.1 12.96 11.66 10.2 9.88 8.71 7.53 6.59 6.3 50 6.45 4.36 6.18 17
2000 24.1 18.7 18.7 14.4 14.4 10.13 9.39 9.35 8.01 8.14 7.45 7.07 6.76 32.4 22.1 12.96 11.66 10.2 9.88 8.71 7.53 6.59 6.3 50 6.45 4.36 6.18 17
54
continuation *Vclass 1 2 3 4 5 6 7 8 9 10 11 12 13 14 15 16 17 18 19 20 21 22 23 24 25 26 27 28
2001 24.1 18.5 18.5 14.2 14.2 10.13 9.39 9.35 8.01 8.14 7.45 7.07 6.76 32.4 22.1 12.96 11.66 10.2 9.88 8.71 7.53 6.59 6.3 50 6.45 4.36 6.18 17
2002 24.1 18.5 18.5 14.2 14.2 10.13 9.39 9.35 8.01 8.14 7.45 7.07 6.76 32.4 22.1 12.96 11.66 10.2 9.88 8.71 7.53 6.59 6.3 50 6.45 4.36 6.18 17
2003 24.1 18.5 18.5 14.2 14.2 10.13 9.39 9.35 8.01 8.14 7.45 7.07 6.76 32.4 22.1 12.96 11.66 10.2 9.88 8.71 7.53 6.59 6.3 50 6.45 4.36 6.18 17
2004 24.1 18.5 18.5 14.2 14.2 10.13 9.39 9.35 8.01 8.14 7.45 7.07 6.76 32.4 22.1 12.96 11.66 10.2 9.88 8.71 7.53 6.59 6.3 50 6.45 4.36 6.18 17
2005 24.1 18.5 18.5 14.2 14.2 10.13 9.39 9.35 8.01 8.14 7.45 7.07 6.76 32.4 22.1 12.96 11.66 10.2 9.88 8.71 7.53 6.59 6.3 50 6.45 4.36 6.18 17
2006 24.1 18.5 18.5 14.2 14.2 10.13 9.39 9.35 8.01 8.14 7.45 7.07 6.76 32.4 22.1 12.96 11.66 10.2 9.88 8.71 7.53 6.59 6.3 50 6.45 4.36 6.18 17
2007 24.1 18.5 18.5 14.2 14.2 10.13 9.39 9.35 8.01 8.14 7.45 7.07 6.76 32.4 22.1 12.96 11.66 10.2 9.88 8.71 7.53 6.59 6.3 50 6.45 4.36 6.18 17
55