Friction and bending in thermoplastic composites forming processes Ulrich Sachs
FRICTION AND BENDING IN THERMOPLASTIC COMPOSITES FORMING PROCESSES
Ulrich Sachs
De promotiecommissie is als volgt samengesteld: Voorzitter en secretaris: prof.dr. G.P.M.R. Dewulf
Universiteit Twente
Promotor: prof.dr.ir. R. Akkerman
Universiteit Twente
Leden (in alfabetische volgorde): prof.dr.ir. A.H. van den Boogaard prof.dr.ir. R. Marissen prof.dr.ir. J.W.M. Noordermeer prof.dr.ir. D.J. Schipper prof.dr. J. Sherwood
Universiteit Twente Technische Universiteit Delft Universiteit Twente Universiteit Twente University of Massachusetts Lowell
This research project was financially supported by the ThermoPlastic composite Research Center (TPRC). Friction and bending in thermoplastic composites forming processes, Sachs, Ulrich PhD Thesis, University of Twente, Enschede, The Netherlands November 2014 ISBN 978-94-6259-483-8 DOI 10.3990/1.9789462594838 © 2014 by U. Sachs, Enschede, The Netherlands Printed by Ipskamp Drukkers B.V., Enschede, The Netherlands Cover: An application of thermoplastic composite stiffening ribs as part of a wing structure, manufactured by DTC in a hot stamp forming process for the Dornier 328.
FRICTION AND BENDING IN THERMOPLASTIC COMPOSITES FORMING PROCESSES
PROEFSCHRIFT
ter verkrijging van de graad van doctor aan de Universiteit Twente, op gezag van de rector magnificus, prof.dr. H. Brinksma, volgens besluit van het College voor Promoties in het openbaar te verdedigen op dinsdag 16 december 2014 om 14:45 uur
door
Ulrich Sachs geboren op 15 oktober 1980 te Münster, Duitsland
Dit proefschrift is goedgekeurd door de promotor: prof.dr.ir. R. Akkerman
Summary With the demand for better fuel economy in the aerospace and automotive industries, lightweight polymer matrix composites became an attractive alternative for metal structures. Despite the inherently higher toughness and impact damage resistance of thermoplastics, thermoset matrix composites are used in the majority of applications. This is largely attributable to the higher material costs of thermoplastic composites and the limited experience with these materials. The ability to re-melt thermoplastics, however, allows automated processing methods with short cycle times, which lowers production costs to a competitive level, especially for larger series production. Thermoforming of flat laminates of continuous fiber reinforced thermoplastic laminates into 3-D parts is a complex process. Fundamental understanding of the deformation processes is needed to prevent process induced defects, such as wrinkling at critical locations, for the product or the process. The elementary deformation mechanisms need to be addressed one-by-one to develop this understanding and to translate this understanding to reliable Computer Aided Engineering tools for predictable product development processes. The major deformation mechanisms of continuous fiber reinforced composites are considered to be intra-ply shear, inter-ply slippage and ply bending. The latter two are investigated in this thesis. The objective of this thesis is to develop an understanding of the physics of the deformation mechanisms and to make it available in the form of describing constitutive equations. Test set-ups and testing procedures were developed to investigate the respective deformation mechanisms. To perform adequate tests, the actual process conditions were imitated as closely as possible. Furthermore, a thorough analysis was undertaken to ensure that the desired deformation mechanism is invoked without disturbing side effects. The set-up to measure inter-ply slippage and tool-ply slippage (also referred to as friction) was evaluated in the scope of a benchmark test, in which several research groups performed friction tests under nominally equal conditions. Each group employed a custom-built set-up for the tests and reported the measured friction data. Differences that were observed in the measurements and the set-up designs led to recommendations for optimized test equipment design and test procedures. Subsequently, friction experiments were conducted with the high-performance thermoplastics polyphenylene sulfide (PPS) and polyether ether ketone (PEEK). The composites were reinforced with glass or carbon fibers in the form of a textile or i
ii with unidirectional (UD) fibers. Although the friction of both textile and UD fiber reinforced composites is governed by hydrodynamic lubrication, the friction behavior was observed to be different. For fabric reinforced composites the friction behavior follows a Stribeck curve, thus it is dependent on sliding velocity, normal pressure and the polymer (matrix) viscosity. In contrast, UD fabrics have a much thinner lubrication layer of polymer matrix which seems to be independent of the normal pressure. This leads to boundary lubrication effects at low sliding velocities and wall slip effects at high sliding velocities. The bending set-up, which exploits the measuring precision and environmental control of a commercial rheometer, was evaluated by means of physical models. The bending moments measured on a material of known properties can be well predicted when the clamping effects are properly included in the model. Using this result, it is possible to correct for the clamping effects in the measurement results of UD carbon PEEK. The bending behavior is viscoelastic, which can be contributed to viscous shear of the polymer and elastic bending of the fibers, respectively. The experiments indicate that the polymer shear is governed by the same microscopic effects as the shear of the polymeric interlayer in friction experiments, because the apparent viscosities of both mechanisms have equivalent values. The elastic bending rigidity is assumed to be increased by interlocking of fibers, that hinders their free movement along each other. The exact nature of this interlocking has still to be investigated. The results of this study can be implemented in composites forming simulation software. These Computer Aided Engineering tools allow for design for manufacturing and will shorten the product development process in thermoplastic composites. The friction model can be implemented easily, whereas the essentially viscoelastic bending behavior will require some further changes in the current sheet forming modeling approach.
Samenvatting De noodzaak voor brandstofreductie in de vliegtuig- en automobielindustrie heeft lichtgewicht polymeer-matrix-composieten aantrekkelijk gemaakt als vervanging voor metalen constructies. Ondanks de inherent hogere taaiheid en slagvastheid van thermoplasten, worden tot nu toe hoofdzakelijk composieten met een thermohardende matrix toegepast. Dit kan toegeschreven worden aan de hogere materiaalkosten van thermoplastische composieten en de beperkte ervaringen met deze materialen. De mogelijkheid tot smelten maakt thermoplasten echter geschikt voor geautomatiseerde productieprocessen met korte cyclustijden, waardoor de productiekosten concurrerend worden, in het bijzonder voor serieproductie. Het thermisch vervormen van vlakke thermoplastische laminaten met continue vezelversterking tot 3-dimensionale onderdelen is een complex proces. Een fundamenteel begrip van de deformatieprocessen is nodig om proces-geïnduceerde defecten, zoals plooivorming in kritische gebieden, te voorkomen. Deze defecten kunnen schade aan het gereedschap of direct in het product veroorzaken. De onderliggende deformatiemechanismen moeten voldoende begrepen worden om deze te kunnen vertaalen naar betrouwbare computer aided engineering software die het productieproces voorspelbaar maakt. Als belangrijkste deformatiemechanismen in continu-vezelversterkte composieten worden intra-laminaire afschuiving, interlaminaire slip en buiging beschouwd. De doelstelling van dit onderzoek was het ontwikkelen en begrijpen van de fysica van de twee laatstgenoemde deformatiemechanismen en deze beschikbaar te stellen in vorm van beschrijvende constitutieve vergelijkingen. In het kader van dit onderzoek zijn testopstellingen en testprocedures ontwikkeld om deze deformatiemechanismen nader te onderzoeken. Een grondige analyse is verricht om zeker te stellen dat de gewenste deformatiemechanismen correct worden gemeten, zonder storende neveneffecten. De testopstelling voor karakterisering van inter-laminaire slip en slip tussen de metalen gereedschappen en het composiet – ook wrijving genoemd – is geëvalueerd in het kader van een benchmarktest, waarin verschillende onderzoeksgroepen wrijvingstesten hebben uitgevoerd onder nominaal gelijke testcondities. Elke groep gebruikte een zelf ontworpen opstelling en rapporteerde de meetgegevens. De verschillen die geconstateerd zijn met betrekking tot de meetresultaten en het ontwerp van de opstelling hebben geresulteerd in een aanbeveling voor een iii
iv geoptimaliseerde opstelling en bijbehorende testprocedures. Vervolgens zijn wrijvingsexperimenten met hoogwaardige thermoplastische composieten op de basis van polyfenyleensulfide (PPS) en polyetheretherketon (PEEK) uitgevoerd. Deze composieten waren versterkt met glas- of koolstofvezels in de vorm van een weefsel of met uni-directionele (UD) vezels. Ondanks de observatie dat de wrijving van zowel weefsel als UD versterkte composieten gedomineerd is door hydrodynamische smering, bleek het wrijvingsgedrag verschillend. Het wrijvingsgedrag van weefselversterkte composieten is te beschrijven met behulp van zogenaamde Stribeckcurves, waarbij het gedrag afhankelijk is van de glijsnelheid, normaaldruk en polymeerviscositeit. UD versterkte composieten hebben daarentegen gewoonlijk een veel dunnere grenslaag van polymeermatrix, die schijnbaar onafhankelijk van de normaaldruk is. Dit leidt tot grenssmeringseffecten en wandslip bij respectievelijk lage en hoge glijsnelheden. Een nieuwe buigopstelling, die gebruik maakt van de meetprecisie en klimaatregeling van een commerciële reometer, is geëvalueerd aan de hand van fysische modellen. De gemeten buigmomenten van een referentiemateriaal met bekende eigenschappen kunnen goed worden beschreven met een analytisch model waarin de effecten van de inklemming worden meegenomen. Aan de hand van deze resultaten is het mogelijk de meetresultaten van proefstukken uit UD koolstof/PEEK voor klemeffecten te corrigeren. Het buiggedrag blijkt een viscoëlastisch karakter te hebben, hetgeen wordt veroorzaakt door de combinatie van viskeuze polymeerafschuiving en elastische vezelbuiging. Dezelfde microscopische effecten lijken ten grondslag te liggen aan deze polymeerafschuiving als in het geval van de afschuiving van de polymere grenslaag in de wrijvingsexperimenten. De schijnbare viscositeiten behorend bij beide mechanismen vertonen equivalente waarden. Waarschijnlijk wordt het aandeel aan elastische buiging verhoogd door verstrengelingen in de vezels, waardoor de onderlinge verschuiving in vezelrichting wordt belemmerd. Het exacte karakter van deze verstrengelingen is een thema voor nader onderzoek. Het resultaat van dit onderzoek kan worden geïmplementeerd in simulatiesoftware voor vormgevingsprocessen van composieten. Deze CAE programma’s ondersteunen de ontwerper tijdens de ontwikkeling van thermoplastische composietonderdelen en de daarbij behorende processen en verkorten op die manier de totale ontwikkelingstijd. Het wrijvingsmodel kan eenvoudig in deze software geïmplementeerd worden. Het viscoëlastische buiggedrag vereist daarentegen nog aanpassingen in de huidige wijze van vervormingsmodellering.
Contents Summary
i
Samenvatting
iii
1 Introduction 1.1 Stamp forming . . . . . . . . . . . . . . . . . . . . . . . . . . . . . . . . . 1.2 Outline . . . . . . . . . . . . . . . . . . . . . . . . . . . . . . . . . . . . . . References . . . . . . . . . . . . . . . . . . . . . . . . . . . . . . . . . . . . . . . 2 Friction in composites: Experimental methods and benchmark 2.1 Introduction . . . . . . . . . . . . . . . . . . . . . . . . . . . . 2.2 Benchmark description . . . . . . . . . . . . . . . . . . . . . . 2.2.1 Material . . . . . . . . . . . . . . . . . . . . . . . . . . 2.2.2 Test matrix . . . . . . . . . . . . . . . . . . . . . . . . . 2.2.3 Criteria . . . . . . . . . . . . . . . . . . . . . . . . . . . 2.3 Measurement devices of participants . . . . . . . . . . . . . . 2.3.1 University of Twente . . . . . . . . . . . . . . . . . . . 2.3.2 University of Massachusetts Lowell . . . . . . . . . . 2.3.3 TU Clausthal . . . . . . . . . . . . . . . . . . . . . . . 2.3.4 Université d’Orléans . . . . . . . . . . . . . . . . . . . 2.3.5 INSA Lyon . . . . . . . . . . . . . . . . . . . . . . . . . 2.3.6 TU Dresden . . . . . . . . . . . . . . . . . . . . . . . . 2.3.7 KU Leuven . . . . . . . . . . . . . . . . . . . . . . . . 2.4 Results for dry friction . . . . . . . . . . . . . . . . . . . . . . 2.4.1 Results . . . . . . . . . . . . . . . . . . . . . . . . . . . 2.4.2 Discussion . . . . . . . . . . . . . . . . . . . . . . . . . 2.5 Results for wet friction . . . . . . . . . . . . . . . . . . . . . . 2.5.1 Results . . . . . . . . . . . . . . . . . . . . . . . . . . . 2.5.2 Discussion . . . . . . . . . . . . . . . . . . . . . . . . . 2.6 Conclusions & Recommendations . . . . . . . . . . . . . . . References . . . . . . . . . . . . . . . . . . . . . . . . . . . . . . . . v
. . . . . . . . . . . . . . . . . . . . .
. . . . . . . . . . . . . . . . . . . . .
. . . . . . . . . . . . . . . . . . . . .
. . . . . . . . . . . . . . . . . . . . .
. . . . . . . . . . . . . . . . . . . . .
. . . . . . . . . . . . . . . . . . . . .
. . . . . . . . . . . . . . . . . . . . .
1 2 6 7 9 10 13 13 14 15 16 16 16 17 17 17 18 18 20 20 21 23 23 24 28 29
vi 3 Friction characterization of woven composite 3.1 Introduction . . . . . . . . . . . . . . . . . 3.2 Set-up . . . . . . . . . . . . . . . . . . . . . 3.3 Materials . . . . . . . . . . . . . . . . . . . 3.4 Specimen configuration . . . . . . . . . . 3.5 Test conditions . . . . . . . . . . . . . . . . 3.6 Characteristic response . . . . . . . . . . . 3.7 Results & Discussion . . . . . . . . . . . . 3.8 Conclusion . . . . . . . . . . . . . . . . . . References . . . . . . . . . . . . . . . . . . . . .
Contents
. . . . . . . . .
4 A lubrication approach with UD composites 4.1 Introduction . . . . . . . . . . . . . . . . . . 4.2 Literature review . . . . . . . . . . . . . . . 4.3 Model description for UD tool-ply friction 4.4 Material properties . . . . . . . . . . . . . . 4.5 Model results . . . . . . . . . . . . . . . . . 4.6 Experimental set-up . . . . . . . . . . . . . 4.7 Test conditions . . . . . . . . . . . . . . . . . 4.8 Experimental results . . . . . . . . . . . . . 4.9 Discussion . . . . . . . . . . . . . . . . . . . 4.10 Conclusions . . . . . . . . . . . . . . . . . . References . . . . . . . . . . . . . . . . . . . . . .
. . . . . . . . .
. . . . . . . . . . .
. . . . . . . . .
. . . . . . . . . . .
. . . . . . . . .
. . . . . . . . . . .
. . . . . . . . .
. . . . . . . . . . .
. . . . . . . . .
. . . . . . . . . . .
. . . . . . . . .
. . . . . . . . . . .
. . . . . . . . .
. . . . . . . . . . .
. . . . . . . . .
. . . . . . . . . . .
. . . . . . . . .
. . . . . . . . . . .
. . . . . . . . .
. . . . . . . . . . .
. . . . . . . . .
. . . . . . . . . . .
. . . . . . . . .
. . . . . . . . . . .
. . . . . . . . .
. . . . . . . . . . .
. . . . . . . . .
. . . . . . . . . . .
. . . . . . . . .
. . . . . . . . . . .
5 A novel bending characterization method for thermoplastic composites 5.1 Introduction . . . . . . . . . . . . . . . . . . . . . . . . . . . . . . . . . 5.2 Description of the bending mechanics for elastic specimens . . . . . 5.3 Experimental bending set-up . . . . . . . . . . . . . . . . . . . . . . . 5.4 Evaluation with a purely elastic specimen . . . . . . . . . . . . . . . . 5.5 Effects of friction and spacing in fixture . . . . . . . . . . . . . . . . . 5.5.1 Pure bending . . . . . . . . . . . . . . . . . . . . . . . . . . . . 5.5.2 Pure shear . . . . . . . . . . . . . . . . . . . . . . . . . . . . . . 5.6 Development of a viscoelastic bending model . . . . . . . . . . . . . 5.7 Bending of UD carbon PEEK . . . . . . . . . . . . . . . . . . . . . . . 5.8 Discussion . . . . . . . . . . . . . . . . . . . . . . . . . . . . . . . . . . 5.9 Conclusion . . . . . . . . . . . . . . . . . . . . . . . . . . . . . . . . . . 5.10 Acknowledgements . . . . . . . . . . . . . . . . . . . . . . . . . . . . . References . . . . . . . . . . . . . . . . . . . . . . . . . . . . . . . . . . . . .
. . . . . . . . .
. . . . . . . . . . .
. . . . . . . . . . . . .
. . . . . . . . .
31 32 34 35 37 37 38 39 42 43
. . . . . . . . . . .
45 46 47 48 50 52 53 54 55 59 60 61
. . . . . . . . . . . . .
63 64 65 67 68 69 69 70 71 75 77 79 79 80
Contents
vii
6 Discussion 6.1 Characterization methods and constitutive equations 6.1.1 Inter-ply slip and tool-ply slip (friction) . . . . 6.1.2 Bending . . . . . . . . . . . . . . . . . . . . . . 6.2 Comparison with actual press forming . . . . . . . . 6.2.1 Inter-ply slip and tool-ply slip (friction) . . . . 6.2.2 Bending . . . . . . . . . . . . . . . . . . . . . . 6.2.3 From measurements to process models . . . . References . . . . . . . . . . . . . . . . . . . . . . . . . . . .
83 83 84 86 88 88 90 92 92
. . . . . . . .
. . . . . . . .
. . . . . . . .
. . . . . . . .
. . . . . . . .
. . . . . . . .
. . . . . . . .
. . . . . . . .
. . . . . . . .
. . . . . . . .
. . . . . . . .
7 Conclusions and Recommendations 95 7.1 Conclusions . . . . . . . . . . . . . . . . . . . . . . . . . . . . . . . . . . . 95 7.2 Recommendations . . . . . . . . . . . . . . . . . . . . . . . . . . . . . . . 96 Acknowledgments Publications
99 101
Chapter 1 Introduction High-performance composite materials are lightweight alternatives to aerospace metallic alloys. They offer a higher specific strength and specific stiffness, especially when based on carbon fibers. Using a combination of different fiber orientations, they allow for highly optimized part designs. The high raw material costs and high fabrication and assembly costs, on the other hand, are the main obstacle to a broader application of composites [1, 2]. The ability of thermoplastics to re-melt enables rapid automated production processes and allows for a reduction of the production costs compared to thermoset composites. Continuous fiber reinforced plastics (CFRP) for high-performance applications contain a high volume fraction (around 60 %) of fibers normally of carbon or glass. The reinforcements predominantly determine the strength and the stiffness in the direction of their orientation. The polymer matrix is a relatively weak but tough material which holds the fibers together, transferring the loads to the fibers and supporting the loads transverse to the fiber direction. A composite laminate of CFRP is laid up of multiple plies or layers, with unidirectional (UD) or textile reinforcement (see Figure 1.1). CFRPs are increasingly used in the automotive and aerospace industries. While the
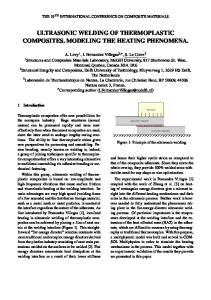
Figure 1.1
Continuous fiber reinforced composites consist of layers of woven fabrics (left) or unidirectional fibers (center) which are laid up to a laminate (right).
1
2
Chapter 1. Introduction
Boeing 777, which entered service in 1995, contains 12 % composites of the total structural weight, in the Boeing 787, introduced in 2011, it amounts to 50 % of composite materials [3]. The great majority of CFRP parts are still made from thermoset polymer, manufactured by a labor and time intensive hand lay-up, with subsequent vacuum bagging and/or autoclaving, contributing to the high manufacturing costs. Alternative thermoplastic solutions are gaining importance, since they allow for faster production processes, thereby exploiting the thermoformability of thermoplastic laminates. Thermoplastics also offer a better damage tolerance, an indefinite shelf life and fewer environmental risks than thermosets [1]. Thermoplastic matrix materials such as Polyetheretherketone (PEEK), Polyetherketoneketone (PEKK), polyphenylenesulfide (PPS), and polyetherimide (PEI) are often used in aerospace applications [2]. These are relatively expensive polymers, but also have superior mechanical and thermal properties compared to most thermoplastics.
1.1 Stamp forming Production techniques, that become possible with the ability to re-melt, are thermoforming and fusion bonding, thereby widening the possibilities in the product design and the production process. For example, the stamp forming technique can be utilized to form a hot laminate into a complex geometry (see Figure 1.2). Usually, a blank is cut from a preconsolidated laminate that consists of a stack of differently oriented UD or fabric reinforced plies. The blank is positioned within a gripping frame and transported to a heating device, such as an infrared oven. Once a sufficiently high temperature above the melting point of the polymer has been reached, the blank is transported towards the tooling. The tooling consists of a male and a matching female part. Both matched-metal and rubber-metal configurations are used in practice, for which the tools are usually heated to control the cooling process of the formed laminate. The blank is formed by closing the tooling, after which a high consolidation pressure is applied. The formed blank is released after cooling. Subsequently, a trimming operation is applied to remove the excess material. Relatively simple geometric parts with single curvature are manufactured with this process, such as the thermoplastic composite clips and brackets extensively used in the Airbus A-350 XWB and the Boeing 787 aircraft [4, 5]. Stamp forming is also applied to produce more complex-shaped parts with double curvature, such as stringers and ribs. These components are subsequently assembled in a larger structural assembly as for example shown in Figure 1.2, representing stiffening ribs welded to the thermoplastic skin in the wing of an Airbus A380. Complex, doubly curved shapes produced with press forming are mainly made from woven fabric reinforced CFRPs, using the experience that has been gained from
3
1.1. Stamp forming
Figure 1.2
The stamp forming process and the integration of products into the airfoil.
4
Chapter 1. Introduction
��������
�� � ���� ���
Figure 1.3
� � ���� ����
� � ���� ���
� � �� �� ���
�� � ���� ����
�� � ���� ���
�� �� �� ���
Quasi-isotropic CFRP laminates of different materials pressed to stiffening ribs suffer from different severity of formability problems (Chapter 3).
numerous researches with this material [6–9]. UD composites, however, usually have a higher fiber content with less fiber waviness [1], and in addition they are suited for automated tape placement [10] to create tailored lay-ups in terms of orientation and thickness. However, greater formability problems were experienced with UD composites in 3-D stamp forming [11], indicated by press trials as illustrated in Figure 1.3. Preconsolidated laminates with a quasi-isotropic lay-up of approximately 1 mm thickness are made from different composites with either woven or UD fiber reinforcements. While woven composites do not exhibit visible fiber distortions in the critical areas, UD composite parts show fiber wrinkling with varying severity. Wrinkling and folding present the most common problems in press forming of thermoplastic composites that need to be prevented, since they may lead to weak points in the product. The local thickness variations caused by the wrinkles result in poorly consolidated spots and could damage the mold in the case of matched-metal tooling. Such defects can be anticipated only by a thorough understanding of the deformation behavior of UD laminates. A subdivision into separate deformation mechanisms helps to understand the complex deformation behavior of a composite laminate. These deformation mechanisms can be defined on different length scales. Microscopic deformation mechanisms related to redistribution of fibers and matrix are outside the scope of the current work, which concentrates on the ply- and laminate level (also defined as mesoscopic and macroscopic scale, respectively). Figure 1.4 summarizes the major ply and laminate deformation mechanisms. As a minimum requirement, inter-ply slippage, ply bending and intra-ply shear need to be included to describe the global deformations of a composite laminate under forming conditions. The formability of a composite laminate is determined by the resistances against these basic deformation mechanisms. Based on a sensitivity study, Haanappel [11] concluded that the
5
1.1. Stamp forming ������ � � ��� ��� � X�
����������� ��
���� � � � ��� ��� �
���� �
�� �� z
X� ���
�� ����
� ���� ��
X�
����
��
��
X�
X� �� ������������ � � ���� ����
x
X�
X� X1 �� ����
Figure 1.4
X�
�� ������ � � ���� ����
X� X1 ����� ����
� X�
� ��������
Local deformation mechanisms in a laminate [11].
formability is determined by a delicate balance of all three deformation mechanisms, as none of the mechanisms are dominant or negligible. This implies that the resistances against all three deformation mechanisms need to be quantitatively modeled to accurately describe the formability of the composite laminate. The prediction and prevention of wrinkles is far from trivial, and requires the means of finite element analysis with a correct representation of the material properties and boundary conditions. Where Haanappel [11] focused on the axial intra-ply shearing mechanism, this thesis is directed to mechanisms related to deformations transverse to the laminate midplane, i.e. inter-ply slippage and bending of thermoplastic CFRPs. The objectives of the research reported in this thesis are hence: • To develop characterization methods needed to identify the material behavior related to the out-of-plane deformation mechanisms in 3-D stamp forming; • To obtain a profound understanding of the underlying microscopic mechanisms and to develop constitutive equations that correctly represent the deformation behavior of the thermoplastic composite laminates. The findings will be used in more effective CAE tools to support the development of new products, preventing time-consuming and costly trial-and-error processes.
6
Chapter 1. Introduction
1.2 Outline To characterize the inter-ply slippage (often referred to as friction), various custombuilt set-ups were developed around the world, that allow tests under process conditions, i.e. temperature above melting point and variable pressure and sliding velocities. Especially the high temperatures and the viscoelastic response add extra complexity to standard friction experiments (as described in ASTM and ISO standards). Since these tests are scarcely performed and do not have a standard, the accuracy of the measurements is unknown. Chapter 2 describes a benchmark program that compares the friction measurements of several research groups, leading to guidelines for designing a friction tester and giving confidence in the measurements obtained with the applied friction test set-up. Chapter 3 investigates the inter-ply shear for high-performance woven CFRPs and evaluates the results with a physical model developed by Ten Thije et al. [12]. These materials show a clear hydrodynamic response, depending on sliding velocity, pressure and temperature. The response can be described well by Stribeck curves known from the field of tribology. The important material parameters that determine the shear stress are the matrix viscosity and the geometry of the undulated fiber bundles in the fabric. It is shown that the sliding resistance of the fabric reinforced materials can be predicted as a function of these material parameters and the test conditions. In Chapter 4 the inter-ply shear of UD composites is characterized, which does not follow the same physical model as woven composites. A micromechanics based approach is introduced to explain and quantitatively model the results of the friction experiments. The resulting macroscopic relations can be implemented in 3-D finite element software to simulate composites forming processes for UD laminates. Inter-ply shear, intra-ply shear and bending are closely interrelated. Some researchers even describe bending as purely intra-ply shear [13], but it remains a very scarcely researched subject. An experimental method to study the bending behavior was proposed by Ten Hove [14], allowing precise measurements utilizing the test and measuring capabilities of a commercially available rotational rheometer. This method is further investigated in Chapter 5, to derive a proper constitutive model and the related material property data for subsequent 3-D finite element simulations of the composites forming process. Chapters 2 to 5 are reproduced from research papers, which implies that some introductory and theoretical parts are addressed multiple times. The Chapters are, however, self-contained and can be read as such. The results of these Chapters are combined and discussed in Chapter 6 with respect to the objectives of this research, after which the conclusions and recommendations are presented in Chapter 7.
References
7
References [1] F. C. Campbell. Manufacturing technology for aerospace structural materials. Elsevier, Amsterdam; Boston, 2006. [2] M. Biron. Outline of the actual situation of plastics compared to conventional materials. In Thermoplastics and Thermoplastic Composites, 1–29. Elsevier, 2013. [3] Boeing website. http://www.boeing.com/boeing/commercial/787family/programfacts.page. Visited: September 2014. [4] CompositesWorld. http://www.compositesworld.com/articles/tpcs-on-the-boeing-787-and-airbus-a350. Visited: September 2014. [5] CompositesWorld. http://www.compositesworld.com/articles/inside-a-thermoplastic-composites-hotbed. Visited: September 2014. [6] R. H. W. ten Thije. Finite element simulations of laminated composite forming processes. Ph.D. thesis, University of Twente, Enschede, The Netherlands, 2007. [7] S. Wijskamp. Shape distortions in composites forming. Ph.D. thesis, University of Twente, Enschede, The Netherlands, 2005. [8] E. A. D. Lamers. Shape distortions in fabric reinforced composite products due to processing induced fibre reorientation. Ph.D. thesis, University of Twente, Enschede, The Netherlands, 2004. [9] L. M. J. Robroek. The development of rubber forming as a rapid thermoforming technique for continuous fibre reinforced thermoplastic composites: quality control by process control. Ph.D. thesis, Delft University Press, Delft, The Netherlands, 1994. [10] W. J. B. Grouve. Weld strength of laser-assisted tape-placed thermoplastic composites. Ph.D. thesis, University of Twente, Enschede, The Netherlands, 2012. [11] S. P. Haanappel. Forming of UD fibre reinforced thermoplastics. Ph.D. thesis, University of Twente, Enschede, The Netherlands, 2013. [12] R. H. W. ten Thije, R. Akkerman, L. van der Meer, and M. P. Ubbink. Tool-ply friction in thermoplastic composite forming. International Journal of Material Forming, 1(SUPPL. 1):953–956, 2008. [13] T. A. Martin, S. J. Bennison, R. J. Dykes, and D. Bhattacharyya. Chapter 9 Bending of continuous fibre-reinforced thermoplastic sheets. In D. Bhattacharyya, editor, Composite Sheet Forming, volume 11 of Composite Materials Series, 371–401. Elsevier, 1997. [14] C. H. ten Hove. Bending of CF/PEEK Pregregs. M.Sc. thesis, University of Twente, Enschede, The Netherlands, 2012.
8
Chapter 1. Introduction
Chapter 2 Characterization of the dynamic friction of woven fabrics: Experimental methods and benchmark results* Abstract A benchmark exercise was conducted to compare various friction test set-ups with respect to the measured coefficients of friction. The friction was determined between Twintex® PP, a fabric of commingled yarns of glass and polypropylene filaments, and a metal surface. The same material was supplied to all benchmark participants and the test conditions were prescribed, making the used set-up the most important variable among the laboratories. Tests at ambient temperature as well as tests above the melting point of polypropylene are part of the benchmark, to determine both the dry and hydrodynamic friction characteristics. The dependency on sliding velocity, average pressure and temperature was investigated. Systematic differences are observed between the measurements obtained by the different set-ups, which are discussed and related to design characteristics of the devices. The values obtained in this benchmark are comparable and may serve as a reference to evaluate other friction set-ups. The paper concludes with guidelines for the design of a friction tester. * Reproduced from: U. Sachs, R. Akkerman, K. Fetfatsidis, E. Vidal-Sallé, J. Ziegmann, S. Allaoui, G. Hivet, B. Maron, K. Vanclooster, S.V. Lomov. Characterization of the dynamic friction of woven fabrics: Experimental methods and benchmark results. Compos. Part Appl. Sci. Manuf., Vol. 67, pp. 289–298, Dec. 2014. Contribution of U. Sachs in this collaborative work: a) coordinator of the benchmark; b) collection and synthesis of the partner results; c) main author of the full text based on the test data and set-up characteristics supplied by the partners; d) analysis and conclusions.
9
10
Chapter 2. Friction in composites: Experimental methods and benchmark
2.1 Introduction Continuous fiber reinforced thermoplastic polymers provide advantageous properties, like a higher stiffness to weight ratio, compared to often-used metals for structural applications. Compared with their thermoset counterparts, they provide a better fracture toughness and infinite shelf life. Their ability to melt can also be exploited for automated forming and joining processes with relatively short cycle times, in the order of a few minutes. An example of such a process is sheet forming of thermoplastic composites in a hot press. The process of forming a flat laminate to a 3D shape induces a number of different deformation mechanisms in the laminate. These can be classified by the length scale in which they occur [1, 2]. The microscopic deformation mechanisms are the shear strain and elongation strain of each constituent (resin and fiber) and the contact mechanism between them. On a mesoscopic level the deformation may be perceived as fiber bending, resin percolation and transverse fiber flow. As the fiber redistribution and the change of the ply thickness is of less importance to describe the global deformation, it can be turned to a macroscopic description of the deformation mechanisms in terms of ply bending, in-plane and inter-ply shear. These are the most common descriptions in the literature, but other or additional definitions for the macroscopic mechanisms may be used, for example intra-ply extension or inter-ply rotation [1]. A delicate balance between the resistances to these deformation mechanisms determines the forming behavior of the laminate [3]. A precise characterization of these deformation mechanisms is necessary to accurately describe the composite forming process, to truly design for manufacturing in thermoplastic composites and to deploy their full potential. As a result, interply shear or friction between the laminate and the tools is an often-investigated mechanism and has led to numerous different testing devices and testing methods [4–9]. Literature that deals with inter-ply shear of composite sheets primarily focuses on wet friction, i.e. matrix in a molten state, while literature on dry friction of composite sheets, i.e. matrix in a solid state, is scarce. A short review of test methods of wet friction with controversial issues is presented next. Groves began investigating inter-ply shear using a Rheometrics Dynamic Spectrometer [4]. A stack of several plies was placed between two parallel disc platens and subsequently subjected to an oscillatory torsional deformation (Figure 2.1a), maintaining a constant temperature above the melting point of the polymeric resin. The resistance against shear can be calculated in terms of a dynamic viscosity from the measured torque and the rotation angle. Groves was able to relate the dynamic viscosity to the steady shear viscosity by describing the fluid behavior with a Maxwell model. His experiments also indicated that the shear deformation was not only restricted to inter-ply resin rich layers, but was also accompanied with intra-ply shear.
11
2.1. Introduction
� �
�
�
� �
�
� �
�
�
�
a) Groves [4], material: b) Scherer et al. [5], material: UD carbon PEEK and UD UD carbon PP. glass PEEK.
� � �
�
� �
�
�
�
�
c) Morris and Sun [6], material: UD AS4/PEEK.
�
� �
�
� �
� � d) Murtagh et al. [7], material: UD AS4/PEEK
Legend: a: composite specimen e: press
e) Lebrun [8], material: 2/2 twill glass/PP (Twintex® PP)
b: plate/ heated plate f: release film
Figure 2.1
�
� f) Gorczyca-Cole et al. [9], material: 2/2 twill glass/PP (Twintex® PP)
c: clamp g: climate chamber
d: steel foil h: axis of springs
Friction test set-ups in the literature.
Typically, for this type of composite the transverse shear stress increases with the shear velocity. Influences of the temperature or normal pressure were not considered, yet. Scherer et al. [5] determined the inter- and intra-ply shear by drawing a single ply out of a stack of plies (Figure 2.1b), maintaining a constant slip velocity. A hot platen press was used to keep the temperature constant and above melt temperature throughout the slip process. Only slight pressure was applied to ensure contact of
12
Chapter 2. Friction in composites: Experimental methods and benchmark
the heating platens with the specimen. Also here the shear stress increased with higher slip velocity. While Groves could not find large differences between crossply and parallel-ply configurations, the experiments of Scherer et al. did show a large influence of the lay-up of the composite. These experiments captured also the transient starting effects, showing a gradual increase of the shear stresses, until a steady-state situation was reached. Morris and Sun [6] prepared specimens consisting of two outer sublaminates and a central sublaminate. The specimen was clamped between two heated platens, by means of a clamp. The applied pressure was determined by strain gauges attached to the clamp and only acted on the overlap of the sublaminates (Figure 2.1c). The central sublaminate was pulled out during the test. These experiments led to an initial peak force which exceeds the later steady-state value, which was not observed in [5]. Both peak and steady-state stresses showed an exponential increase for increasing sliding velocities, while they were considerably decreasing when increasing the temperature from below the melt temperature to above the melt temperature. Against their expectations, increasing the normal pressure led to higher shear stresses. Morris and Sun suspected that the higher shear stress was caused by a decrease of the film thickness and frictional contact between adjacent plies. The measurement set-up designed by Murtagh et al. [7] is similar to that of Scherer et al. but the intra-ply shear is prevented by fixating the fibers of each ply, enforcing inter-ply slip between laminate and tooling, i.e. tool-ply slip (Figure 2.1d). Rather than using the shear stress, the results were expressed in terms of the apparent coefficient of friction (CoF), as it is the traditional method of presenting friction results [10]. The determination of the CoF is based on ASTM standard D1894 [11], which assumes a simple Amontons-Coulomb friction behavior. Murtagh et al. investigated the same material as Morris and Sun (AS4-PEEK), observing also an initial peak of the CoF and the same trends in velocity and pressure dependency. Increasing the temperature, however, led to an increase of the CoF, in contrast to the earlier reported results. This effect was ascribed to a thickness reduction of the resin rich interlayer. The experimental set-up used by Lebrun et al. [8] is similar to the one of Morris and Sun, investigating inter-ply shear as well as tool/ply shear (Figure 2.1e). The obtained results are largely in agreement with the previous studies. An increase in temperature, however, was found to slightly decrease the CoF in the case of interply shear, and to increase the CoF in the case of tool/ply shear. This contradicting observation was interpreted as an effect of Coulomb friction caused by tool-fiber interaction. In contrast to the previous set-ups Gorczyca-Cole et al. [9] applied a pull-through test, meaning that the test specimen sticks out at both ends of the test area, such that the sheared area does not decrease during the test and the applied pressure remains constant (Figure 2.1f). Furthermore, a uniform pressure distribution can be maintained. It was found that the friction behavior can be described by the Stribeck
2.2. Benchmark description
13
theory, which relates the CoF exclusively to the “Hersey” number, defined as:
H=
Uη , p
(2.1)
where U, η, and p, denote the shear velocity, matrix viscosity and normal pressure, respectively. These examples show that various custom-built set-ups were developed to determine the inter-ply and tool/ply shear behavior, all differing in design and sizes. Since no general standard exists for testing thermoplastic composites under process conditions, each research group developed their own procedure, resulting in different results for similar materials. A benchmark exercise was launched on the 13th Esaform conference (2010), to clarify whether design differences have a significant effect on the measurement results.
2.2 Benchmark description Different friction measurement devices were benchmarked by comparing the measured dynamic CoF values. The benchmark prescribes the material and the conditions to be applied, ensuring the comparability of all results. Still, the preparation of the samples and the detailed test procedure may vary for different devices, due to their characteristic properties and capabilities, e.g. size or heating power.
2.2.1 Material The friction coefficient between Twintex® PP and mild steel has been measured in this benchmark. The choice for Twintex® PP is taken, since it is readily available, and it was the subject of earlier investigations [8, 9, 12]. Moreover, its relatively low melting temperature is less demanding for the design of the friction test setup. Twintex® PP is a fabric consisting of commingled glass and polypropylene (PP) yarns. Dry fabrics and preconsolidated plates were kindly supplied by Vetrotex. Further material properties of the composite are given in Table 2.1. The linear count of filaments in warp and weft direction is equal, while the warp count and the weft count, which measures the number of fiber bundles per length and width respectively, are unequal. Figure 2.2a shows the geometrical unbalance, exhibiting a larger undulation of the smaller warp bundles than of the weft bundles. A commercially available mild steel foil M-Tech®F was used, to ensure equal metal surface properties for all test participants. Its material properties are given in
14
Chapter 2. Friction in composites: Experimental methods and benchmark Property Weight % glass Areal weight Plate thickness Weave type Warp count Weft count
Properties of Twintex®T PP 60 1485
Property Material Thickness Tolerance Standard Roughness Table 2.2
Value Mild steel 0.05 mm ±0.005 mm EN 10139 R a = 0.2 μm
Properties of the applied mild steel foil.
����
Table 2.1
Value 60 % 1485 g/m2 approx. 1 mm Balanced 2x2 twill 377 m−1 168 m−1
�� a)
�
Figure 2.2
�
�
�
b)
2x2 Twintex® glass polypropylene: a) preconsolidated plate and b) unconsolidated fabric.
Table 2.2. Before testing, the foil was cleaned by removing residual grease with an adequate solvent, e.g. acetone. Tests at ambient temperature were conducted with unconsolidated fabric, while preconsolidated plates were used for tests above the melting temperature. All participating research groups were provided with unconsolidated and preconsolidated Twintex® PP from the same batch, as well as steel foil. The viscosity (η) of neat polypropylene is required for the analysis of the experimental results. Polypropylene granulate of the same grade as the Twintex® PP matrix material was investigated by Vanclooster [12]. He determined the limits of process temperatures, reaching from the melting temperature of 165 ◦ C to 230 ◦ C, where the polypropylene starts to degrade. He also performed dynamic oscillatory shear experiments to characterize the bulk viscosity. The sinusoidal oscillation and material responses are written in complex form, resulting in a complex viscosity notation. The norm of the complex viscosity is plotted against the angular frequency in Figure 2.3 for different temperatures. The graphs show plateau values η0 at low shear rates. These values are used to characterize the temperature dependent material viscosity, used in further analyses.
2.2.2 Test matrix The test conditions are defined by temperature T, sliding velocity U, and average pressure p = N/A, where N denotes the normal force on the friction area A. The test
15
2.2. Benchmark description
� � �������� �
��� ��� ��� ��� ���
�� �� ��� �� ��� ��
��� ��
�
��
���������� � � Figure 2.3
Viscosity measurement of neat polypropylene measured by Vanclooster [12].
Parameter Temperature, ◦ C Pressure, kPa Velocity, mm/min Table 2.3
Dry friction Baseline Additional value values 23 20 10, 40, 100 60 20, 200, 1000
Wet friction Baseline Addtional value values 180 200, 220 20 10, 40, 100 60 20, 200, 1000
Test matrix for ambient temperature and above melting temperature.
matrix is given in Table 2.3 showing a set of test parameters which form the baseline conditions. In addition to the baseline conditions either the temperature, pressure or sliding velocity was varied. The additional values are also summarized in Table 2.3. The sliding direction was always parallel to the warp direction (Figure 2.2a). Pulling in weft direction has a higher risk of tearing the fabric apart [13], which can be explained by the low undulation of the weft yarns (Figure 2.2b), allowing the warp-yarns to slide easily along the weft direction. Experiments were performed in triplicate for each single condition.
2.2.3 Criteria Only the dynamic coefficient of friction was determined for friction at ambient temperature, since the static coefficient of friction, which may differ only slightly from the dynamic coefficient, could not be measured by every research group. This is described in more detail in Section 2.4. Both types of friction were investigated for experiments conducted above the melt temperature.
16
Chapter 2. Friction in composites: Experimental methods and benchmark
L×W [mm×mm] Area [mm2 ]
TU Clausthal 100×100
KU Leuven 80×80
UML
TU Dresden 150×20
University of Twente 50×50
University of Orléans 40×40
INSA Lyon 15×20
10000
6400
4000
3000
2500
1600
300
Table 2.4
Dimensions of the nominal friction area A per group.
2.3 Measurement devices of participants All participants have developed their own set-up, which measures the friction force Ff between the test materials, while keeping the normal force N, sliding velocity U and temperature T constant. Differences between the set-ups are the size of the friction area A, ranging from 300 to 10000 mm2 (summarized in Table 2.4), and the mechanism that distributes the normal force over the friction area. Details about the mechanims of each set-up are presented in the following subsections.
2.3.1 University of Twente The measurement device developed at the University of Twente [14] (Figure 2.4a) operates in a universal testing machine. A flexible pneumatic actuator supplies the normal load N in a self-aligning system. The normal load is measured by three load cells, which also allow to record resulting moments exerted around the center of gravity of the contact surface. Thick blocks minimize the tool deflection, whereas the overlapping edges are used to pre-heat the laminate before it enters the friction area, A, of 2500 mm2 . Temperatures are measured in both blocks with multiple thermocouples. The homogeneity of the pressure and the temperature field was investigated and optimized [15, 16].
2.3.2 University of Massachusetts Lowell The University of Massachusetts Lowell (UML) has designed a set-up (Figure 2.4b) that encloses the entire test specimen between the pressure plates throughout the experiment. This leads to a constant average pressure, since the size of the friction area remains constant, which is 4000 mm2 . However, the normal force is not acting on the center of the test area, which leads to a non-uniform pressure distribution. The normal force, exerted by an air-spring system, is feedback controlled by compression load cells. The measurement device was designed to apply sliding velocities U up to 5000 mm/min and pressures p of more than 1.8 MPa. The benchmark conditions are at the lower end of this device’s processing window,
2.3. Measurement devices of participants
17
resulting in noise in the measured data. The noise was reduced by post-processing the data.
2.3.3 TU Clausthal The experimental set-up at the Clausthal University of Technology (Figure 2.4c) consists of two parallel vertical steel plates of 10000 mm2 , which can be displaced laterally along the sides of a horizontal base plate. Composite laminates are mounted on both steel plates, by means of double sided adhesive tape. A moving part intended to be pulled out during the experiment (in this case the steel foil) is positioned and clamped between the parallel plates. The cumulative clamping force N is applied by means of four linear elastic compression springs. The compression of each spring can be regulated by tightening or loosening the adjusting nuts. The set-up is mounted in a universal testing machine equipped with a 10 kN load cell to measure the pulling force Ff . The crosshead of the universal testing machine is position controlled and moves with a constant velocity U.
2.3.4 Université d’Orléans The principle of the apparatus used at the University of Orléans [17] is shown in Figure 2.4d. It has been designed to characterize the frictional behavior of fabric/fabric, fabric/steel and yarn/yarn friction. It is based on two plane surfaces sliding relative to each other, making contact over an area of 1600 mm2 . The bottom specimen is fixed on a rigidly and accurately guided steel plate. The required velocity is imposed by an electronic controlled motor. The top specimen is fixed on a steel plate which is linked to the load sensor. A rubber damper is chosen to limit the vibrations and enable a smoother signal. A dead weight provides the constant normal load N. A calibration procedure determines the optimal position of the dead weight to obtain a uniform pressure distribution on the contact area. The angle between the samples can be adjusted by rotating the upper sample. In addition, the contact surfaces can be reduced in order to achieve higher pressure contact.
2.3.5 INSA Lyon The testing device designed at INSA Lyon is presented in Figure 2.4e. The top specimen is mounted under a static specimen holder, having a size of 300 mm2 . A table carrying the bottom specimen is displaced laterally by a pneumatic actuator. A linear variable differential transformer (LVDT) measures the displacement of the table, while a load cell measures the load exerted by the actuator. Another load sensor measures the normal load. To obtain the net friction force Ff , the resistance
18
Chapter 2. Friction in composites: Experimental methods and benchmark
of the table guidance needs to be subtracted from the actuator load. The guidance resistance is determined prior to the friction experiment, by applying only weights on the table, which are equivalent to the normal load. The angle between the two specimens (i.e. sliding orientation) can be adjusted by rotating the static specimen holder. Since the sliding velocity is governed by the air pressure, it can be spoken of as a force controlled system.
2.3.6 TU Dresden A textile friction measurement device was developed at the University of Dresden, which is applicable for universal testing machines. The maximum possible sliding velocity is 1000 mm/min. The specimen is pulled through an upper and a lower stamp of 3000 mm2 , on which a metal foil is fixed (Figure 2.4f). It is possible to regulate the normal pressure with a dead weight or with a pneumatic cylinder for higher pressures. A dead weight was used for the benchmark experiments reported here. The temperature is controlled by placing the entire set-up into the oven of the universal testing machine. The device’s resistance induced by the pulleys and steel wire bending was determined, and a correction on the pulling force was applied.
2.3.7 KU Leuven Figure 2.4g presents the set-up of the pull-out machine used at the University of Leuven. It consists of two temperature controlled steel plates, which are mounted in a frame, installed in a universal testing machine. The normal force on the specimens is applied by a hydraulic cylinder. The homogeneity and the magnitude of the pressure and the temperature field were verified for the starting position of the test configuration [12]. In contrast to the other set-ups, the friction area of initially 6400 mm2 does not remain constant, but decreases while the specimen is pulled out, leading to an increasing average pressure as the test proceeds. Simultaneaously, a non-uniform pressure distribution is to be expected, when the static normal force is no longer acting in the center of the upwards moving test area.
19
2.3. Measurement devices of participants ����������� � � �� ��� ����� ����� �� ���������� � �
���������� � �� ��� �� ���� ���� �� �� �
���� �� ��� ��� � ���������� � ��
���� ����
����� �� ���� ���� ����� � � ��� �� �� ����� ���� � ���
a) University of Twente
b) University of Massachusetts Lowell
� ����� ������������ ��
� ��� �����
��
� �� ������� ����
�� �������� ���
c) TU Clausthal
�������� ��
������ ���� ��
d) University of Orléans
�������� ��
����� ������������ � �� ���� � ������� �
��� �������� � � �� ������ �
����� ��� � �� ���� ������� ����� ����������� ��
e) INSA Lyon
f) TU Dresden
� ������ � ��� � ��� �������
�������� � �� �� ����������� ����� � �������� � � � �������� ��� ���� g) KU Leuven Figure 2.4
Schematic representation of the friction test set-ups of the benchmark participants.
20
Chapter 2. Friction in composites: Experimental methods and benchmark
2.4 Results for dry friction 2.4.1 Results Five benchmark participants have conducted dry friction measurements. An example of friction measurements obtained by TU Clausthal, University of Twente, University of Orléans and UML is shown in Figure 2.5. A steady-state CoF is reached after a short start transition. University of Twente and UML measured a gradual increase at the start, which may be explained by the stretching of the Twintex® PP fabric that is pulled. University of Orléans and TU Clausthal mounted the fabric to the pressure plates instead, which is a good measure to reduce the stretch of the fabric. These setups were able to measure a minor friction peak, that is considered as the initial static friction. In this paper we focus on the dynamic friction. The summarized results are presented in Figure 2.6. The CoF values measured by the participants differ from 7 to 32 %. The smallest difference is observed with 60 mm/min sliding velocity and 20 kPa pressure, while the highest difference occurs at 1000 mm/min and 20 kPa. Most research groups achieved small standard deviations with an average coefficient of variation of less than 5 %. University of Twente, University of Orléans and TU Clausthal measured a slight decrease of the CoF when increasing the pressure at low sliding velocities (Figure 2.6b). This trend, however, is not observed at high sliding velocities (Figure 2.6c).
� ���������
��������� �
�����
���
��������� � �������
��� ����
��� !"
��� ���� ���
����
����# �����
� �
Figure 2.5
��
�� �� #��$��%�&��� &&"
��
��
Exemplary friction measurement conducted at T = 23 ◦ C; p = 20 kPa and U ≥ 200 mm/min. TU Clausthal and University of Orléans observed a minor friction peak. The steady-state friction is defined arbitrarily between 20 and 30 mm displacement.
21
2.4. Results for dry friction TU Clausthal
University of Twente
University of Orléans
U � � ������
p � �� ���
UML
INSA Lyon
U � �$��%���� ������ U � ���� ������
���
�� �
���� ��� ���� ��� ���� � ��
Figure 2.6
��
� ���
�� �� ��
!"���#"� ����
������� �������� �������
�&
��
'&
� ���
�� ��
!"���#"� ����
!"���#"� ����
�&
� $�
�&
Steady-state friction coefficients for dry friction experiments, a) at p = 20 kPa and varying velocity, b) at U = 60 mm/min and varying average pressure, c) at U = 840 mm/min (UML) and U = 1000 mm/min (TU Clausthal, University of Twente and University of Orléans), d) at U = 2400 mm/min (INSA Lyon).
2.4.2 Discussion The low coefficient of variation indicates a high measurement precision, which signifies a good reproducibility of repeated CoF measurements, as it is commonly defined [18]. But it does not necessarily indicate a high measurement accuracy in measuring the true CoF. Moreover, a systematic error may be present, which becomes clear by the systematic differences among the research groups. Values of TU Clausthal are constantly lower than those of the University of Orléans, while most values of UTwente lie in-between. Despite an uncertain offset, it can be concluded that the friction behavior is fairly well described with the Amontons-Coulomb model, which states that the CoF is independent of the sliding velocity and normal force, for the range considered in this study. The measured values at 20 kPa pressure and sliding velocities between 20 and 1000 mm/min (Figure 2.6), remain between 0.18 and 0.26 without exhibiting a clear trend. The CoFs at the highest sliding velocity of 2400 mm/min measured by INSA Lyon, are relatively low and exhibit large standard deviations. The comparatively small nominal friction area (see Table 2.4) leads to friction forces of small magnitude, which might lead to precision problems, if spurious (e.g. edge) effects do not scale down with the friction area in the same degree. In general, attention has to be paid to the structural rigidity of the friction set-up. As it was shown by Ten Thije and Akkerman [14] a deflection of the pressure plates may have substantial influence on the pressure distribution. Likewise, misalignments of the friction surface caused by the friction force have to be considered. Figure 2.7a
22
a) Figure 2.7
Chapter 2. Friction in composites: Experimental methods and benchmark
b)
c)
a) misalignment due to friction force and compliant supporting structure; diminishing the rotating moment on the pressure plate by b) a low offset from reaction force and friction surface or c) a repositioning of the normal force.
shows a concept of a test set-up with a high offset from the pressure plate support to the friction surface. The degree of rotation of the plate depends on the structural stiffness in lateral direction, and will result in a pressure gradient over the friction area. The misalignment can either be avoided by a high structural stiffness, or by diminishing the rotating moment itself. The latter can be achieved by supporting the pressure plate close to the friction surface as shown in Figure 2.7b, and is realized by University of Twente and KU Leuven by clamping the outer specimens directly to the support structure and not to the pressure plate (Figure 2.4a and Figure 2.4g). Another solution to reduce the rotating moment is to adapt the position of the normal force N, as shown in Figure 2.7c. University of Orléans has accomplished this by an optimal positioning of the dead weight, to regulate the center of gravity of the structure (i.e. dead weight, specimen holder and top specimen) (Figure 2.4d). Its positioning depends on the magnitude of the friction and the normal force and requires a calibration procedure. The set-up of INSA Lyon, on the other hand, relies on a stiff guidance of the static specimen holder, since the support has comparatively high offset to the friction surface (Figure 2.4e). Excluding INSA Lyon, the friction coefficients appear to be larger when the friction surface is smaller. This might be caused by spurious edge effects which scale with the length of the block edges and not with the friction surface. In the case of a pull-through experiment, new material that is pulled into the contact area needs to be compressed or is subjected to additional shear. UML and TU Clausthal have minimized this effect by letting the metal surface entering the contact area, which is smooth and incompressible compared to the Twintex® PP fabric. University of Twente applies chamfered edges and the steel foil to guide the fabric into the contact area. Also, University of Orléans and INSA Lyon have designed their top specimen holder with rounded edges, to reduce edge effects. All friction testers in the benchmark have in common that the normal force is applied on a fixed position. Therefore, a static sliding contact area allows for better maintenance of a uniform pressure. UML has a moving contact area, and a changing gradient in the pressure distribution is conceivable. Nevertheless, the experimental
23
2.5. Results for wet friction
results for the Twintex® PP fabric do not seem to be affected during the tests at UML (Figure 2.5).
2.5 Results for wet friction 2.5.1 Results In contrast to the dry friction experiments of Twintex® PP fabric, the wet friction results show a hydrodynamic friction behavior, similar to the findings of other researchers [8, 9, 19], who examined the same material. A typical example of these friction experiments is shown in Figure 2.8, showing an initial friction peak and a tendency towards a steady state at the end of the experiment. Both states of friction, denoted as the peak CoF and the steady-state CoF respectively, are investigated in this benchmark. Figure 2.9 summarizes the peak and the steady-state values of the CoF under the tested conditions. The steady state is defined between 20 and 40 mm displacement for measurements performed by UTwente and KU Leuven. The KU Leuven results were obtained for variable conditions during the experiment and required extra post processing, as will be discussed in the next section. For TU Dresden a steady state is reached between 55 and 70 mm displacement. Both the peak and the steady-state CoF exhibit typical hydrodynamic trends, as their values increase with increasing velocity and decreasing pressure. In general, an increasing temperature leads to decreasing CoF values. ��!�"����� #�$%����
$ �&"�����
' �(�)!��
��
������
��
������
� ����
���
������
��� ��� ��� ��� ���
������������
� �
Figure 2.8
��
��
�� �� �����������������
������������ ��
��
�
Exemplary friction measurement conducted at T = 180 ◦ C; p = 20 kPa and U = 60 mm/min measured by three different benchmark participants, KU Leuven has varying pressure conditions.
24
Chapter 2. Friction in composites: Experimental methods and benchmark University of Twente
�����#&������ � �$&%
�
TU Dresden
'#����#�����������
KU Leuven
��� � ����������
��� � ���� �
���
��� � ����������
������������������� ������������� ������
��� ��� ��� � ��
��� � � �$&%
�(
����
��
��
��
���
���
�!"
���
���
������������$� %
��� � ���� �
��� � ����������
��� � ����������
��
Figure 2.9
���
����������������$ �%
� ��� ��� ��� ��� � ��� ��� ��� ��� �
)(
��
���������������#�$������%
��
���
����
���������������#�$������%
��
��
��
���
����������������$ �%
���
���
���
���
�������������$� %
a) Steady-state and b) peak coefficients of friction for the wet friction experiments. The KU Leuven steady-state results were determined from Figure 2.10.
Additionally, an analytical model can be applied [19] to predict the steady-state friction. The model is based on shear flow calculations of the thermoplastic matrix. The flow is confined by an idealized geometry that represents the fiber bundles of the reinforcement and the flat metal surface. Model and experimental results show the same trends (Figure 2.9a).
2.5.2 Discussion The temperature dependency of the friction is different from Lebrun’s findings [8]. While the benchmark participants have found a decreasing effect on the friction, Lebrun’s experiments showed an increasing effect. What looks contradictory at first glance, might be explicable by slightly different test conditions. Lebrun applies a higher average pressure and a lower pull velocity (p = 70 kPa and U = 20 mm/min).
25
2.5. Results for wet friction ��� ��
������ ��������� � �
����
���� �
� �
�� � �
����
���
���� �
� �
�� � �
� �
� �!� ���! �� �!�
�� �
����!�
����� �����
����
���� ���� �
Figure 2.10
�
�� ����������� ��
��
��
KU Leuven. Experimental results (bold line segments) for the steady-state CoF versus the average pressure, measured at T = 180 ◦ C, 195 ◦ C, 210 ◦ C and U = 60 mm/min, between 20 and 40 mm displacement. The fitted curve (Eq. (2.2)) for 180 ◦ C was used to determine the CoF values for p = 10, 20, 40 and 100 kPa (the square symbols), as presented in Figure 2.9.
For these conditions and a matrix viscosity at a temperature of 200 ◦ C, the analytical model predicts a remaining thermoplastic film thickness between the glass fabric and the metal surface of 25 μm. This approaches the filament diameter of the glass fibers, which is seen by Ten Thije et al. [19] as the transition point between pure hydrodynamic lubrication and mixed lubrication. Also, Lebrun assumed contact between metal and fiber as a reason for his unexpected results. The peak friction shows the same trends caused by velocity, pressure and temperature variation as the steady-state friction. Murtagh, who observed the initial peak friction for APC-2 composites, interpreted this phenomenon as an adhesive bond that has to be overcome. He suggested that the creation of the bond is caused by the intimate contact between the composite and the metal surface while the set-up is heated up [7]. Morris and Sun, who also refer to it as a yield stress, showed that the initial yield strength can be recovered after ceasing the motion for only 10 seconds [6]. Therefore, the initial peak should be largely independent of the heat-up duration, provided that no polymer degradation takes place. Another cause of the transient maximum stress might be the rheological behavior of a viscoelastic fluid. The same kind of shear stress growth, that is observed in the friction experiments, is exhibited by many polymeric fluids upon the inception of a steady shear flow [20]. Additionally, the subsequent stress decrease to a steady-state value might be supported by a gradual development of the lubricating layer. Comparing the friction data obtained by the different benchmark participants, a certain agreement of peak and steady-state friction values between University of Twente and TU Dresden can be seen in Figure 2.9b from their intersecting confidence intervals (twice the standard deviation). This might be surprising when
26
Chapter 2. Friction in composites: Experimental methods and benchmark
considering the example measurement of the two institutes shown in Figure 2.8. The measurement curve obtained by TU Dresden reaches the peak and steady-state values at a much later state and exhibits more noise. This indicates stretching of the specimen, which is heated entirely in a heating chamber. Since force and displacement sensors need to be protected from the heat, they are placed at a safe distance from the specimen, adding an extra compliance of the transmission to the measurement. A small inconsistency in the measurements of the TU Dresden may be suspected, since the data point at the test condition of 20 kPa, 60 mm/min and 180 ◦ C forms a local minimum in one of the trend curves of the steady state and the peak CoF. This inconsistency does not go along with a noticeable high standard deviation and may therefore be attributed to a systematic error appearing for low sliding velocities. For such complex set-ups it is very difficult to isolate the origin of this error, and a very strict testing procedure may help, at least for obtaining consistent results. The measurements obtained by KU Leuven cannot be compared directly with the other measurements, because most tests are performed at 195 ◦ C instead of 180 ◦ C while adopting a pull-out instead of a pull-through test configuration (compare Figure 2.4a, f and g). This implies a gradual decrease of the friction area from initially 80 × 80 mm2 to 40 × 80 mm2 after 40 mm displacement. The applied normal force remains constant during the test, resulting in a progressive increase of the average pressure. Strictly speaking, a steady-state condition is not reached as can be seen in Figure 2.8. The measurement curve obtained by KU Leuven while applying a constant normal force of around 100 N remains in decline after 20 mm displacement, due to the pressure increase. Assuming that the rate of pressure change is sufficiently low, a “quasi-steady state” may be reached. Consequently, the “steady-state” CoF (between 20 and 40 mm displacement) can be plotted as a function of the current average pressure on a double logarithmic scale, represented by the thick line segments in Figure 2.10. Indeed, it appears that the curves for different normal forces, obtained at 195 ◦ C and 60 mm/min sliding velocity, are well in line, meaning that the steadystate CoF is fairly independent on the displacement. The line segments were curve fitted with a power law, μ = C ( T ) · p¯ n ,
(2.2)
with μ as the CoF and p¯ as the average pressure, showing good correlation with the experimental results. The fitted curve for 180 ◦ C was used to estimate the KU Leuven values, presented in 2.9a for U = 60 mm/min. It should be noted that we are only comparing conditions between 20 and 40 mm displacement. Influences by the displacement on the CoF may still be significant during the first 20 mm of displacement, and different for the various test set-ups. The curves in Figure 2.10 can be described closely by a power law. Considering that the lines for different temperatures should not intersect, the exponents have to be equal. Based on these
2.5. Results for wet friction
27
considerations, it was possible to extrapolate the steady-state CoF for 180 ◦ C to different pressures as was done to obtain Figure 2.9a. The steady-state values of KU Leuven represented in Figure 2.9 are in general higher than those of UTwente and show a stronger dependency on pressure and temperature. The high standard deviation of the TU Dresden results make it hard to distinguish the trends. A definite conclusion cannot be drawn from the limited number of data points that are compared with each other in these graphs. For the ease of comparability, a representation of all data points in a master curve is beneficial. The Stribeck curve can be used for this purpose [9]. It relates the CoF to a single parameter, known as the “Hersey” number. Its definition (2.1) requires the quantification of the matrix viscosity η of the neat thermoplastic resin. Its value is approximated by the zero shear viscosity η0 (given in Figure 2.3), since the actual viscosity depends on the unknown shear rates within the resin. In this way the effect of the temperature T on the coefficient of friction is considered. The Stribeck plot of all high temperature friction test results is presented in Figure 2.11. A Stribeck curve representation is very accurate for the applied hydrodynamic lubrication model as indicated by the high R-value of the exponential fit in Figure 2.11a. Besides the steady-state friction predicted by the model, the measured data from UTwente and KU Leuven are also closely approximated by an exponential function. The data from TU Dresden on the other hand exhibits a significantly lower R-value. The deviation from the model behavior might be caused by effects that are not considered in the model, like edge effects, uneven pressure or temperature distribution or stretching of the composite fabric. The differences between UTwente and KU Leuven are slightly more pronounced for the steady-state than for the peak CoFs. This might be caused by an inhomogeneous pressure distribution, that is likely to develop during an experiment with a pull-out configuration. Ten Thije and Akkerman [15] have shown by means of numerical models that different pressure distributions with an identical average pressure can influence the apparent hydrodynamic friction coefficient significantly. Therefore, it is important to evaluate the pressure and temperature distributions of the set-up thoroughly. This poses a challenge, especially when they are expected to be influenced by the friction dynamics. Also edge effects can play a role, in particular at the location where virgin material is pulled into the contact area.
28
Chapter 2. Friction in composites: Experimental methods and benchmark ���
��*!�� �*���+#,�'�(
��
��������� ��
���� �����
����� ���� ��
���� �� ��
��
��
�� ��� !��
���������
������� �������� ���
���� ��� �
��
"#!�$
��
��������� ���
���� ����
� � ���
����
*/
����
����
%�� �����"&���'"()
���
���������
-�*.�+#,�'�(
��
���������� � �
���� �� ��
��
��
��
������� ������� � ���
���� �����
�� ��� !�� ��������� ���
���� � ���
��
� � ���
����
&/
����
����
%�� �����"&���'"()
Figure 2.11
Stribeck curve, a) steady-state, b) peak friction.
2.6 Conclusions & Recommendations A comparison between different friction test set-ups for thermoplastic composites was made in a friction benchmark exercise. All participants used the same Twintex® PP material and started from the same predefined test conditions. Two different types of friction have been tested: dry friction at ambient temperature, which is an Amontons-Coulomb-like friction, and hydrodynamic friction at temperatures above the melting point of the resin. The measurement results of the benchmark participants were fairly consistent. For the dry friction experiments, the resulting CoFs of the participating 7 research groups did not deviate more than 5 % from the measured average CoF. However, the results do reveal the presence of systematic errors, since one research group measured consistently higher CoFs than another. This was attributed to edge effects and the size of the friction surface. Uneven
References
29
pressure distributions due to the set-up design have no significant influence on Amontons-Coulomb friction, but do play a role in the hydrodynamic lubricated friction. The hydrodynamic friction behavior can be described with a master curve known as a Stribeck curve. Measurement data of the considered material obtained by two different research groups are well approximated by such a master curve, where one group uses a pull-out set-up while the other group uses a pull-through set-up. A slightly better agreement between the pull-out and the pull-through test results is observed for the peak CoF, than for the steady-state CoF, which might be related to the development of uneven pressure distributions in pull-out tests. The current benchmark suggests that friction measurements improve with certain design characteristics of the set-up. Larger friction surfaces reduce the influence of edge effects. Also, chamfered edges or pulling the metal foil instead of the composite material can minimize these edge effects. To enhance the start-up response to initial effects, the stretch of fabric has to be limited, e.g. by fixing it rigidly to a surface and using steel foil as the inner specimen that is pulled out. Local heating of the specimen reduces excessive heating times and allows a more immediate measurement of displacement and forces by sensors near the test specimen. Attention should be paid to a uniform pressure and temperature distribution. A pull-through design supports uniform pressure distributions, while additional arrangements need to be made to preheat the regions of the specimen material that is initially outside but pulled in between the friction surface.
References [1] P. Harrison, M. J. Clifford, Chapter 3 Rheological behaviour of pre-impregnated textile composites, in: Design and manufacture of textile composites, Woodhead Publishing Ltd., Cambridge, UK, 2005, pp. 110–148. [2] K. Friedrich, M. Hou, J. Krebs, Chapter 4 Thermoforming of continuous fibre/thermoplastic composite sheets, in: Composite Sheet Forming, Vol. 11, Elsevier, 1997, pp. 91–162. [3] S. P. Haanappel, Forming of UD fibre reinforced thermoplastics, Ph.D. thesis, University of Twente, Enschede, The Netherlands (Apr. 2013). [4] D. J. Groves, A characterization of shear flow in continuous fibre thermoplastic laminates, Composites 20 (1) (1989) 28–32. [5] R. Scherer, K. Friedrich, Inter- and intraply-slip flow processes during thermoforming of CF/PP-laminates, Composites Manufacturing 2 (2) (1991) 92– 96. [6] S. R. Morris, C. T. Sun, An investigation of interply slip behaviour in AS4/PEEK at forming temperatures, Composites Manufacturing 5 (4) (1994) 217–224.
30
Chapter 2. Friction in composites: Experimental methods and benchmark
[7] A. M. Murtagh, J. J. Lennon, P. J. Mallon, Surface friction effects related to pressforming of continuous fibre thermoplastic composites, Composites Manufacturing 6 (34) (1995) 169–175. [8] G. Lebrun, M. N. Bureau, J. Denault, Thermoforming-stamping of continuous glass Fiber/Polypropylene composites: Interlaminar and Tool-Laminate shear properties, Journal of Thermoplastic Composite Materials 17 (2) (2004) 137–165. [9] J. L. Gorczyca-Cole, J. A. Sherwood, J. Chen, A friction model for thermostamping commingled glass-polypropylene woven fabrics, Composites Part A: Applied Science and Manufacturing 38 (2) (2007) 393–406. [10] A. M. Murtagh, P. J. Mallon, Chapter 5 Characterisation of shearing and frictional behaviour during sheet forming, in: Composite Sheet Forming, Vol. 11, Elsevier, 1997, pp. 163–216. [11] D20 Committee, Test method for static and kinetic coefficients of friction of plastic film and sheeting, Tech. rep., ASTM International (2001). [12] K. Vanclooster, Forming of multilayered fabric reinforced thermoplastic composites, Ph.D. thesis, KU Leuven, Leuven, Belgium (2010). [13] M. P. Ubbink, Tool-ply friction of woven fabric composites, M.Sc. thesis, University of Twente, Enschede, The Netherlands (Jul. 2006). [14] R. Akkerman, R. H. W. ten Thije, U. Sachs, M. De Rooij, Friction in textile thermoplastic composites forming, in: Proceedings of the 10th International Conference on Textile Composites - TEXCOMP 10: Recent Advances in Textile Composites, 2010, pp. 271–279. [15] R. H. W. ten Thije, R. Akkerman, Design of an experimental setup to measure tool-ply and ply-ply friction in thermoplastic laminates, International Journal of Material Forming 2 (2009) 197–200. [16] P. Jannink, Karakteriseren van materiaalgedrag van vezelversterkte thermoplasten onder smelt, M.Sc. thesis, Saxion University of Applied Science, Enschede, The Netherlands (Sep. 2009). [17] G. Hivet, S. Allaoui, B. Cam, P. Ouagne, D. Soulat, Design and potentiality of an apparatus for measuring yarn/yarn and fabric/fabric friction, Experimental Mechanics 52 (8) (2012) 1123–1136. [18] B. Brinkmann, Internationales Wörterbuch der Metrologie: Grundlegende und allgemeine Begriffe und zugeordnete Benennungen (VIM) Deutsch-englische Fassung ISO/IEC-Leitfaden 99: 2007, Beuth Verlag, 2012. [19] R. H. W. ten Thije, R. Akkerman, M. P. Ubbink, L. van der Meer, A lubrication approach to friction in thermoplastic composites forming processes, Composites Part A: Applied Science and Manufacturing 42 (8) (2011) 950–960. [20] R. B. Bird, R. C. Armstrong, O. Hassager, Dynamics of polymeric liquids, 2nd Edition, Vol. 1 Fluid mechanics, John Wiley and Sons Inc., New York, NY, 1987.
Chapter 3 Friction characterization of woven thermoplastic composite in hot press forming* Abstract The friction coefficient of carbon fabric reinforced polyetheretherketone and polyphenylene sulfide, as well as glass fabric reinforced polyphenylene sulfide is measured under hot-press forming conditions. The effect of different sliding velocities, normal pressures and temperatures is taken into account as well as fabric orientation and material layout, i.e. shear between composite and metal tooling or between two composite layers. The measured friction behavior is analyzed and compared by means of a physical model, that calculates the steady-state resin flow in the interlayer, which is subjected to shear. Together with the geometry of the weave, the viscosity governs the frictional behavior of the composite. A good agreement between model and experiment is found. The transient peak friction and steady-state friction coefficients can be characterized well with the Stribeck curve theory.
* Reproduced from: U. Sachs, R. Akkerman, A.D. Rietman. Friction characterization of woven thermoplastic composite in hot press forming. Submitted to Composites Part A: Applied Science and Manufacturing, 2014.
31
32
Chapter 3. Friction characterization of woven composite
3.1 Introduction After being applied in the aerospace industry for several years, thermoplastic composites are now becoming more of interest for the automotive industry as well, caused by several key reasons. Fiber reinforced thermoplastics offer higher impact toughness than their thermoset counterparts, while having similar specific strength and stiffness. The high raw material costs and high fabrication and assembly costs, on the other hand, are the number one restriction to broader applications of composites [1, 2]. The ability to thermoform and fusion weld thermoplastics allows rapid automated production processes without the use of an autoclave, allowing lower production costs compared to thermosets composites [3]. The advantages apply in particular to hot-press forming. In this process, flat laminates are heated in, for example, an infrared oven to the desired temperature, and are subsequently stamp formed and consolidated under high pressure in a molding press. This process cycle takes normally less than 5 minutes and is mainly determined by the heating time [4, 5]. The continuous fiber reinforcements like glass and carbon, which are virtually inextensible, induce that the formability of the composite laminate is limited. Most often this limit is observed when wrinkles start to occur. These defects can be observed in 3-D stamp forming doubly curved geometries [6, 7], and may introduce weak spots in the product but may also lead to mold closing problems. To predict and avoid wrinkling is a major effort, requiring a thorough understanding of the deformation mechanisms in the forming process. As the forming involves a complex interaction of several forming mechanisms, predictions are performed by computational means, requiring proper material models and a correct characterization of the material properties [8]. One of the essential deformation mechanisms is the inter-ply and tool-ply slip, also referred to as friction, which was investigated for different materials, utilizing various experimental set-ups. The majority of the research was conducted on UD carbon PEEK and Twintex® PP (glass-fabric reinforced polypropylene). Table 3.1 summarizes the available literature on these investigations. These studies have shown that friction properties of thermoplastic composites are dependent on the process conditions (i.e. sliding velocity, normal pressure, and temperature) but also on the contact configuration, which includes the structure and fiber orientation of the composite plies and whether ply/metal or ply/ply contact is present. Fabric reinforced materials are often used for press forming 3-D shapes, since they possess a better drapability than unidirectional material [5, 8]. The current paper presents friction data of three fabric reinforced materials, two carbon fabric reinforced composites with matrices of polyphenylene sulfide (PPS) and polyether ether ketone (PEEK), as well as a glass-fabric reinforced PPS composite. This is the first publication containing frictional properties of fabric PEEK composites. The choice for PPS and PEEK composites is motivated by their good mechanical and chemical properties
33
3.1. Introduction Material UD carbon PEEK UD carbon PP Twintex® PP
References Groves [9], Morris and Sun [10], Murtagh et al. [11] Scherer and Friedrich [12] Gorczyca-Cole et al. [13], Ten Thije et al. [14], Vanclooster [15], Sachs et al. [16] Ten Thije et al. [14] Robroek [17]
8HS glass PPS 8HS glass PEI Table 3.1
Literature summary related to friction with various materials.
p�x�
z x Figure 3.1
u�x,z� U
Model description of the thermoplastic melt flow along transverse fiber bundles.
[18], making them suitable for high-performance application. The utilized test setup to measure the frictional properties was evaluated thoroughly in the scope of an earlier benchmark research [16], which provides confidence in the accuracy of the measurements. The frictional properties of the investigated materials are compared with predictions of an analytical model proposed by Ten Thije et al. [19] that is based on the flow field calculations of the molten resin. The properties are determined at different contact configurations and process conditions. The model is based on the thin-film lubrication theory to assess the pressure and shear stress in the molten matrix. The matrix serves as a lubricant between two solid surfaces, in this case woven fabric and metal tooling. Figure 3.1 displays the idealized geometry of a yarn, described as an elliptic shape with a lateral width 2a and vertical height 2b. The thickness of the resin film h( x ), is therefore defined by the geometry of the yarn and a spatial constant offset hmin . Consider a fixed yarn position and a smooth surface moving with velocity U from left to right. Hydrodynamic pressure p( x ) is developing in the flow as the resin is dragged through the contraction. Overall, the pressure decreases when the offset hmin increases, which regulates itself until the sum of net of flow pressure and the externally applied pressure are in equilibrium. The permeability of the fiber bundles is assumed to be negligible, such that no resin flows through the channel boundaries. Furthermore, a no-slip condition on these boundaries is assumed. For the thin-film approach, pressure and viscosity variation as well as resin flow in the normal direction (z-direction) are neglected, i.e. they are only functions of x. Also, flow across the x-z-plane is not accounted for, which leads
34
Chapter 3. Friction characterization of woven composite
to the simplified Reynolds equation: ∂ ∂x
�
h3 ∂p η ∂x
�
= 6U
∂h . ∂x
(3.1)
Its derivation and the solution for the pressure profile p( x ) by applying the so-called Reynolds boundary condition can be found elsewhere [20]. The velocity profile u( x, z) is obtained by considering the force equilibrium on a volume element: ∂p ∂2 u = η 2, ∂x ∂z
(3.2)
and applying the no-slip condition on the boundaries. Finally, the normal load N and the friction force Ff are obtained by integrating the pressure p( x ) and the shear stress τ ( x ) = η ∂u ∂z over the x-y-surface. The model is only capable of determining the steady-state friction coefficient, as it assumes all forces to be in equilibrium.
3.2 Set-up Figure 3.2 shows schematic and photographic representations of the custom designed friction tester, which is mounted in a universal testing machine [16]. The left figure describes the mechanics, in which the movable pressure block is actuated by an expanding pneumatic bellow towards the fixed pressure block. The normal force is measured by three load cells, which are arranged in a triangle. The flexible bellow together with the free hanging suspension allows the blocks to align themselves automatically. Their thickness of 30 mm prevents inadmissible deflection and ensures an even pressure distribution [21]. Four linear variable differential transformers (LVDT) measure the distance between the blocks and any discrepancies in the alignment. They are held in ceramic bushings and are actuated via glass rods, to ����� ��� ���� � ������������
���
������
���� ����� �� �
� ������� �� � ����������
���
��
Figure 3.2
���� � ��
��
��������� ������� ��
Schematic representation of the applied friction test set-up. Left: illustration of the mechanics. Center: description of the relevant friction conditions. Right: photographic presentation.
35
3.3. Materials
keep them thermally insulated from the heated pressure blocks. The test specimen is assembled with an inner composite laminate and an outer part. Depending on whether inter-ply slip or tool-ply slip is investigated, the outer part consists of metal foils or composite plies, respectively. The test specimen components are sketched in the center of Figure 3.2. The specimen is clamped between the preheated pressure blocks with a normal force N, causing an average pressure p on the contact surface A. Thermocouples and heating elements are embedded inside the pressure blocks, with thermocouples near the surface, to control the surface temperature. Three minutes settling time is maintained after clamping the laminate to ensure a constant uniform temperature. The specimen’s outer parts are immovably clamped to the rigid frame of the apparatus, while the top part of the inner laminate is clamped to the crosshead of the universal testing machine. When the experiment starts, the crosshead moves upwards quickly reaching a constant velocity U. A load cell measures the developing pull force 2Ff , which equals the summation of the friction forces acting on either side of the inner laminate. The apparent Coefficient of Friction, μ, is calculated straightforwardly as: μ(δ) =
Ff (δ ) , N
(3.3)
where the pull force and the CoF are not constant during the experiments, but may be written as a function of the displacement δ, which is defined as the distance covered by the crosshead since the experiment started.
3.3 Materials Three thermoplastic composite materials are compared in this research. Two materials possess a matrix material of polyphenylenesulfide (PPS) [22], reinforced either by a 5-harness satin (5HS) carbon weave or an 8-harness satin (8HS) glass
Weave type Mass of fabric Mass of fabric + resin Warp count Weft count Filaments count (yarn) Linear density Thickness fabric + resin Table 3.2
5HS carbon composite CD 286 280 g/m2 486 g/m2 700 tows/m 700 tows/m 3000 198 Tex 0.31 mm
8HS glass composite SS 303 300 g/m2 475 g/m2 2280 tows/m 2200 tows/m 1000 68 Tex 0.25 mm
Properties of the 5HS carbon fabric thermoplastic composite and 8HS glass fiber fabric thermoplastic composite (manufactured by Ten Cate Advanced Composites).
36
Chapter 3. Friction characterization of woven composite ��� ��
��� ��
�������
� ��� �
��� �
Schematic view and photographic detail of a) 5-harness satin carbon weave and b) 8-harness satin glass weave. �� ���! ���� �++, � ���-� ��� ��� ���� ��� �� &� ���� �� ��-./( ����
���
���
���
��
�
��� ��
���
��� �� ��� ��
�� �
Figure 3.4
�� ��� ���� ����� $%&' �� (��)'�% ���*��� # ����� ���� �����
��� ��� ������
� �
��
��� ��
�� ��
�
���
( ��� % ���� ��� *��� 0� � ��%'0� �'��� 0����* �� ��-./( ��� ��
���
��
� �� �! ��� ��� ���"�� # ��� ��� ������
Figure 3.3
�������
�������
���
�������
��� ��
���
��� �� �����
���
�� �
��
��� ���� ����� ���� �����
�����
Viscosity data for Victrex 150P PEEK and Fortron 0214 PPS. The plate-plate rheometry data were converted from the frequency domain to the time domain with the empirical Cox-Merz rule.
weave as depicted in Figure 3.3. The constituents of the third material are polyetheretherketone (PEEK) [23] and the same 5HS carbon weave. Detailed information about the composites is listed in Table 3.2. The data in Table 3.2 are valid and apply to both thermoplastics. The nominal fiber volume fraction of the 5HS carbon and the 8HS glass-fabric reinforced composites are 50 % and 47.5 %, respectively. Figure 3.4 displays the viscosities of the respective thermoplastic grades above their melt temperatures of 280 ◦ C for PPS and 343 ◦ C for PEEK, respectively [22, 23]. The viscosity of PPS was provided by the manufacturer, while the PEEK viscosity was obtained in different experiments, which agree well with the Cross-WLF representation of the commercial Moldflow software [24]. Apart from the different temperature ranges that are applicable for these thermoplastics, PEEK exhibits stronger shear thinning behavior than PPS.
37
3.4. Specimen configuration
����������
Figure 3.5
�����������
��������� �����������
Graphical representation of the tool-ply friction with longitudinal yarn dominated surfaces (A) and the transverse yarn dominated surfaces (B). The equivalent ply-ply friction is abbreviated with (AA) and (BB), respectively.
3.4 Specimen configuration Satin weaves are non-symmetric (see Figure 3.3), as one side exhibits predominantly warp yarns (denoted as side A) while the other exhibits predominantly weft yarns (side B). In addition, the undulation (i.e. crimp) in warp and weft direction can be different. Therefore, it is necessary to distinguish clearly the orientation and the side of the composite that is subjected to sliding. For the sake of simplicity, the weave was always orientated such that the warp yarns were parallel to the sliding direction. In this case, we refer to the warp yarns as longitudinal yarns and to the weft yarns as transverse yarns. Four different lay-up configurations were investigated, shown in Figure 3.5, comprising tool-ply and ply-ply friction, with predominantly longitudinal or transverse yarns. In this figure the notations (A), (B), (AA) and (BB) are introduced to define each configuration. The tool-ply specimens were cut from a preconsolidated twolayer laminate. Similarly, a four-layer laminate with a special lay-up was produced for the ply-ply specimens. Here, the outer plies overlap only partially with the inner layers. The overlapping area of the final specimen will fit into the heating zone of the pressure blocks, which is slightly larger than the pressurized area.
3.5 Test conditions The test conditions that were applied for the friction experiments in the tool/ply and ply/ply configurations are summarized in Table 3.3. Each value combination of the different parameters defines one test condition, which were performed in triplicate. A virgin test sample and virgin metal foils are used for each test to ensure equal initial conditions.
38
Chapter 3. Friction characterization of woven composite
[◦ C]
Temperature, T for PPS for PEEK Pressure, p [kPa] Sliding velocity, U [mm/min] Lay-up configuration for 5HS for 8HS Table 3.3
for tool/ply friction
for ply/ply friction
200 / 310 400 / 420 10 / 50 10 / 100 / 500
310 400 / 420 10 / 50 20 / 100 / 500
(A) / (B) (A) / (B)
(AA) (BB)
Test matrix applied to 5HS C-PEEK, 5HS C-PPS and 8HS G-PPS.
3.6 Characteristic response Figure 3.6 presents the tool/ply friction measurements of the three different materials in lay-up configuration (A), subjected to a sliding velocity of 20 mm/min and a pressure of 10 kPa. Each graph displays the development of the averaged Coefficient of Friction μ¯ determined from three individual measurements. These measurements show a good repeatability, as indicated by the length of the error bars, corresponding with twice the standard deviation σ. The average and the standard deviation of the CoF μ¯ are defined as follows: 1 n μ¯ (δ) ≡ ∑ μi (δ), n i =1 � μ¯ (δ) ≡
n 1 (μi (δ) − μ¯ (δ))2 , ∑ n − 1 i =1
(3.4)
(3.5)
where n is 3, denoting the number of specimens tested under equal conditions. In general, the measurements exhibit a transient peak friction value and settle down to a fairly constant steady-state friction. We define the steady-state CoF as the average between 4 and 8 mm displacement, as indicated in Figure 3.6. Differences between the composite materials are clearly observed under the given conditions. 5HS carbon PPS has a higher peak friction than the PEEK composite, although both matrix materials have similar viscosities at the corresponding test temperature and low shear-rate, i.e. approximately 340 Pa · s. Polymer melts typically show an overshoot of the shear stress on the inception of a simple shear flow, which increases non-linearly with the shear rate γ˙ and a characteristic time constant of the polymer, often called the characteristic relaxation time, θ [25]. As the relaxation time also influences the shear rate regime at which shear thinning of the viscosity initiates, we can estimate the relaxation time from Figure 3.4. A representative relaxation time may be found as the reciprocal shear rate at which the asymptotes of the viscosity for low and high shear rates intersect. For PEEK a relaxation time in the order of 1/500
39
3.7. Results & Discussion
����������� �� �������� "�#
���
��! ��������
�
� ���� � ������
���
�� ����
���
������������ ��������
��� ��� � �
�
�
�
�
�
�
$�� %���&��� "&&# Figure 3.6
Friction measurements conducted with 20 mm/min pull-velocity and 10 kPa pressure at 290 ◦ C for the specimens with the PPS matrix and 400 ◦ C for the specimens with a PEEK matrix. The considered friction surfaces are dominated by warp yarns oriented longitudinally to the sliding direction.
seconds was found, while PPS exhibits a much shorter relaxation time of around 1/2000 seconds at the applied temperatures, 290 ◦ C and 400 ◦ C respectively. The topology of the weave influences the CoF significantly. The topology is not only determined by the yarn properties (e.g. filament count and filament diameter) and the weave pattern, but also by less well specified properties like the crosssectional yarn geometry, yarn waviness, spacing between the yarns and packing of the filaments in each yarn. The latter properties are susceptible to change due to the applied load conditions. Therefore, it is hard to obtain precise CoF predictions that account for different weave architectures. Nevertheless, general trends and approximate values may be obtained with a model description that is applied on an idealized geometry.
3.7 Results & Discussion Hydrodynamic friction of woven composites consisting of glass and polypropylene (Twintex® PP) is well represented in a Stribeck curve, as was shown in earlier publications [13, 15, 16]. This implies that the friction behavior is fully characterized by a single parameter, that is defined as: H≡
Uη0 ( T ) . p
(3.6)
40
Chapter 3. Friction characterization of woven composite % �-� �������
�� �'������ � �������
.�'��'���������' #
�
��� ���� � �����������
�
��� ���� � �����������
�
��� ���� � �����������
����"#�������
��������������
������������
!
$��#�%#�� �������
�#��%#�� �������
&��"���'���#�'��������()*
$����+ �� �'��������(,*
&��"���'���#�'��������())*
� �� ������ �����
� �� ������ �����
� �� ������ �����
� �� ������ �����
� �� ������ �����
� �� ������ �����
��� �� ��� ��� ��� ��� ��� ����
��� �� ��� ��� ��� ��� ��� ����
$����+ �� �'��������(,,*
��� �� ��� ��� ��� ��� ��� ���� � �� ������ �����
Figure 3.7
� �� ������ �����
� �� ������ �����
Hersey plots summarizing all friction measurements.
The “Hersey” number H is a function of all three test conditions: the sliding velocity U and pressure p, as well as the temperature T by means of the zero shear viscosity η0 ( T ). Figure 3.7 summarizes all experiments in Stribeck curves, which allows comparison between their trend lines. These trend lines are in general a good representation of the measured data, except for the ply-ply peak friction coefficients of the PPS composites, which show different friction measurement results at nominally equal “Hersey” numbers. Figure 3.8 shows micrographs of friction samples, subjected to shear in vertical direction. The structure of the weaves remains intact, but deformations of the bundles become evident by filaments that are pulled out, in particular in the 8H glass fabric.
41
����
����
3.7. Results & Discussion
��� Figure 3.8
���
Top view and cross-section view of a) 5HS C-PEEK and b) 8HS G-PPS after a friction test. The shear stress acting on the specimen was directed downwards.
$% ��� &&%�% � ��C !�����������#
�� �� � ������!"#
�������������� ��� ��
�� ��� ��� ��� ��� �
�������������
�������������
� � ��
� � ��
� � ��
� � ��
� � ��
� � ��
��
��
��
��
��
��
� � ��
� � ��
� � ��
� � ��
� � ��
� � ��
��
��
��
��
��
��
��� ��� ��� �
Figure 3.9
Parameters characterizing the power law fits of the Hersey plots.
A view on the cross section reveals that the transverse yarns of the 5HS are not particularly elliptical. Figure 3.9 compares the slope parameters, which define the power law fits of the Stribeck plots, defined as: μ = C · Hα.
(3.7)
42
Chapter 3. Friction characterization of woven composite
By this means, differences and similarities between materials and configurations are identified more clearly. The slopes, indicated by the exponent α, are remarkably similar for both carbon reinforced composites. 8HS G-PPS differs slightly with a steeper slope for the steady state in configuration (B). Observations from the example in Figure 3.6 are supported by the differences in the coefficient C. 5HS C-PPS exhibits the highest CoFs and C-values, especially for the peak friction. 8HS G-PPS on the other hand has only slightly higher C-values for the peak friction than 5HS C-PPS, while the exponents are smaller. It can be inferred that the glass reinforced composite has overall the lowest peak friction coefficients. Differences of the steady-state friction coefficients between the tested materials are not pronounced, except for the earlier discussed (B) configuration between the carbon fiber reinforced and the glass fiber reinforced composites. The curves of the steady-state and the peak friction may intersect in Figure 3.7b and Figure 3.7e. Per definition the peak friction cannot be smaller than the steady-state friction. Therefore, no distinct peak friction exists for Hersey numbers left of the intersection point. Instead, the CoF is rising monotonically to the steady-state value. Comparing different configurations of the same material in the summary of the results in Figure 3.9, it is remarkable that the ply-ply configuration behaves very similarly to the tool-ply configuration with the same fiber orientation. That means that configuration (AA) is similar to (A), and the tested (BB) configuration appears similar to (B).
3.8 Conclusion Thermoplastic woven composites in hot-press forming are submitted to forming limits. The complex task of assessing the forming limits requires the means of numerical simulations, which rely on suitable material descriptions of the deformation mechanisms. Inter-ply and tool-ply shear may be modeled as hydrodynamic lubricated friction and can be represented accurately in Stribeck curves. An experimental material characterization is still required, as analytical models are currently only available for steady-state friction and moreover they are deficient when detailed geometrical information about the weave is lacking. Quantitative differences can be observed between materials, but also between fiber orientations, whereas differences between tool-ply and ply-ply test configurations are surprisingly small.
References
43
References [1] F. C. Campbell, Manufacturing technology for aerospace structural materials, Elsevier, Amsterdam; Boston, 2006. [2] M. Biron, Outline of the actual situation of plastics compared to conventional materials, in: Thermoplastics and Thermoplastic Composites, Elsevier, 2013, pp. 1–29. [3] G. Gardiner, Thermoplastic composites: Primary structure?, High-Performance Composites. [4] J. Díaz, L. Rubio, Developments to manufacture structural aeronautical parts in carbon fibre reinforced thermoplastic materials, Journal of Materials Processing Technology 143-144 (2003) 342–346. [5] A. R. Offringa, Thermoplastic composites–rapid processing applications, Composites Part A: Applied Science and Manufacturing 27 (4) (1996) 329–336. [6] K. Friedrich, M. Hou, J. Krebs, Chapter 4 Thermoforming of continuous fibre/thermoplastic composite sheets, in: Composite Sheet Forming, Vol. 11, Elsevier, 1997, pp. 91–162. [7] R. H. W. ten Thije, Finite element simulations of laminated composite forming processes, Ph.D. thesis, University of Twente, Enschede, The Netherlands (2007). [8] S. P. Haanappel, Forming of UD fibre reinforced thermoplastics, Ph.D. thesis, University of Twente, Enschede, The Netherlands (Apr. 2013). [9] D. J. Groves, A characterization of shear flow in continuous fibre thermoplastic laminates, Composites 20 (1) (1989) 28–32. [10] S. R. Morris, C. T. Sun, An investigation of interply slip behaviour in AS4/PEEK at forming temperatures, Composites Manufacturing 5 (4) (1994) 217–224. [11] A. M. Murtagh, J. J. Lennon, P. J. Mallon, Surface friction effects related to pressforming of continuous fibre thermoplastic composites, Composites Manufacturing 6 (3–4) (1995) 169–175. [12] R. Scherer, K. Friedrich, Inter- and intraply-slip flow processes during thermoforming of CF/PP-laminates, Composites Manufacturing 2 (2) (1991) 92– 96. [13] J. L. Gorczyca-Cole, J. A. Sherwood, J. Chen, A friction model for thermostamping commingled glass–polypropylene woven fabrics, Composites Part A: Applied Science and Manufacturing 38 (2) (2007) 393–406. [14] R. H. W. ten Thije, R. Akkerman, L. van der Meer, M. P. Ubbink, Tool-ply friction in thermoplastic composite forming, International Journal of Material Forming 1 (SUPPL. 1) (2008) 953–956. [15] K. Vanclooster, Forming of multilayered fabric reinforced thermoplastic composites, Ph.D. thesis, KU Leuven, Leuven, Belgium (2010). [16] U. Sachs, R. Akkerman, K. Fetfatsidis, E. Vidal-Sallé, J. Schumacher, G. Ziegmann, S. Allaoui, G. Hivet, B. Maron, K. Vanclooster, S. V. Lomov, Characterization of the dynamic friction of woven fabrics: Experimental
44
[17]
[18] [19]
[20] [21]
[22] [23] [24] [25]
Chapter 3. Friction characterization of woven composite
methods and benchmark results, Composites Part A: Applied Science and Manufacturing 67 (2014) 289–298. L. M. J. Robroek, The development of rubber forming as a rapid thermoforming technique for continuous fibre reinforced thermoplastic composites: quality control by process control, Ph.D. thesis, Delft University Press, Delft, The Netherlands (1994). M. Biron, Thermoplastic composites, in: Thermoplastics and Thermoplastic Composites, Elsevier, 2013, pp. 769–829. R. H. W. ten Thije, R. Akkerman, M. Ubbink, L. van der Meer, A lubrication approach to friction in thermoplastic composites forming processes, Composites Part A: Applied Science and Manufacturing 42 (8) (2011) 950–960. A. van Beek, Advanced engineering design, TU Delft, 2006. R. H. W. ten Thije, R. Akkerman, Design of an experimental setup to measure tool-ply and ply-ply friction in thermoplastic laminates, International Journal of Material Forming 2 (2009) 197–200. Ticona, Fortron 0214 PPS datasheet (Nov. 2011). Technical datasheet victrex PEEK 150P (Feb. 2012). Autodesk, MoldFlow 2013. A. I. Leonov, Nonequilibrium thermodynamics and rheology of viscoelastic polymer media, Rheologica Acta 15 (2) (1976) 85–98.
Chapter 4 A lubrication approach to friction in forming processes with thermoplastic UD composites* Abstract The sliding phenomena of thermoplastic UD composites in the 3-D stamp forming process are not yet fully understood, and models with a sound physical background that predict the shear stress at elevated temperatures with molten thermoplastic resin are not available. Earlier researches showed that the friction is predominantly determined by the shear of the viscous resin interlayer, but may also be affected by dry contact between fibers and tooling surface. This paper introduces an analytical model that accounts for both viscous and dry friction and predicts the rheological friction behavior, in which the fibers are oriented parallel to the sliding direction. In the first approach the model is developed only based on theoretical considerations. It assumes a pressure- and timeinvariant thickness of the resin interlayer interrupted by small spots of dry contact. The model is evaluated with experimentally obtained friction results of UD carbon PEEK. A good agreement between model and experiments is achieved when an adequate representation of the geometry of the resin interlayer is used.
* Reproduced from: U. Sachs, R. Akkerman, A.D. Rietman. A lubrication approach to friction in forming processes with thermoplastic UD composites. Submitted to Composites Part A: Applied Science and Manufacturing, 2014.
45
46
Chapter 4. A lubrication approach with UD composites
4.1 Introduction Continuous fiber reinforced thermoplastics (CFRTP) are increasingly being used in the aerospace industry to reduce the weight and energy consumption of aircraft. Typical for fiber reinforced composites are their high stiffness- and strength-to-weight ratios, while thermoplastic matrices are more damage tolerant than their thermoset counterparts [1]. Besides, thermoplastics have advantages of an indefinite shelf life and fewer health and environmental risks [1]. The use of thermoplastics instead of thermosets can increase the cost effectiveness, since they are suited for fast automated thermoforming processing as with e.g. the 3-D stamp forming process [2]. Currently, the majority of hot-press formed CFRTPs with doubly curved surfaces (3-D forming) are woven fabric reinforced composites, using the large experience that has been gained for this material [3–7]. Unidirectional (UD) composites, however, usually contain a beneficially higher fiber volume fraction with less fiber waviness [1], and in addition they are suited for automated tape placement [8] to create tailored blanks for hot-press forming without expensive hand lay-up. But, greater formability problems were experienced with UD composites in 3-D stamp forming [7], indicated by press-form experiments shown in Figure 4.1. For the experiments, preconsolidated laminates of woven and UD composites with a quasi-isotropic lay-up and the identical thickness were used. While woven composite parts are seemingly wrinkle-free on the web, all UD composite parts exhibit clearly visible wrinkles in the close-up view. A number of different deformation mechanisms can be identified [9] in composite sheet forming. A successful approach to analyze and predict the generation of wrinkles in doubly curved shapes is to describe the laminate deformations by four essential deformation mechanisms, which are inter-ply and tool/ply slip, intra-ply
��������
�� � ���� ���
Figure 4.1
� � ���� ����
� � ���� ���
� � �� �� ���
�� � ���� ����
�� � ���� ���
�� �� �� ���
Close-up view of press-formed CFRTP stiffening ribs with different materials.
4.2. Literature review
47
shear and ply bending [7], and use these as a basis for composites forming simulation. To do so, the material’s resistance against these deformation mechanisms has to be determined in dedicated characterization experiments. In the context of composites processes, friction is known to depend on the sliding velocity, the normal pressure, the temperature and the orientation of the fibers [10–14]. While an analytical model can adequately predict the friction of woven composites, as shown in [15], no equivalent model exists for UD composites. Researchers often assume the friction to be governed by hydrodynamic lubrication [9–12, 16] with the existence of a resin interlayer and having a thickness on the order of the fiber diameter. So far, however, a mechanism that leads to the development of a film has not been described. In this paper an analytical model is introduced, that considers both a “dry” and a “viscous” friction component, caused by interaction of the fiber and the matrix with the metal surface. Subsequently the model is evaluated experimentally.
4.2 Literature review A brief summary of previous research describes the current knowledge about the slip mechanism of UD-composite plies under processing conditions above the melting temperature in inter-ply and tool/ply configurations. Groves [16] intended to measure the viscosity of the interlayer in a dynamic spectrometer but observed also shear through the entire composite ply. Moreover, forming experiments with plies of parallel fiber directions do not show any distinct inter-ply slip but the deformation is dominated by shear throughout the thickness, as can be seen from V-bend experiments conducted by Scherer and Friedrich [10]. Murtagh et al. [12] developed a set-up that prevents shear through the thickness, only allowing slip on the interface. Murtagh and Mallon [9] found evidence for the existence of an interlayer and estimated the average film thickness at different sliding velocities by pulling a metal shim out of two UD carbon PEEK composites plies, with the fibers orientated parallel to the sliding direction. The authors concluded that at a sliding velocity of 15 mm/min the resin film would be at least 10 μm thick and doubles for a sliding velocity of 120 mm/min. Micrographs of the tested specimens, however, did not exhibit a pronounced interlayer. Based on the micrographs, the authors also considered the possibility of Coulomb friction where fibers come into direct contact with the metal surface. Most researchers have focused on the determination of the friction stress under various conditions. Morris and Sun [11] observed a power-law relation between the shear stress and sliding velocity in experiments on UD carbon PEEK composites. They also observed an increasing trend of the shear stress by increasing normal pressure and assumed a film thickness decrease due to the normal pressure.
48
Chapter 4. A lubrication approach with UD composites
A similar behavior has been observed for woven composites, for which the powerlaw relation has been found between the shear stress and the sliding velocity, normal pressure and matrix viscosity, respectively [14, 17]. It is possible to predict the shear stress of woven composites by an analytical model proposed by Ten Thije et al. [15]. It is based on the classical lubrication theory, which adopts the Reynolds equation for thin film flows [18]. Thus, it is a purely hydrodynamic model and explains the development of the lubricating film due to film thickness variations caused by the structure of the woven fabric. This model, however, is not applicable to UD composites, since they do not exhibit such strong film thickness variations.
4.3 Model description for UD tool-ply friction The physical model that is proposed in this paper predicts the average shear stress τ¯ between a UD laminate and a tooling surface above the melting temperature of the resin, with the fiber orientation parallel to the sliding direction (Figure 4.2). The average shear stress is defined as the ratio between the pulling force Ff and the nominal contact area A, τ¯ = Ff /A. As suggested by the literature, the model considers dry and viscous friction and will be referred to as ’mixed lubrication model’. A semi-permanent fibrous network is assumed, formed by filaments supported by their neighbors at fairly random points of contact, which are determined by the sequence of previous steps of the manufacturing processes. The outermost filaments have a similar type of contact with the supporting tool. In this way, the fibrous network transfers the normal load N through the thickness of the composite laminate. The laminate thickness remains constant during sliding due to these fiber-fiber and tool-fiber contacts. The distribution of the resin surrounding the filaments is considered to be invariant regarding pressure, temperature and sliding velocity. Therefore, the normal load N will be carried entirely by microscopically small contact areas between the surface asperities of the carbon fiber and the metal. Following the approach of Cornelissen [19], the model idealizes the microscopic asperity as ellipsoids, defined by their radii R x and Ry and the distances among
���������
Figure 4.2
��� ������� �����
Macroscopic friction model.
49
4.3. Model description for UD tool-ply friction
����� z
z ������� ���� ��� x
y
����� � ������
Figure 4.3
Assessment of the dry contact area between a carbon filament and the metal surface.
them a x and ay (Figure 4.3). A superscript t or f denotes the tooling or the fiber surface, respectively. A realistic estimation of the number of dry contact points requires a very precise knowledge of the statistical fiber distribution and orientation in the three-dimensional space, which is not available. Therefore, the fiber distribution is idealized to be a hexagonal, which is characterized by the distance between two adjacent fibers, denoted by b. The number of contact points per area, denoted by d, scales inversely with the asperity distance of the tooling surface in x-direction atx and b, assuming f that b > aty > ay . From energy considerations, the fibers will arrange themselves into a stable equilibrium, which is obtained with three contact points per filament in the y-z cross section. The number of microscopic contact points per unit area, d, is therefore estimated as:
d=
3 . atx b
(4.1) dry
The dry friction force Ff
is determined straightforwardly by the product of the dry
contact area Adry and the interfacial shear strength τ dry . The dry contact area per asperity is calculated by means of the Hertzian contact model, applying a normal force N asp on each contact point. Assuming that the load distributes evenly over all contact points, N asp becomes: N asp =
N f iber N . = 3 dA
(4.2)
Equivalently, the viscous friction force Ffvisc follows from the integration of the viscous shear stress τ visc over the viscous contact area Avisc , where the shear stress is a function of the shear rate γ˙ and the resin viscosity η, but is limited to a maximum,
50
Chapter 4. A lubrication approach with UD composites
which is denoted as the critical shear stress τ crit : � � visc crit ˙ ˙ = min γη (γ, T ) , τ τ .
(4.3)
˙ which is The viscosity depends on the temperature T and the shear rate γ, approximated by the ratio of the sliding velocity U and the local resin film thickness h. A strong wall slip is expected to occur between the resin and the tool surface when a certain critical shear stress is exceeded. This slip will increase with the sliding velocity, such that further increase of the shear stress is drastically reduced [20]. This behavior is approximated by limiting the maximum shear stress to a critical shear stress.
4.4 Material properties Experimental friction tests were performed with UD carbon PEEK and UD glass PPS composites. Both materials were supplied by Ten Cate as Cetex Thermo-Lite 1467I (AS4 / PEEK) and Cetex Thermo-Lite 4379P (S-2 / PPS), respectively. The tooling surface was represented by a commercially available steel foil M-Tech®F by Georg Martin. The model was evaluated with friction experiments between UD carbon PEEK and steel foil, which required the properties of these two materials. Following Cornelissen’s approach [19], the metal surface topology (Figure 4.4) was analyzed statistically, to determine the average radii of the asperities and the distances among them, denoted by Rtx , Rty , atx and aty , respectively. The corresponding f
f
values for a sized PAN-based carbon fiber like AS4 [23], are denoted by R x , Ry and
Fiber diameter Average asperity radius in x Average asperity radius in y
Carbon fiber AS4 D 7 μm f Rx ∞ f 0.5 μm Ry f
Transverse modulus E2 15 GPa [21] 0.445 [21] Transverse Poisson’s ratio νf Average asperity distance in x f Average asperity distance in y ay 0.6 μm Average filament distance b 8.68 μm f Yield shear strength τyield 100 MPa [21] Interfacial shear strength τ dry 1) According to standard EN 10139 DC01 Table 4.1
Mild steel DC01 t Rx 1.1 μm t Ry 4.5 μm E2t νt atx aty
200 GPa 0.3 1.22 μm 1.47 μm t τyield 140 MPa 1) 100 Mpa (estimated)
Surface and material properties of carbon fiber AS4 and mild steel DC01.
51
�
��������� �� �
4.4. Material properties � �� ����� ��� � � ��� ��������� ���� ��
� � � � � � �
�� ��� � �
��
�� �� ��
��������� �� � �
��
Laser confocal image of the metal surface topography.
��
��� � �
�
��������� �� �
Figure 4.4
����
Figure 4.5
��
��
��
�
��
���
���
���
��
��
��
��
��
�
�
�
���
��
��
Atomic force microscopy of PAN-based carbon fiber with sizing (retrieved from [22]).
f
ay , respectively, and were estimated from micrographs found in the literature [22, 24], (example shown in Figure 4.5). The distance between adjacent fibers, b, follows from the fiber volume fraction of 59 % [25] and the fiber diameter D. All values are summarized in Table 4.1. The interfacial shear strength τ dry of the fabric-metal contact was estimated by Cornelissen [19] to be 100 MPa. The matrix viscosity, which is required to calculate the viscous shear stress, is given in Figure 4.6. Hatzikiriakos presented critical shear stresses τ crit , at which strong wall slip between a polymer and a metal surface occurs, for different polymers, being in the order of 100 kPa [20]. Therefore, 100 kPa is used as the upper limit of the viscous shear stress, to approximate the actual complex wall slip behavior.
52
Chapter 4. A lubrication approach with UD composites
���� �� � �����
���
���
��� � Figure 4.6
�� ��� ����� �� � ����
����
Shear rate dependent viscosity of PEEK Victrex 150 G [26].
4.5 Model results The mixed lubrication model was evaluated with the material data given in the previous section. A range of different temperatures, sliding velocities and normal pressures was applied to obtain a comprehensive view of the model behavior. The results of the mixed lubrication model are presented in Figure 4.7 in terms of the ¯ defined as: average shear stress τ, dry
Ff Ffvisc Ff = + = τ¯ dry + τ¯ visc , τ¯ = A A A
(4.4)
where τ¯ dry and τ¯ visc represent the shear stress contributions of the dry and the viscous friction, respectively. The shear stress is set out against the product of sliding velocity
���� �� � �� ��� ��������� �
���
��
����������� ���� ������ ��������� ��������� �
���
�
��
���
����
�����
�� ����
Figure 4.7
Average shear stress at isobaric conditions predicted by the mixed contact model for a range of pressures (p = 15 to 220 kPa). The temperature effect is considered with the zero shear viscosity.
53
4.6. Experimental set-up
U and zero shear viscosity η0 . It appears that the viscous shear stress (dotted line) is only a function of Uη0 and behaves Newtonian for low values of Uη0 , but is limited by the critical shear stress τ¯ crit for high values of Uη0 . The dry shear stress, τ¯ dry (dashed line), on the other hand depends only on the normal pressure, p = N/A. Therefore, its contribution is constant in Figure 4.7 and defines the horizontal asymptote that is approximated by the mixed lubrication response, τ¯ (solid line), at very low values of Uη0 . Certainly, a representative fiber topology and the amount of tool-fiber contacts are hard to determine analytically. It is also conceivable, that these characteristics are strongly dependent on the manufacturing process. The predictions of the mixed lubrication model will be validated with experimental results in Section 4.8.
4.6 Experimental set-up For the experimental research a custom-built test set-up was utilized (Figure 4.8), which is mounted in a universal testing machine [27]. Figure 4.8a outlines the kinematics of the system, in which the movable pressure block is actuated by an expanding pneumatic bellow towards the fixed pressure block. Three load cells, arranged in a triangle, measure the exerted normal force N. The flexible bellow, together with the free hanging suspension, allows the blocks to align themselves in a parallel position. Linear variable differential transformers (LVDTs) measure the distance between the blocks and any discrepancies in the alignment. Figure 4.8b outlines the mode of operation of the system. The test specimen is assembled from an inner composite laminate and an outer part. The outer part consists of metal foils or of composite plies, to measure tool-ply slip or inter-ply slip respectively. The specimen is clamped between two heated pressure blocks with a normal force N. A control system keeps the blocks at constant temperature T. After clamping the laminate, three minutes settling time was maintained to obtain a ����� ��� ���� � ������������
���
������
���� ����� �� �
� ������� �� � ����������
���
��
Figure 4.8
���� � ��
��
��������� ������� ��
Schematic representation of the applied friction test set-up. a) outline of the kinematics. b) outline of the mode of operation. c) picture of the set-up.
54
Chapter 4. A lubrication approach with UD composites
constant uniform temperature. The specimen’s outer parts are clamped to the lower frame of the apparatus, while the inner laminate is clamped to the crosshead of the universal testing machine. The experiment starts by moving the crosshead upwards, reaching virtually instantaneously the prescribed velocity U. A load cell measures the developing pull force 2Ff . The pull force and therefore also the shear stress are not constant during the experiments, but are a function of the crosshead displacement δ.
4.7 Test conditions Table 4.2 and Table 4.3 summarize the test conditions that have been applied on UD carbon PEEK and UD glass PPS, respectively. Table 4.2 contains a full test matrix. The highlighted values in Table 4.3 define the baseline conditions of the test matrix. Further test conditions involve variation of either temperature, pressure or sliding velocity to the non-highlighted values, resulting in a total of 7 different test conditions. Every experiment was performed in triplicate and each test was conducted with a virgin test specimen. The test conditions were chosen such that they resemble the conditions that are present in the hot-press forming process as well as possible. Description Temperature (◦ C) Pressure (kPa) Sliding velocity (mm/min) Table 4.2
Values 390 15, 220 5, 20, 100, 500, 1000
Test conditions applied on UD carbon PEEK.
Description Temperature (◦ C) Pressure (kPa) Sliding velocity (mm/min) Table 4.3
Symbol T p U
Symbol T p U
5
Values 290 310 10 20 20 100
Test conditions applied on UD glass PPS.
330 500
55
4.8. Experimental results
4.8 Experimental results Figure 4.9 shows typical measurement results of tool/ply friction tests with UD carbon PEEK and UD glass PPS. After the onset of the movement, the measured shear stress quickly ramps up to its maximum and decreases again to a fairly constant value, considered as the steady-state value. The graphs in this figure represent the arithmetic mean shear stress of three measurements, and the error bars show the corresponding standard deviation. The peak in the shear stress was observed by several researchers in earlier work. Murtagh suggested that it is caused by an adhesive bond that has to be broken [12]. This may also be interpreted as a slip relaxation effect [28], which leads to a gradual increase of the wall slip and consequently to a gradual decrease of the shear stress. Morris and Sun [11] showed that the peak reoccurs when stopping the motion for only 10 seconds and starting it again. Except for the wall slip, nonlinear viscoelastic effects can contribute to the shear stress overshoot, as is shown in [29] for the inception of simple shear flow. Murtagh and Mallon [9] found evidence for an increasing thickness of the resin interlayer while the sliding motion takes place and assumed that the extra resin will re-percolate in between the fibers when the movement has stopped. According to this mechanism an initial stress overshoot can also be explained, but this phenomenon is not considered in the mixed lubrication model. The experimental results are represented by the peak and the steady-state shear stresses (see definition in Figure 4.9), which are summarized in Figure 4.10. The curves of the peak shear stresses (denoted by triangles) at 15 kPa and 220 kPa average normal pressure are described closely by a power-law fit (represented by thin straight lines). Hence, the peak shear stress does not exibit a plateau, which indicates that
��� ��� �� �� ��� ���������� �
��� ��� ��������
� �� �� �� ���
����� ���!
�� �� �� ��
�� �"# � �� �� � ���
�
�
�
�
�
�
��
�� � ����������������
Figure 4.9
Friction test of UD carbon PEEK (U = 100 mm/min, T = 390◦ C and p = 15 kPa) and of UD glass PPS (U = 100 mm/min, T = 290◦ C and p = 10 kPa).
56
Chapter 4. A lubrication approach with UD composites
�� � � ��� ����� ���������� �
���
� ���� ������
�� ��
�� ��� ���� ����� ��
�� ��
�� ���� ���� � ��� ����� ��
��
����������� ���������
� �
��
���
����
�����
�� �
�
Figure 4.10
The average shear stress at different normal pressures. Comparison between experimental results and predict results of the mixed lubrication model for UD carbon PEEK.
the critical shear stress is higher than the measured maximum of 230 kPa. The close match between both curves indicates a small effect of the pressure on the peak shear stress and consequently a negligible effect of dry friction. In contrast, the steadystate shear stresses (denoted by circles) follow the power-law fit only at low values of Uη0 , but deviate from the fit at higher values, where they exhibit a plateau shear stress, which is significantly higher at 220 kPa than at 15 kPa. However, the pressure dependency is only observed at high values of Uη0 , and therefore unlikely to be caused by dry friction. Figure 4.10 also shows the prediction of the mixed lubrication model based on a hexagonal fiber distribution. The prediction largely overestimates the experimental shear stresses and the pressure dependency. Nevertheless, similarities can also be observed, especially between the predicted curve at 15 kPa and the experimental steady-state shear stress at 220 kPa. Both curves have approximately the same slope at low values of Uη0 and reach a similar shear stress plateau at high values of Uη0 . The maximum steady-state shear, stress measured at 15 kPa normal pressure, may be limited because of the development of normal stress effects, which leads in polymeric liquids to an extra tension along the streamlines [29]. At high shear rates this tension may exceed the pressure induced by the normal force and causes a contraction of the resin film. Due to this contraction, the film may become discontinuous leading to a decrease of the shear stress. The decrease of the steady-state shear stress was also observed in experiments of UD glass PPS. Figure 4.11 compares the experimental results of UD carbon PEEK and UD glass PPS at low pressure. Except for the fact that the shear stresses of UD carbon PEEK are in general higher, as the example in Figure 4.9 already indicated, the curves of the peak and the steady-state stresses are very similar. Therefore, the curves may describe a general behavior, valid for UD thermoplastic composites with the fiber
57
4.8. Experimental results
!"
�� ��� � ��� �����������
���
�
�� ����� ����� � ��� ��
�
�� ������� �������� ��� � ��� ��
��
����� �������� ����������� � �
��
���
����
�����
������
Figure 4.11
The average shear stress for two different materials. Gray symbols indicate UD carbon PEEK for p = 15 kPa and white symbols indicate UD glass PPS for p = 10 kPa.
orientation parallel to the shear direction. Because the model is overestimating the dry and viscous friction, which were deduced from the experiments, the assumed hexagonal fiber distribution might possess an unrealistic thin film thickness containing an excessive number of tool fiber contacts. To investigate the existing film thickness just before the shear is initiated, virgin test specimens were heated and pressurized according to the test procedure. However, instead of shearing the specimens, they were cooled down again while applying a constant normal pressure until the polymer solidified. Since the same friction behavior is measured for a virgin specimen and a specimen that is tested for the second time [11], it is expected that the deformation history has no significant influence on the film thickness, provided that the fluid was sufficiently long at rest after the deformation. Two specimens were prepared, one subjected to 15 kPa the other to 220 kPa. For each specimen 24 micrographs from different cross sections were investigated (Figure 4.12a) to obtain the existing film thicknesses (Figure 4.12b). Indeed, the composite exhibits an accumulation of resin at the interface to the tooling, while the fibers are more densely packed in the interior. The shear flow in the resin was calculated for each micrograph by solving the differential equation, which follows from the force equilibrium on an infinitesimal fluid particle: � � � � ∂u ∂u ∂ ∂ η η + = 0, (4.5) ∂y ∂y ∂z ∂z where u denotes the flow velocity in x-direction. The viscosity is also a function of the spatial coordinates, due to its shear rate dependency. Dirichlet boundary conditions were applied, defining the flow velocity u equal to zero on all boundaries except for
58 ��� � ����������
Chapter 4. A lubrication approach with UD composites �� �� �
� ����� �� ����������
��
�
��
��� ��� ��� � ����������
���
�
��
��� ��� ��� � ����������
���
�� �� �
�� Figure 4.12
a) Example of a microscopic image created from a pressurized test specimen that was not subjected to sliding. The white contours illustrate the surfaces of the fibers and the tooling. b) Film thickness of the resin film that was deduced from the microscopic image.
z = 0, where u equals the shear velocity U. The last condition changed partially to a Neumann boundary condition, in the sections where the critical shear stress was exceeded, imposing a constant shear rate which corresponds to the critical shear stress: η
∂u = τ crit . ∂z
(4.6)
Subsequently, the shear stress at the interface with the tooling is averaged to obtain τ¯ visc . The amount of tool fiber contacts is difficult to determine. The experiments showed, however, that the effect of dry friction is negligible, hence, its contribution is neglected in this analysis. The cross sections obtained after applying 220 kPa pressure exhibited an average film thickness of 6.26 μm, while cross sections of the 15 kPa specimen exhibited a film thickness of 6.42 μm, hence the static film thickness indeed appears to be independent of the applied pressure. The model is partially in good agreement with the steady-state friction for high normal pressures (Figure 4.13), when the fiber topology is obtained by microscopy of the cross sections. However, it cannot explain any pressure dependent effects, like the shear stress drop at high values of Uη0 for low normal pressures. For low values of Uη0 < 100 Pa mm, the model underestimates the actual shear stress by about 8 kPa, which corresponds with a pulling force Ff of 20 N. A systematic measurement error of this magnitude is unlikely, since the accuracy of the load cell is in the range of ± 1 N.
59
4.9. Discussion
���
��
� �
��
���
����
�����
�������
Figure 4.13
Average shear stress prediction on the basis of film thicknesses obtained from multiple micrographs. The error bars denote the standard deviation which originates from the average film thickness variations between the micrographs.
4.9 Discussion The experiment cannot simulate the changing conditions which occur in the actual production process, but keeps temperature, pressure and sliding velocity at constant values. These values are mainly determined by the capabilities of the set-up, ranging from 5 to 1000 mm/min velocity and from 10 to 220 kPa pressure. In the actual press forming process, the deformation will predominantly take place at very low pressures. Considering the fact that the mold contacts the laminate only partially on one side during closure, the pressure will presumably be less than 15 kPa. The accuracy of the set-up, however, worsens at lower pressures, as the absolute error is less than 2 kPa. The temperature is based on the initial temperature that the laminate has reached just before the press forming begins. The utilized set-up was evaluated in a benchmark program [17], which established confidence in the measurement results. The results indicate a nearly pressureindependent peak shear stress, following a power-law relation with the sliding velocity over the entire testing domain. The steady-state shear stress deviates from that power-law relation at high sliding velocities and approximates a horizontal asymptote. The transition point and the asymptotic value were found to be pressure dependent. The leveling off in the steady-state shear stress at high sliding velocities was also observed by Murtagh and Mallon [9] and was explained as being due to an increase of film thickness. In contrast, this research explains the leveling off as being due to interfacial wall slip. The presented mixed lubrication model, however, assumes an invariant film thickness and is in good agreement with the presented experimental results. Whether the
60
Chapter 4. A lubrication approach with UD composites
assumption of an invariant film thickness holds might depend on the fiber volume fraction and the consolidation process of a composite. To obtain a good model prediction, an adequate representation of the film thickness is essential. In the current state, microscopic images of the composite are required to obtain the film thickness, as a homogeneous hexagonal fiber distribution is no adequate representation. For low sliding velocities, the mixed lubrication model should predict the viscous shear stress adequately, since a non-slip condition on the interface is expected. The shear stresses in the experiment, however, exceed the predicted viscous shear stress. Furthermore, the fluid is expected to behave Newtonian in this regime, resulting in a linear relation between shear stress and sliding velocity (corresponding with a slope of unity in a double logarithmic plot). In Figure 4.13 it can be seen clearly that the slope of the model and the experiments disagree and it may be concluded that another type of friction besides hydrodynamic friction is present. The difference amounts to a pressure independent shear force of about 8 kPa at low sliding velocities. Therefore, it is not explained by a boundary lubrication of the surface asperities, as this will be pressure dependent. It may be speculated that a boundary lubrication is caused by a confined particulate structure in the fluid. This effect, as described in [30], becomes prominent at low shear rates and was observed at film thicknesses below 4 μm. Small particles (dust), contained in the specimen to be tested, might have such an effect in the present experiments. For high sliding velocities, the model can be fitted well on the experimental results, by choosing a suitable critical interfacial shear stress. Specific data about the critical interfacial stress for PEEK is not available, but the values for other materials [20] are in the same order of magnitude as the values that fit on the experimental results. A research on wall slip dedicated to PEEK would be required to prove the model. Furthermore, the interfacial shear stress is known to be dependent on the wall slip velocity, temperature, normal pressure and the history of the shear deformation. The knowledge of these relations could improve the mixed lubrication model, to quantitatively predict the measured peak shear stress.
4.10 Conclusions The presented model describes the friction between UD composites and metal tooling at melt temperature, for the case that the fibers are orientated parallel to the sliding direction. The model comprises viscous and boundary lubrication. The effects of both types of lubrication were also observed in the experiments, but the model yields satisfactory results only for the hydrodynamic lubrication. Hydrodynamic lubrication is predominant at high sliding velocities. In this regime, the model prediction agrees with the experiments, provided that the film thickness and the wall-slip behavior is known. The boundary lubrication at low sliding
References
61
velocities, which appears to be pressure independent, was not successfully explained with the model and its cause remains unclear for the time being.
References [1] F. C. Campbell, Manufacturing technology for aerospace structural materials, Elsevier, Amsterdam; Boston, 2006. [2] A. R. Offringa, Thermoplastic composites – rapid processing applications, Composites Part A: Applied Science and Manufacturing 27 (4) (1996) 329–336. [3] R. H. W. ten Thije, Finite element simulations of laminated composite forming processes, Ph.D. thesis, University of Twente, Enschede, The Netherlands (2007). [4] S. Wijskamp, Shape distortions in composites forming, Ph.D. thesis, University of Twente, Enschede, The Netherlands (2005). [5] E. A. D. Lamers, Shape distortions in fabric reinforced composite products due to processing induced fibre reorientation, University of Twente, Enschede, the Netherlands, 2004. [6] L. M. J. Robroek, The development of rubber forming as a rapid theromoforming technique for continuous fibre reinforced thermoplastic composites: quality control by process control, Ph.D. thesis, Delft University Press, Delft, The Netherlands (1994). [7] S. P. Haanappel, Forming of UD fibre reinforced thermoplastics, Ph.D. thesis, University of Twente, Enschede, The Netherlands (Apr. 2013). [8] W. J. B. Grouve, Weld strength of laser-assisted tape-placed thermoplastic composites, University of Twente, 2012. [9] A. M. Murtagh, P. J. Mallon, Chapter 5 Characterisation of shearing and frictional behaviour during sheet forming, in: Composite Sheet Forming, Vol. 11, Elsevier, 1997, pp. 163–216. [10] R. Scherer, K. Friedrich, Inter- and intraply-slip flow processes during thermoforming of CF/PP-laminates, Composites Manufacturing 2 (2) (1991) 92– 96. [11] S. R. Morris, C. T. Sun, An investigation of interply slip behaviour in AS4/PEEK at forming temperatures, Composites Manufacturing 5 (4) (1994) 217–224. [12] A. M. Murtagh, J. J. Lennon, P. J. Mallon, Surface friction effects related to pressforming of continuous fibre thermoplastic composites, Composites Manufacturing 6 (34) (1995) 169–175. [13] G. Lebrun, M. N. Bureau, J. Denault, Thermoforming-stamping of continuous glass fiber/polypropylene composites: Interlaminar and tool-laminate shear properties, Journal of Thermoplastic Composite Materials 17 (2) (2004) 137–165. [14] J. L. Gorczyca-Cole, J. A. Sherwood, J. Chen, A friction model for thermostamping commingled glasspolypropylene woven fabrics, Composites Part A: Applied Science and Manufacturing 38 (2) (2007) 393–406.
62
Chapter 4. A lubrication approach with UD composites
[15] R. H. W. ten Thije, R. Akkerman, M. P. Ubbink, L. van der Meer, A lubrication approach to friction in thermoplastic composites forming processes, Composites Part A: Applied Science and Manufacturing 42 (8) (2011) 950–960. [16] D. J. Groves, A characterization of shear flow in continuous fibre thermoplastic laminates, Composites 20 (1) (1989) 28–32. [17] U. Sachs, R. Akkerman, K. Fetfatsidis, E. Vidal-Sallé, J. Schumacher, G. Ziegmann, S. Allaoui, G. Hivet, B. Maron, K. Vanclooster, S. V. Lomov, Characterization of the dynamic friction of woven fabrics: Experimental methods and benchmark results, Composites Part A: Applied Science and Manufacturing 67 (2014) 289–298. [18] A. van Beek, Advanced engineering design, TU Delft, 2006. [19] B. Cornelissen, U. Sachs, B. Rietman, R. Akkerman, Dry friction characterisation of carbon fibre tow and satin weave fabric for composite applications, Composites Part A: Applied Science and Manufacturing 56 (2014) 127–135. [20] S. G. Hatzikiriakos, Wall slip of molten polymers, Progress in Polymer Science 37 (4) (2012) 624–643. [21] B. Cornelissen, The role of friction in tow mechanics, Ph.D. thesis, University of Twente, Enschede, The Netherlands (Jan. 2013). [22] L. B. Nohara, G. Petraconi Filho, E. L. Nohara, M. U. Kleinke, M. C. Rezende, Evaluation of carbon fiber surface treated by chemical and cold plasma processes, Materials Research 8 (3) (2005) 281–286. [23] Hexcel, HexTow AS4 carbon fiber product data (Mar. 2013). [24] W. P. Hoffman, Scanning probe microscopy of carbon fiber surfaces, Carbon 30 (3) (1992) 315–331. [25] Ten Cate, Cetex TC 1200 datasheet. [26] Autodesk, MoldFlow 2013. [27] R. Akkerman, R. H. W. Ten Thije, U. Sachs, M. De Rooij, Friction in textile thermoplastic composites forming, in: Proceedings of the 10th International Conference on Textile Composites - TEXCOMP 10: Recent Advances in Textile Composites, 2010, pp. 271–279. [28] I. B. Kazatchkov, S. G. Hatzikiriakos, Relaxation effects of slip in shear flow of linear molten polymers, Rheologica Acta 49 (3) (2010) 267–274. [29] R. B. Bird, R. C. Armstrong, O. Hassager, Dynamics of polymeric liquids. Vol. 1, 2nd Ed. : Fluid mechanics, John Wiley and Sons Inc., New York, NY, 1987. [30] C. Clasen, H. P. Kavehpour, G. H. McKinley, Bridging tribology and microrheology of thin films, Applied Rheology 20 (4).
Chapter 5 A novel bending characterization method for thermoplastic composites* Abstract The bending behavior of single plies or stacks of plies is one of the main deformation mechanisms that act during thermoforming of thermoplastic composites. To predict the feasibility of the forming process and part geometry, predictive models are needed. To this end, a novel test set-up is introduced to characterize the bending behavior of thermoplastic composites in thermoforming conditions. Advantages of the set-up are the relative ease of operation and precision of the measurement compared to other characterization methods, while operating at high temperatures. An analysis of the set-up and the applied boundary conditions is presented and validated by testing a purely elastic specimen. The good agreement between theory and experiment for pure elastic specimens indicates that the capability of the set-up to accurately measure bending properties. This paper introduces a simple viscoelastic bending model that describes the bending behavior of thermoplastic composites under process conditions. The material parameters defined in the model are determined by experiments performed on UD carbon PEEK specimens.
* Reproduced from: U. Sachs, R. Akkerman, S.P. Haanappel. A novel bending characterization method for thermoplastic composites. To be submitted to: Composites Part A: Applied Science and Manufacturing, 2014.
63
64
Chapter 5. A novel bending characterization method for thermoplastic composites
5.1 Introduction High-performance continuous fiber reinforced plastics (CFRP) are lightweight and compete in stiffness and strength with their metal counterparts. CFRPs are increasingly used in the automotive and aerospace industries. Modern commercial aircraft like the Boeing 787 and the Airbus 350 XWB contain up to 50 % composites of their structural weight. The majority of these composites have a thermoset rather than a thermoplastic matrix. The high costs of material and production costs of composites are the main obstacle for broader application. The ability of thermoplastics to melt allows alternative automated production methods, like thermoforming and welding, which may lead to better cost-effectiveness [1]. Complex shaped parts like stringers and ribs, for example, are produced by hot-press forming. Preconsolidated laminates are heated above melting temperature and are subsequently formed and reconsolidated under high pressure in a molding press. The process has forming limits, which are usually reached when composite plies wrinkle excessively, causing unwanted shape distortions. The conditions, under which wrinkling occurs, however, are not known beforehand. This may result in expensive redesign of the product and the molding tools in the late development phase. Such defects can be anticipated only by a thorough understanding of the deformation behavior. Several deformation mechanisms are considered to add up to the total deformation [2–4], and the material may be characterized by measuring the resistance against the deformation of each separate deformation mechanism. By means of finite element models, the risk of wrinkle formation can be assessed with a set of three deformation mechanisms (inter-ply slippage, intra-ply shear and out-of-plane bending), provided that accurate material properties are available [5]. While inter-ply slippage and intra-ply shear were tested by several researchers at high temperature, available bending characterization methods are primarily focused on dry fabrics at ambient temperature [6–8]. The bending of preconsolidated thermoplastic composites with unidirectional fibers above melting temperature was investigated by Martin et al. [3], with a custom-built set-up. The authors assume that the entire bending behavior is governed by shear and describe the continuous fiber reinforced thermoplastic (CFRT) as an incompressible viscous fluid reinforced with a single family of inextensible fibers. The mechanism established a V-bending which imposed a fully constrained deformation to determine the transverse and longitudinal shear viscosity, depending on the lay-up of the tested laminate. This sophisticated set-up is not commercially available nor easy to reproduce. This paper presents a more pragmatic design of a bending set-up which consists of a simple fixture mounted onto the rotating shaft of a rheometer. The capabilities of the rheometer, equipped with a thermal chamber, promote relative ease of the handling as well as precise measurements under controlled conditions. The equipment also
5.2. Description of the bending mechanics for elastic specimens
65
allows tests in an inert nitrogen environment, preventing the degradation of the material by reacting with oxygen. In contrast to the V-bending method, however, the deformed shape is not fully prescribed. The set-up is evaluated for purely elastic materials, using the Timoshenko bending theory [9]. Also, spurious effects of friction and spacing between specimen and fixture are assessed, which increase for greater deformation. A model that characterizes the viscoelastic behavior of thermoplastic composites above its melt temperature is introduced subsequently, describing the composite as layers of elastic fibers and viscous polymeric interlayers. Preliminary bending tests were performed on UD carbon PEEK specimens. The results are analyzed by determining an apparent Young’s modulus and shear viscosity of the material, which may serve as material parameters in FE simulations.
5.2 Description of the bending mechanics for elastic specimens The set-up will be evaluated with purely elastic specimens, of known material properties. The theoretical load conditions and deformation are derived for a linearelastic, isotropic, homogeneous beam, which exhibits a bending stiffness EI and shear stiffness kGA, where E represents the Young’s modulus, I the second moment of area, G the shear modulus, A the cross section area and k a shear correction factor, which is approximately 5/6 for rectangular cross sections [9]. Applying the Timoshenko beam theory the local curvature κ is: κ=
M q 1 , = − ρ EI kGA
(5.1)
where ρ represents the bending radius, M the moment and q the load distribution. The considered mechanism to bend a specimen is shown in Figure 5.1a. The specimen
Figure 5.1
a) Schematic representation of the bending set-up, b) force equilibrium of the specimen in the fixture, and c) force equilibrium on the curved part of the specimen.
66
Chapter 5. A novel bending characterization method for thermoplastic composites
Figure 5.2
Force equilibrium on infinitesimal beam section.
is held by a two-piece fixture, one side with a fixed position and the other rotating around a pivot, in which a moment Mc is applied. In contrast to the tailored motion path used in the KES-F test for bending [6], here the fixture describes a circular path, such that the length of a virtual circular arc, larc = ρ · α, decreases when the bending angle α increases. Therefore, the specimen is not tightly clamped in the fixture but additional space d is left to allow a lateral movement of the specimen to compensate for the shortening of the arc. Friction may occur due to the sliding in the fixture, which will be modeled as Coulomb’s friction characterized by the friction coefficient μ. The resulting friction forces that correspond to the transverse loads in the fixture are summed up to an equivalent force F. The direction of the friction force is directed opposite to the sliding direction. Thus, it is a compressive force when the bending angle α increases, and an extensional force when the angle α decreases. Three different sections can be distinguished in the deformed specimen. The outer end of the specimen for s = [0, a] is straight, having one surface fully in contact with the fixture (see Figure 5.1b). In the subsequent section s = [ a, b] the specimen bends inside the fixture until it makes contact again with the edge of the orifice. The third section is the arc between the two parts of the fixture. With an increasing amount of shear deformation, a sharp bend in the beam becomes more prominent in point s = b, causing the middle section to be shorter and more straight. Equation (5.1) is solved with different boundary conditions for each section. For the first section yields κ = 0 and M (0) = 0. The force equilibrium on an infinitesimal dM beam section requires that the distributed load q = dV ds and the shear force V = ds (shown in Figure 5.2). Equation (5.1) can therefore be rewritten for the first straight section as a second order differential equation for M(1) , where the parenthesized superscript denotes the numbered section:
−
d 2 M (1) + C · M(1) = 0. ds2
Note that C is a constant defined as C = loads V (1) and q(1) can be deduced.
(5.2) kGA EI .
After solving M(1) , also the transverse
The boundary conditions for the second section prescribe the vertical displacements
67
5.3. Experimental bending set-up
w( a) = 0, w(b) = d as well as the deflection angle
�
dw � dx � x = a
= 0.
The middle section also has prescribed positions of the start and end point, determined by the position of the fixture, thus by length l and angle α. Furthermore, the deflection angles in the same points are prescribed and follow from the deflection angle of the previous section and the shear caused by force P. The functions for M(3) and q(3) for solving the deformation on the middle section, result from the force equilibrium shown in Figure 5.1b. In contrast to the other sections, the deformation of the middle section is large, such that the friction force F contributes to M(3) and q (3) . The length of each section can change, the only requirement is a constant total length L. The equations of the three beam sections are connected by force equilibria, forming a complex system of equations. Because of this complexity, a numerical method with an iterative scheme is applied to get a converged solution of this problem. Finally, the moment Mc can be related to the rotation angle α, which are the two variables measured in an experimental set-up. This analysis will be used to evaluate the set-up with a purely elastic material and to assess the spurious effects of friction and spacing between the specimen and holder.
5.3 Experimental bending set-up A custom-built bending set-up (Figure 5.3) was developed at the University of Twente in collaboration with TPRC [10]. It is mounted in an Anton Paar rheometer MCR 501 equipped with a thermal chamber CTD 450. A thin rectangular specimen (L × W = 35 × 25 mm2 ) is bent by the rotation of the upper shaft. The equipment enables a precise control of the rotation angle α and the rotational velocity ω. It measures the applied shaft moment Mc , which is corrected automatically for inertial effects caused by the motor and fixture. The experiments can be conducted in a temperature controlled nitrogen atmosphere up to 450 ◦ C. As mentioned before, the specimen is not tightly fixed in the fixture and rests on two support pins, to allow sliding in horizontal direction. The ends of the specimen are covered with heat resistant polyimide tape to avoid stick between the molten thermoplastic resin and the fixture. The arm length l (see Figure 5.1a) is geometrically determined by the distance between the opening of the specimen holders and the shaft axis and is equal to 7.5 mm in length, independent of the rotation angle α.
68
Chapter 5. A novel bending characterization method for thermoplastic composites ��������� ��� �
������ ��� �
� ��� � ���������� �� �� ���
Figure 5.3
Experimental bending set-up. Two-part fixture is mounted on the shafts of a torsional rheometer. Specimen is placed loosely between the holders resting on support pins.
5.4 Evaluation with a purely elastic specimen The bending set-up was evaluated with an elastic brass specimen with a thickness H of 0.75 mm and a Young’s modulus of 110 GPa (determined by a tensile test). Since the shear modulus G is of the same order of magnitude as the Young’s modulus E but L >> H the shear can be neglected in this experiment and Equation (5.1) simplifies to: κ=
M . EI
(5.3)
In this special case the transverse load in the first section is concentrated to a point load in s = a, consequently no moments are present in the straight section, i.e. M(1) = 0. The value of length a is therefore arbitrary, as it does not affect the total solution. The friction coefficient between the brass specimen and the steel fixture is estimated to be μ = 0.35 [11], and the spacing d between the fixture and the specimen amounts to 0.3 mm. With these values, the model can be compared with the experimental results. Figure 5.4 relates the moment of the shaft Mc with the rotation angle α, showing a good agreement between experiments and model. It also captures the different responses for increasing versus decreasing rotation angle α, for which the friction forces are pointed in opposite directions.
69
5.5. Effects of friction and spacing in fixture
��� �� ����������� �� �
� �� Mc � % �
�
� �!�d�"��#�� $
�
"��#��
� � � � � � �
Figure 5.4
��
�� �������������
��
�
���
Plot of the experimental and predicted shaft moment versus the rotation angle for the test case with a brass specimen.
5.5 Effects of friction and spacing in fixture The effects of friction and spacing on the measurement moment are assessed for an elastic beam where either deforms predominantly by bending, or by shear deformation.
5.5.1 Pure bending The response in terms of the moment Mc as function of the rotation angle α depends on the parameters μ, d and EI (shown in Figure 5.5). Mc can be normalized by the bending stiffness EI, since both are linearly related. The moment curve for forward bending is higher than for reverse bending when friction is taken into account. Both curves form an envelope around the moment curve with no friction, which becomes wider for greater bending angles and higher friction. For μ = 0.5 and α = 60 deg the difference in comparison to the frictionless case amounts to more than 20 %. When the spacing inside the fixture is decreased, the moment curves are shifted towards smaller rotation angles for both the forward bending and the reverse bending, since tighter fixtures induce stronger deformations outside the fixture. On the other hand the envelope becomes wider, which relates to greater friction forces. Since deformations become smaller in the fixture also the contact points s = a and s = b get closer to each other. To yield the same moment the transverse forces in these points have to increase, which also leads to higher friction forces. The length of the specimen, l, has no effect on the moment, since no forces are acting on the straight first section of the specimen. Thus, the length of the first section is
70
Chapter 5. A novel bending characterization method for thermoplastic composites ����
μ ����� μ ����� μ ������
���� ����
� � Mc/EI ������
� � Mc/EI ������
����
���� ���� ����
d ����� ��
�
� ��� �M� /GA ��
�
Figure 5.5
��
� � � � � � � �
�� �� � ����
�� �� ���
d �����
l �����
��
Figure 5.6
���� ���� d���������� d��������� d���������
����
��
�
�� �� � ����
�� �� ���
��
��
Characteristic curves between moment and rotation angle for pure bending: a) effect of the coefficient of friction between specimen and fixture, b) effect of spacing between specimen and fixture. The length of the specimen is arbitrary. μ ����� μ ����� μ ������
�
����
� �
��
μ ������
����
�� �� �� � ���� ������� ���
��
� � � � � � � �
μ ������
l �����
�
��
��
� � � � � � � �
d��������
d�������
d�������
�� �� � ���� ������� ���
��
l������
l������
l������
d �������
μ ������ �
��
�� �� � ���� ������� ���
��
Characteristic curves between moment and rotation angle for pure shear: a) effect of the coefficient of friction between specimen and fixture, b) effect of spacing between specimen and fixture.
arbitrary.
5.5.2 Pure shear In the case that the deformation is dominated by shear, i.e. GE = ∞, the moment Mc depends linearly on the shear stiffness GA. Therefore, the moments are now normalized with the shear stiffness. Friction and spacing inside the fixture have very similar effects on the moment curves when shear is the only deformation mechanism, instead of pure bending. Figure 5.6a shows the envelope formed by the forward and reverse bending curves being widened for increasing friction. For an increasing spacing, the moment curves
5.6. Development of a viscoelastic bending model
71
also shift to smaller rotation angles like for pure bending, but the width of the envelope is nearly unaffected (see Figure 5.6b). In contrast to pure bending where no deformation took place in the end sections, now deformation only takes place in the end sections, meaning that the length of the specimen is of crucial importance. Naturally, the longer the specimen, the larger the moment Mc (see Figure 5.6c). The main difference between the two deformation mechanisms in the moment curve is the different scaling with either the cross-section area or with the second moment of inertia. Friction plays a role in both cases but is less severe for the shear dominated deformation. While the cross-section area scales linearly with the thickness, the second moment of area should scale with the cube of the thickness. However, this is only the case if the material is considered as a continuum with homogeneous properties. This might be applicable for the thermoplastic matrix, but it is not true for the fibers, since they form separate stiff beams held together by a comparatively soft matrix. When testing thermoplastic composite specimens, it is observed that they expand strongly in the thickness direction due to the heat. Therefore, the spacing in the fixture vanishes. A polyimide film separates the molten specimen from the fixture, but the friction is rather unknown. For deformation angles smaller than 30◦ , the friction effects are still small, allowing accurate measurements.
5.6 Development of a viscoelastic bending model A viscoelastic bending model is derived based on the micromechanics in a CFRP. Zooming in to the scale of fibers and resin interlayers, we distinguish between the elastic fiber filaments and a highly viscous polymeric matrix. The fiber deformation can be described by the Euler-Bernoulli beam theory neglecting the deformation due to shear, considering the ratio between the length and the diameter of the fiber. The thermoplastic matrix, on the other hand, is assumed to be an incompressible viscous liquid which is predominantly subjected to shear. Fibers and resin interlayers are oriented along the length of the beam. For the sake of simplicity, fiber and matrix are described as layers that span over the entire width W and length L of the beam, that have a uniform thickness and are evenly distributed over the thickness (see Figure 5.7). The layers are numbered from bottom to top, with odd numbers for the fiber layers and even numbers for the polymer interlayers. A polar co-ordinate system is most convenient for the current purpose. The azimuthal strain in a specific fiber layer i is: εi (r ) =
r − 1, r0i
(5.4)
72
Chapter 5. A novel bending characterization method for thermoplastic composites
�
������������
������������
Figure 5.7
Beam composed of solid and viscous layers.
where r0i denotes the radius of the center-line of the layer and r denotes the radial coordinate with the same origin as r0i . The corresponding displacement in azimuthal direction follows from: ui (r, θ ) =
�θ
εi rdθ =
0
r − 1 rθ, r0i
(5.5)
where θ denotes the local deflection angle of the beam. The shear in the polymer interlayer results from the respective azimuthal displacement of the two adjacent fiber layers: � � � � � h h ui+1 r0i+1 − 2f , θ − ui−1 r0i−1 + 2f , θ dw , (5.6) + γi ( θ ) = hm ds with h f and hm as the thickness of the fiber and matrix layer, respectively, w as the radial displacement and s as the coordinate along the beam length. Since H + l, t = · t. 2 2
(5.15)
(5.16)
According to this model the shear in the straight ends of the beam is not influencing the deformation in the free arc. The moment Mc that is exerted on the shaft is related to M( L/2 + l, t) and V ( L, t) according to: � � � � � � L L L Mc = M + l, t − V + l, t l − V ( L, t) −l . (5.17) 2 2 2 ˙ the magnitude Since the shear forces depend only on the local deflection angle rate θ, of the shear forces in the straight subsection is constant. This simplifies the previous equation to: � � � � L L . (5.18) + l, t − V ( L, t) Mc = M 2 2 A finite moment works on the shaft when the movement is initiated and is equal to: Mc (t = 0) = −V ( L, t)
˙ HL L η αW = . 2 4
(5.19)
Subsequently, the moment increases partially due to increasing shear rates but mainly by bending of the fibers. After a short start-up phase steady shear rates are reached, which increase linearly from the center of the beam to the orifice of the fixture: ∂θ α˙ s − L2 . (s, t) = ∂t 2 l
(5.20)
Substituting Equation (5.20) into (5.12) yields an expression for the deflection angle θ. A long-term solution is obtained by using the boundary conditions in Equation (5.15) l2 . The corresponding moment Mc for the long and (5.19) and assuming that t >> 3D
75
5.7. Bending of UD carbon PEEK
term solution is: α EI f H α˙ Mc = + ηW H 2 l h f + hm 2
�
L l + 3 2
� .
(5.21)
By means of Equation (5.21) the model can be fitted on measurements of CFRP specimens yielding an apparent viscosity η and an apparent Young’s modulus E.
5.7 Bending of UD carbon PEEK Specimens were cut from UD carbon PEEK tape (supplied by Ten Cate as Cetex Thermo-Lite 1467I) and from preconsolidated laminates with various thicknesses. All fibers are oriented in the same direction. Consequently, the lay-up is described by [0]n , where n indicates the number of plies. The specimens were placed into the fixture with the fiber orientation horizontally aligned, i.e. parallel to the x-axis. Other lay-ups can be evaluated in the same set-up, but are not considered in the current paper to avoid further complexity. Thermo-resistant tape was attached to the specimen ends, to prevent sticking to the holders, reducing the friction to the slippage condition already evaluated with the brass specimens. The tests were performed in nitrogen atmosphere. A heating time of about 3 minutes was used to establish a homogeneous temperature before the specimen was bent. The spacing between the specimen and the fixture is assumed to be zero, as it was observed that the specimen expands in thickness direction at high temperatures. Repetitive bending cycles (axis rotation from 0◦ to 60◦ to -10◦ to 0◦ ) of a single specimen showed that the virgin specimen exhibits the highest bending rigidity in the first cycle. The bending stiffness of subsequent cycles depends on the duration of the idle time between the cycles. The best repeatability of the moment plots was obtained when an idle time of 10 seconds was used between two subsequent measurements. For convenience, we use the bending stiffness measured while increasing the bending angle in the subsequent cycles to analyze the influences of ply thickness, rotational velocity, and temperature. Figure 5.8a compares the moment curves of different specimens with various thicknesses. It can be recognized that the moment Mc scales fairly linearly to the rotation angle α after a short start-up phase. This behavior might be interpreted as a viscoelastic phenomenon, where the slope is related to an elastic contribution, and the extrapolated height at α = 0 is related to a viscous contribution. The Equation (5.21) was fitted on the moment curves from 10◦ to 30◦ axis rotation, yielding an apparent Young’s modulus E and shear viscosity η. Based on these parameters Equation (5.12) is solved, yielding a moment curve, which is shown along with the measurements as dashed line. The values of the corresponding material parameters η and E are listed below the figures.
76
Chapter 5. A novel bending characterization method for thermoplastic composites
��
�� �� � M � �� �
��
�� � M � �� �
T � ��� �� α� � � ��
�
n��
�
n��
�
n��
�
n��
� �
�� �� �� � ��� ���� α ���
��
n � #plies 8 4 2 1
Figure 5.8
E � GPa 779 708 823 763
η � kPa · s 58 43 26 32
T � ��� �� n � �
�� �
��
�� α� α�
� �
α�
�
α�
�
��
�
��
α˙ � rpm 10 5 1 0.1
�� �� �� � ��� ���� α ���
E � GPa 1759 1248 823 763
��
η � kPa · s 15 22 59 321
Moment plot of UD carbon PEEK specimens. (a) Varying specimen thickness, indicated by ˙ Top: graphical representation, the number of layers n. (b) varying rotational velocity α. where the dashed line represents the fit of the viscoelastic model. Bottom: table of the according fit parameters.
Figure 5.8b shows the influence of the rotational velocity on the moment curve and the corresponding model fit. While the apparent Young’s modulus doubles from 1 to 10 rpm rotational velocity, it only increases slightly from 0.1 to 1 rpm rotational velocity. Remarkably, the apparent viscosity decreases with increasing rotation rate, although the actual shear rate is lower than 1 s−1 , at which no essential shear thinning behavior is expected. The increase of the apparent Young’s modulus by the factor of two, while increasing the rotational velocity from 1 to 10 rpm, can also be observed at other temperatures as shown in Figure 5.9. As the matrix viscosity decreases at increasing temperature, the viscous and elastic effects reduce as well. Nevertheless, the graphs at 385 ◦ C and at 400 ◦ C are almost equal.
77
5.8. Discussion
n � � α� � � ��
��
��
��� �� ��� �� ��� �� ��� ��
� �
�� � M � �� �
�� � M � �� �
��
� �
n � � α� � �� ��
�� � � � � �
� �
�� �� �� � ��� ���� α ���
��
◦T � C 360 370 385 400 Figure 5.9
E � GPa 1404 1019 738 718
η � kPa · s 106 77 44 41
��
�
�� �� �� � ��� ���� α ���
◦n � C 360 370 385 400
E � GPa 3109 2507 1873 1641
��
��
η � kPa · s 25 20 11 13
Moment plot of UD carbon PEEK specimens at varying temperatures T. (a) Experiments at rotational velocity α˙ = 1 rpm. (b) Experiments at rotational velocity α˙ = 10 rpm. Top: graphical representation, where the dashed line represents the fit of the viscoelastic model. Bottom: table of the according fit parameters.
5.8 Discussion The value of the fit parameters in terms of an apparent viscosity η and Young’s modulus E are much higher than the bulk material properties. The viscosity of the PEEK grade (Victrex PEEK 150P) is below 1000 Pa · s [12] and the E-modulus of carbon fiber (AS4) is around 230 GPa [13]. Also, the parameters change at different conditions. Therefore, it has to be noted that the fit parameters are not actual material properties but characterize certain deformation mechanisms. The deformation of the specimen described by Equations (5.12) and (5.13) is independent of the specimen thickness H. Consequently, the specimen thickness is expected not to have an influence on the apparent material properties. Figure 5.10a shows little variance in the apparent Young’s modulus (Figure 5.10 a) due to thickness variation. The measured shear viscosity, however, is lower for thinner specimens. Figure 5.10b shows a strong increase of the viscosity for decreasing deformation rates. Since the viscosity is related to intra-ply shear, literature values [14–16] for comparison are available and are shown in Figure 5.11. For this research the shear rate is approximated by γ˙ = α2˙ . All data show the same trends, confirming that the apparent viscosity is increasing with decreasing shear rate. Sachs et al. [16] have not
78
Chapter 5. A novel bending characterization method for thermoplastic composites
E �����
������� �����
����� �����
T � � � � α� � � ��
����� ���
�����
�����
�����
�����
�
�
�� � � � � � � �
������������������ n ��������
T � � � � n � ������
�����
E �����
�������
�����
����� n � �������
����� ���
�����
���
����� �� � � �� !����!��"��!���# α� � ���
�
�� ��� � � ��� $���� ��% � T �� �
Trends of the fit coefficients η and E due to changing test conditions: a) laminate thickness, b) rotational velocity and c) temperature.
������� �
����
Figure 5.10
�������
E ����� �����
��������������������� �������������� �!� ""# � �������� � �!$� ��!%�&�$$�!��' �()�� ���� ��� ������et al.�������� �!� ""#�� ��*����� �����
Figure 5.11
����
��� � �� �������� � � ����
���
����
Comparison of apparent shear viscosities with different researches: Groves [14], Stanley and Mallon [15], Sachs et al. [16].
investigated the intra-ply shear, but measured the friction stress between a composite laminate and a metal surface. Effectively, a single resin interlayer with an average thickness of a fiber diameter was sheared, which is comparable with the intra-ply shear mechanism. The high apparent viscosities for low shear rates were assumed to be caused by boundary lubrication effects that occur when the resin film is less than a few micrometers thick [17]. The apparent Young’s modulus clearly increases with increasing rotational velocity (Figure 5.10b). Since the Young’s modulus of the carbon fiber itself is constant, the assumption of a constant second moment of area I might be erroneous. During bending the fibers have to slide along each other. If fibers interlock, e.g. by
5.9. Conclusion
79
entanglement, the sliding is obstructed causing an increase of the effective second moment of area I. The interlocking of the fibers is likely to be increased by increasing deformation rates, since the time for fiber rearrangement is shorter. Fiber interlocking may be minimal at rest and increases gradually in the start-up phase. This effect would also explain the slower increase of the moment curve in Figures 5.8 and 5.9 than is predicted by the model. As expected, the values of the fit parameters are decreasing with increasing temperature until 385 ◦ C. The difference from 385 ◦ C to 400 ◦ C, however, is minimal. It is believed that the molecular chains of PEEK are cross-linking at high temperatures [18–20], leading to a viscosity increase. This might explain the relatively high values of the fit coefficients at 400 ◦ C. The model does not consider fiber stresses, which may be caused by the shear. It can be imagined that tensional stress occurs on the outside of the arc and compressional stresses at the inside of the arc. The bending test can fail when the compressional stresses become too high, causing the fibers to buckle. The effect of the fiber stresses on the beam deformation and the measured moment will be part of future work.
5.9 Conclusion Bending of UD laminates with a uniform lay-up is dominated by intra-ply shear deformations and fiber bending. This paper translates UD laminate bending into the basic deformation mechanisms at fiber and matrix level and characterizes the bending behavior in terms of an apparent shear viscosity coupled to shear deflection rate and Young’s modulus coupled to the flexure of fibers. A novel test method is presented which has the potential to measure the composite bending behavior accurately exploiting the capabilities of a commercial rheometer. Spurious clamping effects on the measurements are recognized and investigated, allowing a good interpretation of the measured moment curves. The obtained intra-ply shear viscosity is comparable with literature values. Further evaluations of the characterization method are necessary, for example fiber stresses were neglected in the model but may have significance on the apparent Young’s modulus. The results may be used in Finite Element Methods for virtual forming simulations of complex 3D structures.
5.10 Acknowledgements This project is funded by the ThermoPlastic composites Research Center (TPRC). The support of the Region Twente and the Gelderland & Overijssel team for the TPRC, by means of the GO Programme EFRO 2007-2015, is also gratefully acknowledged.
80
Chapter 5. A novel bending characterization method for thermoplastic composites
The authors wish to thank Christiaan ten Hove, who has developed the set-up and performed most of the experimental work in his master studies.
References [1] A. R. Offringa, Thermoplastic composites–rapid processing applications, Composites Part A: Applied Science and Manufacturing 27 (4) (1996) 329–336. [2] A. M. Murtagh, P. J. Mallon, Chapter 5 Characterisation of shearing and frictional behaviour during sheet forming, in: Composite Sheet Forming, Vol. 11, Elsevier, 1997, pp. 163–216. [3] T. A. Martin, S. J. Mander, R. J. Dykes, D. Bhattacharyya, Chapter 9 Bending of continuous fibre-reinforced thermoplastic sheets, in: D. Bhattacharyya (Ed.), Composite Materials Series, Vol. 11 of Composite Sheet Forming, Elsevier, 1997, pp. 371–401. [4] A. C. Long, Design And Manufacture of Textile Composites, Woodhead, 2005. [5] S. P. Haanappel, Forming of UD fibre reinforced thermoplastics, Ph.D. thesis, University of Twente, Enschede, The Netherlands (Apr. 2013). [6] S. V. Lomov, I. Verpoest, M. Barburski, J. Laperre, Carbon composites based on multiaxial multiply stitched preforms. Part 2. KES-F characterisation of the deformability of the preforms at low loads, Composites Part A: Applied Science and Manufacturing 34 (4) (2003) 359–370. [7] A. G. De Boos, D. H. Tester, A. G. De Boos, CSIRO, Division of Wool Technology, SiroFast, Fabric Assurance by Simple Testing: a system for fabric objective measurement and its application in fabric and garment manufacture, CSIRO Division of Wool Technology, Geelong, 1997. [8] D13 Committee, Test method for stiffness of fabrics, Tech. rep., ASTM International (2007). [9] S. Timoshenko, J. M. Gere, Mechanics of materials. (S.I. edition.)., Van Nostrand Reinhold Co., New York, etc., 1973. [10] C. H. ten Hove, Bending of CF/PEEK pregregs, M.Sc. thesis, University of Twente, Enschede, The Netherlands (Aug. 2012). [11] website, http://www.engineeringtoolbox.com/friction-coefficients-d_778.html, Visited: September 2014. [12] Autodesk, MoldFlow 2013. [13] Hexcel, HexTow AS4 carbon fiber product data (Mar. 2013). [14] D. J. Groves, A characterization of shear flow in continuous fibre thermoplastic laminates, Composites 20 (1) (1989) 28–32. [15] W. F. Stanley, P. J. Mallon, Intraply shear characterisation of a fibre reinforced thermoplastic composite, Composites Part A: Applied Science and Manufacturing 37 (6) (2006) 939–948.
References
81
[16] U. Sachs, R. Akkerman, B. Rietman, A lubrication approach to friction in forming processes with thermoplastic UD composites, submitted to Composites Part A. [17] C. Clasen, H. P. Kavehpour, G. H. McKinley, Bridging tribology and microrheology of thin films, Applied Rheology 20 (4). [18] J. N. Hay, D. J. Kemmish, Thermal decomposition of poly (aryl ether ketones), Polymer 28 (12) (1987) 2047–2051. [19] A. Jonas, R. Legras, Thermal stability and crystallization of poly (aryl ether ether ketone), Polymer 32 (15) (1991) 2691–2706. [20] P. Patel, T. R. Hull, R. W. McCabe, D. Flath, J. Grasmeder, M. Percy, Mechanism of thermal decomposition of poly(ether ether ketone) (PEEK) from a review of decomposition studies, Polymer Degradation and Stability 95 (5) (2010) 709–718.
82
Chapter 5. A novel bending characterization method for thermoplastic composites
Chapter 6 Discussion The objectives of this research were defined as: • To develop characterization methods needed to identify the material behavior related to the out-of-plane deformation mechanisms in 3-D stamp forming; • To obtain a profound understanding of the underlying microscopic mechanisms and to develop constitutive equations that correctly represent the deformation behavior of the thermoplastic composite laminates. Here, the results of the previous chapters are discussed with respect to the objectives in question. Subsequently, the results will be evaluated from the perspective of the actual press forming operations and the actual process conditions.
6.1 Characterization methods and constitutive equations Characterization methods for composite forming simulations need to reflect the conditions that are present in the actual forming process. Furthermore, the considered deformation mechanism has to be invoked with minimum interference from other deformation modes. The two different characterization methods for friction and bending, respectively, will be critically reviewed with respect to these considerations. Subsequently, the relation between the macroscopically observed deformation behavior and the underlying micro- and mesoscopic deformation mechanisms will be discussed. Finally, the measurement results need to be translated into geometry independent material properties which can be used for arbitrary layups, process conditions and geometries. 83
84
Chapter 6. Discussion
6.1.1 Inter-ply slip and tool-ply slip (friction) Characterization method Various authors presented experimental results on inter-ply slip of thermoplastic composites under thermoforming conditions [1–6]. Validation of their results was, however, impossible in the absence of a test standard. This resulted in a variety of custom-built set-ups and procedures, such that the experiments are not easily reproduced. In the experimental benchmark, as described in Chapter 2, a range of different set-ups were compared and reviewed critically, leading to a list of important features of a good characterization method, briefly summarized as: • homogeneous test conditions (temperature and pressure) on the friction interface • stiff set-up configuration • short test periods (to minimize thermal degradation) The friction test set-up as utilized in this research was designed to fulfill these requirements. It applies a normal force in the center of the friction interface while the clamping surfaces can rotate freely around the center of gravity. This induces an automatic alignment of the two clamping surfaces. The pressure platens are not subjected to the frictional forces, as these are carried by the metal foils which are clamped independently. In this manner, no moments are generated which would induce misalignment of the pressure platens during the experiment. The specimen is heated locally at the friction interface and additionally on parts that will be pulled into the friction area. This ensures a homogeneous temperature distribution during the test. The measurement of the transient start-up phase is influenced by the compliancy of the system, therefore a stiff set-up (including the test fixture and the specimen) is required. The experiment with dry fabric and with molten fabric reinforced composites (Chapter 2) showed that the stretch of undulated fibers leads to longer start-up phases with lower peak frictions. The fiber stretch in preconsolidated CFRTPs is restricted to the region with molten matrix and is therefore minimized in the current set-up. UD fiber reinforced thermoplastics exhibit very little crimp and also show much shorter transient start-up phases than observed in wovenfabric composites. The different duration of the start-up may also be caused by the development of the resin-rich interlayer. While the thickness of the resin interlayer is expected to increase during start-up for woven composites, the interlayer for UD composites is assumed to remain constant in thickness throughout the experiment. The polymer matrix suffers from degradation while exposed to high temperatures, especially in the presence of oxygen. Therefore, it is preferred that the test procedure
6.1. Characterization methods and constitutive equations
85
is short with a fixed heating time. The clamping surfaces are kept at a fixed high temperature and heat the specimen up within a few seconds after contact. However, a heating time of 3 minutes is kept, to allow the temperature to settle and to imitate the heating time in the actual process more closely. Constitutive equation Constitutive equations have been derived that describe the friction behavior of CFRTPs, based on the underlying physical phenomena that occur on the microscopic scale, rather than fitting experimental results with an empirical equation. This has the advantage that predictions can be made with more confidence for conditions that cannot be achieved in the experimental set-up, such as quickly varying temperatures, pressures or sliding velocities. For woven composites a physical based model was already introduced by Ten Thije et al. [7], describing the friction as hydrodynamically lubricated, based on the shear flow of the resin-rich interlayer. The predictions by the model agree with experimental results that are obtained with the evaluated set-up. The hydrodynamically lubricated friction is well described by a Stribeck curve which includes the effects of temperature, pressure, and sliding velocity. A similar approach has now been undertaken for UD composites (Chapter 4). Again a hydrodynamic lubrication is assumed but the dominant microscopic phenomena are different than in woven composites, because of the much smaller resin-rich interface. Boundary lubrication phenomena become dominant for low sliding velocities and microscopic wall slip between resin and fiber/metal at high sliding velocities prevails at high sliding velocities. Interestingly, the boundary lubrication was observed to be independent of the pressure. Therefore, it is not considered to be caused by contact of the hard surfaces (i.e. fiber and metal), but rather by a particulate structure (e.g. dust) contained in the fluid as supposed by Clasen et al. [8]. They observed this effect for different fluids of low viscosities (1–10 Pa · s) in a dedicated set-up. It was assumed that the number of particulates determines the amount of the boundary lubrication effect. A quantitative verification of this hypothesis for the thermoplastics used here was beyond the scope of this research. The wall slip, that occurs at high sliding velocities, is actually a quite complex behavior and is reported to depend on shear rate, normal stresses, temperature and molecular characteristics of the polymer [9]. Furthermore, a transient phase of the wall slip was observed [9, 10], in which higher shear stresses can occur than in the steady-state phase. Steady-state wall shear stresses for different polymers (LLDPE, PBD and FEP) in contact with a clean metal surface were presented by Hatzikiriakos et al. [9], exhibiting an intermediate plateau (the onset of strong slip) of around 200–300 kPa. This corresponds with the steady-state shear stress that was
86
Chapter 6. Discussion
measured at high normal pressures (220 kPa) for UD carbon PEEK (Chapter 4). An investigation of the wall slip behavior of PEEK, however, would be necessary to confirm the causality and may enable the prediction for low normal pressure and peak shear stresses as well. All these effects (boundary lubrication, hydrodynamic lubrication and wall slip) are partially determined by the thickness of the resin-rich interlayer. This thickness is not known beforehand and may depend on the constituents and the preceding steps in the composite manufacturing process. Since the thickness is assumed to be invariable, it could be measured straightforwardly by microscopic inspection of a preconsolidated specimen. An accurate initial estimation of the resin-rich interlayer geometry would make these microscopic inspections redundant. Overall, the measured peak shear stress of UD composites can be described by a master curve, similar to the Stribeck curve for woven composites. This master curve relates the shear stress to a single parameter defined as the product of sliding velocity and zero shear viscosity and it can be approximated well by a power-law function. This power-law function is valid on a wide range of sliding velocities covering about three decades and can be used as constitutive equation to describe the inter-ply slip behavior of unidirectional prepreg materials.
6.1.2 Bending Previously, it was shown that the bending properties have an important influence on the unwanted wrinkling behavior [11, 12], which emphasizes the need for well characterized bending behavior. Bending of thermoplastic composites under thermoforming conditions, however, is scarcely investigated in the literature which is, so far, mainly directed to intra-ply shear and inter-ply friction. It might have been neglected, since it is considered to be fully governed by intra-ply shear, which was also the approach of Martin et al. [13]. Their experiments were performed with a complex custom-built set-up and are therefore difficult to reproduce. Due to the unavailability of characterization methods a novel method was developed, that can measure viscoelastic bending behavior under thermoforming conditions (Chapter 5). Characterization method The requirements for proper measurements of the bending properties of a thermoplastic composite material can be summarized as: • Control of spurious effects such as friction and clearance in the fixture. • Well controlled test parameters, i.e. temperature and deformation rate. • Accurate measurement of bending moment.
6.1. Characterization methods and constitutive equations
87
• Inert atmosphere and short test periods (to minimize thermal degradation). The new method was analyzed thoroughly, critically evaluating the effects of parameters that might impair the measurement results. For the presented set-up, these parameters are primarily the coefficient of friction between specimen and fixture and the clearance in the specimen fixture. Based on a validation analysis, these effects can be considered to be negligible at sufficiently small deformation angles (smaller than 30 ◦ C). The friction is minimized (and made predictable) by attaching polyimide tape to the end of the specimen, which prevents contact between molten polymer with the metal fixture. The test parameters are well controlled by exploiting the mature capabilities of a commercially available rheometer. The bending moment is precisely measured by the built-in measuring system. The thermal chamber of the rheometer allows experiments in a nitrogen atmosphere with good temperature control. Since the specimen is not clamped in the fixture, loading and unloading of the specimen takes only 30 seconds. Hence, the set-up hardly cools down during specimen loading which helps to keep the time of the test specimen at elevated temperature short. Constitutive equation The measured bending moments were found to have significant viscous and elastic contributions. A constitutive model was developed based on micromechanical considerations, which translates the measured response into apparent material parameters. These parameters are an elastic bending modulus and an intra-ply shear viscosity. These apparent material parameters are still functions of the test conditions (temperature and bending rate) and are also slightly dependent on the geometry thickness. Further analysis is still required to obtain actual material parameters from the response, which are condition and geometry independent. Specimens of different lengths should also be tested to verify the geometry independency of these material parameters. The micromechanical deformation mechanisms of intra-ply shear should be similar to those occurring during inter-ply slip. A comparison between the apparent viscosities obtained from the bending experiments and the inter-ply slip experiments shows equivalent values, indicating their close relationship. The estimated shear rates during bending are very low (less than 1/s). At these shear rates, boundary lubrication is assumed to be prevalent, causing an apparent shear viscosity which exceeds the bulk viscosity of the polymer by several decades. The micromechanical deformation mechanisms underlying the elastic bending rigidity are, however, unclear. The composite bending rigidity is bigger than the summation of the bending rigidities of the individual fibers. This discrepancy
88
Chapter 6. Discussion
may be caused by interlocking of fibers, which appears to be more severe at higher deformation rates or at lower temperatures. On a microscopic scale, fiberfiber interactions will induce longitudinal stresses in the filaments during flexural deformations. This, in turn, is observed as a higher bending rigidity on the macroscopic level. The nature of the fiber stress build-up has to be investigated and incorporated in the constitutive equations. Currently the material parameters are determined from the bending experiments by assuming linear elasticity and Newtonian fluid properties in the fibers and matrix, respectively. The flexural deformation, however, leads to a distribution of the shear rate in the matrix layers, increasing from the center of the specimen (no shear) towards the ends that are held by the bending fixture. The polymer matrix exhibits shear thinning effects at low and high apparent shear rates, as observed in Figure 5.11. This implies that a shear thinning model should be used for the matrix contribution in the micromechanically based bending model from the start. The development of this more consistent model will be part of future research. Although not all microscopic mechanisms have been fully elaborated, the macroscopic bending behavior of a composite laminate in forming conditions can be described with a shear-rate-dependent shear viscosity and bending rigidity. An implementation into finite element methods would require finite elements (e.g. plate, shell or 3D brick) that allow transverse shear in a rate-dependent formulation. Finally, although the macroscopic deformation mechanisms for ply slippage, ply bending and axial intra-ply shearing (as introduced in Figure 1.4) are distinctly different, the underlying fiber and matrix deformations on the microscale are of the same nature, at least for the 0◦ fiber orientations studied here. This implies that the responses of the different characterization experiments should be related to each other. Possibly, the result of one characterization experiment can be used to predict the outcome of the other types of experiments. Such a unified approach clearly is a topic for future research.
6.2 Comparison with actual press forming The test conditions should mimic the actual thermoforming conditions, such that the obtained knowledge can be applied in composites forming analyses.
6.2.1 Inter-ply slip and tool-ply slip (friction) The test parameters of sliding velocity, temperature and normal pressure are precisely controlled during the characterization experiments and kept at constant values. In actual press forming, however, all conditions vary in time. Especially the laminate
89
6.2. Comparison with actual press forming
����������
� ������ �� �
��
��������
������������ Figure 6.1
Determining the amount of intra-ply shear. a) Laminate applied with dot patterns on both sides is press formed. b) the difference vectors between the dot pattern geometries before and after press forming (obtained by photogrammetry) are calculated. c) resulting difference vector field for UD carbon PEEK with a quasi-isotropic lay-up of 8 plies.
temperature is subjected to quick changes, as the cooling rate is very high locally when the laminate comes into contact with the tooling, which has a temperature well below the melting point of the matrix. The current test set-up can be used for both high and low temperatures (above as well as below the melting point), which makes it possible to characterize the frictional properties in all conditions needed for accurate simulations. Only if the material’s frictional properties show a temperature history dependency, e.g. at high cooling rates reaching temperature below the melting point, it would be necessary to modify the current test set-up. In this case, a design as presented by Gorczyca et al. [14] can be used. Furthermore, the friction properties are known to be shear rate history dependent, exhibiting a transient peak shear stress after the inception of the deformation. As seen from the benchmark described in Chapter 2, an accurate measurement of transient effects requires a stiff system. Due to the crimp of fibers particularly in woven composites, the stiffness of the system decreases and the duration of the start-up phase might be captured inaccurately. The characterization of the transient phase might be improved by incorporating a stretch effect of the material, but this is currently neglected in the analysis of the test results. Obviously, this effect should then be included not only in the measurement results, but also in the constitutive model for the composite laminate in the forming analysis. The constitutive equations introduced in earlier publications do not consider the deformation history. Instead, the friction is either described by the peak friction or by the steady-state friction, depending on how strong the deformation is expected to be. Products resulting from forming trials showed that the amount of inter-ply slippage for UD carbon PEEK laminates was on the order of the laminate thickness
90
Chapter 6. Discussion
(in this case 1.2 mm), as illustrated in Figure 6.1. Here, the relative displacement of the top ply with respect to the bottom ply was determined by means of digital image analysis. Chapter 4 shows that the transient start-up phase for this material is also in the order of 1 mm, which indicates that the actual forming process remains within this start-up phase. Therefore, the inter-ply shear stress can be approximated by the peak shear stress. To develop a generally valid constitutive equation, the dependency on the deformation history should be included. The friction experiments presented in this thesis restrict shear to the interface between plies or between a metal surface and a ply. In the actual forming process of UD composites shear also occurs through the thickness of a ply (Figure 6.2a), where shear appears to be easier transverse to the fiber direction than longitudinal to the fibers [15]. Still, simple V-bending experiments show that inter-ply shear predominantly takes place between layers of different fiber directions (Figure 6.2b), where fibers cannot migrate and where nesting is prohibited. Even for specimens with unidirectional fiber orientation, steps in the profile indicate slip on the interfaces (which was also observed by other researchers [1, 13, 15]). As seen in Chapter 4, a resin-rich interlayer with an average thickness of about one fiber diameter exists at the outer surface of a ply. This resin-rich interlayer promotes the local shear on the interface. Scherer and Friedrich [1] have made shear experiments with different fiber orientations and also stated that the slip-process is controlled by the shear stresses in the resin-rich interlayers. Tool-ply friction experiments with plies of different fiber orientations were not within the scope of this thesis. In these experiments the shear through the thickness of a ply with off-axis fiber orientation cannot be prevented. Thus, strictly speaking, the assumption that the deformation is restricted to inter-ply slippage is not valid. For modeling purposes, however, the actual deformation (combination of transverse shear in the plies and slip between the plies) can still be approximated by an inter-ply slip only. In this approach, an apparent slip velocity is defined which corresponds to shear stress acting on the interface. A further complicating parameter that was not discussed in this research is the release and lubrication agent that is applied on the mold in the actual press forming process. A variety of substances can be applied. Murtagh et al. [3] investigated the influence and showed a decrease of the friction. Hatzikiriakos et al. [9] showed that a coating of the metal surface can decrease the wall slip stresses significantly. In this research only cleaned metal surfaces were used. The effects of release agents can be assessed by means of further tool-ply friction experiments using the current set-up.
6.2.2 Bending As mentioned before, the actual forming process takes place under non-uniform temperature and deformation rates. Instead, the bending experiments were performed
91
6.2. Comparison with actual press forming
���
�� �� � �� �� �� ��
��� Figure 6.2
V-bending experiments with UD carbon PEEK. a) lay-up: [0]16 . b) lay-up: [0,90]8s . The magnified side views on the right-hand side show the end of the specimen. For the [0,90]8s specimen, the 0◦ layer (dark) can be clearly distinguished from the 90◦ layer (light).
only at constant temperature and angular velocity. Further research is needed to validate whether these isothermal material properties are representative for cases under quickly changing and non-uniform temperatures. In V-bend experiments (Figure 6.2) it was observed that CFRTPs are susceptible to fiber buckling at the inner radius of the bend, where the compressive fiber stresses are the highest. Due to this fiber buckling, fiber stresses and intra-ply shear stresses decrease, resulting in a lower bending rigidity. The current bending model can be extended to include fiber stresses and a fiber-buckling criterion in a more detailed analysis of this phenomenon. Bending characterization of CFRTPs with plies of different fiber orientations was not performed. The assumption of fiber inextensibility implies that bending a 0◦ laminate will not cause ply extension or a change in thickness. This constraint no longer holds when off-axis plies are used in the bending experiment. Therefore, the strain field used in the micromechanical bending analysis needs to be adapted accordingly, which is part of further research. Apart from this, experiments with laminates of
92
Chapter 6. Discussion
differently oriented fiber layers are feasible and may form a possibility to measure the transverse intra-ply shear viscosity.
6.2.3 From measurements to process models Methods have been presented and validated to characterize the behavior of thermoplastic composite laminates in forming processes, with special attention to out-ofplane deformation mechanisms. The experimental methods as presented here can be part of a relatively quick material characterization procedure, after which forming simulations can be performed with the newly determined material property data. The constitutive equations representing the material response during these experiments need to be implemented in finite element software for CAE purposes. The friction models can be used directly as a user material model in various finite element packages. The bending model requires more dedicated implementation efforts, as the material response showed that it was of a specific viscoelastic nature. It is expected that these improved forming models will improve the effectiveness of the composite design process and will promote the applications of continuous fiber reinforced thermoplastics to a broader field in the aerospace and automotive industry.
References [1] R. Scherer, K. Friedrich, Inter- and intraply-slip flow processes during thermoforming of CF/PP-laminates, Composites Manufacturing 2 (2) (1991) 92– 96. [2] S. R. Morris, C. T. Sun, An investigation of interply slip behaviour in AS4/PEEK at forming temperatures, Composites Manufacturing 5 (4) (1994) 217–224. [3] A. M. Murtagh, J. J. Lennon, P. J. Mallon, Surface friction effects related to pressforming of continuous fibre thermoplastic composites, Composites Manufacturing 6 (3–4) (1995) 169–175. [4] G. Lebrun, M. N. Bureau, J. Denault, Thermoforming-stamping of continuous glass fiber/polypropylene composites: Interlaminar and tool–laminate shear properties, Journal of Thermoplastic Composite Materials 17 (2) (2004) 137–165. [5] J. L. Gorczyca-Cole, J. A. Sherwood, J. Chen, A friction model for thermostamping commingled glass–polypropylene woven fabrics, Composites Part A: Applied Science and Manufacturing 38 (2) (2007) 393–406. [6] K. Vanclooster, Forming of multilayered fabric reinforced thermoplastic composites, Ph.D. thesis, KU Leuven, Leuven, Belgium (2010). [7] R. H. W. ten Thije, R. Akkerman, M. P. Ubbink, L. van der Meer, A lubrication approach to friction in thermoplastic composites forming processes, Composites Part A: Applied Science and Manufacturing 42 (8) (2011) 950–960.
References
93
[8] C. Clasen, H. P. Kavehpour, G. H. McKinley, Bridging tribology and microrheology of thin films, Applied Rheology 20 (4). [9] S. G. Hatzikiriakos, Wall slip of molten polymers, Progress in Polymer Science 37 (4) (2012) 624–643. [10] H. E. Park, S. T. Lim, F. Smillo, J. M. Dealy, C. G. Robertson, Wall slip and spurt flow of polybutadiene, Journal of Rheology (1978-present) 52 (5) (2008) 1201–1239. [11] S. P. Haanappel, Forming of UD fibre reinforced thermoplastics, Ph.D. thesis, University of Twente, Enschede, The Netherlands (Apr. 2013). [12] P. Boisse, N. Hamila, E. Vidal-Sallé, F. Dumont, Simulation of wrinkling during textile composite reinforcement forming. Influence of tensile, in-plane shear and bending stiffnesses, Composites Science and Technology 71 (5) (2011) 683–692. [13] T. A. Martin, S. J. Mander, R. J. Dykes, D. Bhattacharyya, Chapter 9 Bending of continuous fibre-reinforced thermoplastic sheets, in: D. Bhattacharyya (Ed.), Composite Materials Series, Vol. 11 of Composite Sheet Forming, Elsevier, 1997, pp. 371–401. [14] J. L. Gorczyca, J. A. Sherwood, L. Liu, J. Chen, Modeling of friction and shear in thermostamping of composites - Part I, Journal of Composite Materials 38 (21) (2004) 1911–1929. [15] W. F. Stanley, P. J. Mallon, Intraply shear characterisation of a fibre reinforced thermoplastic composite, Composites Part A: Applied Science and Manufacturing 37 (6) (2006) 939–948.
94
Chapter 6. Discussion
Chapter 7 Conclusions and Recommendations The out-of-plane deformation mechanisms (inter-ply and tool-ply slippage as well as bending) of continuous fiber reinforced thermoplastic laminates in thermoforming processes have been investigated. The results of this research contribute to a better understanding of the forming behavior and provide methods to measure material parameters, which can be used for accurate forming analyses.
7.1 Conclusions The major conclusions of this work with respect to the objectives are presented below.
Inter-ply and tool-ply slippage (friction) 1. The friction of continuous fiber-reinforced thermoplastics under thermoforming conditions is governed by hydrodynamic lubrication, while the thermoplastic matrix is in a viscous state. The friction behavior can accurately be described by master curves. While Stribeck curves apply for fabric reinforced composites, the frictional peak shear stress of UD fiber-reinforced composites is a simple function of sliding velocity and zero shear viscosity, independent of the pressure. The steady-state shear stress, on the contrary, exhibits a pressure dependency at high sliding velocities. 2. Physically based models can predict the steady-state shear stress for woven composites, provided that the weave geometry is known. The geometry profile of the yarns longitudinal to the sliding direction can be estimated well, and leads to accurate predictions of the friction force. The geometry profile of the yarns transverse to the sliding direction is susceptible to deformations due to the forming process which makes predictions of the friction force less accurate. 95
96
Chapter 7. Conclusions and Recommendations
3. Friction of UD fiber-reinforced composites can also be explained on a sound physical basis. A quantitative prediction, however, requires an accurate description of the film thickness of the resin-rich interlayer, the wall slip behavior and the boundary lubrication behavior. An estimation of the representative parameters resulted in good agreement between experimental results and model predictions.
Bending 1. The bending behavior of continuous fiber reinforced thermoplastic laminates is of a viscoelastic nature. This behavior can be described in terms of an apparent shear viscosity and an apparent bending modulus, which represent, respectively, the intra-ply shear and the bending deformation. 2. The intra-ply shear in bending and the inter-ply slippage in friction are closely related since both are based on shear of resin interlayers. The apparent viscosities that were derived for the resin interlayer in both macroscopic deformation mechanisms correspond very well. 3. The bending rigidity, as derived from the bending experiments, is also dependent on the deformation rate and the temperature. Furthermore, it is much higher than the cumulative bending rigidity of the reinforcing filaments in isolation. A quantitative, micromechanically based prediction of this composite bending rigidity was not elaborated in detail. The response is assumed to be related to interlocking of filaments.
7.2 Recommendations Various issues could not be resolved within the scope of this thesis, leading to the following list of recommendations.
In general • Perform friction and bending characterization for UD composites that contain fiber directions transverse to the shear direction.
With respect to friction 1. Investigate the effect of the compliancy of the friction test set-up and the specimen on the transient start-up phase. Include the deformation history dependency in the friction model.
7.2. Recommendations
97
2. Investigate the wall slip behavior of the used polymers in contact with a metal surface quantitatively. The investigation should include the effects of sliding velocity, temperature and normal pressure on the transient start-up phase and on the steady-state phase. 3. Investigate the influence of lubrication and release agents on the friction behavior and include it in the model. 4. Investigate the friction behavior at temperatures below the melting temperature and below the glass-transition temperature.
With respect to bending 1. The test results and the subsequent analysis of the measured data are still explorative. Further evaluations should also assess the influence of different specimen sizes, especially different specimen lengths. 2. Incorporate the shear thinning behavior of the resin interlayer in the bending model. 3. Include fiber stresses in the bending model and determine the critical condition at which micro-buckling of filaments is initiated. 4. The viscoelastic bending model needs to be implemented in a finite element formulation to assess the effect it has on the forming simulation results.
Acknowledgments I wish to thank a number of people for their help during the term of my Ph.D. assignment. First of all I like to express my gratitude to Remko Akkerman for being my supervisor and for the valuable support and discussions. In addition, I thank you for keeping my spirit up at all times with your calmness and your good humor. Furthermore, I am much obliged to my employer TPRC, which includes my boss Harald Heerink and all TPRC partners for offering me the opportunity for this Ph.D. research. Also I thank the members of the Technical Advisory Board for their expert advice. The TAB meetings showed me the bigger picture of my work and have always been a good motivation. Special gratitude goes to my project colleagues and the readers committee of my thesis for the fruitful discussions and advices. These are Sebastiaan Haanappel, Bert Rietman, Wouter Grouve, Rene ten Thije, Mohammed Iqbal, Roy Visser and Bo Cornelissen. Also thanks to all my colleagues in my office at TPRC and at the University. We always had a good laugh and enjoyed a lot of sports activities together (at least I did). I was always looking forward to our mountain bike trips, football and tennis matches. Devi, my sincere apologies for almost breaking your shinbone. I gratefully acknowledge the organizational work of Debbie Zimmerman, Belinda Schaap-Bruinink and Iris de Klerk, who facilitated my research a lot. Also the support by the technicians Gert-Jan Nevenzel, Bert Vos, Anton van Berkum, Laura Vargas and Patrick de Nooijer was very important for my research. Furthermore, I have to thank the students Paul Jannink, Dirk Soeteman, Christiaan ten Hove and Tjitse Slange for their contributions and help during my research. Special thanks to my colleagues Devi Wolthuizen and Mohammed Iqbal for supporting me during my defense as paranymphs. Finally I wish to thank my family for their support, their encouragement and their trust.
99
Publications Journal articles 1. U. Sachs, R. Akkerman, K. Fetfatsidis, E. Vidal-Sallé, J. Schumacher, G. Ziegmann, S. Allaoui, G. Hivet, B. Maron, K. Vanclooster, and S. V. Lomov, “Characterization of the dynamic friction of woven fabrics: Experimental methods and benchmark results,” Compos. Part Appl. Sci. Manuf., vol. 67, pp. 289–298, Dec. 2014. (Chapter 2 of this thesis) 2. U. Sachs, R. Akkerman, and A. D. Rietman, “Friction characterization of woven thermoplastic composite in hot press forming,” submitted to Compos. Part A, 2014. (Chapter 3 of this thesis) 3. U. Sachs, R. Akkerman, and A. D. Rietman, “A lubrication approach to friction in forming processes with thermoplastic UD composites,” submitted to Compos. Part A, 2014. (Chapter 4 of this thesis) 4. U. Sachs, R. Akkerman, and S. P. Haanappel, “A novel bending characterization method for thermoplastic composites,” to be submitted to Compos. Part A, 2014. (Chapter 5 of this thesis)
Conference proceedings 1. U. Sachs, R. Akkerman, and S. P. Haanappel, “Bending Characterization of UD Composites,” Key Eng. Mater., vol. 611–612, pp. 399–406, May 2014. 2. U. Sachs, S. P. Haanappel, B. Rietman, R. ten Thije, and R. Akkerman, “Formability of Fiber-Reinforced Thermoplastics in Hot Press Forming Process Based on Friction Properties,” Key Eng. Mater., vol. 554–557, pp. 501–506, Jun. 2013. 3. U. Sachs, K. A. Fetfatsidis, J. Schumacher, G. Ziegmann, S. Allaoui, G. Hivet, E. VidalSallé, and R. Akkerman, “A Friction-Test Benchmark with Twintex PP,” Key Eng. Mater., vol. 504–506, pp. 307–312, Feb. 2012. 4. U. Sachs, R. Akkerman, S. P. Haanappel, R. H. W. ten Thije, and M. B. De Rooij, “Friction in forming of UD composites,” in AIP Conference Proceedings, 2011, vol. 1353, pp. 984– 989. 5. U. Sachs, S. P. Haanappel, A. D. Rietman, and R. Akkerman, “Friction testing of thermoplastic composites,” in SAMPE Europe 32nd International Technical Conference & Forum, Paris, France, 28-29 March 2011.
101
Co-authored journal articles 1. S. P. Haanappel, R. H. W. ten Thije, U. Sachs, B. Rietman, and R. Akkerman, “Formability analyses of uni-directional and textile reinforced thermoplastics,” Compos. Part Appl. Sci. Manuf., vol. 56, pp. 80–92, 2014. 2. B. Cornelissen, U. Sachs, B. Rietman, and R. Akkerman, “Dry friction characterisation of carbon fibre tow and satin weave fabric for composite applications,” Compos. Part Appl. Sci. Manuf., vol. 56, pp. 127–135, Jan. 2014.
Co-authored conference proceedings 1. S. P. Haanappel, U. Sachs, R. H. W. ten Thije, B. Rietman, and R. Akkerman, “Forming of thermoplastic composites,” Key Eng. Mater., vol. 504–506, pp. 237–242, 2012. 2. R. Akkerman, B. Rietman, S. P. Haanappel, and U. Sachs, “Towards Design for Thermoplastic Composites Manufacturing Using Process Simulation.,” presented at the International Conference & Exhibition on Thermoplastic Composites (ITHEC), Bremen, Germany, 2012, pp. 78–82. 3. S. P. Haanappel, R. H. W. ten Thije, U. Sachs, A. D. Rietman, and R. Akkerman, “InPlane Shear Characterisation of Uni-Directionally Reinforced Thermoplastic Melts,” in The 14th International ESAFORM Conference on Material Forming, 2011, vol. 1353, pp. 930–935. 4. B. Rietman, S. P. Haanappel, U. Sachs, and R. Akkerman, “Process Simulations for Composites Froming of UD Tape Laminates,” presented at the CFK-Valley Stade Convention, Stade, Germany, 2011, pp. 32–38. 5. B. Rietman, U. Sachs, S. P. Haanappel, and R. Akkerman, “Complex stamp forming of advanced thermoplastic composites,” presented at the ECCOMAS 3rd Thematic Conference on Mechanical Response of Composites, Hanover, Germany, 2011.
Presentations 1. U. Sachs, “Experimental comparison of friction in four different thermoplastics composites during thermo forming,” presented at the ESMC 2012, Graz, Austria, Jul. 2012.