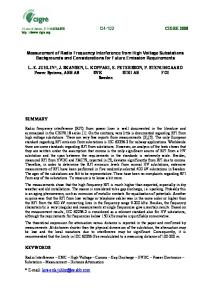
Logic Diagram of a time base for a frequency counter
“0000” State 0
Reset
“0010” 2
Open gate
“1100” 12
Close gate
“1110” 14
Store
ABCD
ABCD
ABCD
Input Signal Processing
Output (Digital) Comparator Input (Analog)
Input (Analog)
Amplifier
Amplifier
Comparator (Schmitt Trigger)
Output (Digital)
Schmitt Trigger: Comparator with Hysteresis Vo
Vref
+
Vin
V(1)
Trigger level (Vref)
Vo
output
V(0) Vin
Vref
Vo
R2
R3
R1
+ Vin
V(1)
Vo
Vref VTH VTL V(0) VTL VTH
Vin
output
Period Measurement
Time base f = 1 MHz
Time base f = 1 MHz 1 µs
1 µs X pulses counted
T Digital measurement of time period T = (X pulses)(1 µs) = X µs
Y pulses counted
PW Digital measurement of pulse width PW = Y µs
Period Measurement (between pulses) start Signal A
Input Signal Proccessor
Gate
S
Count Counter
Q stop
Signal B
Input Signal Proccessor
R
1 MHz
Control circuit 100 kHz
A (start) B (stop) Gate CLK Count
Core system S 0 1 kHz 0 1 10 kHz 1
CLK
t
R Q 0 Not use 1 1 0 0 1 No change
Period Measurement (pulse duration) Vref
start
+
stop
Vref Amp
A
+
C S
B
D R
Q
Gate
S 0 0 1 1
R Q 0 No change 1 0 0 1 1 Not use
Comparator start
A B C D
stop
input
Control circuit
Gate Counter
CLK
Period Measurement (pulse period) V(1)
A Input High-pass filter
A B C D
B
+ -
J
C
K
SET
CLR
Q
D Gate
Q
Comparator V(1) = 5 V V(0) = 0 V +2.5 V -2.5 V V(1) = 5 V V(0) = 0 V V(1) = 5 V V(0) = 0 V
Measurement Error 1) Gating error (± 1 count) Frequency measurement If fin = 10 Hz, Gate time = 1 s Display count: 10±1 counts If fin = 1000 Hz, Gate time = 1 s Display count: 1000±1 counts
5 pulses 6 pulses
Gate open
If fx < fo Period measurement if fx > fo Frequency measurement
fc: clock frequency fx: unknown frequency Period meas.: the number of pulses (Np) Np = fc/fx Frequency meas.: with 1 s gate time the number of pulses (Nf) Nf = f x The crossover frequency (fo) Np = Nf fc/fo = fo; fo =√fc
Measurement Error 2) Time-base Error •Oscillator calibration errors •Short-term crystal stability errors (voltage transient, shock, vibrate, temperature) •Long-term crystal stability errors (aging, deterioration of crystal) National Institute of Standards and Technology, 60 kHz ∆F Loran-C, a navigation signal at 100 kHz
Slope~ 10-6deg Receiver
Fequency Multiplier
Phase Detector
Local Frequency Source
Recorder
Slope~ 10-9deg
Adjustment
10
20
30
40
50
Time (weeks)
Ex A frequency counter with an accuracy of ± 1 LSD ± (1×10⁻⁶) is employed to measure frequencies of 100 Hz, 1 MHz, and 100 MHz. Calculate the percentage measurement error in each case. At f = 100 Hz error = ± (1 count ± 100 Hz × 10-6) = ± (1 count ± 1 × 10⁻⁴ count) ≈ ± 1 count % error = ±
Low frequency error ± 1 pulse High frequency error ± X pulse
Measurement Error 3) Trigger Level Error (Noise) -Use large signal amplitudes and fast rise time Trigger level
Trigger level ∆T Noisy signal
Cleaned signal
Maximum accuracy could be obtained by 1) use period measurement if fx < fc use frequency measurement if fx > fc 2) Calibrate regularly to prevent long-term stability error 3) Reduce trigger level error in time measurement by using large signal and fast rise time
Hysteresis band UTP LTP
'clean' sine wave crosses the hystereis band twice during each cycle triggering counting circuits once per cycle
Noisy sine wave crosses the hystereis band more than twice during each cycle - produce counting error
Attenuated noisy wave form crosses the hystereis band twice during each cycle
UTP LTP
PW Measured PW
A low amplitude input pulse can produce errors in pulse width measurement
PW Measured PW
Amplification of the input pulse minimizes the pulse width measurement
Specifications of a freq./period Measurement Frequency mode Range: DC to 50 MHz Gate time: Manual 1 ms to 100 s in decade step Automatic up 1 s gate time Period mode Range: 1 µs to 1 s unit in µs Duration mode Range: Inputs:
100 ns to 104 s 2 channels for start signal and 1 channel for stop signal
Extending the frequency range of a counter Prescaler (upto 1.5 GHz) 10 - 100 MHz
÷10
1-10 MHz
10 MHz Frequency Counter
Reduce resolution but can be improved by extending gate time
Heterodyne Technique frequency selector
100 MHz
Harmonic Generator
Input Signal (f2)
Tuned Cavity
100 MHz – 5GHz (f1)
Counter
Low Pass Filter
f1 ± f2
Amp.
f1 - f2
Homodyne and Heterodyne technique ½ {cos [2π( f2- f1 )]t + cos [2π( f2+ f1 )]t}
sin2π f1 t
sin2π f2 t
If f1 = f2; Homodyne 1
1
0.8
Time domain
0.5 0.6 0.5
1
1.5
0.4
2
-0.5
0.2
-1
0
Amplitude
Amplitude
Frequency domain
0.5
f1
f
0
difference
1
1.5
2
sum
2f1
f
Homodyne and Heterodyne technique If f1 ≠ f2; Heterodyne Time domain
1
0.75 0.5
0.5
0.25 0.5
1
1.5
2
-0.25
0.5
1
1.5
2
-0.5
-0.5
-0.75
0
Amplitude
Frequency domain
Amplitude
-1
f1
f2
f
0
f2 - f1
f1 + f2
f
Automatic Heterodyne Unit Ex input freq. 2.1 GHz
1.0 GHz
A
500 MHz
1.5 ± 2.1 =3.6, 0.6 GHz 2.0 ± 2.1 =4.1, 0.1 GHz
1.5 GHz ft = 500 MHz 2.0 GHz
Harmonic Generator
Switch 2.5 GHz
To 500 MHz Counter
Low Pass Filter
Level Detector
3.0 GHz X5
Control logic
3.5 GHz 100 MHz from Frequency Counter
f
Level Detector Input 500 MHz - 4 GHz
Accuracy Prescaler Displayed freq. = Accuracy ∝ t
fin t N
fin: input freq. N : divider of prescaler t : gate time
exactly the same as the counter without a prescaler
Heterodyne Technique Q Gate time, t = fc
Q : Time-base Divisor fc : Time-base Clk freq. N : Harmonic number
Input freq., fin = f in′ ± Nf c Q Q = f in′ ± NQ = f in′ t ± NQ Displayed freq. = fin fc fc Accuracy ∝ t; (NQ is constant)
Computing Counter Input
Gate
Input Signal Processing
A Counter
B Counter
Precision Clock
Time Base
Computer
Count in A Input freq. = Count in B
Input time =
Count in A Clk freq.
Period/ Frequency Display
9 Opening and Closing gate are controlled from either the input signal or the internal clock. 9 Computer will help to determine whether freq./period will be performed.