Volume 8, No. 2
Realizing Realizing the the educational educational promise promise of of technology technology
Fall 2004
www.concord.org www.concord.org
Free Computer-Based Learning Resources
We are delighted to be able to offer a growing collection of free software and student materials that use this software. Through grants from the National Science Foundation and the U.S. Department of Education, we have produced a number of innovative software packages and incorporated them into hundreds of powerful learning activities, each tested in real classrooms. Whatever you teach, at whatever level, we have software-based learning activities that can improve your teaching. Our strengths are in science at the secondary and college levels. We also have algebra software and sustainable development materials that can be used across disciplines and grade levels. Visit our Software Download Center to get access to these great materials.
This special issue of the newsletter features a number of activities based on our free software. It includes five handson lessons for you to use in your classroom. “Monday’s Lesson” has been a regular feature of this newsletter that demonstrates one way our materials can be easily implemented in a classroom. This has been such a popular column that we are expanding it in this issue to include five lessons, named for each weekday. Of course, you can use them on any day of the week! The lessons are not intended for sequential use for a particular discipline; instead they highlight the variety of activities available from the exciting work at The Concord Consortium. ï
PAGE
4
Perspective Creating the Educational Golden Gate Bridge Robert Tinker
I
f we only aspired to build bridges over small rivers and streams, we would have no Golden Gate Bridge, which affects the lives of tens of thousands of people every day. To improve education, we need far more national investment on the level of an educational Golden Gate Bridge. As a country that relies heavily on innovation, the U.S. seems strangely averse to educational innovation that could have a national impact. This aversion is undermining our future. The United States acts as though there is something special about U.S. education that guarantees that it will continue producing plenty
of creative, well-trained graduates regardless of educational policies. But the advantage that the U.S. has is thin and perilous. Indeed, the only advantage is in education at the elite undergraduate and graduate level, and that is at
We must apply to education the same rigorous approach used in science research. risk because funding is not keeping up with costs. U.S. pre-college education, particularly in the areas that prepare students for high-tech careers, is in crisis. U.S. student performance in math, science, and technology is only average in international comparisons.* U.S. education appears to have some advantage in terms of stimulating creativity and risk-taking, but other countries are closing those gaps as well. Unless the U.S. invests intelligently in education, it could
Editor Robert Tinker Managing Editor Cynthia McIntyre Design Pointed Communications
@concord is published twice a year by the Concord Consortium, a nonprofit educational research and development organization dedicated to educational innovation through creative technologies. Copyright © 2004 by The Concord Consortium. All rights reserved. Noncommercial reproduction is encouraged, provided permission is obtained and credit is given. For permission to reproduce any part of this publication, contact Cynthia McIntyre at
[email protected].
2
permanently lose the economic advantages that it currently enjoys. The U.S. does fund pre-college education by as much as $460 billion annually, or $9,350 per child, and the federal share of this is about $35 billion, or about $700 per child, mostly to subsidize schools or disseminate best practices. However, very little of this goes toward the development of innovative materials that might actually improve student learning nationwide. Current statistics show that the development of tested educational innovations receives as little as $2 per child or less than 0.03% of the total spent on education. There is probably no other sector of the U.S. economy that invests such a small percentage of its effort to innovation or applied research. In contrast, the pharmaceutical industry invests 23% of its income in innovation, a relative investment that is 700 times larger than education spends. We must apply to education the same rigorous approach used in science research. There are two kinds of research, academic
The projects in this newsletter are supported by grants from the National Science Foundation (REC-0115699, ESI-0242701, DUE-0402553), and the U.S. Department of Education (R286A000006). All opinions, findings, conclusions, and recommendations expressed herein are those of the authors and do not necessarily reflect the views of the funding agencies. Mention of trade names, commercial products, or organizations does not imply endorsement. If you wish to change your subscription information, please clip the mailing label from this newsletter, indicate the changes and mail to: The Concord Consortium 10 Concord Crossing, Suite 300 Concord, MA 01742 You also may call 978-369-4367 or fax 978-371-0696.
@concord – Fall 2004 The Concord Consortium
www.concord.org
and applied. The goal of academic research in education is to develop new insights about learning. This is an important endeavor, but not one that is required to improve U.S. education; we already know enough to make huge gains in teaching and learning. Applied research, on the other hand, is needed to determine whether a particular innovation leads to increased learning for certain kinds of students in various school environments. Applied research is often overlooked and underfunded, but it is an essential part of educational innovation. Investing in innovations that have proven value has a huge payoff because the resulting materials can be used in any classroom. It is, for instance, well within our capacity to increase student learning by providing free online, innovative, classroom-ready materials for every K-12 subject and grade for a total cost of roughly $11 per child, or 0.12% of one year’s expenditure. These are tiny amounts, yet the impact would be dramatic and lasting. Of course, this
You can access your account or sign up for a free subscription online at www.concord.org/members. Note: We do not make our mailing list available to other organizations. As a nonprofit organization, the Concord Consortium has no ongoing support for @concord. Contributions to defray printing costs would be greatly appreciated. Visit our website at www.concord.org for information on projects, services, courses, and free software.
The idea that education could be improved through free computer-based materials sounds fantastic, but only in the context of the current inadequate support of educational technology. It is easily within grasp. investment alone will not improve education; coordinated teacher professional development and support for technology would be required, but even if these cost several times as much as the research and development costs, the totals are trivial compared to the total cost of education. If you survey all the kinds of innovation that might have the greatest impact on education, technology plays a central enabling role. New modeling environments can provide simpler ways for students to understand difficult concepts. Pr o b ewa re g r e a t l y imp r o v e s lab experiences. Online courses make high quality professional development courses available anywhere, anytime. Handheld computers put inexpensive, portable computers in students’ hands. Online curriculum materials can be economically distributed and easily modified. Assessment embedded in online materials can give teachers an analysis of student learning with unprecedented detail and currency. Networking supports all kinds of collaborations that can invigorate learning. Online resources provide detailed information on every possible topic. I am deeply concerned with the lack of support for educational technology and the lagging recognition of its edu cat i o na l v a l u e . T h e C o n c o r d Consortium specializes in technology-
based innovation and we are proud of the advances we have made, some of which are described in this newsletter. But these successes only hint at the potential. There are many exciting possibilities that are not being pursued. We could have extensive, proven computer-based curricula. These could take advantage of research-grade models like our Molecular Workbench. The materials could be easily modified to fit the needs of teachers at different grades in different contexts. Detailed assessments could be gleaned from student use of the materials, giving teachers and researchers detailed data about student learning and material effectiveness. Some versions could be more open-ended and others more guided. Accessibility by students could be assured through run-time modifications that are made automatically or by a teacher. Some of the software could run on inexpensive handheld computers that can exchange data with a classroom server. And it can all be made freely available through open source systems. The result would be a huge increase in learning at all levels and disciplines. Because the materials were free, they would be a force for equity, even in the face of the digital divide. Providing the extensive teacher professional development needed to exploit the advantages of computer-based materials
would be a larger challenge. There is already large-scale funding for disseminating innovations, largely through professional development; this would have to be expanded and focused more on the integration of technology. The idea that education could be improved through free computer-based materials sounds fantastic, but only in the context of the current inadequate support of educational technology. It is easily within grasp. Educational innovation is currently like an amateur sport; every teacher and school is urged to innovate, to figure out how to integrate technology, and to assemble a curriculum. It is important to foster this kind of spirit, because it enriches a classroom. But large-scale innovation that can be disseminated nationwide requires professional teams of educators, developers, technologists, researchers, and designers. Instead of exclusively relying on federally funded block grants to states and schools, a larger fraction of funds should be retained at the federal level to create innovations that will improve every school. Just as we rely on professionals to build bridges, we need to use professionals to create educational innovations that could fully exploit the value of technology to improve education.
Robert Tinker (
[email protected]) is president of The Concord Consortium.
ARTICLE LINKS & NOTES
* See http://nces.ed.gov/timss/results.asp#mathscience1999
www.concord.org
@concord – Fall 2004 The Concord Consortium
3
Free Computer-Based Learning Resources
ï
PAGE
1
Handheld Computers
Algebra Interactives
We have long advocated educational uses of handheld computers, because they provide an affordable alternative to full-sized computers. Handhelds are not only as good as larger computers in some situations, their portability makes them superior for field studies. (See Monday’s Lesson: Handheld Computers in the Field on page 6.) Science of Atoms and Molecules The Molecular Workbench is a sophisticated model of the interactions among atoms and molecules. Learning activities based on this model help clarify what is happening at the atomic level and have been used with all the sciences and engineering from middle school through college. The Molecular Workbench model is embedded in a special word processor, so you can build your own activities. The easy-to-use activity building tool handles text, one or more models, buttons and other controllers, graphs and other model outputs, and student response areas, which makes it easy to create your own model-based learning activity for students. Over 100 learning activities have been created by us and by teachers like you, and are cataloged in an online database. (See Tuesday’s Lesson: Making Molecular Models Your Own on page 8.) Another simple authoring environment is WISE, developed by our collaborators Jim Slotta and Marcia Linn at Berkeley. WISE allows you to make activities or modify ones that others have made. An activity is constructed from a series of steps. Several dozen types of steps are available; each step can be customized by filling in an online form. Steps can include a Molecular Workbench, BioLogica, or Dynamica model, allowing anyone to build and deliver a complete Web-based lesson that uses our models.
Pedagogica For the more technical, our Pedagogica programming environment supports the scripting of Java-based applications, such as BioLogica or Dynamica. The authoring tool includes a graphic interface for specifying screen layouts, and a simple node-and-arc interface for navigating the scripts. Pedagogica also supplies a run-time environment that allows the scripts to communicate with the applications and a logging manager that keeps track of students’ interactions with the software.
4
@concord – Fall 2004 The Concord Consortium
www.concord.org
We are developing online courses for algebra teachers that include a collection of simple software packages called interactives that each focus on one key mathematical concept. For instance, the Qualitative Grapher challenges the user to connect motion to a sketch of a graph. The Linear Transformer provides a realtime, two-way connection between symbolic and graphic representations of linear functions. The Piecewise Linear Grapher extends the previous ideas to graphs composed of pieces of straight lines. The Function Analyzer relates three representations of linear functions, including one based on area. The Quadratic Grapher allows students to explore the relationship between symbolic and graphic representations of quadratic functions. (See Wednesday’s Lesson: The Starburst Activity on page 10, and Thursday’s Lesson: Warming Up to Quadratics with the Parabola Web on page 12.) Environmental Education Our Center for a Sustainable Future has developed three software packages designed to get students thinking about the future and how they might husband global resources. The What-If Builder is a writing tool for short stories that have many different outcomes, depending on what the reader selects. It both delivers such stories and lets students author and share them. The Community Planner is a simplified spatial modeling and visualization tool that allows students to create a map of a neighborhood, town, or community, and analyze the map based on indicators that they can help define. The Ecological Footprint Calculator estimates how much land is needed to sustain the user’s lifestyle and how many earths would be required if everyone had the same consumption patterns. Our database includes over 60 tested activities related to sustainable education for grades K-12, many of which use this software. (See Friday’s Lesson: Using the What-If Builder on page 14.)
In addition to the software showcased in the following five lessons, we have developed other software packages and associated student materials that you can access from the Software Download Center. BioLogica is a model of genetics built on various inheritance patterns at the level of molecules, genes, and individuals. Growing out of a decade-plus research program, many know the software by its earlier name: GenScope. Students can learn from open-ended exploration of the model or by working through a series of scaffolded learning activities. Dynamica is a model of classical Newtonian mechanics in two dimensions. Inspired by ThinkerToys, a popular package that ran only on the Commodore 64, this modern version is perfect for introducing vectors, kinematics, and dynamics in physical science and beginning physics courses. VideoPaper Builder2 is a tool jointly developed with TERC for the development of multimedia video case studies of teaching. A VideoPaper consists of video, captions, a narrative about the video, and artifacts, such as lesson plans and student work. VideoPaper Builder simplifies the work of synchronizing and indexing the various elements. The software links various models, generates menus, framesets and slide shows, and organizes the imported files as an HTML document viewable in a web browser. The resulting VideoPapers are a great way to stimulate thoughtful discussion about teaching and learning. VideoPaper Builder3, which will include new features and a simpler user interface, will be available soon.
this to the Molecular Workbench. The result will be a mechanistic model of molecular evolution forced by the environment. We are also experimenting with using inexpensive Webcams to capture images and then processing those images to track automatically a moving object. Like the motion detector, this will give real-time data, but for two-dimensional motion, and the equipment will be less expensive. All of our software is copyrighted under one of the open source licenses. This means that anyone can have access to the source code and make changes to it. We believe that open source is a strategy for long-term support of this software. Because the majority of our work is grant-supported, when the grant runs out, our ability to support the software ends. But when a community of educators uses the software, it is in the interest of all members of the community to maintain and improve it. Become part of the community by using this free, high quality software, and enjoy the lessons in this newsletter!
Under Development We are currently creating additional applications to extend the utility of our growing collection of software. For instance, we already have a wonderful program for probes and sensors called CCProbe. It collects real-time data from a variety of sensors and runs on handheld computers as well as full-sized ones. Unfortunately, CCProbe only works with archaic hardware we created for a past project. We are expanding the capacity of CCProbe and interfacing it with a number of commercial probeware packages. We are adding random mutations and a population level with environmental pressures to BioLogica and linking
ARTICLE LINKS & NOTES
Software Download Center – http://www.concord.org/downloads/ WISE – http://wise.berkeley.edu Ready to Teach Algebra Interactives – http://rtt.pbs.org/rtt/interactives.cfm Center for a Sustainable Future database – http://csf.concord.org/esf/index.php?module=curriculum&type=unit&func=view&order=theme
Robert Tinker (
[email protected]) is president of The Concord Consortium.
www.concord.org
@concord – Fall 2004 The Concord Consortium
5
MONDAY’S LESSON Handheld Computers in the Field When students do projects in their own backyards, neighborhoods, and playgrounds, they make real-life discoveries. And when handheld computers team up with database and spreadsheet software, students can turn the collection of reallife data into actual fieldwork, and become math and science experts about phenomena in their local community. Creating a field guide is a great way to learn about the environment, and leave a lasting legacy. The following lesson describes some of the powerful portable software that can be mixed and matched to fit different needs and budgets. Even though this lesson took place in Denali, Alaska, it can be adapted to your local geography and data collection needs. Denali National Park Fire Succession Study The Denali National Park and Preserve encompasses six million acres of pristine wilderness. This sub-arctic ecosystem hosts grizzly bears, wolves, Dall sheep, moose, and a biosphere reserve filled with forests, glaciers, and a wide variety of plants and vegetation. In June 2004, the Eastern Area Fire Management of the National Park Service and Denali Borough School District
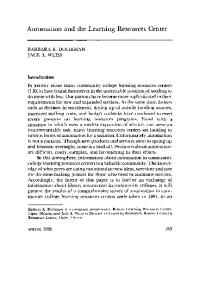
Figure 1. Campers used a field guide on handheld computers to identify plants and animals.
collaborated to study fire succession. The Denali Science and Storytelling Camp offered teachers and students in grades 4-12 an opportunity to use handheld computers to investigate the diversity and catalog the changes in the park after a fire. Fire succession studies research the natural recovery and development of forest vegetation following wildfires. This involves counting the plant species that either survive fire intact or are capable of colonizing the immediate post-fire site from seed sources. Because succession is a natural and recurrent process of developing forest vegetation, understanding its basic features is essential to the effective management of the park. Natural wildfires, mostly caused by lightning, are a critical component of the boreal forest ecosystem. Fires of considerable size and intensity have created a patchwork landscape of vegetation communities of different species and ages. The Denali Camp participants set about studying and recording the landscape of three burn areas.
6
@concord – Fall 2004 The Concord Consortium
www.concord.org
Campers’ Fieldwork All of the technology the Denali Camp participants used and the types of data they collected can be adapted to any location. Let’s take a look at how the campers created a field guide and how a similar project can be accomplished anywhere. Armed with lightweight, portable Zire 71 handheld computers with built-in digital cameras, the campers visited several burn sites, ready to photograph and identify the plants and animals of interior Alaska, and create their own specialized field guide. With a handheld version of SmartList, camp participants identified plants and animals using a common field guide for reference (Figure 1). Then they added a description and photograph to each entry. They also recorded numbers of plant species in a fire effects plot spreadsheet. Next, participants measured the temperature and depth of the permafrost at each burn site with Vernier direct-connect te mpe r a tur e s e n s o r s u s i n g t h e ImagiWorks sensor interface and ImagiProbe software (Figure 2). Although this may sound daunting, the equipment is simple and intuitive to operate, and it can be used to record temperature data in rivers and Figure 2: Portable technology lakes, or on land. To record data, students used can capture the local ecosystem. Sheets To Go, which is part of the Documents To Go software created by Microsoft (Figure 3). It allows students to collect data in the field on a handheld computer and then export it to a Microsoft Excel spreadsheet. Collecting Data Students followed a common pr otocol to accurately collect a species cover count. To do this, they followed a 20-meter straight line, or transect, and half a meter on the right side of the transect line they looked for species every meter. When a species Figure 3. Participants used software was located, it was identified on their handheld computers to a nd e n t ered on t he collect data. spreadsheet (Figure 4). After returning from the burn areas, the handheld computers were synced with a laptop and data was downloaded to determine the species cover count and the overall percent coverage.
Ask Yourself! Using a handheld computer, students can create a digital field guide to their neighborhood. When thinking about what to record, ask these questions:
What conditions threaten my local ecosystem? A field guide project does Wireless Technology What plants and animals live here? not have to be as big as a Denali campers also tracked How do they live? national park. What’s in your wolves using Global Positioning What changes do I see? local community? Is there a Systems (GPS). Handheld GPS playground, a neighborhood units are widely available and park, or a stream where students can be used to record the locations of animals, plants, or even can collect data? Is there someplace where conditions are people! changing or the land is threatened? Students used a secure digital (SD) card in their handhelds to access the National Wildlife Federation Handheld Guide to Birds and used it to identify the local Alaskan birds. This comprehensive guide includes field marks, bird sounds, and seasonal migration marks. Participants also used Isight software, a wireless connection supported by towers mounted atop several mountains, and Wireless Fidelity (Wi-Fi) cards in portable computers throughout the park as a method to transfer live video to those not in the field. Investigating Your Community
Figure 4. Participants follow a transect and record data in the field.
From Data Collection to Poetry In addition to using the handhelds to collect data, camp participants used their creative talents to design animations about the concept of fire succession (Figure 5) using software called Sketchy.
Figure 5. Participants design animations about fire succession using Sketchy software.
Based on this animation, another student wrote the following poem to describe the natural cycle that occurs as the forest returns. One flame dropped there it burns Down to ashes then it turned
With the help of handheld computers and some easy-touse software, students can create a field guide, track animals, even investigate something that threatens the local ecosystem. Contact your local park service or environmental agencies for research ideas and assistance with field study protocols. Visit the Usight website for more information on how handheld computers can be used as tools for data collection and more. The possibilities are as wide as the imagination.
ARTICLE LINKS & NOTES
Denali National Park and Preserve – http://www.nps.gov/dena/ Denali Science & Storytelling Camp – http://www.teachingstory.com/denali/science_story_camp.html SmartList – http://www.dataviz.com/products/smartlisttogo/ Vernier direct-connect temperature sensors – http://www.vernier.com/probes/probes.html?temp-group&template=temperature.html ImagiProbe – http://www.imagiworks.com/Pages/Products/ImagiProbe.html Documents To Go – http://www.dataviz.com/products/documentstogo/ Sketchy – http://goknow.com/Products/Sketchy/ Isight – http://www.apple.com/isight/ Usight – http://usight.concord.org/
Up sprouts life a whole new world Repeating the cycle the forest returns
Carolyn Staudt (
[email protected]) works for the Concord Consortium on many projects. One of Carolyn’s passions is data collection using handheld computers.
www.concord.org
@concord – Fall 2004 The Concord Consortium
7
TUESDAY’S LESSON Making Molecular Models Your Own The Concord Consortium’s Library of Models includes over one hundred models and activities to enhance students’ understanding of molecular interactions. Created in the Molecular Workbench software, these models illustrate a variety of topics, including solutions, chemical reactions and protein folding. But what if you have your own ideas about how students should experience these models? For instance, maybe you want to connect a model to a lab your students have done, or you want to assess student understanding with different questions. Perhaps you feel the pedagogical approach would not be familiar to your students. What if you are working with non-English speaking students and would like to use the models in your classroom? In this lesson, we use the Molecular Workbench’s authoring environment to transform a simple model of salt dissolving in water into a structured exploration of the dissolving process. We save pages, edit text, insert questions, and create and share student reports (Figure 1).
Figure 1. The Molecular Workbench model not only models particles, but allows an author to toggle on charges and other attractive forces, including van der Waals forces.
Selecting the activity First, download Molecular Workbench from: http://xeon.concord.org:8080/modeler/index.html Go to the Library of Models. Select Water Molecules and Solution, then Dissolving Salt in Water. Saving pages to your computer To edit existing Molecular Workbench activities, you must first save them onto your computer. 1. Create a new folder on your desktop and name it Dissolving. Any images or files we include in our activity must be saved in this folder.
Database of Models A database of Molecular Workbench models is available at http://molo.concord.org/database. Search by standards, textbook chapters, modules, concepts, or stepping stones. Look for models marked “Workbench Editable.”
8
@concord – Fall 2004 The Concord Consortium
www.concord.org
2. From the file menu in the top left of the Molecular Workbench screen, choose “Save” and save the file into the folder you just created. 3. The page now includes an “Editor” button in the toolbar. Click the Editor button to put the software in editor mode. Notice the options available to you, including fonts and formatting options similar to a word processing program, like bold and italics. And that’s just the beginning! Adding and removing text Let’s add two pieces of text: a description of the model and instructions for students. 1. Remove the existing text around the model. Click your mouse to the right of the model, then tap the keyboard’s left arrow once. This will move the cursor to the left of the model (and to the right of the text box). To remove the “Key Concepts” text box, press the backspace key (left arrow on Mac). 2. Remove or edit the text below the model by highlighting the text you want to edit or delete, and pressing the delete key on your keyboard. You can type new text here, if you like. Note: Be careful not to remove the model or the model controls. If you accidentally delete something, use the “Undo” option in the edit menu. 3. In this space below the model, type a description of the model. Use the options in the toolbar at the top of the page to change the font style and format. 4. Press the Enter (Return) key on your keyboard to move the cursor down. From the Insert menu, select Text Box. A popup box allows you to use HTML formatting. Or simply type over “Your text” in the main text field. Add instructions to your students on how to conduct an experiment with the model, and click OK when finished. Inserting images Images or screenshots can be added to your activity. For instance, you might like to add a key to remind students what each atom represents. (Remember that your image must be saved in the Dissolving folder you created earlier.) 1. Click your cursor where you would like the image to appear. 2. From the Insert menu choose “Picture,” then “From File.” 3. Navigate to your saved image, and click “Select.” Inserting questions You can generate questions for your students to answer after they’ve experimented with the model. For this activity we are going to add a text field for students where they can type their response. 1. To insert an open-ended question, click the cursor in the desired location.
2. From the Insert menu, chose “User Input Text Area.” Set the size of the response box in terms of rows and columns (or leave the default settings). 3. Type your question into the caption text area, overwriting the existing title there. 4. Click “OK.” Creating student reports Molecular Workbench allows users to generate reports that include responses to questions as well as screenshots of the current state of the model (Figure 2). 1. Select the location for this “activity button.” When clicked, this button will open a new page that includes responses to activity questions. It will also display an option for the user to save a screenshot of the model. 2. Place the cursor where you want the button to appear. From the Insert menu, choose “Activity Controller” then “Activity Button.” 3. A box appears that lets you set the button text. In the pop-up box under “Select an action,” use the menu to choose “Create a report about this page in a new window.” Give the button a short name in the Text field. Choose a background color and border, if you like. 4. Click “OK.”
Figure 3. With the Molecular Workbench customization tool, an author can add objects and actions for students to use in their exploration of a model.
Sharing what you have done with others Upload your activity to a database of activities to share with other users, including your students. 1. Save your page. 2. From the Collaboration menu, choose “Upload Current Page.” Click Yes on the disclaimer box that informs you that your activity will be saved to a public website. 3. Enter information about the model, including your name, student level (e.g., elementary or high school), and a description of the model. Select “Model” for type. 4. Click the Submit button. 5. User-created activities can be found in the online database: http://molo.concord.org/database Advanced: changing or creating a model Once you have mastered the editing system, you might be inspired to change a model or create a new model (Figure 3). With the Molecular Workbench software, the possibilities are endless.
ARTICLE LINKS & NOTES
Figure 2. A student report generated by Molecular Workbench includes the student’s choice of screenshot of salt as it is being dissolved. Questions and the student’s answers are appended beneath the screenshot.
Instructions for software installation can be found at: http://molo.concord.org/software/ Java Sun Microsystems – http://www.java.com/en/download/manual.jsp An online User’s Guide for Molecular Workbench can be found in the Molecular Workbench software under the Help menu or by going to: http://xeon.concord.org:8080/modeler1.3/tutorial/preface.cml
System Requirements The Java Runtime Environment (JRE) of Java 2 Platform, Standard Edition (J2SE) v1.4.1 or higher version must be installed on your computer in order to run the Molecular Workbench model. Windows or Linux users can download it from Java Sun Microsystems. Mac OS X users can update to the latest Java through the Software Update pane of the System Preferences of their computers.
Jeanette Boles (
[email protected]) is a chemistry teacher at Lexington High School in Massachusetts, where she fell in love with the Molecular Workbench models.
www.concord.org
@concord – Fall 2004 The Concord Consortium
9
WEDNESDAY’S LESSON The Starburst Activity Mathematics is a tool that models the relationships we see in everyday life, and many of these relationships can be described by functions. For example, a situation as simple as an after school job that pays $7 per hour can be described symbolically by the linear function y = 7x. There is power in looking at functions in different representations – words, numeric (or tabular), symbolic, and graphic – and understanding that a change in one is mirrored by a change in the others. Once students practice comparing representations and observing the connections between them, they are less likely to rely on point-by-point graphing every time they encounter a new function. And they are more likely to ultimately understand how functions can model real-world problems.
The Starburst Activity How does changing the slope of a line change the symbolic expression of the function? How does changing the symbolic expression (or equation) “move” the graph of the function on the coordinate plane? The Concord Consortium’s interactive tool called the Ready to Teach (RTT) Linear Transformer (Figure 2) gives students the power to change different representations of a function and then instantly observe what happens. In the
Comparing Representations The Starburst activity below focuses on comparing changes in the graphs of linear functions with corresponding changes in the symbols used to describe them. Students can gain insights into the connections between symbolic and graphic representations of linear functions by transforming them. Most algebra textbooks approach transformations geometrically. A typical problem might challenge students to start with a set of coordinate points that form a figure, such as a Figure 1. Typical Textbook square, and “transform” the figure Transformation. by moving it, one point at a time, to a new position (Figure 1). This transformation develops skill in interpreting Cartesian coordinates. It leads students to focus on changing a set of points, rather than on moving the object itself. Transformations of Linear Functions To transform a linear function, students must shift their perception. They must view the graph of the function (a line) as an object. Often when they are asked to graph two different linear functions, such as y = 2x and y = 2x + 3, students start by identifying a few values of the function (values of y) for a few input values (values of x), then list them in a table and graph each function. When they do this, students see the functions as unrelated to each other. However, the functions y = 2x and y = 2x + 3 are related: the line that represents the graph of the function y = 2x + 3 is simply the graph of y = 2x moved up 3 units.
10
@concord – Fall 2004 The Concord Consortium
www.concord.org
Figure 2. RTT Linear Transformer.
Starburst activity, students can use the Linear Transformer to observe the relationships between different representations of a function by manipulating the functions that make up a “starburst” pattern. Getting to Know the RTT Linear Transformer Give students a chance to familiarize themselves with the software before doing the activity. To access the Linear Transformer, go to: http://rtt.pbs.org/rtt/interactives.cfm Note: You need Java 1.3.1 or higher to run the interactiv e s . Che c k your J a v a by us ing the RT T wi zar d (http://rtt.concord.org/Wizard), or install or update Java Software for the Desktop (http://java.com). Open the Linear Transformer and explore the features. 1. Make a line. 2. Grab the line, move it, and watch how the equation that describes the line changes. 3. Make another line. Notice the color coding. 4. Change values in the symbolic expression of the line and observe how the graph of the line changes. 5. Explore the Reflect feature. 6. Explore the Pushpin feature. 7. Experiment with other features. When you are satisfied that you understand how the Linear Transformer works, try the challenges below.
Challenge 1: The Starburst
Challenge 4: Make Your Own Starburst
Using the Linear Transformer, make the starburst pattern (Figure 3). All lines intersect at the origin (0,0). Hint: The angles do not need to be equal. • Write the equations of the lines that make up the starburst pattern. • Which elements do the equations have in common? Figure 3. The Starburst. Which elements are different?
Describe how you would make a starburst pattern anywhere on the coordinate plane.
Challenge 2: Lift the Starburst Make a similar starburst pattern in which all the lines intersect at the point (0, 4) (Figure 4). • Write the equations of the lines that make up this starburst pattern. • Compare the equations of the lines in this starburst to the original starburst. Which elements of the equations are similar? Figure 4. Lift the Starburst. Which are different? Challenge 3: Shift the Starburst Make a similar starburst pattern in which all the lines intersect at the point (4, 2) (Figure 5). • Write the equations of the lines that make up this starburst pattern. • Compare these equations to the original starburst. Which elements are similar? Which are different? • Which form of the equations did you find Figure 5. Shift the Starburst. most helpful in doing these challenges (slopeintercept or point-slope form)? Explain. • While working through these activities, when did you choose to manipulate the symbolic or graphical representations?
Extensions to the Starburst Activity Giving students new challenges can help you gauge your students’ observations and understanding. Here are a few examples: 1. Write the equations that make up a starburst pattern that passes through (-2, 0). Try it first without graphing. Then test your prediction by making the pattern on the Linear Transformer. 2. Write the equations that make up a starburst pattern that lies in the third quadrant. 3. Make the diamond pattern Figure 6. Starburst Activity Extension. (Figure 6). In the Classroom Though students were not asked explicitly to discuss or define variables or unknowns in this activity, they explored different ways to express functions symbolically and graphically. This activity, especially through the use of the Linear Transformer, highlights two very common conceptual hurdles: • Distinguishing between a variable (a quantity that changes) and an unknown (a fixed quantity) • Knowing when to use different symbolic forms to represent a linear function: slope-intercept (y = mx + b) vs. point-slope (y – y1) = m(x – x1) Have students use the Linear Transformer to explore different forms of a linear equation. Encourage them to observe the relationships between the symbolic and graphic representations. Once they have had many experiences comparing different representations of functions, students will be better equipped to generalize about the characteristics of linear functions. ARTICLE LINKS & NOTES
Ready to Teach – http://rtt.concord.org
Ronit Carter (
[email protected]), George Collison (
[email protected]), and David Pinzer (
[email protected]) are members of the Ready to Teach content development team.
www.concord.org
@concord – Fall 2004 The Concord Consortium
11
THURSDAY’S LESSON Warming Up to Quadratics with the Parabola Web Learning a new technology while grappling with new concepts or skills can be confusing. Getting students comfortable with the technology first makes it easier for them to focus on the learning, rather than on the tool. A common strategy is to simply allow students to play with the new tool for a few minutes before starting an activity. A different approach is to take students through a structured exploration, or “software warm-up.” The Ready to Teach ( RT T ) Q u a d r a t i c Grapher (Figure 1) allows students to explore the relationship between symbolic and graphic representations of quadratic functions. The Software Warm-Up introduces students to the Quadratic G r a p h e r and its Figure 1. The RTT Quadratic Grapher allows students to explore features. The warm-up the relationship between the symbolic and graphic represen- is designed to get tations of quadratic functions. students thinking about the ways that changes in the symbolic representation of a quadratic function mirror the changes in its graph (a parabola) and prepare them for an activity we call the Parabola Web. Software Warm-Up: The RTT Quadratic Grapher To access the Quadratic Grapher, go to: http://rtt.pbs.org/rtt/interactives.cfm Note: You need Java 1.3.1 or higher to run the interact i v e s. C h e ck y o u r Jav a b y u sin g the RTT wiz a r d (http://rtt.concord.org/Wizard), or install or update Java Software for the Desktop (http://java.com). The first part of the warm-up familiarizes students with the features of the Quadratic Grapher and emphasizes making observations. Warm-Up 1: Try It and See 1. Quadratic Equation. Locate the symbolic expression at the bottom of the screen. This is the symbolic representation of a quadratic function. What function does the program show when it opens? 2. The Slider. Move the slider (the inverted triangle at the bottom of the graph). What does it do? Use the slider to find the vertex of the starting parabola and a few points on it.
12
@concord – Fall 2004 The Concord Consortium
www.concord.org
3. New Function. Click the “New Function” button and you’ll see a new parabola. Where did the first one go? In the table on the right-hand side, can you tell which expression represents which parabola? What happens to a parabola when you click on its graph? Or when you click on its expression in the table? 4. The Equation. Look at the symbolic expression at the bottom of the screen. Click the box in front of x2 (the coefficient) to select it. Notice what happens when you click the up and down arrows a few times. Which parabola changes? How? Choose a parabola you want to change (by clicking the corresponding color in the table at right). Click the box in front of the x term to select it. Notice how the parabola and the symbolic expression change when you click the up and down arrows a few times. Do the same with the last box (the constant term). What do you notice now? 5. Experiment. Use the other buttons. Each time you try a new button, see what changes you notice – in the parabola, in the symbolic expression (at the bottom), and in the table (at right). Watch what the slider does, too. (There is a lot to notice – look around!) Warm-Up 2: Make It and Check It The second part of the software warm-up lets students glimpse what the Quadratic Grapher can do. The warm-up hints at software features and tasks that students will need for the Pa r a bola We b a c tiv ity, but a v oids reveal i ng t he “Aha!” moments that the activity is designed to generate. oo 1. Make three parabolas whose vertices are all on the y-axis. What do their symbolic expressions have in common? 2. Make two parabolas that are mirror images of each other. What do you notice about their symbolic expressions? 3. Graph the parabola y = 2x2 + 8x + 4. What are the coordinates of its vertex? (Hint: There are two ways check if you are correct. What are they?) 4. Graph the parabola y = 2(x – 4)2 – 8. Then graph another parabola that crosses the x-axis at the same points as that parabola does. Compare the vertices of these two parabolas. 5. Make a parabola with its vertex at (12, 0). Use the “Change x Scale” button. Use the “Duplicate Function” button to make another parabola that has a different vertex, but crosses the original parabola. Then find the intersection point(s). (Hint: How can the slider help you?)
The Parabola Web Activity In Wednesday's Lesson: The Starburst Activity (page 10), you transformed linear functions. The Parabola Web activity is based on the same idea – transforming a family of functions on the coordinate plane – but this time it’s quadratic functions. Now that students have done the warm-up activity, try out the real thing. Challenge A: Comparing Graphs and Symbols Look at the Parabola Web in Figure 2. All the parabolas pass through (0, 0). The function rules that describe each parabola have the form y = ax2, where a is a constant. 1. Use the Quadratic Grapher to help you write the function rule for each of the parabolas in the web. Now, look closely at the rules, and in the following problems, try to figure out how the coefficient of x2 (the letter a) is related to the graph of the corresponding parabola. 2. Write a function rule to describe a parabola with the same vertex, whose other points lie somewhere between parabolas A and B. 3. Write a function rule to describe a parabola that looks like parabola B reflected about the x-axis. 4. Write a function rule to describe a parabola that looks like parabola D reflected about the x-axis. 5. How does the number you choose for the coefficient of x2 (the letter a) change the shape of a parabola? Write your conclusions and explain your reasoning.
Figure 2. This family of four quadratic functions forms a “parabola web.” The function rules that describe each parabola have the form y = ax2, where a is a constant.
Figure 3. The Quadratic Grapher challenges students to think about the graph of a function described by a symbolic expression in the form 0x2 + bx + c, highlighting the difference between linear and quadratic functions.
Challenge B: Moving the Parabola Web The parabolas in Challenge A form a web with vertices at (0, 0). Try moving them. 1. Show how you would move the vertex of each parabola from (0, 0) to (0, 1) by changing the function rule. Moving a graph in this way is called a vertical translation. 2. Show how you would move the vertex of each parabola from (0, 0) to (2, 0). Moving a graph in this way is called a horizontal translation. 3. Show how you would move the vertex of each parabola from (0, 0) to (-1, 2). Demonstrate and explain your reasoning using one of the parabolas. How does the function rule for the parabola change? From Seeing to Understanding The Quadratic Grapher is a powerful tool that helps students see what is difficult to show on paper. For example, a fundamental difference between linear and quadratic functions is the x2 term – the defining attribute of quadratic functions. But once students begin studying quadratics, they may never revisit a symbolic expression without a coefficient of x2. On the Quadratic Grapher, watch what happens in the polynomial form of the equation when you vary only the coefficient of x2. What does the graph look like when the coefficient of x2 is 0? A symbolic expression in the form 0x2 + bx + c does not generate the graph of a parabola, but a line – it’s a linear function (bx + c is analogous to mx + b) (Figure 3)! Observing the relationship between the graphic and symbolic representations can increase the students’ familiarity with the characteristics of quadratic functions and improve their general understanding of functions and the relationships that functions can describe. In the case of the Parabola Web, feeling comfortable with using the RTT Quadratic Grapher is key to students exploring the characteristics of quadratic functions from multiple perspectives. Ronit Carter (
[email protected]) is a member of the Ready to Teach content development team. Fadia Harik (
[email protected]) is a professor of mathematics at the College of Public and Community Service, University of Massachusetts, Boston.
www.concord.org
@concord – Fall 2004 The Concord Consortium
13
FRIDAY’S LESSON Using the What-If Builder Should a tree be cut down in your neighborhood? What if fishermen catch too many fish? What happens if we run out of oil? Each of these scenarios has issues and consequences to consider when making a decision. A software program developed by The Concord Consortium’s Center for a Sustainable Future, in partnership with Cobb County Public Schools in Georgia, can help students think about these kinds of questions. What-If Builder is a tool for creating scenarios or stories with multiple endings that depend on the choices the reader makes. The program can be used in two distinct ways: to run stories others have made and to create your own. What-If Builder What-If Builder is very simple to use. Students pick it up quickly, so little classroom time needs to be spent on mastering the technology. When running a “What if…” story, students work individually or in groups role playing and debating an issue from different points of view. What-If Builder operates the same way many computer games do: reflecting different Figure 1. The Decision Tree allows you to see perspectives depending on choices the story branching. player makes. But unlike a traditional computer game, What-If Builder encourages students to ask questions, vote, and think deeply about the consequences of their choices. If students using one scenario don’t agree with the consequences built into the story, or feel that other choices should be available, they can easily switch to an editing mode and change the story. Justifying these changes encourages research and investigation of the probable impacts of different choices. Student thinking is stimulated by using, editing, and creating new scenarios. This can be a strong stimulus to deeper inquiry in almost any field. The point is not to come up with the “right” answer, but to promote visioning and thinking about the future. Download What-If Builder What-If Builder software is free and easy to download, and it is compatible with Windows and Mac on all operating systems.
Robert Tinker (
[email protected]) is president of The Concord Consortium.
14
@concord – Fall 2004 The Concord Consortium
www.concord.org
If you are on a PC, point your browser (Internet Explorer works best) to the following URL for downloading instructions: http://www.concord.org/esf/resources/software/wib/install.htm On a Mac, point your browser (Internet Explorer works best) to the following URL to download: ftp://ftp.concord.org/pub/esf/wib/mac/wib.sit (When running OS X, launching a What-If Builder story automatically invokes the Classic operating system.) A successful download should result in a folder that contains documentation, sample stories, and What-If Builder. Try Out a Story A good way to get started is to try one of the sample stories, for example, the Fish Story. The scenarios are purposely simple so that the software is not intimidating. (When the What-If Builder opens, two windows appear: the What-If Builder and the Decision Tree.) To open a story: • On a Mac, open the WIB folder, and then doubleclick on a story inside the Sample Stories folder. • On a Windows computer, launch What-If Builder and select Open from the File menu on the What-If Builder window. Select one of the stories from the Sample Stories folder. Read the first section of the story, then choose from the selections below it by clicking the “Go ->” button next to your choice. As you make decisions and follow one path of the story, you can also click the “Go Back” button to try a different path. The stories aren’t very long, so feel free to explore all of the paths. If you select Edit Mode from the Tools menu, you can see the complete Decision Tree for the story. Clicking the plus (+) and minus (-) signs allows you to open and close branches of the story. Create a New Story Using the Decision Tree A good way to use the What-If Builder in the classroom is to create a story using a three-step story-building process. Step One: Your Scenario A Decision Tree helps you set up and see the branches of a story. Think of a story that is relevant to your course and the level of your students. You might want to sketch out a rough Decision Tree for your content before opening the software. Don’t get too ambitious. If you give students three
diate step. When making your options three times, you will scenario, you might leave some generate 27 different endings. steps blank, or purposely say That is more than enough something that is incorrect. to get started. Challenge students to fill in Once you have decided on the blank steps or find and a Decision Tree and have some correct your error. idea about the content at each A second activity might step, launch the What-If be to ask students to add several Builder. new choices to your scenario, To create a new scenario: or an entire “limb,” consisting 1. Select New from the File of a new choice that leads to menu. additional choices. You can 2. Click New Choice. 3. Fill in the name of your Figure 2. The “Fish Story” starts with a simple scenario. The reader evaluate students on the follows one of two possible story lines, thinking about the consequences thoughtfulness of their first choice where it says of each decision. additions. “Title” and click the “Go->” button. 4. Continue using the New Choice and Go buttons to cre- Step Three: Creating a Student Scenario This is where students create their own scenario. The goal ate a nested tree of choices. 5. To go back and add a second level of choices, use the of this activity is to deepen student thinking about a situation, “