FORUM: QUALITATIVE SOCIAL RESEARCH SOZIALFORSCHUNG
Volume 12, No. 1, Art. 22 January 2011
Responsibility: A Key Category for Understanding the Discourse on the Financial Crisis —Analyzing the KWALON Data Set with MAXQDA 10 Anne M. Kuckartz & Michael J. Sharp Key words:
Abstract: This article explains the process and findings of a computer-supported (MAXQDA 10)
qualitative data
qualitative analysis of the financial crisis based on text, audio and video files provided by the
analysis; MAXQDA
KWALON program committee. Initial findings show that those writing about the crisis found it
10; responsibility;
important to name those persons and factors they considered responsible for the financial
financial crisis
problems, although there was no consensus on who or what was most to blame. Table of Contents 1. Introduction 2. Organizing the Data Set, Importing the Data and Making Decisions About Transcribing Data 3. Exploring the Data: Reading, Reviewing and Initial Coding 4. Research Question Focus and Methods of Analysis 5. Coding, Memoing, Dimensionalization and Theory Development 6. Data Display (Conceptual Maps) 7. Final Remarks References Authors Citation
1. Introduction This article is based on our presentation for the KWALON conference, which, due to the ash cloud over Iceland, could not be delivered at that point in time. The first part focuses on our analysis strategy and some of the initial results. The second part demonstrates which program features of MAXQDA 10 enabled this analysis. The process of analyzing the KWALON data set consisted of five steps: 1. Organizing the data set, importing the data and making decisions about transcribing audio and video files; 2. Exploring the data: reading, viewing and initial coding; 3. Deciding which aspect of the research questions to focus on and which methods of analysis to apply (-> micro-macro analysis); 4. Coding, memoing, dimensionalizing the data, and developing theory; and 5. Displaying the data with conceptual mapping. [1] The following sections describe how these five steps were carried out in the analysis and which software functions were used along the way. [2]
© 2011 FQS http://www.qualitative-research.net/ Forum Qualitative Sozialforschung / Forum: Qualitative Social Research (ISSN 1438-5627)
FQS 12(1), Art. 22, Anne M. Kuckartz & Michael J. Sharp : Responsibility: A Key Category for Understanding the Discourse on the Financial Crisis—Analyzing the KWALON Data Set with MAXQDA 10
2. Organizing the Data Set, Importing the Data and Making Decisions About Transcribing Data When starting a data analysis using QDA (Qualitative Data Analysis) software, researchers must think about how to organize the data in a logical and useful way. In this case the KWALON data set included various media, including newspaper articles, videos, blogs, and audio files from a wide variety of sources, which added up to a very large amount of material, including nine audio files (eight MP3, one MP4); 40 video files (22 FLV, 12 .mpg, two .avi, two WMV, two MP4); 119 newspaper files (72 PDF, 39 HTML, seven web archives, one unknown); and 70 websites/weblogs (four PDF, 65 HTML, one PNG). [3] At first glance, the data set looked like a very random selection of data rather than a meaningful collection for answering the research questions. As opposed to a more traditional qualitative research project, based on interview transcripts, field notes, focus group discussions etc., everything in this project was taken from online resources. There were also no RTF or DOC documents, which are the most commonly-used file types in qualitative analysis, and even the PDFs were just printouts of web pages. At this point, it is important to mention that PDF and DOC/RTF files are handled differently by various QDA software packages. PDF (Portable Document Format) is a PostScript-like format that uses fixed pages whereas DOC or RTF files do not. In general, working with DOC/RTF files is less restricted; text can be edited and additional text can be written in. For this reason, it is always advantageous to use the RTF/DOC formats if possible. Websites can easily be transformed into DOC files by using programs like NitroPDF. In MAXQDA, PDF files are imported directly, which means they keep all aspects of their original format and look exactly like they do when printed out or viewed in Adobe Acrobat. [4] The dataset was created on a Mac and seemed to be untested on a Windows system. Some files could not be accessed by a Windows-based machine because of invalid file name characters or paths and file names that were too long; the DVD content could not be copied to a Windows hard drive in its entirety; and even the Zip archives from the KWALON website could not be unpacked by Windows or WinZIP. [5] These problems had to be dealt with before the main purpose of this first step— making decisions about a logical organization structure—could be realized. The research question formulated by the KWALON program committee focuses on a time aspect ("Did views or arguments about the causes and prognosis of the economic crises change between 2008 and 2009"), so we initially planned to organize the data according to the timeline. MAXQDA allows for creation of various document groups, which can then be used to hold documents of particular time periods. The advantage of making use of the document group option is that the analysis can easily run with time-selected data and answer questions like "Which topics are most often brought up in the documents from 2008 in comparison to those most often discussed in 2009?" [6] © 2011 FQS http://www.qualitative-research.net/
FQS 12(1), Art. 22, Anne M. Kuckartz & Michael J. Sharp : Responsibility: A Key Category for Understanding the Discourse on the Financial Crisis—Analyzing the KWALON Data Set with MAXQDA 10
After importing the entire data set, the software's Document System contained a large amount of data. While it can't all be fit into a screenshot, one can see a section of the blog documents in Figure. 1.
Figure 1: A partial list of KWALON documents in MAXQDA [7]
Realizing, however, that the data was not evenly distributed, we decided to set up the document groups according to data types ("Blogs," "Newspapers," "Radio" and "Videos"). The date of origin was defined as a variable and document sets were used to group documents from a common time period. Unlike the structural and organizational function of document groups, document sets can group documents from many different document groups. A document set could group all © 2011 FQS http://www.qualitative-research.net/
FQS 12(1), Art. 22, Anne M. Kuckartz & Michael J. Sharp : Responsibility: A Key Category for Understanding the Discourse on the Financial Crisis—Analyzing the KWALON Data Set with MAXQDA 10
documents from 2008, for example, although they are located in four different document groups. [8] MAXQDA allows researchers to set variables for each document and/or coded parts of each document. For managing quantitative data, it is sometimes significant that some variables describe an entire document and some only describe parts of the document. For this reason, the software differentiates between a) document variables (also known as case variables) and b) code variables. [9] A common example for a document variable is a study with open interviews and a standardized questionnaire. The same person fills out a questionnaire with sociodemographic data and is then interviewed about his or her biography. In this case the data for each person consists of the transcription of the biographical interview and a vector of numbers according to the codebook of the standardized questionnaire. Thus, the variables from the socio-demographic data apply to the entire open interview document. [10] The data from a focus group can be taken as a typical example for code variables. Different persons attend a focus group that is then transcribed verbatim, which means that the data consists of only a single text file with different speakers. In this case, the document variables are no longer useful for storing characteristics of the participants since we have more than one person. The code variables make it possible to store data for multiple units of a text file provided that the contributions of the different speakers have been coded with an appropriate name.
Figure 2: A transcribed focus group interview with each speaker's words coded accordingly (enlarge this figure here) [11]
The option of combining different data types—text and quantitative data— is a very important option for all kind of mixed methods analyses. MAXQDA offers a true variable matrix (as in SPSS, SYSTAT or other statistics software) with all types of variables including metric scales. [12]
© 2011 FQS http://www.qualitative-research.net/
FQS 12(1), Art. 22, Anne M. Kuckartz & Michael J. Sharp : Responsibility: A Key Category for Understanding the Discourse on the Financial Crisis—Analyzing the KWALON Data Set with MAXQDA 10
3. Exploring the Data: Reading, Reviewing and Initial Coding After the project was set up, the next step was to explore the data. It doesn't matter which software is used for the analysis—or even if software is used at all —researchers always have to spend time getting acquainted with the data. This means that data has to have been read, heard or viewed carefully, which cannot be done by any software or artificial intelligence. Four researchers were each assigned a selection of two documents from each medium (audio, video, blog, newspaper). The researchers transcribed the audio and video files they were assigned with the built-in media player and transcription functions. It was then possible for each researcher to code their eight documents. We analyzed the data according to the grounded theory approach: each member of the group started looking at the data, elaborating codes by "open coding." The technique of open coding is explained by Juliet CORBIN as the "brainstorming" phase of the analysis, where the "analysts want to open up the data to all potentials and possibilities contained within them" (CORBIN & STRAUSS, 2008, p.160); open coding is the process of "breaking data apart and delineating concepts to stand for blocks of raw data" (p.195). [13] Considering the time we had to perform the analysis of the large data set, we had to shorten the open coding phase. Fortunately, it turned out that the term "responsibility" was a code identified by each member of the team as a crucial concept in their open coding phase. So we decided to focus further analysis on the code "responsibility" making it our key category and elaborated it as described below. [14] After the phase of individual open coding, the team came together to discuss the codes that had been developed in the 32 documents. The team discussion addressed the similarities and differences between the code system each person had developed, the questions that came up regarding the financial crisis, the topical themes that seemed to be emerging, and how best to continue the research process considering the massive amount of data. It was then possible to consolidate the code systems, merging similar codes and creating a categorybased hierarchical code system that would be used and further developed in future coding. [15] In the next step, three researchers worked on the time-intensive transcription of further audio and video files while the fourth researcher continued to code with the newly-developed code system. The categories that emerged from the data set continued to develop but still held the basic structure established in the team discussion. Because of the size of the data set and the limited time that could be invested, the software's functions for lexical searches and automatic coding were extremely helpful. It was possible, for example, to find all instances of the word "responsibility" or "blame" in the data set, and then code that word, the sentence, the paragraph, or even a certain number of paragraphs before and after the term. The researchers could then use the Text Retrieval function to call up all of these text segments for comparison. [16] © 2011 FQS http://www.qualitative-research.net/
FQS 12(1), Art. 22, Anne M. Kuckartz & Michael J. Sharp : Responsibility: A Key Category for Understanding the Discourse on the Financial Crisis—Analyzing the KWALON Data Set with MAXQDA 10
After the initial processing of the dataset and the coding of relevant text segments, which included key words identified in the research team discussion as significant for the research question, the MAXQDA project had already become quite large. More than 1,300 text segments had been coded, and we had already invested a significant amount of time familiarizing ourselves with the data set, listening to the audio files, and watching the videos before we even started the coding. In a research team discussion, it became clear that it would not be possible to process all documents in the data set for the purposes of addressing the research questions proposed by the KWALON committee. It was necessary to focus rather on a specific aspect or important question that came out of the analysis done up to that point. [17] The screenshot below shows the project as it stood after the exploration and coding phase. One sees MAXQDA's classic four-window structure. The window in the upper-left contains the Document System, which contains the four document groups mentioned above (blogs, newspapers, radio/tv, and sources). By clicking on one of these groups, one can then see all the documents assigned to that particular group (see Figure 2 above). In the upper-right window, one sees the document browser, which allows one to read and work with a selected document. One can see in the screenshot below that one of the blog documents has been opened, and a text segment in paragraph 110 has been coded with the code "debt." The tab function—as in many web browsers—allows for more than one document to be open at one time. In the screenshot, one can see that two blog documents are open using this tab function. In the bottom-left window is the code system, which already at that point contained over 1300 coded segments.
Figure 3: KWALON project after initial coding in the typical 4-screen interface of MAXQDA (enlarge this figure here) [18]
4. Research Question Focus and Methods of Analysis After coding over 1,300 document segments, it became clear that the amount of time necessary for a complete and thorough analysis of the data set would be incredibly time intensive. Based on KUCKARTZ, DRESING, RÄDIKER and STEFER's (2009) detailed account of their process of analyzing a dataset of 10 open interviews in 100 hours, it was clear that approximately 500 hours would be © 2011 FQS http://www.qualitative-research.net/
FQS 12(1), Art. 22, Anne M. Kuckartz & Michael J. Sharp : Responsibility: A Key Category for Understanding the Discourse on the Financial Crisis—Analyzing the KWALON Data Set with MAXQDA 10
required for the analysis if we continued in the way we started. Appropriate interpretation of the data, a complete write-up and a well-prepared presentation answering all of the research questions seemed beyond our capabilities in the given time frame. For this reason, we decided to focus the analysis on a single issue, which seemed to be of significance in the data set. Based on the number of references to responsibility for the financial crisis in the initial coding of the 32 selected documents, this topic was chosen to be the focus of our paper and presentation. We used a mixture of micro and macro analysis, focusing on the one hand on the quantity and context where responsibility was mentioned ("macro") and on the other hand on the detailed analyses of some individual statements on responsibility ("micro"). The goal was to 1. find out which actors or factors were most often mentioned as having "responsibility" for the economic crisis in the data set, and to 2. interpret and analyze the actual individual statements (e.g. in a blog). [19]
5. Coding, Memoing, Dimensionalization and Theory Development The main step of the analysis was the fourth step: coding, memoing, dimensionalizing the data and developing theory. With the help of the software's lexical search function, we found 116 text segments with the words "responsible" or "responsibility." These 116 hits were just a sample of the many references to the topic, which were often addressed without the use of any form of the word "responsible"; had we been able to invest more time in the analysis, we could have also searched for words such as "blame" and "fault" along with the names of people that had already been identified by some writers in the 32 heavily-coded sample documents as responsible for the crisis. These 116 segments were interpreted, and subcategories for the code "responsibility" were defined. The video documents were also viewed and partially transcribed when the issue of responsibility was addressed. Although the topic was often addressed, and people or factors were blamed for the crisis, it was surprising how few substantial arguments were put forward to back up these statements. [20] In this stage of the analysis, the ability to differentiate between memo types was very helpful. In addition, the Code Matrix Browser helped us to keep track of the different aspects of responsibility related to the different documents and document types. We had some problems with the term "actors" used by the organizers ("How do different actors identify the causes of the economic crisis?"): Who is an actor in that sense? Was an actor the blogger, the politician, the authors of a newspaper article, or the newspaper editors? And how could an actor be identified for anonymous publications? Because of this difficulty, it was decided to abandon the plan to relate actors with arguments via the Code Relation Browser. We switched over to thinking about the development of a "theory of responsibility," or perhaps more accurately, a "theory of perception of responsibility." Of course, during the short time we had, we could not develop a detailed theory, but some interesting points in the process of developing such a theory could be identified, such as "the role of the system," anthropological basics such as "greed," "lack of oversight," etc. [21] © 2011 FQS http://www.qualitative-research.net/
FQS 12(1), Art. 22, Anne M. Kuckartz & Michael J. Sharp : Responsibility: A Key Category for Understanding the Discourse on the Financial Crisis—Analyzing the KWALON Data Set with MAXQDA 10
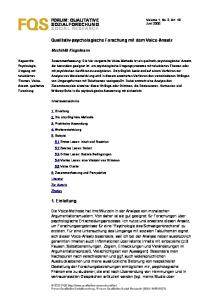
The following diagram shows MAXQDA's Code Matrix Browser. Here documents and codes are displayed as a table. Seven documents are displayed on the x-axis and "responsibility" and its subcodes on the y-axis. The size of the symbol indicates how often the code has been used within a particular document. By clicking on one of the symbols, one can see the associated coded segments. The visual representation gives a good overview, allowing one to compare, contrast and explore the subcodes, in this case the agents and the dimensions of responsibility.
Figure 4: Visual representation of documents and codes in the Code Matrix Browser [22]
The analysis showed that the government or "the system" was often seen as responsible for the crisis; specific persons, such as Alan Greenspan and George W. Bush, were also specifically mentioned. [23] For advanced analysis it would have been interesting to relate the code "responsibility" to other key concepts like "causes," "future consequences" or "irresponsible consumers." The Code Relations Browser displays the cooccurrences of codes and subcodes, which makes it possible to analyze the associated text segments. [24]
6. Data Display (Conceptual Maps) The last step of our analysis was to bring our ideas and results into conceptual maps. We used the MAXMaps tool for this, which has both customizable and standardized, pre-programmed visualizations. The first is a standardized visualization for the category "future consequences." The second is a usercreated conceptual model of the "theory of perception of responsibility." Figure 5 was created with the "Code-Subcode Model." We selected the code "future consequences," and the model was automatically created. It shows the subcodes arranged around the selected code in the middle, and up to five coded segments from each of those subcodes. Each of the subcodes is a future consequence mentioned in the data set, ranging from war to the further devaluing of the dollar © 2011 FQS http://www.qualitative-research.net/
FQS 12(1), Art. 22, Anne M. Kuckartz & Michael J. Sharp : Responsibility: A Key Category for Understanding the Discourse on the Financial Crisis—Analyzing the KWALON Data Set with MAXQDA 10
to an increase in government regulation. The coded document segments can be viewed in this model by hovering the mouse over the appropriate symbols. These segments can also be viewed in their context in the Document Browser by double-clicking on the symbol.
Figure 5: Dimensions of the key concept "future consequences" (enlarge this figure here) [25]
We then put all our results together in a conceptual map that brings together the causes, consequences and persons deemed responsible for the financial crisis. These three main codes are then connected to their most often-used subcodes.
Figure 6: Conceptual map of the causes, consequences and those responsible for the crisis (enlarge this figure here) [26]
© 2011 FQS http://www.qualitative-research.net/
FQS 12(1), Art. 22, Anne M. Kuckartz & Michael J. Sharp : Responsibility: A Key Category for Understanding the Discourse on the Financial Crisis—Analyzing the KWALON Data Set with MAXQDA 10
7. Final Remarks For us as producers and consultants of the software it was an interesting experiment to see (and document) how MAXQDA could be applied with this data set, especially using the new features for working with PDF and text-video/audio synchronization. The only problem was the lack of time we were able to devote to such a large amount of data. [27]
References Corbin, Juliet & Strauss, Anselm (2008). Basics of qualitative research. Techniques und procedures for developing grounded theory (3rd ed.). Thousand Oaks, CA: Sage. Kuckartz Udo; Dresing, Thorsten; Rädiker, Stefan & Stefer, Klaus (2008). Qualitative Evaluation. Der Einstieg in die Praxis (2nd., rev. ed.). Wiesbaden: VS Verlag für Sozialwissenschaften.
Authors Anne KUCKARTZ, M.A. is the CEO of VERBI Software, Consult, Research GmbH, in Germany. VERBI produces and distributes MAXQDA, a software for qualitative data analysis. She studied sociology, political science and philosophy at the university RWTH Aachen, where she received a Master's degree in sociology. She was an employee at the Technical University Berlin and at the Free University in Berlin from 1980 to 1994. She was the head of the research department in a private company before working for VERBI. She has been involved as a researcher and project manager in various qualitative projects mainly in the field of public health and has taught qualitative methods at the Technical University of Berlin.
Contact:
Michael J. SHARP, M.A., studied Peace and Conflict Studies at Philipps University in Marburg, Germany. His research focused on field studies in Israel/Palestine, Iraq and Afghanistan. From 2008 to 2010 he worked with the VERBI team on MAXQDA-related projects. He is currently a qualitative research consultant in the United States and offers MAXQDA workshops.
Contact:
Anne Kuckartz VERBI Software Consult Sozialforschung GmbH Software Center 3 35037 Marburg, Germany E-mail:
[email protected] URL: http://www.maxqda.com/
Michael J. Sharp Sharp Inquiry – QDA Research and Consulting 203 S. Main St., Suite 9; Goshen IN 46526, USA E-mail:
[email protected] URL: http://www.sharpinquiry.com/
Citation Kuckartz, Anne M. & Sharp, Michael J. (2011). Responsibility: A Key Category for Understanding the Discourse on the Financial Crisis—Analyzing the KWALON Data Set with MAXQDA 10 [27 paragraphs]. Forum Qualitative Sozialforschung / Forum: Qualitative Social Research, 12(1), Art. 22, http://nbn-resolving.de/urn:nbn:de:0114-fqs1101222.
© 2011 FQS http://www.qualitative-research.net/