The Role of Currency Derivatives in Internationally Diversified Portfolios P E T E R A . A B K E N A N D M I L I N D M . S H R I K H A N D E Abken is a senior economist in the financial section of the Atlanta Fed’s research department. Shrikhande is an assistant professor of finance at the Georgia Institute of Technology and a visiting scholar in the financial section of the Atlanta Fed’s research department. The authors thank Rob Bliss, Jerry Dwyer, Larry Wall, and Tao Zha for helpful comments and Elizabeth Bram of Salomon Brothers for providing bond return data.
T
HE POWER OF DIVERSIFICATION IN REDUCING RISK IS WIDELY UNDERSTOOD AND PRACTICED BY INVESTORS. IN RECENT YEARS INVESTORS HAVE BEEN TURNING TO FOREIGN MARKETS TO OBTAIN EVEN GREATER SCOPE FOR DIVERSIFICATION THAN IS POSSIBLE IN A DOMESTIC MARKET.
WITH
THE INTERNATIONALIZATION OF SECURITY PORTFOLIOS, HOWEVER, ALSO COMES
AN ADDITIONAL RISK—FOREIGN EXCHANGE RISK.1
FOREIGN
EXCHANGE RATE FLUCTUATIONS INDUCE
CHANGES IN PORTFOLIO RETURNS BECAUSE UNCERTAIN FUTURE EXCHANGE RATES TRANSLATE RETURNS ON FOREIGN-CURRENCY-DENOMINATED INVESTMENTS INTO DOLLAR RETURNS.2
DIVERSIFICATION
OF PORTFO-
LIO HOLDINGS ACROSS SEVERAL COUNTRIES CAN HELP MITIGATE FOREIGN EXCHANGE RISK.
DERIVATIVE
SECURITIES ARE INSTRUMENTS THAT ALTER THE CASH FLOWS OF A PORTFOLIO.
THE
USE OF CURRENCY
DERIVATIVES CAN FURTHER REDUCE RISK IN INTERNATIONALLY DIVERSIFIED PORTFOLIOS.
This article investigates the impact of currency hedging on internationally diversified stock and bond portfolios. It explains how currency hedging works and shows how hedging affects actual historical portfolio returns. The focus of the analysis is on index portfolios of stocks and bonds from markets in seven industrialized countries. Portfolio diversification eliminates the influence of what is called idiosyncratic risk—the unpredictable losses specific to individual security returns—from a securities portfolio. Domestic diversifi34
cation, however, leaves exposure to “systematic” risk, the unpredictable losses that affect all domestic securities.3 Because domestic systematic risks are likely to differ from country to country, international diversification can further reduce the volatility of portfolio returns by mitigating country-specific risk. Several studies have suggested that hedging against foreign exchange risk has little effect on expected return, or may even enhance it, while reducing the variability of portfolio returns (Perold and Schulman
Federal Reserve Bank of Atlanta E C O N O M I C R E V I E W Third Quarter 1997
1988; Thomas 1988, 1989; Eun and Resnick 1988, 1994; Kaplanis and Schaefer 1991; Eaker and Grant 1991; Glen and Jorion 1993; Levich and Thomas 1993).4 The advantage of hedging has even been described as a “free lunch” (Perold and Schulman 1988) because currency hedging appears to deliver benefits at no cost. This article reexamines the data for international equity and bond returns and foreign exchange rates for sample periods running from 1980 to 1996 for equities and from 1986 to 1996 for bonds. Most of the previous studies include sample periods that were dominated by the dollar’s appreciation against most major currencies during the first half of the 1980s. After the Plaza Accord of 1985, the dollar began a long depreciation that lasted until the mid-1990s.5 This more recent period is also characterized by a different structure of security return and foreign exchange volatilities and correlations. This change had a significant impact on the apparent performance of hedging. These relationships and their effects are explained in the following sections. The results in this article are derived from an analysis of “efficient” portfolios, securities portfolios that offer the greatest feasible return for a given level of risk. The apparent risk-reducing benefits of currency hedging of equity portfolios in the early 1980s are not confirmed for the 1986–96 period overall or for subperiods. In contrast, foreign long-term bond portfolios consistently exhibited dramatically lower variability of hedged returns compared with the variability of unhedged returns, a finding that agrees with results from the earlier studies of currency hedging based on earlier sample periods. However, even for bond portfolios, the case for currency hedging is not decisive because, historically, the lower variability of hedged return is associated with lower returns. The decision to hedge depends on the investor’s preference for risk and return.
Diversification odern portfolio theory dates back to the work of Markowitz (1952). Markowitz started with the assumption that a portfolio’s riskiness may be measured by the variance of its returns. He showed that an investment in a portfolio of securities offers investors risk and return combinations that are not possible from individual securities. In most cases, diversification allows an investor to obtain higher expected return for the same risk or lower risk for the same expected return relative to the return available from a single security. Markowitz’s insight is easily seen by considering the formulas for the mean and variance of return from a two-asset portfolio:
M
rp = w1r1 + w2r2 sp2 = w12 s21 + w22 s22 + 2w12 w22 rs1s2,
(1)
where ri is the security return on security 1 or 2 or the portfolio p, s 2i is the variance of the corresponding return, w1 and w2 are portfolio weights, and r is the correlation coefficient between the individual security returns. Because the portfolio weights are assumed to sum to one, the portfolio mean return is a weighted average of the returns on the two assets. However, because of the covariance term for s p2 in equation (1), a portfolio containing both securities will usually have a lower standard deviation (square root of the variance) than simply a weighted sum of their individual standard deviations.6 An efficient portfolio has the greatest feasible return for a given standard deviation of return. The later empirical section focuses principally on determining the proportions of international stock or bond portfolios that generate the efficient “frontier,” which is a graph of efficient portfolios’ standard deviations against their returns. A particular investor’s taste for risk and
1. Stock prices themselves may reflect the foreign exchange exposures of firms with multinational operations. However, firms can reduce this risk using derivatives or other risk-management techniques. See Chow, Lee, and Solt (1997). 2. A security’s return is the rate of price appreciation, including associated cash flows such as dividend or interest payments. 3. The measure of risk used in this article is the standard deviation of a security’s excess return, that is, its return in excess of the risk-free rate of interest. Because the portfolios used are market-value weighted index portfolios of stocks or bonds, the variability of excess return is assumed to reflect predominately systematic risk. 4. This article focuses on “buy and hold” strategies, constructed purely as hedges, which are described in a later section. A number of studies on foreign exchange markets claim that foreign exchange movements contain a predictable component. For example, Glen and Jorion (1993) and Levich and Thomas (1993) show that by taking positions in foreign exchange derivatives based on forecasts of exchange rate movements, it is possible to earn “excess returns.” The key unresolved issue regarding these returns is whether they represent compensation for risk exposure. Exploiting apparent foreign exchange market inefficiencies may offer the potential to enhance expected return without increasing risk. 5. In September 1985 the finance ministers and central bank governors of the so-called Group of Six industrial countries (the United States, France, Germany, the United Kingdom, Japan, and Canada) met at the Plaza Hotel in New York City and reached what was later referred to as the Plaza Accord or Agreement. They announced that it would be desirable for most major currencies to appreciate vis-à-vis the U.S. dollar and pledged to intervene in exchange markets to accomplish this objective. The dollar had already started to fall during the spring and summer of 1985. 6. For perfectly correlated returns (p = 1), the standard deviation of portfolio returns is exactly equal to the weighted sum of the standard deviations of the individual returns. Federal Reserve Bank of Atlanta E C O N O M I C R E V I E W Third Quarter 1997
35
return would guide the selection of an optimal portfolio along the efficient frontier. International Diversification. The principles of diversification apply regardless of the kind of assets or currencies of their denomination. What is different about investing abroad is the assumption of foreign exchange risk that comes with owning foreign securities. The impact of exchange rate movements on unhedged dollar returns can be understood by considering the return in terms of two sources of risk, volatility of the foreign security returns and volatility of the foreign exchange rate. Movements in both are largely unpredictable, and they are generally correlated with one another. A security’s rate of Foreign exchange rate return, measured from fluctuations induce changes period t – 1 to t, is defined as the rate of in portfolio returns because price appreciation plus uncertain future exchange associated cash flows rates translate returns such as dividend or interest payments. The on foreign-currencyreturn based on prices denominated investments denominated in foreign into dollar returns. or “local” currency is referred to as the local return. 7 The rate of change of the exchange rate, st / s t–1 – 1, is denoted by et, where positive values signify an appreciation of the foreign currency. The rate of return at time t in dollars on an unhedged foreign investment is rt = (1 + rlt)(1 + et) – 1 = rlt + et + rltet.8 The dollar return rt depends on the local security return rlt and the rate of change of exchange rate et. The dollar return can be approximated by rt ' rlt + et because the cross-product term rltet is generally small. For example, if the foreign equity index over a three-month period depreciated by 3 percentage points and paid dividends at the rate of 1 percent of the index level, the local return would be –2 percentage points. If during the same period, the exchange rate appreciated by 4 percentage points, the total dollar rate of return would be approximately 2 percentage points. For a portfolio involving securities denominated in several currencies, the diversification effects can be described by giving a weight wi to each portfolio, where the subscript i indexes the portfolios available. The weights for N index portfolios sum to unity. Based on the approximation rt ' rlt + et for the unhedged dollar return of an individual securities portfolio, Eun and Resnick (1988) derive an approximation for variance of the return on an unhedged multicountry securities portfolio that takes the following form analogous to equation (1): 36
σ u ≈ ∑ i =1 ∑ j =1 wi wj ρijσ iσ j N
2
N
l
l
l
(2)
144 42444 3 security return covariances
+
wwρ σ σ ∑ ∑42 144 444 3 N
N
i =1
j =1
i
j
e
e
e
ij
i
j
foreign exchange rate covariances
σ , ∑ ∑ w w ρ σ3 14442444
+2
N
N
i =1
j =1
i
j
l ,e
l
e
ij
i
j
local return–foreign exchange rate covariances
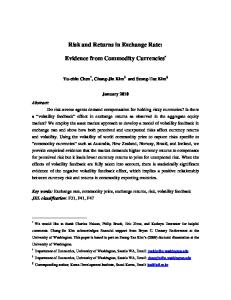
where the first term represents weighted covariances of the security returns on the N index portfolios making up the overall portfolio (with superscript l for local return), the second is for the covariances of the corresponding exchange rates (with superscript e for exchange rate), and the third term is for the crosscovariances between exchange rates and security returns, such as the mark exchange rate with the Japanese equity portfolio return. Chart 1 illustrates the benefits of international diversification using as an example data from 1980 to 1985, a period that will be discussed in detail below. The average annual return and standard deviation of a U.S. stock portfolio is represented by the dot. The efficient frontier generated by combining the U.S. portfolio with stock portfolios from Germany, the United Kingdom, Japan, France, Canada, and Switzerland lies above the U.S. portfolio.9 For the same standard deviation of return, the internationally diversified portfolio offers a higher return. The minimum standard deviation efficient portfolio has a return that is 1 percentage point higher than the standard deviation of the U.S. portfolio and a standard deviation of return that is 2 percentage points lower than the U.S. portfolio’s. In short, investors who evaluate portfolios based on their expected mean returns and standard deviations would choose a portfolio along the efficient frontier.
Currency Derivatives and Hedging hile the choice of securities and their degree of diversification fundamentally affects the riskreturn profile of a portfolio, further tailoring of a portfolio’s risk-return characteristics can be achieved through the use of derivative securities. Derivatives are instruments that change the cash flows of a portfolio. This transformation of cash flows alters fluctuations in the market value of a portfolio. Hedging is a transformation of cash flows or market value that the investor regards as reducing the risk of a position. All hedging of securities portfolios considered in this article is implemented using foreign exchange forward contracts. A foreign exchange forward contract is an agreement between two parties to buy (or sell) foreign currency at a future date at an exchange rate determined at the time of the transaction. (In contrast,
W
Federal Reserve Bank of Atlanta E C O N O M I C R E V I E W Third Quarter 1997
CHART 1 Example of an Efficient Frontier for International Equity Portfolios, 1980–85 Unhedged Portfolios
Return
20
18
16 U.S. Portfolio
14 13
14
15
16
17
18
19
20
21
22
Standard Deviation
a spot contract specifies an immediate exchange of currency at the prevailing exchange rate.) Although other kinds of derivatives can serve the same purpose as forwards, forwards are a simple, cost-effective way to alter the variability of securities portfolio returns.10 Box 1 discusses the costs associated with hedging using forward contracts. Foreign exchange forward contracts are sold by major commercial banks and typically have fixed, short-term maturities of one, six, and nine months. As with many other kinds of derivatives, forward contracts do not involve a net investment upon initiation of a position. Foreign Exchange Forward Contracts. The following example gives a straightforward hedging application, in which all risk is eliminated, and at the same time demonstrates an important arbitrage condition that determines the relationship between forward and spot foreign exchange rates on the one hand and domestic and foreign short-term interest rates on the other.
This relationship is useful for understanding the portfolio hedging results. The arbitrage condition known as covered interest parity is given by the following equation: f/s = (1 + rUS)/(1 + rDM), where f and s are forward and spot rates, respectively, expressed in units of dollars per mark, and rUS and rDM are short-term rates of interest in the United States and Germany, respectively (DM for deutsche mark). The meaning of arbitrage condition is clarified as the example is developed. Suppose an investor borrows one dollar and thereby obligates himself to repay 1 + rUS dollars upon maturity of the loan or bond in one month. By converting this borrowing into deutsche marks at the spot exchange rate s, the investor receives 1/s DM per dollar. The investor then buys a one-month German Treasury bill
7. The return on a U.S. domestic securities portfolio is also a local return. 8. This discrete-time formulation is given in Eun and Resnick (1988). Eun and Resnick assume that the investor sells the expected foreign currency proceeds from a foreign investment forward, whereas the examples in the text assume for simplicity that the current value of that investment is sold forward. 9. The efficient frontier is computed by solving the following problem. Suppose there are n securities. Let x be an n 3 1 vector of portfolio weights, m be an n 3 1 vector of mean security returns, and S be an n 3 n covariance matrix of security returns. The efficient portfolio for a target return of µ is determined by finding optimal portfolio weights x* that minimize the varix ′ ∑ x , subject to x ′µ = µ and x ′1 = 1 , where 1 is an n 3 1 vector of ones. An additionance of the portfolio’s returns: min x al constraint is imposed in this study that requires the portfolios’ weights to be nonnegative, that is, the asset portfolios are not permitted to be sold short. Without the nonnegativity constraint, the optimization typically results in improbable or infeasible positions in securities (or portfolios), in particular huge short positions that even most institutional investors cannot assume (Glen and Jorion 1993). The optimal portfolio variance is then given by x * ′ ∑ x *. The efficient frontier is generated by varying the target return µ and solving for the corresponding portfolio variances. 10. One alternative to standard forwards is “quanto” forwards and options. See Rubinstein (1991) and Reiner (1992). With such instruments, the user avoids the quantity risk of forward contract hedges. A less exotic alternative is currency futures contracts traded on futures exchanges.
Federal Reserve Bank of Atlanta E C O N O M I C R E V I E W Third Quarter 1997
37
B O X
1
The Costs of Hedging he benefits of hedging could potentially be offset by its costs. There are the costs of dealing with a financial intermediary, which provides access to hedging instruments such as forward contracts. These costs depend on the particular instruments. Forward contracts involve commission costs, and transactions at prices or rates reflecting the payment of a bid-ask spread, and possibly the opportunity costs of posting collateral against future losses on the forward position.1 Perold and Schulman (1988) observe that hedging costs are the least significant of the costs associated with international investment. They estimate that rolling over six-month forwards would incur costs reflecting the bid-ask spread and transaction costs of only 0.12 percent per year of the amount invested (Perold and Schulman 1988, 48). A potential cost of the hedge is the forward premium or discount. As discussed in the text, short forward positions are closed out upon maturity of a contract and rolled into new contracts. The new contracts fix the current forward rate for the hedge. If the foreign currency being sold forward is at a discount (because the foreign interest rate exceeds the home country rate), the investor is effectively paying to hedge and the expected return of the investment is reduced by the interest rate differential. The opposite is true of short hedging when the currency is at a forward premium; that is, the interest rate differential can increase the hedged portfolio return.2 The impact on hedged portfolio returns of the cost of carry can be sizable, as will be seen in the next section. Another potential cost is a risk premium implicit in the forward rate. In contrast with the forward discount, this cost is not directly observable. For example, if the forward exchange rate is a downward biased estimate of the
T
future mark spot rate and an investor wishes to sell marks forward for dollars, the average outcome of entering into such contracts is that fewer dollars per mark would be received through the forward contract than through spot exchanges at the time the forward matures.3 The forward would still give a certain rate of conversion in contrast with the random rate of a future spot transaction, but on average an investor would be paying an implicit premium for a predetermined rate of exchange. Theoretical modeling of the risk premium in forward and futures markets as well as empirical tests of those models have been long-standing research topics (see Hodrick 1987 for a survey of the early literature and Dumas 1996 for more recent studies). Empirically useful characterizations of the risk premium still elude researchers. Most studies find that forwards and futures do not give unbiased estimates of subsequent spot rates; however, linking the estimated bias with variables that measure risk based on theoretical considerations has largely been unsuccessful. The bias fluctuates through time. The literature is substantially in agreement that over long holding periods, typically a few years, the bias and presumably the risk premium are close to zero. This observation is the crux of the argument that currency hedging is a free lunch: hedging delivers a substantial reduction in risk, in the form of a large reduction in the standard deviation of returns, while not entailing the implicit payment of a risk premium. Standard tests for risk premiums applied to the sample used in this article confirm that the average risk premium for each of the six major currencies considered was not statistically significantly different from zero (results available from the authors).
1. Options have similar costs of transacting as well as the payment of the option premium since, unlike forwards, long option positions are net investments. 2. The costs accruing from rolling over hedges can cause serious problems for the hedger if not handled with care. A roll-over hedging strategy used by Metallgesellschaft precipitated a liquidity crisis and eventual bankruptcy of this huge German oil refining and distribution firm. See Culp and Miller (1995). 3. The risk premium could also be collected rather than paid by the forward contract holder. It is not necessarily a cost of using forwards.
38
Federal Reserve Bank of Atlanta E C O N O M I C R E V I E W Third Quarter 1997
paying interest of rDM. Such an investment would offer a guaranteed nominal payoff of (1 + rDM)/s DM upon maturity. However, this sum would then have to be translated back into dollars at an unknown future dollarmark exchange rate. The investment would be risky in dollar terms as a result of exchange rate fluctuations. That risk could be eliminated at the outset by a sale of marks for dollars using a forward contract, which specifies a rate of future conversion. The exchange risk is irrelevant with the forward contract because the mark payoff of the investment is translated into dollars at the known forward rate, giving f 3 (1 + rDM)/s dollars toward paying back 1 + rUS dollars of the borrowing. Borrowing at home in dollars and lending abroad in marks must result in equal dollar outcomes on both sides of the transaction; otherwise, investors would seek to exploit or arbitrage the discrepancy because the strategy involves no risk.11 If the dollar receipt of lending exceeds the dollar outlay of borrowing, the foregoing strategy would be undertaken. If the dollar receipt of lending falls short of the dollar outlay of borrowing, the strategy would be reversed, with marks being borrowed and converted into dollar investments. The consequence of this arbitrage pressure is that the following equation must hold: 1 + rUS = f 3 (1 + rDM)/s or f/s = (1 + rUS)/(1 + rDM). The forward exchange rate is determined by the spot exchange rate and the domestic and foreign short-term interest rates for investments with the same maturity as the forward contract. Another way to view this example is from a financial intermediary’s perspective, typically a bank that offers forward contracts to its customers. For example, a bank could enter into a forward contract with a customer who wants to buy marks and sell dollars at the forward rate. The bank could hedge its resulting exposure by borrowing dollars and lending marks to lock in a payment of 1 + rUS dollars and a receipt of f(1 + rDM)/s dollars. In other words, by covered interest parity, no matter what happens to the exchange rate, the bank is guaranteed a later receipt of f(1 + rDM)/s dollars upon expiration of the forward contract and a payment of 1 + rUS dollars. If the mark depreciates against the dollar, the bank gains on its short forward position in marks vis-à-vis its customer but offsets the gain upon translating the mark lending back into dollars. If the mark appreciates, the bank loses on its forward position but recoups the loss by gains on its lending. The bank’s
obligation to its customer would be fully covered by these hedging transactions. Portfolio Hedging. In contrast with the covered interest parity example, the investments now under consideration will have maturities or holding periods that are longer than the instruments used to hedge them. For practical reasons, such as reducing the costs of hedging, hedges are adjusted only periodically; consequently, they will be imperfect, leaving an unhedged exposure. As applied in this article, hedging will involve matching a currency hedge with a portfolio in such a way that the full foreign currency exposure of the initial value of the investment position is covered. This type of hedging is someBecause domestic systemtimes called unitary hedging, which has atic risks are likely to proved to be effective differ from country to compared with more country, international sophisticated meth12 ods. A hedged long diversification can further position in foreign secureduce the volatility of rities involves selling portfolio returns by mitithe current foreign currency value of the gating country-specific investment forward for risk. dollars. The investor is said to have a short position in the forward contract—that is, he is obligated to sell foreign currency at the forward rate upon maturity of the contract. As a forward contract matures and is settled with the contract’s counterparty, another forward contract is sold to maintain the hedge for the next, say, three-month period on a continuing underlying foreign asset exposure. This process is called rolling the hedge. The results of single-period hedging can be described using the following notation. The rate of gain (or loss) on the forward contract is fpt–1 – et, where fpt–1 is the forward premium, defined as ft–1/st–1 – 1 (which by covered interest parity is the difference between the domestic and foreign short-term bond yields of the same maturity as the forward). Being short the forward contract implies that a gain accrues to the forward position if the future spot exchange rate at the time the forward matures is below the forward rate. Equivalently, the
11. For simplicity, this example neglects transaction costs and differences in borrowing and lending rates in a given currency. 12. More sophisticated methods that use information derived from joint comovements among forward contract returns and security returns (such as using Japanese yen forwards to hedge mark portfolio exposures) have not yielded better results than the simple full hedging prescription. See Adler and Simon (1986), Eun and Resnick (1988), Kaplanis and Schaefer (1991), and Glen and Jorion (1993); see Anderson and Danthine (1981) and Duffie (1989) for general discussions of hedging predetermined portfolio positions.
Federal Reserve Bank of Atlanta E C O N O M I C R E V I E W Third Quarter 1997
39
forward position shows a gain if the forward premium exceeds the rate of change in the exchange rate (fpt–1 > et). Note that the forward premium can be negative, which is called a forward discount (a foreign short-term interest rate greater than the domestic). A gain (loss) on the forward position would help to offset a loss (gain) on the unhedged position in the event the foreign exchange rate depreciates (appreciates). The strategy of short hedging the foreign exposure of the initial investment does not perfectly hedge the foreign securities position because the investment result is unhedged. It turns out that the imperfect hedge is not of great consequence, as demonstrated in the empirical discussion, because the magnitude of the hedging error is small. The initial value of the investment is sold forward for gross return of 1 + fpt–1 at time t, and the investment result is converted at the prevailing spot exchange rate, giving a gross dollar return of rlt(1 + et). As noted above, the cross product term rltet, which is the hedging error, is small and is ignored in the discussion to follow. The net dollar return on the hedged portfolio can be interpreted in two equivalent ways: either as the sum of the gross return on the hedged initial foreign investment and the unhedged investment return minus one, (1 + fpt–1) + rlt(1 + et) – 1 ' rlt + fpt–1, or as the sum of the gross return on the unhedged foreign investment and the return to a short forward position minus one, (1 + rlt)(1 + et) + (fpt–1 – et) – 1 ' rlt + fpt–1.13 The hedged dollar return is thus approximated by the local return plus the forward premium. Based on unitary hedges of exposures to each country’s index portfolio, the variance of the hedged diversified portfolio dollar return is
σ h ≈ ∑ i =1 ∑ j =1 wi wj ρi jσ iσ j N
2
N
l
l
l
(3)
144 42444 3 local return covariances
+
∑ ∑ wwρ σ σ 144424443 N
N
i =1
j =1
fp
i
j
ij
fp
fp
i
j
forward premium covariances
+ 2∑ i=1 ∑ j =1 wi wj ρilj, fpσ ilσ jfp , 144424443 N
N
security return–forward premium covariances
where the forward premium standard deviations (with superscript fp for forward premium) and correlation coefficients replace those of the foreign exchange rates that appear in equation (2). The key argument for currency hedging is that the variance reduction by diversifying internationally that may be realized through the first term in equation (2) for local returns may be offset by the contributions of the second two terms for the exchange rate interactions. Foreign exchange rates tend to be more highly correlated than international equity or bond returns.14 40
In contrast, the forward premium has a much lower standard deviation and a lower correlation with local returns than the spot exchange rate. Both of these characteristics may improve the risk-return trade-off for internationally diversified portfolios.
Analysis of Unhedged and Hedged Internationally Diversified Portfolios his section evaluates the impact of currency hedging on diversified portfolios of bonds and diversified portfolios of stocks. After a brief overview of the data used to construct internationally diversified portfolios, the effects of currency hedging are assessed by analyzing efficient frontiers for hedged diversified portfolios and unhedged diversified portfolios. Data. Equity and government bond investments in seven countries are considered: Germany, the United Kingdom, Japan, France, Canada, Switzerland, and the United States. Portfolio performance is examined at quarterly intervals, based on portfolio values, spot exchange rates, and three-month forward rates as of the last day of the quarter. The full period runs from first quarter (Q1) 1980 to Q4 1996. The first subperiod, Q1 1980 to Q4 1985, was selected to match or substantially overlap the sample periods in Thomas (1988, 1989), Perold and Schulman (1988), Kaplanis and Schaefer (1991), and Glen and Jorion (1993). The equity returns under consideration are computed from stock indexes compiled by Morgan Stanley Capital International (MSCI) and include the reinvestment of dividends paid during the holding period. The indexes for each country represent portfolios of all listed firms, included in industry proportions that reflect industry composition in the local market. The stocks in the index are weighted by the market capitalization of the included firms, which themselves are drawn from a representative sample of large, medium, and small capitalization firms (MSCI 1995). The government bond index is the government bond subsector of the Salomon Brothers World Bond Index, which is a value-weighted index of bonds with at least one year to maturity. The bond portfolio data cover Q1 1986 to Q4 1996. Coupon payments are reinvested. Three-month forward and spot exchange rates are from Data Resources, Inc. Stock and bond returns are expressed as excess returns by subtracting the three-month Treasury bill yield from U.S. dollar returns and by deducting a foreign country’s three-month risk-free yield from its security returns.15 This adjustment improves the comparability of returns that are computed for multiyear periods and has little effect on the measured standard deviation of return. Equities. Charts 2–5 display the efficient frontiers for internationally diversified equity portfolios for various subperiods. The top panel in each chart shows two
T
Federal Reserve Bank of Atlanta E C O N O M I C R E V I E W Third Quarter 1997
frontiers, one for the unhedged efficient portfolios and the other for the hedged. The unhedged portfolio frontier is derived from the unhedged dollar excess returns during a given period and the hedged portfolio frontier from the hedged dollar excess returns. (All rates shown in the charts and tables are in percent on an annual basis.16) Optimal weights were computed to combine these individual country index portfolios. The left-hand starting point of a frontier represents the minimum standard deviation portfolio’s excess return and standard deviation. The curve moves to the northeast as higher excess return necessitates the addition of greater risk, as approximated by the standard deviation of excess return. The range of excess return and standard deviation of a given frontier reflects all possible efficient outcomes that could be derived from the seven individual country index portfolios that entered the portfolio optimization.17 The dot in this graph is the excess return and standard deviation of the U.S. index portfolio. The optimal portfolio weights appear in the second and third panels of the chart. The second panel gives the weights for the unhedged efficient portfolios, and the third gives them for the hedged efficient portfolios. The country weights are vertical slices of this area plot, which shows how the weights vary continuously from the minimum standard deviation portfolio on the extreme left-hand side to the maximum standard deviation portfolio on the extreme right-hand side. Chart 2 dramatically illustrates what drove currency hedging advocates’ enthusiasm. The hedged portfolio efficient frontier is mostly to the northwest of the unhedged portfolio’s. (This unhedged portfolio efficient frontier, computed using returns rather than excess returns, appeared as Chart 1.) Hedging delivers much higher excess return at substantially lower risk. Note that simply holding the U.S. index was an inefficient choice compared with either type of diversified portfolio. The hedged efficient portfolio frontier does not
include the U.S. portfolio. Not surprisingly, the optimization for the portfolio weights mainly selected the high excess return markets of Japan, the United Kingdom, and Germany. The optimization constrained the weights on these portfolios to be nonnegative (that is, selling an index portfolio short was not permitted). However, no constraint was placed on the share of a particular country’s index in the portfolio. In practice, it may not be cost-effective to attempt to take large securities positions in countries with relatively low capitalization equity markets. (Such purchases could raise the cost of shares The impact of exchange if an institutional portfolio manager attemptrate movements on ed to acquire a large unhedged dollar returns position.) can be understood by Table 1 shows the results by country and considering the return in subperiod. Panel A of terms of two sources of Table 1 for unhedged risk, volatility of both forstock index portfolios during 1980–85 indieign security returns and cates that the standard the foreign exchange rate. deviations of the quarterly non-U.S. portfolio unhedged dollar excess returns are all substantially greater than that of the U.S. portfolio. The reason for the volatility of the dollar excess returns is apparent from the rows giving the standard deviations of the foreign exchange returns and the correlation coefficients of the local excess return with the rate of change in the foreign exchange rate. Given the way the variables are measured in this article, the standard deviation of the local excess return is identical to the standard deviation of the hedged dollar excess return.18 The correlation coefficients are between 0.3 and 0.6. The relatively high foreign exchange rate variances and positive local excess return–foreign exchange
13. This second interpretation can also be viewed in terms of an unhedged investment position and a position in domestic and foreign bonds that substitutes for the forward contract. Namely, a short forward position is synthesized by being short foreign bonds (borrowing) and being long domestic bonds (lending), resulting in predetermined payment of foreign currency and receipt of domestic currency. Specifically, from the earlier discussion of covered interest parity, the dollar receipt from lending would be 1 + rUS and the mark payment would be (1 + rDM)/s. 14. During the 1986–96 period, the average correlation coefficient between two countries, excluding Canada, is about 0.6 for equity or bond returns on index portfolios, whereas the average correlation is 0.8 for foreign exchange returns. The average foreign exchange correlation drops to 0.5 when Canada is included. 15. The foreign three-month risk-free rate is estimated by the negative of the difference between the forward premium and the three-month Treasury bill yield. 16. All rates are reported as annualized quarterly logarithmic differences of the variables. Means are annualized and converted to percentages by multiplying by 400; standard deviations by 200 (==43100) 17. The optimization algorithm frequently failed to converge for efficient portfolios that approached the extremes of maximum excess return and maximum standard deviation. These portfolios typically consist of a single index, as seen in the panels for the optimal portfolio weights. 18. The identity occurs when the forward premium is assumed to equal the U.S.–foreign interest rate differential.
Federal Reserve Bank of Atlanta E C O N O M I C R E V I E W Third Quarter 1997
41
CHART 2 International Equity Portfolios, 1980–85 Efficient Frontiers 16
Excess Return
14 12 U.S.
Hedged
Unhedged
10 8 6 4 7
9
11
13 15 17 Standard Deviation
19
21
23
Optimal Por tfolio Weights, No Currency Hedging 1.0 U.S.
We i g h t
0.8
0.6
0.4
France Japan
0.2 U.K. Germany 0 14.4
15.0
18.0
21.5
Standard Deviation
Optimal Por tfolio Weights, Currency Hedging 1.0 France 0.8
We i g h t
Japan 0.6
0.4 U.K. 0.2 Germany 0 9.1
9.6
12.2
Standard Deviation
Note: Standard deviations on portfolio weight charts are not measured in equal intervals.
42
Federal Reserve Bank of Atlanta E C O N O M I C R E V I E W Third Quarter 1997
15.2
CHART 3 International Equity Portfolios, 1986–96 Efficient Frontiers 10 Unhedged
Excess Return
9 8 7 U.S. 6 Hedged 5 4 3 2 12.5
13.5
14.5
15.5
16.5
17.5
Standard Deviation
Optimal Por tfolio Weights, No Currency Hedging 1.0
U.S. 0.8
We i g h t
France 0.6
Switzerland 0.4
Canada
U.K.
Japan 0.2
Germany 0 12.7
12.8
13.4
17.2
Standard Deviation
Optimal Por tfolio Weights, Currency Hedging 1.0
0.8
We i g h t
U.S. 0.6
0.4
Canada 0.2 Japan
Germany
0 12.8
13.0
13.6
14.4
Standard Deviation
Federal Reserve Bank of Atlanta E C O N O M I C R E V I E W Third Quarter 1997
43
CHART 4 International Equity Portfolios, 1986–90 Efficient Frontiers 12 Unhedged
Excess Return
10 8 6 4 2 U.S.
Hedged
0 –2 –4 –6 16
20
24 Standard Deviation
28
32
Optimal Por tfolio Weights, No Currency Hedging 1.0
Switzerland
France
0.8
We i g h t
Canada 0.6
Japan 0.4
U.K. 0.2
Germany 0 16.9
17.5
19.5
23.7
Standard Deviation
Optimal Por tfolio Weights, Currency Hedging 1.0
0.8
We i g h t
U.S. 0.6
0.4 Japan
Canada 0.2 Germany 0 16.5
17.5
19.2
Standard Deviation
Note: Standard deviations on portfolio weight charts are not measured in equal intervals.
44
Federal Reserve Bank of Atlanta E C O N O M I C R E V I E W Third Quarter 1997
30.6
CHART 5 International Equity Portfolios, 1991–96 Efficient Frontiers 15 14 Excess Return
Unhedged 13 12 11 10 Hedged
U.S. 9 8 7 6 5.5
6.5
7.5
8.5
9.5
10.5
11.5
12.5
Standard Deviation
Optimal Por tfolio Weights, No Currency Hedging 1.0
0.8
We i g h t
U.S. 0.6
Canada 0.4
Switzerland
Japan 0.2
Germany 0 5.9
6.0
7.0
11.0
Standard Deviation
Optimal Por tfolio Weights, Currency Hedging 1.0
0.8
We i g h t
U.S. 0.6
Canada 0.4
Switzerland
Japan 0.2
Germany 0 6.5
6.7
7.6
12.5
Standard Deviation
Federal Reserve Bank of Atlanta E C O N O M I C R E V I E W Third Quarter 1997
45
46
TA B L E 1 S t o c k I n d e x P o r t f o l i o s
Federal Reserve Bank of Atlanta E C O N O M I C R E V I E W Third Quarter 1997
Panel A: 1980–85 Germany
U.K.
Japan
France
Canada
Switzerland
U.S.
Unhedged Stock Index Portfolio Dollar Excess Returns Mean excess return Standard deviation
7.30
4.46
9.95
–0.59
–3.46
3.90
5.42
23.55
20.26
22.12
29.13
24.83
25.06
15.14
—
Hedged Stock Index Portfolio Dollar Excess Returns Mean excess return
15.82
11.54
10.69
5.18
–1.28
12.30
Standard deviation
15.74
12.85
13.86
21.20
22.20
16.02
—
Percent change in standard deviation of hedged returns to standard deviation of unhedged returns
–33.2
–36.6
–37.4
–27.2
–10.6
–36.1
—
Perfect Foresight Hedge Dollar Excess Returns Mean excess return
15.65
11.51
10.19
4.54
–1.73
11.75
—
Standard deviation
15.39
13.11
14.16
22.08
22.29
15.59
—
Forward Premium Mean
4.56
0.06
4.59
–3.36
–0.59
6.54
—
Standard deviation
1.04
1.42
1.62
2.59
0.71
1.33
—
–0.28
–0.12
–0.12
–0.15
0.12
–0.30
—
Correlation between local excess return and forward premium
Foreign Exchange Returns Mean return
–3.96
–7.02
3.85
–9.12
–2.78
–1.86
—
Standard deviation
13.14
12.14
13.18
13.61
4.42
13.68
—
0.30
0.24
0.26
0.34
0.55
0.37
—
Correlation between local excess return and foreign exchange return
TA B L E 1 S t o c k I n d e x P o r t f o l i o s (cont.) Panel B: 1986–96 Germany
U.K.
Japan
France
Canada
Switzerland
U.S.
Unhedged Stock Index Portfolio Dollar Excess Returns Mean excess return Standard deviation
4.21
9.29
3.67
8.64
3.33
8.19
7.96
19.34
18.00
28.35
20.70
14.68
16.32
14.41
Hedged Stock Index Portfolio Dollar Excess Returns Mean excess return Standard deviation Percent change in standard deviation of hedged returns to standard deviation of unhedged returns
0.04
4.49
0.77
2.85
1.17
5.22
—
22.66
17.97
25.70
22.23
13.06
20.99
—
17.2
–0.1
–9.3
7.4
–11.0
28.6
—
Federal Reserve Bank of Atlanta E C O N O M I C R E V I E W Third Quarter 1997
Perfect Foresight Hedge Dollar Excess Returns Mean excess return Standard deviation
1.30
4.92
0.81
3.58
0.96
6.90
—
21.38
17.19
25.17
21.41
12.81
20.01
—
Forward Premium Mean
0.04
–3.26
2.07
–2.35
–1.98
0.95
—
Standard deviation
1.58
1.08
1.10
1.43
0.74
1.45
—
Correlation between local excess return and forward premium
0.03
0.00
0.13
0.00
0.33
0.00
—
0.18
3.93
—
Foreign Exchange Returns Mean return
4.21
1.54
4.97
3.45
Standard deviation
12.83
11.92
13.19
11.82
4.26
14.43
—
Correlation between local excess return and foreign exchange return
–0.52
–0.33
–0.05
–0.38
0.29
–0.64
—
47
(Continued on page 48)
48
TA B L E 1 S t o c k I n d e x P o r t f o l i o s (cont.)
Federal Reserve Bank of Atlanta E C O N O M I C R E V I E W Third Quarter 1997
Panel C: 1986–90 Germany
U.K.
Japan
France
Canada
Switzerland
U.S.
Unhedged Stock Index Portfolio Dollar Excess Returns Mean excess return Standard deviation
2.67
10.86
11.37
11.34
2.22
1.26
3.96
25.75
22.54
35.57
27.83
18.40
20.45
19.70
—
Hedged Stock Index Portfolio Dollar Excess Returns Mean excess return
–4.90
1.23
6.17
1.80
–3.90
–5.77
Standard deviation
29.88
23.83
31.95
30.04
16.55
27.05
—
16.0
5.8
–10.2
7.9
–10.0
32.2
—
Percent change in standard deviation of hedged returns to standard deviation of unhedged returns
Perfect Foresight Hedge Dollar Excess Returns Mean excess return
–3.46
1.70
5.64
2.46
–4.26
–3.72
—
Standard deviation
27.90
22.21
30.68
28.46
16.09
24.89
—
Forward Premium Mean
2.24
–3.85
2.55
–1.60
–2.40
2.52
—
Standard deviation
0.72
0.85
0.73
0.92
0.65
0.96
—
Correlation between local excess return and forward premium
0.14
–0.03
0.12
–0.06
0.32
0.27
—
Foreign Exchange Returns 9.81
5.77
7.75
7.93
3.72
9.55
—
Standard deviation
Mean return
11.82
11.79
14.33
10.71
3.66
13.43
—
Correlation between local excess return and foreign exchange return
–0.52
–0.37
0.04
–0.39
0.48
–0.67
—
TA B L E 1 S t o c k I n d e x P o r t f o l i o s (cont.) Panel D: 1991–96 Germany
U.K.
Japan
France
Canada
Switzerland
U.S.
Unhedged Stock Index Portfolio Dollar Excess Returns Mean excess return
5.50
7.98
–2.75
6.40
4.26
13.97
11.30
Standard deviation
12.28
13.60
20.83
12.59
11.09
11.53
7.81
5.40
14.38
—
Hedged Stock Index Portfolio Dollar Excess Returns Mean excess return Standard deviation Percent change in standard deviation of hedged returns to standard deviation of unhedged returns
4.16
7.20
–3.73
3.72
14.59
11.42
19.50
13.34
9.08
13.08
—
18.8
–16.0
–6.4
5.9
–18.1
13.5
—
Federal Reserve Bank of Atlanta E C O N O M I C R E V I E W Third Quarter 1997
Perfect Foresight Hedge Dollar Excess Returns Mean excess return Standard deviation
5.27
7.61
–3.22
4.51
5.31
15.75
—
14.25
11.86
19.93
13.68
9.06
13.85
—
Forward Premium –1.79
–2.77
1.68
–2.97
–1.64
–0.35
—
Standard deviation
Mean
1.52
1.20
1.32
1.71
0.78
1.48
—
Correlation between local excess return and forward premium
0.17
–0.01
0.14
0.07
0.32
0.07
—
Foreign Exchange Returns Mean return
–0.45
–1.98
2.66
–0.29
–2.78
–0.76
—
Standard deviation
13.42
11.99
12.35
12.59
4.23
15.09
—
Correlation between local excess return and foreign exchange return
–0.60
–0.29
–0.22
–0.50
0.34
–0.68
—
49
rate change covariances contribute to the relatively high standard deviations of many of the unhedged efficient portfolios in Chart 2.19 Nevertheless, the effects of international diversification still result in some efficient unhedged portfolios having lower standard deviations than that of the U.S. domestic portfolio. During the 1980–85 period, the average across all countries for the standard deviation of hedged dollar excess returns was 30.2 percent smaller than the average standard deviation of unhedged dollar excess returns. The hedged dollar excess return standard deviations for Japan and the United Kingdom are lower than the U.S. standard deviation, and none of the remaining standard deviations is as large as the corresponding unhedged dollar excess return The strategy of short hedgvalues. This finding is consistent with those ing the foreign exposure of reported in Thomas the initial investment does (1988), Perold and not perfectly hedge the Schulman (1988), and Kaplanis and Schaefer foreign securities position (1991), including data because the investment that extended back to result is unhedged. 1978. Based on this substantial variance reduction, Perold and Schulman offered this advice: “Our prescription does not say the prescient investor should not selectively lift a hedge, just that hedging should be the policy, and lifting the hedge an active investment decision” (1988, 45). The effectiveness of currency hedging using forwards is apparent from the results under the heading Perfect Foresight Hedge Dollar Excess Returns. These measures of the mean excess return and standard deviation reflect a currency hedge that was scaled to match the ex post quarterly security return. That is, rather than matching the hedge to the initial beginning-ofquarter portfolio value, the hedge was constructed to match the end-of-quarter portfolio value. In this way, the perfect foresight hedge covers the investment return, which is not known with certainty in practice. In this panel as well as in the others to follow, the unitary hedge results are close to those of the perfect foresight hedge, especially relative to the results derived from unhedged positions. Another point to notice is that, from equation (3), the hedged portfolio standard deviation depends on the variance of the forward premium as well as on the covariance of the forward premium with the local excess return. The forward premium standard deviations are an order of magnitude smaller than the foreign 50
exchange return standard deviations. The correlation coefficients for the forward premium with the local excess return are negative, a fact that also contributes to reducing the hedged portfolio variance. In Chart 2, most hedged efficient portfolios have a lower standard deviation than the minimum standard deviation unhedged portfolio. The mean annual rates of dollar excess return for the unhedged country portfolios are determined approximately by the sum of the average local return for the period and average rate of foreign exchange appreciation less the risk-free rate of interest. The dollar’s appreciation depressed unhedged relative to hedged dollar excess returns. As discussed above, the hedged dollar return is approximately the local return plus the forward premium, implying, by covered interest parity, that the hedged dollar excess return is approximately the local excess return—for example, rl + (rUS – rDM) – rUS = rl – rDM. All mean unhedged dollar excess returns are less than the corresponding mean hedged dollar excess returns. (The same is true of Japan, whose currency appreciated against the dollar during this period, because the Japanese risk-free rate was much less than the U.S. risk-free rate.) Chart 3 for 1986 to 1996 presents an entirely different picture of the currency hedging argument. The unhedged efficient frontier dominates the hedged frontier. The case for currency hedging of internationally diversified equity portfolios has not held up because of the instability of the covariance structure, that is, the variability through time of standard deviations and correlation coefficients of excess returns. Most striking in Panel B of Table 1 is the standard deviations of hedged dollar excess returns across countries. Only Canada has a lower standard deviation of excess return compared with the United States, and consequently the hedged portfolio frontier was generated mainly by positions in the Canadian and U.S. portfolios. (In the 1980–85 subperiod, only two countries, France and Canada, have substantially higher volatility than the United States.) At the same time, the United States has the highest mean hedged dollar excess return during 1986–96, making it the endpoint of the hedged portfolio frontier. Another related point to note in Panel B for the 1986–96 subperiod is that the correlation coefficients of the unhedged dollar excess returns and foreign exchange returns show a reversal of signs for all coefficients except Canada’s compared with the corresponding values in Panel A for 1980–85. The negative correlation and relative increase in foreign market volatility translate into unhedged dollar excess return standard deviations and hedged dollar excess return standard deviations that are much closer in size relative to the values in Panel A. The combined effects of the
Federal Reserve Bank of Atlanta E C O N O M I C R E V I E W Third Quarter 1997
apparent changes in the covariance structure between these two periods account for the reversed positions of the unhedged and hedged efficient portfolio frontiers in Charts 2 and 3. During the 1986–96 subperiod, foreign currencies generally appreciated against the dollar. Unhedged foreign portfolio investments did well ex post because investment proceeds converted into more and more dollars over time. By limiting the dollar excess return to the local excess return, hedging stripped out the positive foreign exchange return while largely exposing the investor to higher local excess return volatility. Charts 4 and 5 display the subperiod efficient frontiers for 1986–90 and 1991–96, respectively. Qualitatively, the results are similar for the combined period. The same is true of efficient portfolios for either 1986–96 or 1986–90 that exclude the quarter containing the 1987 crash (these graphs are not reported). The large portfolio weight on Canada, with its –3.9 percent hedged dollar excess return, pushes the minimum variance hedged portfolio’s standard deviation close to –4 percent in Chart 4 for 1986–90. (Of course, if a negative excess return were expected by investors ex ante, no one would hold the portfolio.) Corresponding to Charts 4 and 5, Panels C and D, respectively, of Table 1 split the 1986–96 period into subperiods as a check on the stability of the portfolio excess returns, standard deviations, and correlations. The 1986–90 subperiod includes the crash of 1987, which was a global phenomenon. The greatest negative equity returns occur in each country in the fourth quarter of 1987. As documented in Panel C, the United States actually had the second least volatile equity market during this subperiod. This subperiod was also the time of the most rapid depreciation of the dollar against the currencies of the six countries, as shown in Panel C. In Panel D for 1991–96, equity market volatility subsided but foreign exchange market volatility increased compared with the earlier subperiod. The United States had the least volatile equity market. The correlation of local excess returns and foreign exchange returns is generally negative across these subperiods. Although there is some variation in the correlation coefficients in these subperiods, the correlation structure is distinctly different from what it was during the 1980–85 period with the exception of Canada, which has a relatively large positive correlation in each period. Bonds. The bond portfolio results differ markedly from the equity portfolio results. Although the Salomon Brothers bond indexes are only available as of 1985, the results here are consistent with those from other stud-
ies that relied on different indexes from earlier periods. The full period ran from 1986 to 1996 to match the same period used for equities. The standard deviations of the hedged dollar excess returns in Panel A of Table 2 for the 1986–96 period are much smaller than those for the equity index dollar excess returns, whether hedged or unhedged, or those for foreign exchange returns. The correlation coefficients for foreign exchange returns and local excess returns are positive for five of six countries and all except Japan’s are small in magnitude. A comparison of the hedged dollar excess returns with the perfect foresight hedge dollar excess returns reveals that quarterly hedging closely matches the perfect foresight case, especially for the standard deviation of Putting the practice of curexcess return. rency hedging on a firmer The standard deviations of unhedged dolfoundation requires better lar excess returns are models and techniques for always substantially predicting the correlation larger than those for hedged dollar excess structure. returns. Exposure to foreign exchange rate fluctuations contributes disproportionately to the risk of holding foreign bonds. The average reduction across countries in the standard deviation of hedged dollar excess returns relative to the unhedged excess returns standard deviation is 55.6 percent. This decline is about the same as or somewhat greater than the magnitudes for similar measures reported in Perold and Schulman (1988), Thomas (1989), and Kaplanis and Schaefer (1991) for the years from 1975 to 1988 or subperiods within that span of years. Panels B and C show that the lower variability of hedged excess returns also occurs for the 1986–90 and 1991–96 subperiods. The efficient bond frontiers generated by the excess returns for hedged and unhedged bond positions are shown in Charts 6–8. The full-period results appear in Chart 6. The hedged portfolio frontier lies to the southwest of the unhedged portfolio frontier and intersects the unhedged portfolio frontier just above the point for the U.S. bond portfolio, which is the minimum variance portfolio for the unhedged portfolio frontier. Unitary hedging of foreign exchange exposures has a pronounced impact on the standard deviation of dollar excess return. The configuration of these
19. The contribution of these elements of the unhedged efficient portfolio variance is apparent from equation (2).
Federal Reserve Bank of Atlanta E C O N O M I C R E V I E W Third Quarter 1997
51
52
TA B L E 2 B o n d I n d e x P o r t f o l i o s
Federal Reserve Bank of Atlanta E C O N O M I C R E V I E W Third Quarter 1997
Panel A: 1986–96 Germany
U.K.
Japan
France
Canada
Switzerland
U.S.
Unhedged Bond Index Portfolio Dollar Excess Returns Mean excess return Standard deviation
5.78
6.46
5.95
7.85
4.92
3.65
2.78
13.38
15.16
16.27
12.31
8.35
14.57
5.34
Hedged Bond Index Portfolio Dollar Excess Returns Mean excess return
1.61
1.66
3.05
2.05
2.76
0.68
—
Standard deviation
3.72
7.84
5.97
5.37
6.46
4.27
—
–72.2
–48.3
–63.3
–56.4
–22.6
–70.7
—
Percent change in standard deviation of hedged returns to standard deviation of unhedged returns
Perfect Foresight Hedge Dollar Excess Returns Mean excess return
1.51
1.37
2.73
1.96
2.63
0.69
—
Standard deviation
3.69
7.70
5.78
5.25
6.46
4.33
—
2.07
–2.35
–1.98
0.95
—
Forward Premium Mean
0.04
–3.26
Standard deviation
1.58
1.08
1.10
1.43
0.74
1.45
—
Correlation between local excess return and forward premium
0.01
–0.03
–0.08
–0.10
0.09
0.02
—
0.18
3.93
—
Foreign Exchange Returns Mean return Standard deviation Correlation between local excess return and foreign exchange return
4.21
1.54
4.97
3.45
12.83
11.92
13.19
11.82
4.26
14.43
—
0.02
0.14
0.29
–0.12
0.17
–0.14
—
TA B L E 2 B o n d I n d e x P o r t f o l i o s (cont.) Panel B: 1986–90 Germany
U.K.
Japan
France
Canada
Switzerland
U.S.
Unhedged Bond Index Portfolio Dollar Excess Returns Mean excess return Standard deviation
7.24
8.48
5.23
10.09
5.86
4.92
2.03
13.70
17.76
19.19
13.01
8.19
15.03
5.72
Hedged Bond Index Portfolio Dollar Excess Returns Mean excess return
–0.33
–1.15
0.03
0.56
–0.26
–2.11
—
Standard deviation
3.79
9.11
7.29
6.20
6.47
3.57
—
–72.3
–48.7
–62.0
–52.4
–20.9
–76.2
—
Percent change in standard deviation of hedged returns to standard deviation of unhedged returns Federal Reserve Bank of Atlanta E C O N O M I C R E V I E W Third Quarter 1997
Perfect Foresight Hedge Dollar Excess Returns Mean excess return
–0.58
–1.85
–0.55
0.24
–0.46
–2.32
—
Standard deviation
3.69
8.75
7.02
5.91
6.40
3.49
—
Forward Premium Mean
2.24
–3.85
2.55
–1.60
–2.40
2.52
—
Standard deviation
0.72
0.85
0.73
0.92
0.65
0.96
—
Correlation between local excess return and forward premium
0.33
–0.03
–0.16
–0.34
0.04
0.33
—
3.72
9.55
—
Foreign Exchange Returns Mean return Standard deviation Correlation between local excess return and foreign exchange return
9.81
5.77
7.75
7.93
11.82
11.79
14.33
10.71
3.66
13.43
—
0.33
0.40
0.48
0.06
0.26
0.26
—
53
(Continued on page 54)
54
TA B L E 2 B o n d I n d e x P o r t f o l i o s (cont.)
Federal Reserve Bank of Atlanta E C O N O M I C R E V I E W Third Quarter 1997
Panel C: 1991–96 Germany
U.K.
Japan
France
Canada
Switzerland
U.S.
Unhedged Bond Index Portfolio Dollar Excess Returns Mean excess return Standard deviation
4.56
4.77
6.55
5.98
4.14
2.59
3.40
13.37
12.94
13.80
11.90
8.65
14.48
5.11
Hedged Bond Index Portfolio Dollar Excess Returns Mean excess return
3.22
3.99
5.57
3.30
5.28
3.00
—
Standard deviation
3.53
6.58
4.37
4.61
6.32
4.52
—
–73.6
–49.1
–68.3
–61.3
–27.0
–68.8
—
Percent change in standard deviation of hedged returns to standard deviation of unhedged returns
Perfect Foresight Hedge Dollar Excess Returns Mean excess return
3.24
4.05
5.46
3.40
5.21
3.19
—
Standard deviation
3.53
6.59
4.19
4.63
6.35
4.62
—
1.68
–2.97
–1.64
–0.35
—
Forward Premium Mean
–1.79
–2.77
Standard deviation
1.52
1.20
1.32
1.71
0.78
1.48
—
Correlation between local excess return and forward premium
0.19
–0.11
0.06
0.07
0.03
0.15
—
–2.78
–0.76
—
Foreign Exchange Returns Mean return
–0.45
–1.98
2.66
–0.29
Standard deviation
13.42
11.99
12.35
12.59
4.23
15.09
—
Correlation between local excess return and foreign exchange return
–0.13
–0.07
0.07
–0.26
0.30
–0.30
—
CHART 6 International Bond Portfolios, 1986–96 Efficient Frontiers 8
Excess Return
7 6 Unhedged 5 4 3 2 Hedged
U.S.
1 0 3
5
7 9 Standard Deviation
11
13
Optimal Por tfolio Weights, No Currency Hedging 1.0
We i g h t
0.8
0.6
U.S.
France
Canada
0.4
0.2
0 5.3
6.1
8.1
12.1
Standard Deviation
Optimal Por tfolio Weights, Currency Hedging 1.0
0.8
U.S. Switzerland
France
We i g h t
0.6
0.4 Japan
Germany 0.2
0 3.7
3.8
4.5
5.5
Standard Deviation
Note: Standard deviations on portfolio weight charts are not measured in equal intervals.
Federal Reserve Bank of Atlanta E C O N O M I C R E V I E W Third Quarter 1997
55
CHART 7 International Bond Portfolios, 1986–90 Efficient Frontiers 10 Hedged
U.S.
Unhedged
Excess Return
8 6 4 2 0 –2 3
5
7
11
9
13
Standard Deviation
Optimal Por tfolio Weights, No Currency Hedging 1.0 U.S.
We i g h t
0.8
0.6 Canada 0.4 Switzerland 0.2 France 0 5.7
6.2
8.5
12.7
Standard Deviation
Optimal Por tfolio Weights, Currency Hedging 1.0 U.S. 0.8
We i g h t
Switzerland 0.6 France 0.4 Germany 0.2
0 3.5
4.6
3.7 Standard Deviation
Note: Standard deviations on portfolio weight charts are not measured in equal intervals.
56
Federal Reserve Bank of Atlanta E C O N O M I C R E V I E W Third Quarter 1997
5.6
CHART 8 International Bond Portfolios, 1991–96 Efficient Frontiers
Excess Return
7
6 Unhedged
Hedged
5
U.S. 4
3 2
4
6
8
10
12
14
Standard Deviation
Optimal Por tfolio Weights, No Currency Hedging 1.0
0.8
We i g h t
U.S.
Canada
France
0.6
0.4
Japan 0.2
0 5.1
6.1
13.0
8.0 Standard Deviation
Optimal Por tfolio Weights, Currency Hedging 1.0
U.S.
Switzerland
Canada
We i g h t
0.8
0.6
0.4 Japan
Germany 0.2
0 3.4
3.5
3.9
4.4
Standard Deviation
Federal Reserve Bank of Atlanta E C O N O M I C R E V I E W Third Quarter 1997
57
frontiers implies that the decision to hedge depends on an investor’s preference for risk and return; high returns are attainable only through unhedged positions and conversely low-risk returns only through hedged positions. The comparatively more volatile 1986–90 subperiod predominates in the full sample as the efficient frontiers and the optimal weights that compose them are similar. As is evident from Chart 7 and Table 2, Panel B, Switzerland’s heavy weight in the minimum variance hedged portfolio is mainly responsible for the negative excess return. In contrast, for the 1991–96 period in Chart 8, the hedged efficient frontier dominates the unhedged, except for the high levels of excess return above about 5.6 percent. In all three cases, the U.S. bond portfolio is, or is very nearly, the minimum variance unhedged efficient portfolio, which reflects the high volatility of unhedged foreign bond portfolios.20
Conclusion his analysis of efficient portfolios of stocks and bonds only partially confirms the claims of the proponents of currency hedging. Simple unitary hedging consistently yields a low standard deviation of excess return on efficient, internationally diversified bond portfolios. This finding agrees with those of other studies of internationally diversified bond portfolios. Whether this result is optimal depends on investor preferences. For hedged and unhedged portfolios from 1986
T
to 1996, the efficient frontiers corresponding to hedged and unhedged positions partition the excess return and standard deviation outcomes, with low excess return, low standard deviation results for hedged portfolios and high excess return, high standard deviation results for unhedged portfolios. Internationally diversified equity portfolios do not show the same gains or consistency of results. The risk reduction achieved through currency hedging found in several earlier studies is confirmed for the 1980–85 subperiod. The efficient frontier for hedged portfolios lies far to the northwest of the frontier for unhedged portfolios. However, this hedged portfolio performance is reversed in the 1986–96 period. Another way to state this finding is that the covariance structure of international equity excess returns was unstable—it was subject to a large shift that drastically altered hedging outcomes. Earlier articles on currency hedging, and especially the unitary hedging prescription, were predicated on an implied confidence in the stability of the covariance structure of security and foreign exchange returns. Putting the practice of currency hedging on a firmer foundation requires better models and techniques for predicting the correlation structure (see especially King, Sentana, and Wadhwani 1994 and Solnik, Boucrelle, and Le Fur 1996). Developing these tools is clearly a challenge that calls for continuing research.
20. The low standard deviations of hedged efficient bond portfolios relative to the standard deviation of the U.S. bond portfolio was confirmed by an alternative procedure. As discussed in note 9, the optimal portfolio weights and the efficient frontier itself depend on the ex post security return. Instead of computing weights by optimization, weights were randomly drawn from a uniform distribution and their sum normalized to one. Hedged diversified portfolios were then formed using these weights. Of 10,000 such randomly weighted hedged portfolios, fewer than 2 percent had standard deviation greater than that of the U.S. portfolio in the 1986–96 period. A similar procedure confirmed the results for stock portfolios shown in Charts 2 and 3. Fewer than 1 percent of randomly weighted hedged stock portfolios had standard deviation greater than that of the U.S. portfolio in 1980–85. In contrast, more than 99 percent of randomly weighted hedged stock portfolios in 1986–96 had standard deviation greater than the U.S. portfolio’s. The remaining fraction had large weights on the U.S. and Canadian stock portfolios and very small weights on the other countries’ portfolios, consistent with the third panel of Chart 3.
58
Federal Reserve Bank of Atlanta E C O N O M I C R E V I E W Third Quarter 1997
REFERENCES ADLER, MICHAEL, AND DAVID SIMON. 1986. “Exchange Risk Surprises in International Portfolios.” Journal of Portfolio Management 12 (Winter): 44–53.
KAPLANIS, EVI, AND STEPHEN M. SCHAEFER. 1991. “Exchange Risk and International Diversification in Bond and Equity Portfolios.” Journal of Economics and Business 43:287–308.
ANDERSON, RONALD, AND J.P. DANTHINE. 1981. Journal of Political Economy 89 (December): 1182–96.
KING, MERVYN, ENRIQUE SENTANA, AND SUSHIL WADHWANI. 1994. “Volatility and Links between National Stock Markets.” Econometrica 62 (July): 901–33.
CHOW, EDWARD H., WAYNE Y. LEE, AND MICHAEL E. SOLT. 1997. “The Exchange-Rate Risk Exposure of Asset Returns.” Journal of Business 70:105–23.
LEVICH, RICHARD M., AND LEE R. THOMAS III. 1993. “Internationally Diversified Bond Portfolios: The Merits of Active Currency Management.” NBER Working Paper No. 4340, April.
CULP, CHRISTOPHER L., AND MERTON H. MILLER. 1995. “Metallgesellschaft and the Economics of Synthetic Storage.” Journal of Applied Corporate Finance 7 (Winter): 62-76.
MARKOWITZ, HARRY. 1952. “Portfolio Selection.” Journal of Finance 7 (March): 77–91.
DUFFIE, DARRELL. 1989. Future Markets. Englewood Cliffs, N.J.: Prentice Hall. DUMAS, BERNARD. 1996. “Partial Equilibrium versus General Equilibrium Models of the International Capital Market.” In The Handbook of International Macroeconomics, edited by Frederick Van der Ploeg. Cambridge, Mass.: Blackwell. EAKER, MARK R., AND DWIGHT M. GRANT. 1991. “Currency Risk Management in International Fixed-Income Portfolios.” Journal of Fixed Income (December): 31-37. EUN, CHEOL S., AND BRUCE G. RESNICK. 1988. “Exchange Rate Uncertainty, Forward Contracts, and International Portfolio Selection.” Journal of Finance 43 (March): 197–215. ———. 1994. “International Diversification of Investment Portfolios: U.S. and Japanese Perspectives.” Management Science 40 (January): 140–61. GLEN, JACK, AND PHILIPPE JORION. 1993. “Currency Hedging for International Portfolios.” Journal of Finance 48 (December): 1865–86. HODRICK, ROBERT J. 1987. The Empirical Evidence on the Efficiency of Forward and Futures Foreign Exchange Markets. Chur, Switz.: Harwood Academic Publishers.
MORGAN STANLEY CAPITAL INTERNATIONAL. 1995. Index Data Dictionary. New York: DRI/McGraw-Hill. PEROLD, ANDRÉ F., AND EVAN C. SCHULMAN. 1988. “The Free Lunch in Currency Hedging: Implications for Investment Policy and Performance Standards.” Financial Analysts Journal (May/June): 45–50. REINER, ERIC. 1992. “Quanto Mechanics.” Risk 5 (March): 59–62. RUBINSTEIN, MARK. 1991. “Two into One.” Risk 49 (May): 49. SOLNIK, BRUNO, CYRIL BOUCRELLE, AND YANN LE FUR. 1996. “International Market Correlation and Volatility.” Financial Analysts Journal 52 (September/October): 17–34. THOMAS, LEE R. 1988. “Technical Notes: Currency Risks in International Equity Portfolios.” Financial Analysts Journal (March/April): 68–71. ———. 1989. “The Performance of Currency-Hedged Foreign Bonds.” Financial Analysts Journal (May/June): 25–31.
Federal Reserve Bank of Atlanta E C O N O M I C R E V I E W Third Quarter 1997
59