INSTITUTE OF DEVELOPING ECONOMIES IDE Discussion Papers are preliminary materials circulated to stimulate discussions and critical comments
IDE DISCUSSION PAPER No. 149
Foreign Direct Investment Relations between Myanmar and ASEAN Thandar Khine* April 2008 Abstract Myanmar highly appreciates foreign direct investment (FDI) as a key solution reducing the development gap with leading ASEAN countries. Accordingly, it is welcomed by the government. Myanmar’s Foreign Investment Law was enacted in 1988 soon after the adoption of a market-oriented economic system to boost the flow of FDI into the country. Foreign investors positively responded to these measures in the early years and FDI inflow into Myanmar gradually increased during the period from 1989 to 1996. However, after 1997, FDI inflow was dramatically reduced and markedly declined until 2004. In 2005, FDI inflow increased at an unprecedented rate and reached the highest level in the country’s history. However, this growth was not sustainable in the subsequent years, as it declined again and turned stagnant at
* Officer, Ministry of National Planning and Economic Development, Myanmar, and former Research Associate of IDE-JETRO for ERIA Support Activities.
the previous level. In terms of source regions, ASEAN is a major investor in Myanmar, which investment is significantly exceeds the combined investment of other regions of the world. Among top ten countries, Thailand’s investment alone is significantly more than combined total investments of the other nine countries. Next to Thailand in terms of investments in Myanmar are Singapore and Malaysia among ASEAN, at second and third places, respectively. The combined total FDI inflows into the power and oil and gas sector represent about 65 percent of the total investment. There are many opportunities for foreign investment in other sectors, which are not, yet exploited. ASEAN countries will certainly be source countries of Myanmar FDI in the future, and Myanmar should expand to other Asian countries like Japan, India, China, Korea, and Hong Kong where its FDI portfolio is concerned. To effectively attract FDI into the country, Myanmar needs to minimize the effect of policy while opening and encouraging other potential sectors of FDI to foreign investors in ASEAN and Asian countries.
Keywords: foreign direct investment (FDI), Myanmar, ASEAN, Myanmar
Investment Commission (MIC) JEL classification: F21, L10, O11
The Institute of Developing Economies (IDE) is a semigovernmental, nonpartisan, nonprofit research institute, founded in 1958. The Institute merged with the Japan External Trade Organization (JETRO) on July 1, 1998. The Institute conducts basic and comprehensive studies on economic and related affairs in all developing countries and regions, including Asia, the Middle East, Africa, Latin America, Oceania, and Eastern Europe.
The views expressed in this publication are those of the author(s).
Publication does
not imply endorsement by the Institute of Developing Economies of any of the views expressed within.
INSTITUTE OF DEVELOPING ECONOMIES (IDE), JETRO 3-2-2, WAKABA, MIHAMA-KU, CHIBA-SHI CHIBA 261-8545, JAPAN
©2008 by Institute of Developing Economies, JETRO No part of this publication may be reproduced without the prior permission of the IDE-JETRO.
TABLE OF CONTENTS Ⅰ. Introduction
-------------------------------------------------------------------------------------- --1
Ⅱ. FDI in Developing Countries
-------------------------------------------------------------------5
Ⅲ. Barriers of FDI in Developing Countries
-------------------------------------------------13
Ⅳ. Foreign Direct Investment in Myanmar
--------------------------------------------------21
Ⅴ. FDI Relations between Myanmar and ASEAN Ⅵ. Analysis of the Attractiveness of Myanmar FDI
-----------------------------------------39 ---------------------------------------44
Ⅶ. Opportunities for Diversifying FDI: Analysis by Sector
-----------------------------53
Ⅷ. Conclusion
-----------------------------------------------------------------------------------------62
Ⅸ. References
-------------------------------------------------------------------------------------------63
Appendices
---------------------------------------------------------------------------------------------67
The Institute of Developing Economies (IDE) is a semigovernmental, nonpartisan, nonprofit research institute, founded in 1958. The Institute merged with the Japan External Trade Organization (JETRO) on July 1, 1998. The Institute conducts basic and comprehensive studies on economic and related affairs in all developing countries and regions, including Asia, the Middle East, Africa, Latin America, Oceania, and Eastern Europe.
The views expressed in this publication are those of the author(s).
Publication does
not imply endorsement by the Institute of Developing Economies of any of the views expressed within.
INSTITUTE OF DEVELOPING ECONOMIES (IDE), JETRO 3-2-2, WAKABA, MIHAMA-KU, CHIBA-SHI CHIBA 261-8545, JAPAN
©2008 by Institute of Developing Economies, JETRO
Ⅰ. INTRODUCTION FDI is very important for the development of a country, especially for developing economies. The experience of newly industrialized countries (NICs) shows that FDI has played an important role in their economic development. In the age of globalization with cross-border flow of capital among nations, FDI becomes a key solution to reducing development gaps among nations. The rapid growth of multinational corporations (MNCs) has become the major driver for the process of FDI because they are looking everywhere in the globe as investment centre. Together with improving transportation and communication technologies and rapid liberalization in the countries that previously isolated themselves from the rest of world, the opportunities for marketing and locating production facilities are vast. Asia is now one of the major investment centers in the world and a prime targets for MNCs due to their advantages in terms of lower labor cost and rich natural resources. On the other hand, increasing acknowledgment of the positive impact of FDI by the developing countries in Asia leads to vigorous competition among themselves to secure FDIs in their countries. Myanmar, as one of the developing nations in the Southeast Asia region, recognizes the importance of FDIs in its economic development. To narrow the development gap and to finance the projects that are important for further development of the nation, inflows of FDI into the country are urgently needed. FDI inflows can effectively integrate Myanmar economy with those of developed nations and extend the benefits of technology transfer and upgrading human resources. FDI also creates business opportunities for local SMEs by linking businesses with MNCs. These all are very desirable for Myanmar to develop its economy. However, it should be noted that these benefits entail costs. The benefits will outweigh the costs only when the host country can attract the right mix of FDI for the country. As a developing country with poor infrastructure, new open economy with limited diversified economic structures, and many other limitations which remain unsolved, the FDI opportunities are limited for Myanmar. However, Myanmar needs to attract FDIs to exploit its resources and take advantage of its location. It needs to offer appropriate incentives and adopt appropriate promotional strategies to increase FDI inflows into the country. By doing so, it needs to understand the benefits and costs of FDI, and how a developing country can use FDIs to fuel economic growth. It also needs to know which countries have the best potential to be major investors in Myanmar and what kinds of investment can provide long-term or sustainable benefits for the country. How should they be attracted? This is an important question for Myanmar if it is to effectively use FDIs as a tool for development. Accordingly, this study is conducted with
the following objectives. a. To examine the current situation of FDI in Myanmar and its future trend b. To examine country specific advantages of Myanmar to attract FDI from aboard c. To analysis FDI relationship with Myanmar and ASEAN countries d. To suggest the opportunities to attract FDI into Myanmar in future LITERATURE REVIEW ON FDI THEORIES The explanation on why firms commit to attract FDI and international production stem from the theory of industrial organization and theory of international trade. One of the industrial organization theories relevant to FDI was put forth by Hymer (1960). He distinguished between portfolio investment and foreign direct investment. He argued that the decision to engage in FDI was determined by firm-specific advantages. Vernon (1966) explained the pattern of FDI was based on international product life cycle. Though most products are initially developed by industrially advanced countries, these are shifted to developing countries when the products and production become standardized. This is owing to differences in the cost of production. These products are then exported back to the country that originally developed them. The internalization theory of MNCs and the eclectic paradigm are well known theories that focus on why firms opt for FDIs. Both of these theories attempt to explain why a firm chooses FDI rather than other alternative modes of entry such as exporting and licensing arrangements. Internalization theory explains the emergence of MNCs as a result of market failures, which in turn give rise to the firm’s ownership- specific advantages. Because contracts between firm and external agents cannot be completely written and enforced, the firm chooses FDI as a means by which they can internalize their advantages to serve their overseas markets. The basic idea underlying internalization is that incomplete contracts can give rise to opportunistic behaviors. Thus, a firm prefers to replace external contracts by direct ownership and internal hierarchies. In other words, the firm “chooses a hierarchical structure, characterized by FDI, as compared to a market structure, characterized by contracts between independent entities.” 1 It maintains that a company engages in FDI once the transaction costs associated with external trading of intermediate products exceed the cost of internalization. A firm prefers the market
1
George Norman (2001) Internalization revisited, Department of Economic, Tufts University, Medford,
USA
structure when other parties in the contract have limited opportunities for changing product technology (firm’s specific advantage) or if there are a few spillover effects from the foreign to the home market. “Internalization is preferred when the advantages of the firm are knowledge-based and when reputational effects are strong.” 2 Dunning’s eclectic paradigm integrates many theories into a general paradigm. According to this paradigm, three conditions need to be met before an FDI can eve expected: 1) the firm has some specific ownership advantage; 2) there has to be a location advantage in recipient country; and 3) there has to be some internalization advantage. “The ownership advantage refers to the ‘why’ of MNC activity, the location advantage refers to the ‘where’ of production and internalization advantage refers to the ‘how’ of involvement.” 3 The ownership and location advantages are necessary but insufficient condition for FDIs to occur. They should be complemented by internalization advantage, which helps to take advantage of such conditions. Dunning (1988) defined three main types of MNC activity that engages in FDI, namely, resource seeking, market seeking, and efficiency seeking. “As for market seeking, the ownership advantage that can be exploited in the host country to get access to
some
specific
market or resource
defines
the
investment location. The
resource-seeking motivation of FDI considers market size and other characteristics at home and in the host country to get access to production resources. The efficiency-seeking FDI looks at economies of scale and scope, risk reduction through product diversification and taxation.” 4 In 1994, Dunning added another motivation of FDI – strategic asset seeking. It is described as a motivation for sequential FDI. “The aim of strategic asset seeking investment is to acquire resources that are important to enhance the capabilities and advantages of an investor. It is a complex integration of strategies that seek markets where the corporation’s general objectives can be best performed.” 5 A school of thought on FDI, the “Uppsala school,” explains the pattern FDIs follow. It focuses on the gradual increase in international involvement by enterprises. Better the firm’s knowledge on the country lesser the feeling of market insecurity due to increase understanding business opportunities in that country. Previous experience on
2
I bid p. 1
3
Line Tondel (2001) Foreign direct investment during transition, Determinants and patterns in Central and Eastern
Eruope and the former Soviet Union, 4
Uiboupin and Sorg, The entry of foreign banks into emerging market: an application of the eclectic theory,
Universifty of Tartu 5
I bid p. 3
doing business in a foreign country brings country-specific knowledge for the firm. This theory proposes that the pattern of FDI by a firm increases gradually from one of lower involvement to higher involvement. Companies primarily engage in business in countries that are close to the home country geographically, culturally, politically, and linguistically. After accumulating experience and knowledge on these countries, the firm gradually extends its production bases to other countries. Another group of literatures focuses on the determinants (preconditions) of FDI inflow into a country. Most of these studies have identified a number of variables such as labor cost, market size, political stability, market size, quality of infrastructure and economic openness as key factors that drive the flow of FDI into a particular country. The study of Quazi (2007) specifically found that economic freedom (used by the economic freedom index, published by The Heritage Foundation/Wall Street Journal) is a significant and robust determinant of FDI inflow into a country.
Ⅱ. FDI IN DEVELOPING COUNTRIES The role of FDI in the economic development of developing countries Most of FDI advocates agree that FDI provides valuable benefits for a country. However, this is still debatable. “The proponents of FDI have frequently cited that FDI would bring prosperity in the recipient countries through technology transfer, higher export, enhanced job opportunities and improved government revenues. On the other hand, opponents have argued that FDI would increase dependency and vulnerability of the recipient countries.” 6 However, in the 1990s, FDI was viewed as stimulator of the host country’s economic development. From the experiences of leading ASEAN countries, a general conclusion can be drawn, that is, FDI is a catalyst of development finance, promoter of export, and bridges technology gap between developed and developing countries, notwithstanding the undesirable side effects that it is purported to
bring.
Their experiences show the impact of FDI on economic development in four areas.
FDI as a form of development finance: First of all, FDI makes a potential contribution to development of the recipient countries by channeling resources from the countries where they are abundant. Thus, inflows of capital allow the host countries to use funds in its development projects that otherwise it is not capable of spending. FDI ensures inflow of capitals, which are relatively longer-term in nature. Therefore, FDI inflows can accumulate as stock, which can hold up much better than other forms of capital inflows such as bank lending or foreign aid.
FDI as a promoter of export: The experiences of the leading ASEAN countries also show that FDI plays a leading role in their export-led growth strategy. The correlation between FDI inflow and export growth is strong. “The countries in ASEAN would probably not have experienced the rapid acceleration of exports in the past decade without the presence of foreign investors.” 7 These countries, especially Thailand and Malaysia, had successfully shifted from the exporters of primary products to exporters of manufacturing products during last three decades. In this place, foreign investors have played a key role because the manufacturing sectors in these countries are largely dominated by foreign multinational enterprises (MNEs). Through FDI, these countries can transform their economic structure quickly toward export-oriented manufacturing-based economies.
FDI as catalyst in the process of technology transfer: Technology transfer from
6
Ishak Yussof and Rahmah Ismail, Human resource competitiveness and inflow of FDI to the ASEAN
region, Asia-Pacific Development Journal, vol.9, No. 1, June 2002 7
Stephen Thomesen, Southeast Asia: The role of foreign direct investment policies in development,
working papers on International investment, 1999 p. 27
investing companies to local ones may be the most desirable benefit for the host country. “Exports are important for rapid economic growth over long periods, but technology transfers can do much more to promote sustainable development by enhancing indigenous capabilities.” 8 But the degree of technology transfer between MNEs and indigenous SMEs is still not much as expected, as shown in the experience of Thailand. The amount of technology transfer mainly depends on the educational level of the workers, the number of trainings given to local staff, and quality of relations between foreign companies and local suppliers.
FDI as a creator of job opportunities for local employees and businesses: This is the most prevalent benefit of FDI, which can be seen in the short term. Foreign investors can employ expatriate managers only for the core areas and top-level management positions. The remaining positions in their operation have to be filled by local employees. Local SMEs also expect subcontracting services to foreign investors because it is very difficult for MNEs to undertake their whole value chain process on their own. FDI also enriches the local community where the firm is located. Attracting of FDI into developing countries A growing number of developing countries that have come to recognize the role of FDI in the economy of their countries have adopted various policies and begun to offer attractive incentives to foreign investors. “They perceive FDI can assist in the development of local economies by increasing financial resources for development, by boosting export, by generating employments and skill level of local employees and by enhancing technological capabilities.” 9 They generally undertake various forms of investment promotion activities and offer fiscal and financial incentives to attract FDI into country. Developing countries actively undertake investment promotion activities as an attempt to create business-friendly environment for foreign investors. “Investment promotion activities mean the activities that disseminate information about, or attempt to create an image of the investment site and provide investment services for the prospective investors.” 10 Investment promotion activities can be further divided into a) image-building activities, b) investment-generating activities, c) investment-services activities, and d) those that raise the realization ratio, which is the percentage of the FDI approvals translated into actual flows.
8
Ibid p. 28
9
Extracted from Ramkishen S Rajan, Measures to Attract FDI, Investment Promotion, Incentives and
Policy Intervention, Economic and Political Weekly Jan 3, 2004 10
I .bid p.12
Many developing countries have established one-stop investment promotion agency (IPA) to facilitate in investment promoting activities. An IPA is supposed to assist foreign investors in the entry and operation. A one-stop IPA can facilitate FDI by lowering administrative delays and undesirable costs by combining and coordinating of many diverse tasks done by several departments that involves in the application of entry. However, it may be an additional administrative burden if it is not properly managed. Sanjaya Lall (2000) notes that unless these agencies have the authority needed to negotiate the regulatory system and unless the rules themselves are simplified, there is a very real risk that a one-stop shop becomes one more shop. “Policy advocacy which is defined as steps to improve overall investment climate and identify views of private sector may also be the most effective function. This should be followed by investment facilitation or servicing and image building.” 11 This study also suggests that growth-enhancing policy intervention should not be sectorally biased. Instead, it should be focused on enhancing a country’s general capability by improving the general quality of the country’s labor force and infrastructure, developing local skills and technology and local learning and ensuring a stable and conducive overall macroeconomic and regulatory environment. 12 Countries attempt to attract FDI by offering a number of incentives to foreign investors. These include tax incentives and financial incentive in the forms of direct capital subsidies, subsidized loans, or dedicated infrastructure. Common tax incentives may come in a variety of forms such as reduced corporate income taxes, allowing tax holidays, investment allowances and tax credits and export-processing zones (EPZs). A study by the Organisation for Economic Co-operation and Development (OECD) suggests investors normally use two-stage analysis in making investment decisions. Firstly, they select potential countries for investment based on the country’s economic and political fundamentals. They do not consider investment incentives offered by host country at this stage. At the second stage, investors consider the investment incentives offered to them by each country before deciding where to invest. It means investment incentives offered by recipient countries will not be effective without considering the necessary investment-conductive policies such as favorable macroeconomic policies, infrastructure, supporting facilities, clear and consistency procedures and investment climate. In general, to effectively attract FDI into developing countries, there is no substitute for creating an enabling business environment for investors in which sound
11
I. bid p.13
12
I bid p.13
macroeconomic policies and a favorable investment climate must be in place. In this regard, the steps that need to be taken are fairly valued exchange rate system, prudent fiscal and monetary policy, rules that ensure a fair or level playing field, absence of barriers to the free entry and exit of firms, well-developed infrastructure, relaxed red tape, streamlined procedures to reduce the costs of doing business, strong overall governance (public and corporate), and protected intellectual property rights. Lessons from some developing countries show complexity and uncertainty where the foregoing factors are involved. For example, frequent changes in FDI-related policies effectively deter inflows of FDI into countries. Also incentives offered to foreign investors that do not materialize are disincentives to investors, making it difficult to attract FDI. Then again, FDI incentives do not cure deficiencies in the overall investment climates. The fiscal costs of incentives offered to investors have long- term effects. As such, the costs and benefits of offering these incentives should be carefully studied. Types and modes of FDI inflow to developing countries Foreign direct investment is the acquisition of foreign assets for the purpose of controlling them. It comes when a firm invests directly in a host country, where it produces and/or markets a product. “It should be distinguished from the foreign portfolio investment (FPI), where FDI represents cross-border flow of long-lasting investment in businesses or production facilities for the purpose of controlling them to some extent.” 13 FPI represents passive holdings of securities such as foreign stocks, bonds, or other financial assets, none of which entails active management or control of the securities’ issuer by the investor. The U.S International Investment and Trade in Services Survey Act stipulates that FDI is defined as ownership or control of 10 percent or more of an enterprise voting securities of an incorporated U.S business enterprises, or the equivalent interests in an unincorporated U.S business. It includes not only equity capital but also earnings and investment of earnings. The most common notion about FDI is that is a cross-border investment in which the resident in one country acquires a lasting interest in an enterprise in another country. FDI may be in the form of two directions: inward FDI is where investors from another country have a stake in the assets of business in the host country; outward FDI is sometimes called direct investment abroad in which local capital is invested in foreign resources. FDI may take many forms such as purchase of existing assets in a foreign country, totally new investment in assets, and participation in joint venture with a local
13
Wikipedia: definitions of FDI and FPI
partner whether business or individual or government. Types of FDI can be classified by target or motive. Classified by target 14
Greenfield investment: It means direct investment in new or expansion facilities. “Greenfield investments are the primary target of a host nation’s promotion efforts because they create new production capacity and jobs, transfer technology and know-how and can lead to linkages to the global markets.”15
Mergers and acquisitions: Merger means voluntarily combining two companies which are relatively equal in size to form a single company and acquisition means foreign firms acquire whole or part of existing assets from local firms. This is the primary type of FDI in recent years. “Cross-border mergers occur when the assets and operations of firms from different countries are combined to establish a new legal entity. Cross-border acquisitions occur when the control of assets and operations is transferred from a local to a foreign company, with the local company becoming an affiliate of the foreign company.” 16 “Unlike Greenfield investment, acquisitions provide no long-term benefits to the local economy. This is because the owners of the local firms are paid in stock from the acquiring firm in most case so the money from the sale could not reach the local economy.” 17
Joint venture: It occurs when a foreign investor enters into contract with a local businessman or an association or government to form and operate some businesses in the host country. Most FDI inflows into developing countries are in the form of joint ventures primarily for the purpose of sharing risks and exploiting a partner’s expertise.
Production sharing contract: It is the least common but mostly can be seen natural resources like oil and gas sector are to be extracted. Foreign investors with modern equipment and know-how extract the natural resources of the host country otherwise cannot be exploited by host country alone due to technological and capital constraints. The benefit is shared between foreign investor and host country based on some predetermined rate. Another way of classifying FDI is whether it is horizontal or vertical. A
14
Wikipedia; types of FDI
15
I bid
16
Technically an affiliate company means foreign company control at least 20 percent of assets or voting
rights whereas a subsidiary company mean controlled above 50 percent of assets or voting rights in a local company. But control may occur in other means such as through the agreement of shareholders or through the majority of directors sitting in the board of acquired company. 17
Wikipedia; types of FDI
horizontal FDI is investment in the same industry abroad as a firm operates at home. For example, an automobile acquires another automobile company abroad. Vertical FDI may be backward or forward that occurs along the firm’s supply chain. Backward vertical FDI occurs when a firm acquires a foreign firm that provides inputs for the firm’s domestic production process. Forward vertical FDI occurs a firm acquires a foreign firm that sells the outputs of the firm’s domestic production. Classified by motive FDI can also be categorized based on the motivation of investors who want to make investments abroad 18 .
Resource-seeking: This involves investments utilizing factors of production (e.g., and, labor, and capital) in a host country are considered more efficient than those that are available in the home country. In some cases, these resources may not be available in the home economy at all (e.g., cheap labor and natural resources). The objective of FDI is to acquire inputs/resources of the host country. This is a common form of FDI inflows into developing countries such as those involving garment factories seeking cheap labor in Southeast Asian countries. “The objective of this type of FDI is to exploit a country’s comparative advantage. For instance, countries rich in primary materials, such as oil or minerals, attract foreign investors seeking to develop these resources.” 19
Market-seeking: This involves investments, which aim at either penetrating new markets or maintaining existing ones. FDI of this kind tends to take advantages of the opportunities of growing or emerging new markets. FDI inflow into the U.S. and Europe mostly fall under this classification. It occurs as supplier companies invest in customers’ countries.
Efficiency-seeking: This coves investments which firm’s hope will increase their efficiency by exploiting the benefits of economies of scale and scope, and also those of common ownership. This type of FDI comes after either resource or market-seeking investments have been realized, with the expectation of reducing costs or increasing company revenue. It is mostly found in developed economies, especially those within closely integrated markets (e.g., EU).
Strategic assets-seeking: This type of FDI occurs when companies undertake acquisitions or alliances to promote their long-term strategic objectives. For example, to serve a local market, a multinational may purchase a state-owned enterprise that is
18
I bid
19
Understanding foreign direct investment module 1, Multilateral investment guarantee agency,
Investment promotion toolkit, 2001
being privatized rather than establish a new or Greenfield venture. 20 This may also be a tactical investment to prevent the loss of resources to a competitor. For example, an oil producer may not need the oil at present but attempts to prevent competitors from having it. Bright and dark side of FDI for a developing country Numerous literature points out the benefits and costs of FDI for the host country, especially a developing one. The arguments for the positive impacts of FDI centre around three prevalent benefits that are important to a developing country - inflow of physical capital, technology spillovers, and employment. Inflow of physical capital in the form of FDI could also increase the rate of economic growth particularly for developing one where capital is scare. The leakage of technology spillover from MNEs enables domestic firms to improve their productivity and that allows the host country to enhance its long-term economic development. “The growth enhancing ability of FDI also depends on the chosen mode of FDI. Greenfield FDI” 21 can result in an increase in the host country’s stock of capital whereas the Brownfield FDI (M&A) can only result in positive externalities of technological spillover. The effect of FDI on the host country in the form of employment is particularly true in labor-intensive industries like garment. However, in capital-intensive industries, this effect is minimal. Other benefits of FDI frequently cited in the academic papers are as follows: 1. Revenue effect: FDI widens the local tax base and contributes to government revenues. 2. Positive impact on local investment: FDI inflows tend to lead to improve investment on infrastructure and increased domestic investment as local companies gain access to distribution channels opened by larger foreign companies. 3. Improved labor skills: Foreign firms usually carry out more training than local firms, and they also engage in activities that use relatively high levels of skilled workers. These skills can be transferred to other sectors and activities when employees seek new jobs or establish their own businesses.
20
I bid p. 4
21
Greenfield investment means the MNE constructs new facilities of production, distribution or research
in the host country whereas Brownfield investment means the MNE acquires already existing facilities in the host country.
4. Better working conditions and pay: FDI normally carries better working practices to improve working conditions and environment. 5. Improved export: FDI into developing countries are associated with high levels of exports since most of the foreign investors are export-oriented ones. 6. Improved competitiveness of local firms: The opportunity to sell inputs or supplies to foreign firms encourages local companies to raise their quality levels and delivery reliability. 7. Enhanced backward and forward linkages: Local sourcing and contracts from foreign firms bring considerable economic benefits to a location in terms of job opportunities improved sales and favorable impact on management and organizational methods of local firms. 8. Weakened domestic monopolies at home: FDI can replace inefficient but monopoly firms at home with more efficient foreign firms that can lead to improve consumers’ welfare. However, these benefits do not come alone. The adverse effect of FDI inflows to the host country (i.e., developing one) should not be overlooked. Firstly, larger foreign firms may take dominant market shares, thereby reducing competition. Because of their economic power, they can establish monopoly position in the host country market and exploit resources more cheaply. Secondly, large foreign firms lead to negative effects on local firms and employments because they can crowd out small domestic firms. Thirdly, export and import activities of foreign-owned firms may lead to balance of payment volatility. Fourthly, when profits and capital of MNEs are repatriated, the value of the home currency may decline. But such costs can be corrected through appropriate host country policy measures. According to the OECD report on foreign direct investment for development, the benefits of FDI do not occur automatically. The policies in both host countries and home countries matter. Only enterprises that operate in a generally sound national and international environment can bring the full benefits of FDI on the host economy.
Ⅲ. BARRIERS OF FDI IN DEVELOPING COUNTRIES Despite the arguments for and against the impacts of FDI, most scholars agree that it plays a key role in the economic development of a country. Attracting FDI, however, is not an easy and simple task. A number of barriers hinder the inflow FDI into a particular developing country, especially for a Least Developed Country (LDC). These barriers lead to increased risks and costs to foreign investors that can outweigh the location-specific advantages and resource endowments of LDCs. This can impede FDI inflow into the country. Also, foreign investors want to get superior returns from the investment to compensate greater risks. Political instability is one of the most important barriers to FDI. Apart from this, LDCs pose the following broad and interrelated barriers to foreign investors 22 . 1. Administrative barriers 2. Information asymmetries and imperfections 3. Policies barriers 4. Infrastructure shortcomings 5. Constraints of human, social and institutional capital These barriers can effectively deter FDI from entering, increase costs of doing business, and increase risks and uncertainty. Therefore, it is quite common for foreign investors to carefully investigate the risks of a particular country based on these barriers before making an investment decision. It is paramount for a recipient country to reduce these barriers to attract FDI effectively. Each barrier will be discussed from the point of view of foreign investors. Administrative barriers In some LDCs, the problems start even in the submission of investment proposals at the approval stage. To get an approval, a proposal has to pass various stages of official procedures (which are complicated and subject to frequent change), and require documents and consensuses from various government agencies. This problem is compounded by unclear and overlapping procedures on decision making by the authorities concerned. The procedures involved in the processing an investment proposal for approval takes several weeks or months. These barriers can dissuade foreign investors from making favorable investment decisions. The persistence of administrative barriers together with the absence of sufficient institutional capacity in LDCs results in situations where trivial procedures like moving a file from one department to another and from one table to the next within
22
Discussion of these barriers comes mainly from www.egdi.gov.se/dev-financing/pdf/risk-study-ch3.4
pdf. Experts group of development issues.
the same department becomes major obstacles to progress. These difficulties can be passed through with side payments. Complex procedures and lengthy work process without transparent and standard rules create opportunities for bribes and corruption at the operational levels, where official and unofficial fees are paid to higher levels. Most governments usually try to eliminate these hurdles by creating the so-called one-stop approval shops or one-stop investment promotion agency (IPA). But without clear delegation of authority on IPA, it makes worse the situation due to increase an additional step and overlapping roles. World Bank and International Financial Corporation did a study of administrative barriers and classified them into four main categories: 1. General approvals and licenses required of all firms before operation: These steps include company registration, special registration for foreign investment, application for investment incentives and special concessions given, licenses for business operation from a number of departments and ministries for operations, access to utilities, import and export licenses and foreign exchange transactions, work and residence permits for expatriate staffs and their family members, registration for company and excise taxation and a host of other registrations including patents, trademarks, copyrights, and clearances after the conduct of environmental impact assessment. 2. Pre-operational, sector or industry-specific approvals and licenses: These are different requirements depending on types of industries intend to operate. For example, oil and gas, petroleum, mining, tourism, defense industry, deep-sea fishing and banking and financial services. Each industry is subject to different requirements set by respective ministries and regulatory authorities. 3. Statutory inhibitions and land acquisitions and the provision of utility services for business purposes: In most LDCs, separate licenses have to be obtained by all firms from different levels of government and authorities for access to land, for construction, for the provision of each utility (water, power, gas, waste treatment). 4. Post-operating requirements and regulations: Foreign investors have to follow onerous reporting and clearance requirements for imports and exports, exchange control for money transfer, regular reporting and periodic clearances required from departments of health, fire brigade, social services, labor and environment. Due to these administrative barriers, there is wider gap between projects approved and projects implemented in LDCs (range between 20 percent-40 percent) and increasing the exit rate of FDI that has already entered. When administrative
constraints are considered individually, they do not seem to be significant, but their combined will pose a real challenge to investors. They often mean delays in application procedures and create disturbances in the operations of foreign firms. The persistence of these administrative barriers effectively impedes all types FDI regardless of how they are classified (e.g., resource- or market or efficiency-seeking), because these create barriers that are common to all investors. For LDCs, most of the FDI primarily enter labor-intensive industries like garment and industries that are concerned with exploitation of natural resources like power and oil, and as industries. In the case of garment industry, the core competitive factors are reduction of lead time (the time taken between placement and delivery of order) and reducing transaction costs. In some LDCs, even though they are basically attractive in terms of low labor cost and other infrastructures, delay in administrative procedures solely leads to increase unnecessary costs and time. In such a situation, the investment climate of the country shifts from one of extreme attractiveness to unattractiveness. This is also true for investors in resource exploitation industries and investors in services sectors like Hotel and tourism, banking and communication industries. Information asymmetries and imperfections There is no doubt that any foreign investor wants to get enough information about the country he wants to invest in before making critical investment decisions. This is especially true for market seekers, since they want to get detailed information about market size, growth rates and changing consumer preferences, so on. But, they are also important for resource-seekers because they want to access information on size, quality and exploitability of resources that they are interested in. The greater is the access to information, the lesser are the risk to investors. Increasing amounts of information allow them to access opportunities more efficiently and risks investing in particular developing countries. The models and techniques used to analyze information for better location decision are more sophisticated day by day. Foreign investors usually collect information from private sources as well as public sources concerning the countries they have interest for potentially new investment. The private sources they usually collect information are their established business relationships such as commercial banks, consultancy and service firms, their suppliers and customers, marketing distribution firms and advertising agencies etc. If they want to get special information, they hire survey firms in the target country. Officially published data by the country’s statistical associations are also additional sources of information for foreign investors. Embassies, foreign ministries, investment promotion and aid agencies, export credit agencies and chamber of commerce and
research institutions are other sources. International associations like UNCTAD, UNESCO, UNIDO and UNDP are also reliable source of information to understand general picture of business environment in the host country. However, information asymmetries figure in the FDI decision-making process. There may be some errors and incomplete information obtained from outside agencies and they are mostly out of date. Information from these sources is too general and difficult to suit a specific decisionmaking needs for the foreign investors. Another problem is too much information enters from outside sources. This information overload makes it is difficult to pursue the decision making process. One of the problems frequently encountered by foreign investors is that information obtained does not provide an accurate picture of the business environment in the host country. The changes in investment policies and future trend cannot be easily gleaned from available information. These can lead to a situation where the opportunities given and threats posed by host country are neither known nor adequately appreciated. Wrong interpretations of information may lead to wrong judgments. The unavailability of such information compounds the difficulties for foreign investors in agriculture, manufacturing and hotel and tourism sectors. Investment in agriculture and hotel and truism sectors is long-term in nature that requires a lot of information for investment decisionmaking. For agriculture sector, since investors need information about climate and soil conditions, yield per acre, water accessibility from dams, road networks, local market conditions, export potential and export route for the products, labor availability and conditions, wages level of the areas he/she is interested to invest in. Likewise, potential investors in the hotel and tourism industry need information like number of tourist arrivals, citizenship of tourists, the common routes that they pass through to get into a
particular country, the level of accommodation and
services given by existing hotels, transportation and communication infrastructures and networks in the country. Potential investors in manufacturing sector also want detailed information about the supply and demand conditions, situation of local firms, law and regulations on labor and export/import procedures so on. In fact, all potential investors in any sector and with any motive require more or less information. Therefore, the lack of information and unreliable data makes them disappointed about the country. From the point of view of host countries that attempt to attract FDI, this means that just showing policy changes and providing incentive is no guarantee to secure FDI. The role of investment promotion is to attempt to reduce information asymmetries faced by potential foreign investors in their investment decision process. Inadequate and
unreliable statistics issued by host countries increase complexity for foreign investors to understand real situation in the country. Issuing out-of-date information has the same effect. In this regard, LDCs are particularly weak in establishing adequate databases and disseminating them in a timely fashion to potential investors. Therefore, if a country effectively removes these causes of information asymmetries, collecting and establishing adequate data bases and timely and effectively distribute them to foreign investors the chance to be chosen for FDI will be greatly enhanced. Policy barriers Policy barriers may be the most important concern for foreign investors who want to invest longer term in a particular country. These barriers include 1) fiscal policies, 2) monetary policies, 3) trade policies, 4) exchange rate policy, and 5) debt management policy. Each of these policies will be discussed in below.
Fiscal policies: Foreign investors are primarily interested in the stability of fiscal policies in the host country, the level of tax revenues, the structure of taxes and long-term stability of tax rates applicable to corporate income and capital gains, tax allowances for accelerated depreciation and amortization, excise taxes and taxes on imports, exports and value-added, tax allowance and tax exemption for export income (these all are commonly included in fiscal incentives given to investors by most countries), the size and sustainability of budget deficits since these all may impact on the future operation once investment is made.
Monetary policies: Monetary polices are those of central banks in the host countries. Foreign investors are interested in the stability of domestic interest rate, the level and trend of inflation, the credit policies, selectively directed credit to priority areas, the health and prudential regulations and supervision of the financial system, and the extent of government domestic borrowing.
Trade policies: Foreign firms also concerned about trade policies of host countries. High barriers of import both tariff and non-tariff may be one of the reasons for choosing FDI in these countries. Normally, they want to operate in liberalized trade regimes with fewer restrictions on the procedures of exporting and importing. However, foreign investors may want restricted trade policies in the countries in which they are already operated to reduce the competitions of imported products from aboard. Therefore, MNCs stand on trade liberalization depends on their position whether they are inside or outside of the country.
Exchange rate policies and convertibility: The stability of exchange rate and convertibility, permission to repatriate profits, dividends and capital without any restrictions are among the biggest concerns of investors alongside devaluation trends and upward revaluation of domestic currency. The rapid devaluation of home currency
is alarming for foreign investors. Most MNCs hedge this currency risk by entering forward or future currency contracts. However, the costs of these transactions need to be considered. In most LDCs, most of these mechanisms are unavailable.
Internal and external debt management: Most LDCs are normally moderate to highly indebted. This, too, is a major concern for foreign investors, knowing that the size of public debt in the host country may introduce high potentials for future risks. Deep indebtedness may lead to new borrowings, cutback of government expenditures on infrastructures and social works, limitation for repatriate capital due to fears of inadequacy of foreign exchange, the threat of printing money to finance repayments of domestic borrowing, which in turn leads to inflation and decreasing external value of home currency.
Also causes for concern are when economic gains from FDI are used for
servicing debt burden rather than fueling investment and growth. In short, unsustainable debt burdens increase the risk of future taxation, asset-value reduction risk, currency risk, convertibility, and transfer risk for foreign investors. These policy barriers generally impact foreign investors, regardless of their motivation for investing. The impact is greater on market seekers, since these policy barriers can lead to substantially reduced profit potentials in the host country. Export-oriented investors are very sensitive to government policies toward trade, exchange rate control, and regulations on repatriation profit and capital from the country. They are also interested in how the government manages inflation since it affects the external value of domestic currency. Market seekers who want to focus on the domestic market for their products are also interested in fiscal and monetary policies of the country as well as those meant to protect the local enterprises against undue foreign competition. The existence of these barriers can lead to changes in the modes of entry decision into the country market. For example, a foreign investor may choose to enter a joint-venture contract with government-owned enterprises instead of establishing wholly owned ventures in the country, hoping that his partnering government enterprise may help to reduce some impacts of these policy barriers. Infrastructure barriers Poor infrastructure can effectively deter foreign investors to invest in the developing countries. In general, poor infrastructure leads to increased costs and risks of doing business in developing countries. It can increase the costs incurred by foreign investors because they have to bear the cost of infrastructure development such those involving electricity, water supply, and communication facilities. It can increase the risks for foreign investors because they face difficulties in acquiring inputs and distribution products through the market channels in a timely manner. Difficulties in communication and transportation are also major hurdles for smooth business
operations. The extent to which certain barriers poses obstacle to attracting FDI is more acute in industries such as mining and manufacturing, given the additional costs that foreign investors must assume. These deficiencies of infrastructure may outweigh the benefits of lower labor cost or abundant resources in LDCs. They can severely limit FDI inflows from resource seekers. For potential investors in hotel and tourism and manufacturing sectors, inadequate infrastructure may lead to increased costs for them. Unless these costs are compensated by additional benefits, investors will not want to invest in a particular country. However, these infrastructure weaknesses may create opportunities for some businesses specializing in infrastructure services such as electricity and road construction. Institutional and human resources barriers Most developing countries, especially LDCs, are faced with constraints involving human, social, and institutional capital. In terms of human capital, they have a higher proportion of a) adult illiteracy, b) a higher incidence of healthcare problems and absenteeism, c) a higher incidence of absenteeism driven by extended family burdens requiring care of children and of the aged with no social welfare nets to support them. Illiteracy and absenteeism caused by a variety of factors limit the ‘trainability’ of workers in LDCs. It restricts the type of training and increases the cost of training assumed by foreign firms. This situation can also cause shortage of skilled labor shortage and qualified and experienced managers and technicians in these countries. The availability of human capital is a major driver of FDI. A host country that has larger supplies of high-level manpower able to continually absorb new skills is likely to attract more and better quality FDI than countries without such endowments. Social capital represents the intangible assets that societies as a whole in all countries have. It takes the form of various types of traditions and taboos, informal organizations, and trust. Social capital comprises the invisible glue that binds societies and cultures together. The dimensions of social capital that are particular concern to foreign investors are constitutions and form of political organization, adherence to the rule-of-law, means of dispute resolution whether formally or informally, crime rate and major crimes happened in the country, level and pervasive of corruption, intrinsic ability to evolve by embracing and adapting to technological and globally induced cultural change in a manner that is positive and constructive. Institutional capital in any country is usually divided into a) public institutions, b) private institutions geared to generation of profits or to activities on a not-for-profit basis, and c) civil institutions. Most LDCs are characterized by the insufficiency of institutional capital in all three areas. Foreign investors are most concerned about the
efficacy of public institutions and their impact on the quality and responsiveness of governance. Generally speaking, these weaknesses, including administrative barriers, are disincentives to foreign investors.
Ⅳ. FOREIGN DIRECT INVESTMENT IN MYANMAR Background of FDI in Myanmar Myanmar has been undertaking economic reforms since 1988. Since then, the country has officially has adopted market-oriented economy and welcomed FDI inflow. Accordingly, a series of legislation conducive to market economy have been enacted and some of the existing laws were amended to be compatible with the changing economic environment. Soon after the adoption of a market-oriented economy, Myanmar Foreign Investment Law was promulgated on 30 November 1988 and Myanmar Foreign Investment Commission was formed on 7 December 1988. Myanmar fully recognizes the advantages of FDI for its economic development. Consequently, the government has been actively encouraging FDI in Myanmar. Its main foreign investment policy and objectives are as follows: a. Adoption of a market-oriented system for allocation of resources b. Encouragement of private investment and entrepreneurial activity The basic principles of Myanmar Foreign Investment Law are as follows: a. Promotion and expansion of exports b. Exploitation of natural resources which require heavy investments c. Acquisition of high technology d. Supporting and assisting production and services involving large capital e. Opening up of more employment opportunities f.
Development of works which would save energy consumption and
g. Regional development To effectively attract investment from foreign countries, the Myanmar Investment Commission (MIC) was founded on 4 May 1994. The MIC is responsible for the affairs of both foreign and Myanmar citizens’ investment. It is an initial approving authority for foreign investment proposals like the Board of Investment of Thailand and Economic Development Board of Singapore. Following are its functions: a. To scrutinize the proposal to conforms with all the rules and regulation as set out in the FIL; b. To check to ensure that proposals are financially credible and economically justifiable and the proposed technology is appropriate; c. To ensure that the proposed project is environmentally friendly; d. To grant approval by the issuance of a permit with stated terms and conditions; e. To monitor and evaluate foreign investment after approval has been given; f.
To relax and amend the terms and conditions previously defined if necessary;
g. To give suggestions and recommendations, where necessary; h. To facilitate and promote foreign investments; and i.
To take necessary and prompt action in respect of issues regarding promotion of foreign investment FDI is very important for Myanmar since it needs investment to generate
employment for its citizens, technology know-how and foreign exchange to implement development projects. Given the continuous decline in Overseas Development Assistance and bank borrowing from international financial agencies, FDI will continue to be a significant source of finance for development, fulfilling investment and narrowing development gaps. It also helps ensure the sustainability of the recovery process and industrial development in Myanmar. FDI brings along with it not only capital flows that are related to the balance of payments but also a package of other economic benefits such as employment opportunities, export market, technology and entrepreneurial skill enhancement. Thus, FDIs are welcome and guaranteed by the Union of Myanmar Foreign Investment Law. Exceptions are FDIs that bring inappropriate technology and could potentially cause deteriorating balance of payments in the long run. As of August 2007, a total of 29 countries have invested in Myanmar, whose combined investments have a total value of US$14,580.559 million. This amount only represents the total approved amount of FDI and may be different from the actual or realized value of investment. Approximately, total realized value of FDI into Myanmar represents about 45 percent of the total approved value. Allowable economic activities and procedures and approval process In Myanmar, almost all the economic sectors are open to foreign investment with the exception of those reserved under the State-owned Economic Enterprises Law (SEE law-1990) 23 . However, if a foreign investor is interested in an activity that is reserved in the SEE Law, he can apply with the state so he can undertake the activity. If the MIC is convinced that the proposed activity will be in line with the interest of the nation,
23
SEE Law (1990) defined the sectors that are soly reserved for state. They are 1) extraction of teak and
sale of the same in the country and abroad; 2) cultivation and conservation of forest plantation with the exception of village owned fire-wood plantation; 3) exploration, extraction and sale of petroleum and gas and production of products of the same; 4) exploration and extraction of pearls, jade and precious stones and export of the same; 5) breeding and production of fish and prawns in fisheries which have been reserved for research by the Government; 6) postal and telecommunication service; 7) air and railway transport service; 8) banking service and insurance service; 9) broadcasting service and television service 10) exploration and extraction of matals 11) electricity generating of metals 12) manufacture of products relating to security and defense
approval from the Trade Council and Cabinet could follow suit. The Foreign Investment Law allows foreign investment activities in the form of wholly foreign-owned or joint ventures. For joint ventures, foreign investors may forge partnerships with any Myanmar national, private company, a cooperative society or a state-owned enterprise. In all joint venture projects, the minimum share of the foreign party is 35 percent of the total equity capital. A built-operate and transfer system is allowed for hotel and real estate projects, while production sharing contract system may venture into exploration and extraction of the natural resources. The required minimum foreign capital is US$ 500,000 for manufacturing and US$300,000 for services. This can be in kind and in cash. Duration of investment depends on the volume of investment. According to the existing land laws of Myanmar, a foreigner or foreign company cannot own land but can lease over a long-term period from the state for investment activities. The land lease rate is US $3 per sq. m per annum at the state-owned industry zone.
Application procedure: The potential investors shall submit a proposal to the MIC in a prescribed form. The proposal has to be come with the following support documents: a. Business profile and document supporting financial credibility such as the latest audited accounts of the person(s) or the firm intending to make the investment b. Bank reference and recommendation regarding the potential foreign investor’s business standing c. Detailed calculation relating to the economic justification of the proposed project d. A draft contract to be executed with a state organization that is responsible for the smooth operation of the enterprise in the respective field if the project is a wholly foreign-owned venture e. A draft contract between the partners if the project is joint-venture f.
A draft land lease agreement (if required)
g. Draft Memorandum and Articles of Association if the proposed joint-venture is in the form of a limited company h. An application for exemption and relief defined under Section-21 of the FIL The FIL provides an irrevocable state guarantee that an enterprise permitted by MIC under the FIL shall not be nationalized during the permitted or extended period (if any). It also provides repatriation of profit (after all deduction of all taxes and the prescribed funds) as well as legitimate balance of salary and lawful income of foreign
personal (after payment of living expenses and taxes). In the case of termination or dissolution of the business, repatriation of foreign capital can also be allowed.
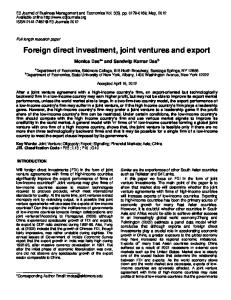
Support services: MIC always provides necessary assistance to the investors, coordinating with the respective ministries and organizations for investment facilitation. It takes about six weeks for the investors to get investment permits if the documents are completed from the time they submit their proposals to MIC. MIC also provides assistance to foreign investors by coordinating with the respective Ministries if the permitted enterprises face any problems and difficulties in their business operation. Resource-based heavy investment, resource-based export-oriented value added projects, labor-intensive export-oriented projects are given priority for foreign investment in Myanmar. An analysis of FDI inflows into Myanmar Myanmar is a country rich in natural and human resources. It has vast cultivable land, long coastlines, navigable river systems, abundant materials, gems, forests and a literate population. These plus attractive incentives are expected to entice potential foreign investors. Foreign investments from various countries have been coming into Myanmar since 1989. The pattern of foreign direct investment inflows into Myanmar is shown as follows. Data in all figures represent approved data by MIC. Figure 1: The pattern of FDI inflows into Myanmar (1989-2007) 7000 6000
US$ in Million
5000 4000 3000 2000 1000
2006-07
2005-06
2004-05
2003-04
2002-03
2001-02
2000-01
1999-00
2007-08(31.8.2007)
Year
1998-99
1997-98
1996-97
1995-96
1994-95
1993-94
1992-93
1991-92
1990-91
1989-90
0
Source: Myanmar Investment Commission
As shown in Figure 1, FDI inflows into Myanmar gradually increased from 1989 to 1996. In 1996, it reached the highest level recorded in the country’s history (which was exceeded by the 2005 level). After that FDI declined markedly and became stagnant until 2004. In 2005, FDI inflow dramatically increased and reached its highest ever.
Such growth was not sustained and declined again to previous levels. The pattern of FDI inflow into Myanmar throughout the period was broken down into three parts in this paper. These are, namely, the period of growth (1989-1996), period of stagnation (1997-2004), and current period (2005 onwards). Before a detailed analysis of the investment pattern during each period, it maybe helpful to analyze the Figure 2: The pattern of FDI inflow by World region (1989- 2007) 7000.000 6000.000
US$ in Million
5000.000 4000.000 3000.000 2000.000 1000.000
Year
ASEAN
Other Asia
EU
2007-08(31.8.2007)
2006-07
2005-06
2004-05
2003-04
2002-03
2001-02
2000-01
1999-00
1998-99
1997-98
1996-97
1995-96
1994-95
1993-94
1992-93
1991-92
1990-91
-1000.000
1989-90
0.000
Other
Source: Myanmar Investment Commission pattern of investment by world region, by nation, by leading country in each region and by sector. Figure 2 shows the pattern inflow of FDI by the world region throughout the period. Not surprisingly, ASEAN leads all other regions that invested in Myanmar except in 1994. As seen in Figure 3, the total amount of investment in Myanmar by ASEAN was about US$10,000 million. It is about four times more than the investment of EU, which ranks second. The total amount of investment by other Asian countries, including Japan, China, and India, is about US$1,800 million throughout the period 1989-2007. The
Figure 3: The total value of investment by World region 12000
10000
US$ inMillion
8000
6000
4000
2000
0 ASEAN
Other Asia
EU
Other
Source: Myanmar Investment Commission amount of investment by other world regions, including the U.S. is about US$500 million. This amount is 20 times less than the investment of ASEAN during the period. The value of investment by each ASEAN country is shown in Figure 4. Again, Thailand leads other ASEAN countries, given that its investment value is more than Figure 4: The value of investment by ASEAN countries during the period (1989-2007) 8000 7000
US$ in Million
6000 5000 4000 3000 2000
Vietnam
Brunei
Darussalam
Philippine
Indonesia
Malaysia
Singapore
0
Thailand
1000
Source: Myanmar Investment Commission the combined total of other ASEAN countries. Singapore comes second and Malaysia, third. Among ASEAN countries, seven countries invest in Myanmar and of these only three countries can be said to be the active investors, namely, Thailand, Singapore, and
Malaysia. The amount of investment by other ASEAN countries represents relatively insignificant amount. Figure 5: The value of investment by top 10 countries during the period (1989-2007) 8000 7000
US$ in Million
6000 5000 4000 3000 2000 1000
Indonesia
Republic of Korea
U.S.A
France
China
Hong Kong
Malaysia
Singapore
U.K
Thailand
0
Source: Myanmar Investment Commission The total amount of investment by top 10 countries in terms of the value of FDI inflows into Myanmar during the period is shown in Figure 5. Thailand significantly leads al l other countries with about US$7,500 million, which represents nearly half of the total investments in Myanmar throughout the period. UK stands second with its investment value of about US$1,800 million. It is followed by Singapore with about US$1,500 million; Malaysia is fourth with about US$700 million; and Hong Kong stands is fifth place with US$500 million. Among the top ten investor countries, four countries are from ASEAN, two are from EU, and three are from other parts of Asia. The USA is the only other country outside of these regions. Figure 6 shows the amount of investment made by other Asian countries in Myanmar throughout the period. Seven countries from Asia (excluding ASEAN) have invested in Myanmar. Of these, Hong Kong and China significantly lead other countries. China is second and the Republic of Korea is third; Japan is in fourth place with an investment value of about US$ 200 millions, followed by India. Investments from Bangladesh and Sri Lanka in Myanmar represent very insignificant amounts.
Figure 6: The value of investment by other Asian countries during the period (1989-2007) 600
US $ in million
500 400 300 200
Srilanka
Bangladesh
India
Japan
Korea
Republic of
China
0
Hong Kong
100
Source: Myanmar Investment Commission As seen in Figure 7, six EU countries, led by the UK, have invested in Myanmar. UK’s investment surpasses the combined investments of all other EU countries. France and the Netherlands stand at second and third places, respectively. In sum, Thailand and Hong Kong from Asia and the UK from the EU are the biggest investors in Myanmar in their respective regions.
Denmark
Germany
Austria
Netherlands
The
France
2000 1800 1600 1400 1200 1000 800 600 400 200 0
U.K
US $ in million
Figure 7: The value of investment by EU countries during the period (1989-2007)
Source: Myanmar Investment Commission Figure 8 shows the FDI inflow into Myanmar during the period 1989-2007. Twelve sectors benefit from the inflow of FDI into Myanmar. The power sector leads
these sectors, representing more than 43 percent of the total investment value. It is Figure 8: FDI inflow by sector during the period (1989-2007)
1.32%
2.15% 2.22% 3.67%
0.26% 0.24% 0.16%
7.10% 43.29% 7.25%
11.04%
21.31%
Power
Oil and Gas
Manufacturing
Real Estate
hotel and Tourism
Mining
Livestock & Fisheries
Transport & Communication
Industrial Estate
Construction
Agriculture
Other Services
Source: Myanmar Investment Commission followed by the oil and gas sector, comprising over 21 percent of the total investment; the manufacturing sector stands in third overall, with approximately 11 percent of the total share of investment. Real estate and hotel and tourism also receive significant shares of investment, with over 7 percent of the total in each sector. The FDI inflows into the rest sectors are relatively small in terms of their contribution to the total investment. Table 1: Foreign Investment by Sector from 1989 to 1996 Period between 1989 and 1996(Approved data) Sr.
Sector
Number of projects
1 2 3 4 5 6 7 8 9 10 11
Agriculture Livestock & Fisheries Mining Manufacturing Oil and Gas Construction Transport Hotel and Tourism Real Estate Development Industrial Estate Other Services
2 17 42 82 34 1 10 39 14 3 3
Amount (US$ in million) 8.681 269.537 498.030 1117.095 2131.023 17.267 169.087 733.959 903.550 193.113 10.286
Total
247 6051.628 Source: Myanmar Investment Commission
Period of growth (1989-1996): After Myanmar’s Foreign Investment Law was passed in 1988, FDI from various countries increased steadily. FDI inflows into various sectors during this first eight year period are shown in Table 1. As soon as Myanmar accepted FDI, most FDI were channeled into the oil and gas sector. The amount of investment received in this sector was nearly two times more than that of the manufacturing sector, which placed second. Real estate development was in the third place, followed by hotel and tourism sector. Myanmar’s primary economic sector, agriculture, received the least amount of FDI during this period. FDI inflows have gone in the primary sectors (i.e., oil and gas), secondary sector (i.e., manufacturing), and tertiary sector (i.e., hotel and tourism). Table 2 shows the amount of investment by individual countries during the period between 1989 and 1996. Since FDI was first permitted in Myanmar, ASEAN has played a very significant role in the flow of investment into the country, with a total value of US$ 2808.433 million. That of Europe is US$2249.329 million as the second
No. (a) 1) 1 2 3 4 5 2) 6 7 8 9 10 11 (b) 12 13 14 15 16 17 (c) 18 19 20 21
Table 2: Foreign Investment Inflows by Country during 1989-1996 Approved amount (US $ in million) Region/Country No. of project/firm Total Amount Asia 172 3483.742 ASEAN 118 2808.433 Thailand 39 1026.808 Singapore 55 1101.639 Malaysia 19 462.369 Indonesia 4 210.950 Philippine 1 6.667 Other Asia 54 675.309 China 8 28.759 Hong Kong 18 402.943 Japan 13 167.021 Republic of Korea 12 72.629 Bangladesh 2 2.957 Srilanka 1 1.000 Europe 39 2249.329 UK 27 1440.254 France 3 470.370 The Netherlands 5 237.835 Austria 2 72.500 Germany 1 15.000 Denmark 1 13.370 Other regions 36 318.557 USA 15 243.565 Australia 11 40.061 Canada 9 32.531 Macau 1 2.400 Total 247 6051.628
Source: Myanmar Investment Commission
largest investor. Other Asian countries with investments in Myanmar include China, Korea, and Japan. Even before Myanmar became an ASEAN member, ASEAN countries had had close relationships with Myanmar in the investment and trade arenas. The EU had a great potential to become a large investor group in Myanmar at that time because its investment value exceeded US$2000 million. Table 3: Top ten Investor countries in Myanmar during 1989-1996 Approved amount (US $ million)
No.
Country
No. of project/firm
Investment value
1
UK
27
1440.254
2
Singapore
55
1101.639
3
Thailand
39
1026.808
4
France
3
470.370
5
Malaysia
19
462.369
6
Hong Kong
26
402.943
7
USA
15
243.565
8
The Netherlands
5
237.835
9
Indonesia
4
210.950
10
Japan
13
167.021
Source: Myanmar Investment Commission
The UK led all other nations during this period as an investor in Myanmar, followed by Singapore (see Table 3), whose investment value was slightly lower than UK’s. Of the top five countries with investments in Myanmar, three were ASEAN countries and two were EU countries. Although Japan is an active investor in other ASEAN countries, it only stood at ten in Myanmar. Hong Kong stood at number six in the Myanmar’s FDI. China was not among the top ten investors in the first period of Myanmar FDI.
Period of stagnation (1997-2004): This represents the period between 1997 and 2004. During this second eight-year period, investment inflow into Myanmar significantly declined. Investments from the whole of Asia declined, having been affected by the Asian economic crisis. Though Myanmar was not directly affected by the crisis, the inflow of FDI into the country got stagnant since then, compounded by economic sanctions from the EU and the U.S. FDI inflows into Myanmar during this period were shown in the Table 4.
Table 4: Foreign Investment by Sector (Total number of enterprises) Period between 1997 and 2004 (Approved data)
Sr.
Sector
1 2 3 4 5 6 7 8 9 10 11
Agriculture Livestock & Fisheries Mining Manufacturing Oil and Gas Construction Transport Hotel and Tourism Real Estate Development Industrial Estate Other Services Total
Number of projects
Amount (US$ in million) 2 25.670 7 42.821 15 36.160 70 493.313 34 496.000 1 20.500 6 144.185 5 300.602 4 152.903 0 0.000 3 13.400 147 1698.554 Source: Myanmar Investment Commission
FDI inflow into Myanmar by country during this period of stagnation is shown in Table 5. The amount of investment by each region and each individual country dramatically declined in this period. Table 5: Foreign Investment Inflows by Country during 1997-2004 No. (a) 1) 1 2 3 4 5 6 7 2) 8 9 10 11 12 (b) 13 14 (c) 15 16 17 18 19 20 20
Region/Country Asia ASEAN Thailand Singapore Malaysia Indonesia Philippine Brunei Darussalam Vietnam Other Asia China Hong Kong Japan Republic of Korea India Europe UK The Netherlands Other regions Australia Canada Panama Cyprus Macau Switzerland Israel
No. of project/firm 120 56 16 15 14 8 1 1 1 64 17 13 11 22 1 11 11 n.a 16 3 8 1 1 1 1 1
Approved amount (US $ in million)
Total Amount 1458.432 1021.603 314.415 332.574 198.378 30.547 140.000 2.040 3.649 436.829 164.762 101.275 44.613 121.679 4.500 148.720 147.720 1.000 91.402 42.019 7.250 29.101 5.250 2.000 3.382 2.400
Total
147 1698.554 Source: Myanmar Investment Commission Table 6: Top ten Investor countries in Myanmar during 1997-2004 Approved amount (US $ million)
No.
Country
No. of project/firm
Investment value
1
Singapore
16
332.574
2
Thailand
16
314.415
3
Malaysia
14
198.378
4
China
17
164.762
5
UK
11
147.720
6
Philippine
1
140.000
7
Republic of Korea
22
121.679
8
Hong Kong
13
101.275
9
Japan
11
42.019
10
Australia
3
30.547
Source: Myanmar Investment Commission
The top ten investor countries in Myanmar during second eight-year period are shown in Table 6. Singapore moved to the first place in this period, followed by Thailand and Malaysia. China landed fourth and the UK, fifth. Japan was at the ninth place. Among top five investor countries, three were from ASEAN. Figure 9: Comparison between FDI inflows by sector during two periods 7000
5000 4000 3000 2000
1989-1996
1997-2004
Total
Other Services
Industrial Estate
Real Estate
Tourism
hotel and
Transport &
Communication
Construction
Oil and Gas
Power
Manufacturing
Mining
Fisheries
0
Livestock &
1000
Agriculture
Amount (US$ in million)
6000
Source: Myanmar Investment Commission Figure 9 shows that FDI inflow into Myanmar during this second eight-year period was significantly less than that of the first eight-year period. The total inflow of FDI greatly declined from US$6051.628 million in the first period to US$1698.554 million in the second period. FDI inflow was significantly reduced in oil and gas sector. Similarly, it was reduced in mining, manufacturing, hotel and tourism, and real estate sectors, respectively. In the latter period, the FDI inflow into Myanmar by world regions was also significantly reduced. Owing to the Asian crisis, the FDI inflow from Asia reduced more than two times from US$3483.742 million in the first period to US$1458.432 million in the second period. EU investment in Myanmar greatly reduced from US$2249.329 million in the first period to US$148.72 million in the second period. The EU did not suffer the impact of financial crisis. So, it can be concluded that declining FDI value in the second period was mainly due to the withdrawal of EU investment in Myanmar rather than the impact of the Asian crisis. A comparison of FDI inflow into Myanmar in these two periods is shown in Figure 10. Figure 10: FDI inflows into Myanmar by world regions during two periods 3000
2500
US$ in million
2000
1500
1000
500
0 ASEAN
Ot her Asia 1989-1996
EU
Other Region
1997-2004
Source: Myanmar Investment Commission Among top ten investor countries in these two periods, a significant change occurred. UK slipped from number one to number five in the second period while Singapore moved up from number two to number one. Thailand also inched up from
third into second place in the latter period. China as a newcomer into the top ten investors’ list ranked four while France was excluded from the list. The comparison on Figure 11: Comparison among the position of top ten investor countries between two Periods 1600
1200 1000 800 600 400
1989-1996
China
Australia
RepublicofKorea
Philippine
Japan
Indonesia
TheNetherlands
U.S.A
Hongkong
M alaysia
France
Thailand
0
Singapore
200 U.K
Amount (US$million)
1400
1997-2004
Source: Myanmar Investment Commission the situation of top ten countries between these two periods is shown in Figure 11. Figure 11 shows that FDI inflows into Myanmar from the top ten countries significantly declined. Although investments from ASEAN countries like Singapore and Malaysia greatly reduced, their positions in the top ten went up as other countries fell in the rankings. Investment by the UK greatly reduced in the second period, as shown in Figure 11. Other EU countries like France and the Netherlands as well as the U.S. totally dismissed their investments from Myanmar. Investment by Japan was also significantly reduced while the Philippines, Korea, China, and Australia became new investors in Myanmar.
Current period (2005 onwards): In 2005, FDI inflows into Myanmar dramatically went up at an unprecedented in Myanmar’s FDI history. However, it is difficult to say that Myanmar FDI has been revitalized because this increase mainly comes from the investment in a single project-Thailand’s power sector project, which is intended to generate hydro power from Thanlwin River and the single amount of investment in this project is more than US$6000 million. Nevertheless, it is too huge an investment value for Myanmar such that the 2005 FDI surpassed any FDI inflows in the precedent years. The situation of FDI inflow into Myanmar in the current period is shown in Table 7. In Table 7, although FDI inflows into Myanmar in 2005 reached the highest level throughout the whole period, it was mainly due to huge amounts of investment by
Thailand. More importantly, new investments in 2005 came from only three countries— Thailand, China, and India. Apart from Thailand’s investment, the amount invested by
No (a) 1) 1 2 3 4 5 6 7 2) 8 9 10 11 12 13 (b) 14 15 16 17 18 19 (c) 20 21 22 23 24 25 26 27 28
Table 7: FDI inflows by countries in the period between 2005 and 31.8.2007 Approved amount (US $ million) Country 2005-06 2006-07 2007-08 Total (Up to 31.08.07) Asia 6065.675 446.722 12.000 6524.397 ASEAN 6034.400 81.000 6115.400 Thailand 6034.400 6034.400 Singapore 81.000 81.000 Malaysia Indonesia Philippine Brunei Darussalam Vietnam Other Asia 31.275 365.722 12.000 408.997 China 0.700 281.222 281.922 Japan Republic of Korea 37.000 12.000 49.000 India 30.575 47.500 78.075 Bangladesh Srilanka Europe 272.980 272.980 UK 272.980 272.980 France The Netherlands Austria Germany Denmark Other regions 33.000 33.000 USA Australia Canada Russia Federation 33.000 33.000 Panama Cyprus Macau Switzerland Israel Total 6065.675 752.702 12.000 6830.377 Source: Myanmar Investment Commission
the other two countries is negligible, US$0.7 million from China and US$30.575 million from India. The amount of ASEAN investment was significantly reduced in 2006. Only Singapore invested in Myanmar in 2006 among ASEAN countries, estimated at US$81 million. China’s investment significantly increased in 2006 to US$281 million. The UK, Russia, India, and the Republic of Korea funneled new investments during the year, bringing the number of country investors in 2006 to six.
The situation of FDI inflows into Myanmar from April 2007 to August 2007 (fiscal Figure 12: The FDI inflows during the period between 2005 and 31.08.2007 7000 6000
US$ million
5000 4000 3000 2000 1000 0 2005-06
2006-07 Asia
ASEAN
Other Asia
2007-08 (Up to 31.08.07) EU
Other
Source: Myanmar Investment Commission year of Myanmar) was not encouraging at all, since the total amount of FDI into the country stood only at US$12 million, which came mainly from Korea, the sole investor in the year. Figure 12 shows FDI inflow into Myanmar for the period 2005-2007. The condition of FDI inflow by world region is shown in Figure 13. As shown in figure, ASEAN only becomes the major investor in Myanmar. The investment of other region decline apparently. The amount of investment by other Asia countries stands in the second place after ASEAN. However, the amount of their investment does not increase significantly. The investment by other regions is very insignificant amount in Myanmar. Figure 13: FDI inflow into Myanmar by world region (2005-31.8.07)
7000
U S $m illio n
6000 5000 4000 3000 2000 1000 0 ASEA N
Other As ia
EU
Other Region
Source: Myanmar Investment Commission The amount of FDI inflows into Myanmar in terms of sector during the same period is shown in Table 8. Table 8: FDI inflow by sector during current period (2005-31.08.07) Approved amount (US $ million) Sr.
Sector
2005-06
2006-07
2007-08
Total
(Up to 31.08.07) 1
Agriculture
-
-
-
-
2
Livestock & Fisheries
-
-
12.000
12.000
3
Mining
-
-
-
-
4
Manufacturing
0.700
-
-
-
5
Power
6030.000
281.222
-
6311.222
6
Oil and Gas
34.978
471.480
-
506.455
7
Construction
-
-
-
-
8
Transport
-
-
9
Hotel and Tourism
-
-
-
-
10
Real Estate
-
-
-
-
11
Development
-
-
-
-
-
-
Industrial
12
-
-
-
-
Estate Other Services Total
6065.675
752.702
12.000
6830.377
Source: Myanmar Investment Commission
FDI inflow by sector during the period from 2005 to the end of August 2007 is shown in Figure 14. Figure 14: FDI inflows by sector during 2005-2007
0 .1 8 %
0 .0 1 %
7.41 %
9 2 .4 0%
Power
Oil and Gas
Livestock & Fisheries
Mining
Source: Myanmar Investment Commission As shown in Figure, the amount of FDI inflow is disproportionately concentrated in the power sector. Although investment in this sector was lacking throughout the period since 1989, it surpassed all other sectors in investment terms owing to a single project by one country within one year. The historically leading sector, oil and gas, slipped down to second place in the current period. There are no new investments in other sectors like agriculture, hotel and tourism, real estate and construction. Investments in livestock and fisheries and mining sector represent negligible amounts during the period. Figure 15: FDI inflows by individual country during the current period (2005-31.8.2007) 7000
6034.400
US$ million
6000 5000 4000 3000
33.000 Federation
49.000
Russia
78.075
Korea
81.000
Republic of
272.980
India
China
Thailand
0
281.922
Singapore
1000
U.K
2000
2005 - 2007(Up to 31.08.07)
Source: Myanmar Investment Commission Investments by individual countries during this period can be seen in Figure 15. Among the ASEAN member states, only Thailand and Singapore have invested in Myanmar. New investments from China and the UK and those from three other
countries, namely, India, Korea, and Russia, represent relatively small amounts in the total FDI during the period. It is worth noting that almost all investments during this period are from Asia, while the UK and Russia are the only non-Asian country with investments in Myanmar. In this sense, the role of ASEAN and the rest of Asia have assumed increased importance for Myanmar’s FDI in the recent years. This trend is expected to continue in the future. Moreover, ASEAN has a very high potential of expanding its role in Myanmar investment in the power and oil and gas sectors. Other Asia countries like China, India, and Korea are potentially major investors in these sectors as well. Ⅴ. FDI RELATIONS BETWEEN MYANMAR AND ASEAN Investments from ASEAN as the biggest investor in Myanmar today is about five to 20 times more than any those from other regions in the world (see Figure 3). In terms of contribution by individual country, Figure 4 shows that even in ASEAN countries, only three countries, namely, Thailand, Singapore, and Malaysia, play dominant positions in the area of FDI inflow into Myanmar. It is interesting to note the primary interest areas of these countries in Myanmar, which could reflect their motivations for investing in Myanmar. Figure 16: Thailand’s investment in Myanmar during the period between 1989 and (31-8-2007)
1.64% 2.32% 3.10%
1.45%
0.66%
0.51% 0.19% 0.04%
8.33%
81.76% Power Hotel and Tourism Mining Oil and Gas Industrial Estate
Manufacturing Livestock & Fisheries Transport & Communication Construction Agriculture
Source: Myanmar Investment Commission
As shown in Figure 5, Thailand stands first among the countries that invest in Myanmar with the total investment value of US$ 7,500 million during the period. Figure 16 shows that Thailand’s interest in Myanmar is concentrated in the power sector. Such investment only started in 2005, the approved value of which is only for a single project. Substracting the project from investment list will significantly reduce the amount of Thailand’s total investment in the country. The second largest sector of Thailand’s investment lies in manufacturing, but investment in this sector is about 10 times less than that in the power sector. Hotel and tourism is the third priority sector for Thailand’s investment; Livestock and fishery sector is in fourth place. Thailand’s main interest in the power sector reflects the increased demand for power within this country due to rapid industrialization. The ThanLwin River in the eastern part of Myanmar has a great potential to extract hydroelectricity, which can be used for Thailand’s local industries. The potential to access large amounts of energy at relatively a lower cost from hydropower projects in Myanmar can greatly benefit to industiries in Thailand especially those located near Myanmar’s border. Many industries in Thailand are already located on the border areas with Myanmar, which is a cheaper source of labor of the former. These industries mainly rely on Myanmar’s labor force. To supply increased power usages to these industries, Thailand uses hydropower from Myanmar Rivers, which are still unexploited. Thus Thailand greatly benefits from extracting from Myanmar’s cheaper source of power and tapping its cheap labor force. This may explain why Thailand makes large investments in hydropower project in Myanmar. Figure 17: Singapore’s investment in Myanmar during the period between 1989 and (31-8-2007)
4.09% 2.96% 5.35%
1.19% 0.77% 34.14%
11.03%
14.47% 26.00% Hotel and Tourism Manufacturing Oil and Gas Mining Agriculture
Real Estate Industrial Estate Transport & Communication Livestock & Fisheries
Source: Myanmar Investment Commission Singapore’s investment in Myanmar throughout the period is shown in Figure 17. It generated about US$1515.213 million during the period. Singapore’s investment is in a more balanced position than that of Thailand. Its investment is more concentrated in services sectors like hotel and tourism and real estates rather than resources extraction, as in the case of Thailand. Unlike Thailand, power is of no interest to Singapore. As a country with extensive experience in the services industry, it is not surprising that investments in Myanmar go mainly to the latter’s services sector. This may be a golden opportunity for Myanmar’s own services industries to learn form Singapore. Investment in manufacturing and industrial estate represents the third and fourth interested areas of Singapore. Therefore, from the development perspective, Singapore’s investment is more likely to benefit Myanmar in the long term. This is because investments in manufacturing and services generate more employment and technological spillovers than investment in the resources sectors even if these earn a large sum of dollars in the short term. Malaysia’s investment in Myanmar is about US$660.747 million during the period. Its investment is concentrated in real estate, which comprises around 65 percent of the total investment. One of the resource extraction sectors, the oil and gas sector is in second place. The manufacturing sector stands in the third place. Malaysia is the largest investor in Myanmar’s real estate sector. Its investment represents more than 40 percent of the total investment in the said sector. Malaysia also shows interest in the oil and gas sector of Myanmar, which is second largest investment sector of Malaysia. Malaysia’s investment in Myanmar seems to be long-term in nature rather than ad hoc
basis.The investments of Malaysia in Myanmar are shown in Figure 18. Figure 18: Malaysia’s investment in Myanmar during the period between 1989 and (31-8-2007)
7.42%
2.76%
8.25%
16.69% 64.88%
Real Estate
Oil and Gas
Hotel and Tourism
Livestock & Fisheries
Manufacturing
Source: Myanmar Investment Commission The manufacturing sector is the second biggest investment area in Thailand and third in Singapore and Malaysia. This means the three leading investor countries in Myanmar from ASEAN are keenly interested in the manufacturing sector. Their investment values in this sector have huge potentials to increase. The investments of four other ASEAN countries - Indonesia, the Philippines, Brunei, and Vietnam represent insignificant amounts in total so they are excluded in this analysis. Myanmar’s FDI outflow is found in part in the manufacturing and service sectors in Singapore, Thailand, and Malaysia, the combined amounts which is relatively insignificant. Myanmar’s oversea FDI investment can be seen in Laos with US$0.68 million and in Thailand, with US$3 million 24 .
24
ASEAN-JAPAN Statistical Pocketbook 2007
Ⅵ. ANALYSIS OF THE ATTRACTIVENESS OF MYANMAR FDI Investments in Myanmar present exciting opportunities as well as risks. Opportunities come from Myanmar’s rich natural resources like natural gas, forest resources, mineral resources like gems and jewelry, marine resources, and large areas of cultivable land. Its geographical location, cheap and relatively educated workforce, and accessible routes of transportation from sea and road are also potential incentives to investors. Myanmar’s attractiveness as an investment site also comes from incentives and policies that have been put in place by the government. Risks come from political and unfavorable macroeconomic factors such as exchange rate control, poor infrastructure, unstable policies and level of openness. From the investors’ perspective, they need to examine each of the abovementioned factors in detail before they make investment decisions concerning Myanmar. The perspective of investors must be taken into account when analyzing FDI attractiveness in Myanmar. The analysis will be made on Myanmar relative to Cambodia, Laos, and Vietnam (or the CLMV group). A.Basic Economic data
Sr. 1
Table 9: Basic Economic data of CLMV countries Cambodia Laos Myanmar
Data Land area
2
Population (2006)
3
Nominal GDP (2006)
4
GDP per capita (Nominal)
5
Annual GDP growth rate (2006)
6 7 8
Export (US $ million) Import (US $ million) Inflation *
Vietnam
181,035 sq miles 14.10 Million 7,096 US$ million 503.27 USD 9.5 percent
236,800 sp miles 6.06 million 3534 US$ million 567.10 USD 7.6 percent
677,000 sq miles 56.51 million 13,002 US$ million 230.10 USD 7.0 percent
331,690 sq miles 84.37 million 60,995 US$ million 722.97 USD 8.2 percent
3,562 2,985 4.7 (2006)
1,101 1,635 6.8 percent (2006)
4,353 3,834 10.7 (2005)
39,531 47,941 7.5 percent(2006)
percent
percent
Source: SEAN-JAPAN Statistical Pocketbook 2007 *Asian development outlook (2007) As presented in Table 9, Myanmar is the second largest market among CLMV countries, next only to Vietnam in terms of population, GDP, and trade volume. However, Myanmar has lowest GDP per capita and highest inflation rate among the CLMV countries. Foreign investors, especially in the case of market-seeking FDI, pay attention to the market size of the host country. Market size represents population and purchasing power of the host country. GDP per capita serves as a proxy of purchasing power of the country. Among CLMV, Vietnam is the largest market, having the largest population and highest per capita GDP at the same time. Although Myanmar has the second largest population, its GDP per capita is lowest among CLMV. Low GDP per capita means lower income that limits the size of market. B. GDP by Economic origin Economic sector contribution to GDP can show the state of industrialization and the primary economic sector in the country. It also reflects the economic strategy of the policymakers of that country. Among CLMV, Myanmar is the lone country whose economy relies heavily upon the agricultural sector, since the sector contribution to GDP is more than 50 percent. Concerning manufacturing sector contribution to GDP, only Myanmar among the CLMV has between 10 and 20 percent output whereas those of other countries in CLMV have more than 20 percent. Table 10: Sectoral contribution to GDP by CLMV countries (2005) Sr.
Sector
Myanmar
Cambodia
Laos
Vietnam
1
Agriculture
50.6 percent
32.9 percent
47.0 percent
20.9 percent
3
Manufacturing
9.8 percent
21.5 percent
20.4 percent
20.7 percent
Source: ASEAN-JAPAN Statistical Pocketbook 2007 p. 16 C. Resources endowment Where resources are concerned, Myanmar endows resources more than Cambodia and Laos and relatively as par with Vietnam. Especially, Myanmar has diversity of natural resources such as timber, precious stones and natural gas. This is Myanmar’s comparative advantage and a strong attractiveness for resources seeking FDI. Table 11: Resources endowment of CLMV countries Cambodia Laos PDR Myanmar Forest Area
70 percent (2006) 20.44 percent(2005) 443km Timber, gems, manganese
Labor force Oil and Gas production
Oil and Gas reserve(Proved)
Cultivable land Coastal line Natural resources
Vietnam
75 percent (2006)
50 percent (2006)
42 percent (2006)
4.01 percent(2006)
14.92 percent(2005)
20.14 percent(2005)
0 Timber, hydro power, gems, gold
1930km Timber, gems, Oil & Gas, Mineral, hydro power
7 millions (2003) -
2.1 millions (2006) -
28.49 millions (2006) Oil-9500bbl/day(2006) Gas-12.47billion cum (2005)
-
-
Oil-


![[MYANMAR] Enactment of Amended Foreign Investment Law in Myanmar](https://kipdf.com/img/300x300/myanmar-enactment-of-amended-foreign-investment-la_5aeec2117f8b9a31688b45e6.jpg)