Forecasting Coronary Heart Disease Incidence, Mortality, and Cost: The Coronary Heart Disease Policy Model MILTON C. WEINSTEIN, PHD, PAMELA G. COXSON, PHD, LAWRENCE W. WILLIAMS, MSC, THEODORE M. PASS, PHD, WILLIAM B. STASON, MD, MPH, AND LEE GOLDMAN, MD, MPH Abstract: A computer simulation model was developed to project the future mortality, morbidity, and cost of coronary heart disease (CHD) in the United States population. The model contains a demographic-epidemiologic (DE) submodel. which simulates the distribution of coronary risk factors and the conditional incidence of CHD in a demographically evolving population; a "bridge' submodel, which determines the outcome of the initial CHD event; and a disease history (DH) submodel, which simulates subsequent events in persons with a previous CHD event. The user of the model may simulate the effects of interventions, either preventive (i.e., risk factor modification) or therapeutic, upon mortality, morbidity, and
cost for up to a 30-year period. If there were no future changes in risk factors or the efficacy of therapies after 1980, baseline projections indicate that the aging of the population, and especially the maturation of the post-World War II baby-boom generation, would increase CHD prevalence and annual incidence, mortality, and costs by about 40-50 per cent by the year 2010. Unprecedented reductions in risk factors would be required to offset these demographic effects on the absolute incidence of CHD. The specific forecasts could be inaccurate, however, as a consequence of erroneous assumptions or misestimated baseline data, and the model awaits validation based on actual future data. (Am J Public Health 1987; 77:1417-1426.)
Introduction Coronary heart disease (CHD) is the leading cause of death and lost life expectancy in the United States population: more than one in three Americans will die from CHD, and one in five will develop symptoms of CHD before the age of 60.12 The annual economic cost of CHD in the US, including direct and indirect costs, exceeds $80 billion.3 Although a large portion of the resources that are channeled into medical technology are devoted to the treatment of this disease, the decline in CHD mortality during the last two decades has been attributed at least as much to efforts to prevent, rather than treat, CHD.'4 In the coming decades, we believe three forces will continue to build and to require priority setting for the management of CHD in the US population: CHD will continue to be the leading cause of death and life years lost as the population ages; the range of available technologies for diagnosis and treatment of CHD will continue to grow, to become more sophisticated, and hopefully to become more effective; the resources available for health care will not expand as rapidly as the technological possibilities, creating the need for choices among preventive, diagnostic, and therapeutic interventions. Determining what combination of interventions will produce the greatest health benefit for a given level of investment involves predictions about the evolution of the demographics and risk-factor epidemiology of the US population, estimates of the incidence of CHD under various scenarios for risk-factor intervention, projections of CHD mortality and morbidity under various assumptions about the utilization and efficacy of medical interventions, and forecasts of the economic implications of these patterns of preventive and therapeutic intervention and of CHD morbidity. The task is complicated by the presence of "feedback
loops": effective prevention reduces the demand, and aggregate cost, for treatment of established CHD; successful treatment may result in increased demand for future treatments by prolonging the course of CHD in such patients. We therefore developed a computer simulation model able to project the future CHD incidence, prevalence, mortality, and resource costs under alternative assumptions about preventive and therapeutic interventions. The initial version of the model was developed using readily available data from the medical literature and from health statistics, and the feasibility and face validity of the modeling approach were assessed.
From the Institute for Health Research and the Department of Health Policy and Management. Harvard School of Public Health, and the Division of General Medicine and the Cardiovascular Division, Department of Medicine, Brigham and Women's Hospital and Harvard Medical School, Boston, MA. Address reprint requests to Milton C. Weinstein, PhD, Institute for Health Research. Harvard School of Public Health, 677 Huntington Avenue, Boston. MA 02115. This paper. submitted to the Journal January 14, 1987, was revised and accepted for publication May 27, 1987. t 1987 American Journal of Public Health 0090-0036/87S1.50
AJPH November 1987, Vol. 77, No. 11
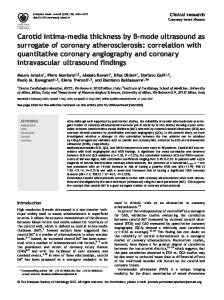
Methods The CHD model (Figure 1) is a state-transition model consisting of three main sectors: the Demographic-Epidemiologic Model (DE Model), the Bridge Model, and the Disease History Model (DH Model). Entry into the model occurs at age 35; events prior to age 35 are considered exogenous to the model. Thus, persons who have developed CHD prior to age 35 enter directly into the DH Model; others enter into the DE
FIGURE 1-Overall structure of the Coronary Heart Disease Model The Coronary Heart Disease (CHD) Model consists of three integrated submodels, the Demographic-Epidemiologic Model (DE) Model, the Bridge Model, and the Disease History (DH) Model. New 35-year old persons enter the model each year, and patients who die or survive to age 85 leave the model each year. New cases of CHD, as identified by the DE Model, enter the Bridge Model, which describes their first month with disease, and then join other patients with prevalent CHD in the DH Model.
1417
WEINSTEIN, ET AL.
Model. Persons free of CHD at the beginning of a given year include: (a) 36-85-year-old persons who remained free of CHD at the end of the previous year's cycle through the DE Model; and (b) "new" 35-year-olds who enter the model free of CHD. Persons turning 85 years leave the model and their numbers are recorded as final outputs. Persons in the DE Mlodel who develop CHD move into the Bridge Model, which characterizes the initial CHD event and its immediate sequelae during the first 30 days with CHD. Persons who survive'the first 30 days leave the Bridge Model and enter the DH Model, where they remain until exiting the Model by death or by reaching the age of 85. Demographic-Epidemiologic (DE) Model
The DE Model (Figure 2) itself allocates persons free of CHD into three groups: deaths from non-CHD causes, incident cases of CHD, and continued absence of CHD. The incident cases of CHD cross the partition into the Bridge Model for the same model year, while persons who survive without CHD reenter the pool of CHD-free persons at the start of the next model year. The DE population is stratified by two sexes, 50 ages (each year between 35-84), two smoking statuses (current cigarette smokers and nonsmokers), and three ranges each for diastolic blood pressure (c94 mmHg, 95-104 mmHg, -105 mmHg), serum cholesterol (.249 mg/dl, 250-299 mg/dl, -300 mg/dl), and relative weight (. 109% of norm, 110-129% YEAR=NI AGE = A SEX = S RISK CATEGORY: DBP
=
CHOL SMOK
= = _
AVERAGE FOR CATEGORY: m*Hg _ i/dl _ cig/day
REL WT = I~~~~~~~~~~~~~~~~
.
DEAT
X
TO BRIDGE MODEL
IALIVE WITHOUT CD I RISK FACTORS CHANGE DUE TO: -PATIENT AGE
INTERVENTION
YEAR=N+1l AGE = A+ I SEX = S RISK CATEGORY: = DBP CHOL
=
SMOK
=
AVERAGE FOR CATEGORY: gnnHg _
REL WT
_
mg/dl cig/day
X t}T O-TO A
ALIVE WITHOUT
TO
DEATH
BRIDGE MODEL
CHDI
YEAR=N+2
FIGURE 2-Dynamics of a Single Cell in the Demographic-Epidemiologic Model Each person in the Demographic-Epidemiologic (DE) Model is in one of 540 strata pr cells, each of which describes the subject's age and sex, and assigns to the person the average diastolic blood pressure, cholesterol, smoking status, and weight status of all persons in the same range for that risk factor. At the conclusion of any given year, the subject can die from non-CHD causes, develop CHD and move into the Bridge Model, or remain alive and free of CHD. If the person is alive and free of CHD, the subject's risk factors may remain the same in the subsequent year, or one or more of the risk factors may change (thus moving the patient into a different DE cell) or be modified by interventions.
1418
of norm, -130% of norm), into a total of 5400 cells. Annual mortality and CHD incidence rates, however, are generated independently for 540 strata, with the age categories collapsed into 10-year ranges. The initial DE population for 1980 was obtained by multiplying the US population, according to age and sex,7 by estimates of the proportions of persons with no history of CHD (by 10-year age intervals) according to prevalence data from the Health Interview Survey.' The initial distribution of risk factors by age range and sex was based on the Second Health and Nutrition Examination Survey (HANES II).8 Where data did not permit reliable disaggregation by age range, certain age groups were pooled or obtained by extrapolation. For simplicity, the four risk-factor distributions were assumed to be independent, conditionally upon age range and sex. At the beginning of each model year, survivors of the previous model year are "aged" by one year, with cohorts turning 45, 55, 65, and 75 advancing to the next "age range" while the cohort turning 85 exits from the model. The number of US residents who enter the model by turning 35 years of age in each year from 1981 through 2015 was obtained from projections by the US Bureau of the Census.9"'0 The proportions among these who already have had a CHD event, and who were therefore allocated directly to the DH Model, were estimated from the Health Interview Survey data on CHD prevalence.2 To reflect the fact that risk factors change with age, annual net transitions between risk-factor strata were estimated independently for each risk factor based on interpolation of the cross-sectional data from HANES II.8 Risk functions (annual rates) were constructed for CHD incidence and non-CHD mortality for each of 540 population cells. Relative risk coefficients were based on data from the Framingham Heart Study." Overall non-CHD mortality rates were based on US vital statistics. 12 Overall CHD incidence rates for ages 35-74 were based on the Framingham Heart Study," with a secular adjustment for the decline in CHD incidence since the Framingham Study,5 extrapolation to ages 75-84, and linear interpolation to smooth the agespecific annual rates. Details of the methods used to construct the risk functions may be found in Appendix I. Risk-factor interventions may be simulated by using the interactive intervention feature of the CHD model. It is possible, in any model run, to specify changes in the risk-factor means, within cells, for any cell or combination of cells (age range, sex, risk factor stratum), and over any consecutive number of years starting immediately or in the future. The risk-factor changes, which might result from interventions or changes in lifestyle, may be specified as absolute changes (e.g., -10 mmHg in diastolic blood pressure) or relative changes (e.g., -10%) for each risk factor within each cell, and each intervention may be assigned a unit cost. Bridge Model The events of the Bridge Model (Figure 3) cover the first 30 days following the initial CHD event. The model first determines whether the initial event is angina, myocardial infarction (MI), or cardiac arrest (with or without accompanying MI), by age range and sex based on CHD incidence data among residents of Rochester, Minnesota.'3 Next, the model applies probabilities of death during the first 30 days following the event, by age range, sex, and type of event. Baseline probability estimates were obtained from published literature'4'9 by methods detailed in Appendix II. Angina in the absence of acute MI was assumed to be directly associated with no mortality during the 30-day AJPH November 1987, Vol. 77, No.
11
CORONARY HEART DISEASE POLICY MODEL
CHD "STATE" 30 DAYS
AFTER ONSET OF CHD: + ARREST HISTORY
+ MI
FIGURE 3-The Bridge Model The Bridge Model receives new cases of CHD from the Demographic-Epidemiologic Model and describes their events and costs during the first 30 days after the incidence of CHD. Then, the survivors of these first 30 days enter the Disease Historv Model.
HISTORY
Disease History (DH) Model
The DH Model (Figure 4) classifies the population with a previous CHD event into 12 categories, or states. Since event rates and mortality rates are different in the first year after the initial presentation, and in order to retain the yearly basis of our model, four of these states (angina only, MI only, cardiac arrest only, and arrest with MI) are reserved for persons in the 11 months that immediately follow their initial CHD event and their concomitant passage through the one-month Bridge Model. The other eight states, which are for all persons who have survived that first year after presentation, characterize whether a CHD patient ever had one or more cardiac arrests, one or more MIs, or one or more CABGs, or any combination of events. The model considers different types of events but does not consider whether a person has had a particular event more than once. CHD patients who have experienced none of these events have, by
definition, angina only. The cohort entering into the Disease History Model in any year includes persons turning 35 with a history of CHD and persons surviving the 30 days following their initial CHD event. The DH Model is stratified by cells defined by sex, age, and CHD 'state'". Since there are 12 CHD "states", there are a total of 1200 cells (50 ages x 2 sexes x 12 CHD states). The DH Model at the start of the base year, 1980, included all US adults, aged 35-84, who had a history of CHD, and stratified them by sex and age, using US census data and prevalence rates from the Health Interview Survey2 as described above. The distribution of CHD cases among CHD AJPH November 1987, Vol. 77, No. 11
RETIRED 85-Y.O.D
CHD "EVENT" IN MONTHS -HD 2-12 AFTER ONSET OF CHD: ?ARREST ?MI ?CABG
CHD "STATE" AFTER EVENTS OF PREVIOUJS YEAR: + ARREST HISTORY MI HITR
period. Furthermore, coronary artery bypass graft surgery (CABG), although it might well occur during the first 30 days following an initial MI or angina, was modeled as part of the Disease History Model, which captures patients after their first month following their first CHD event. Thirty-day resource costs (in 1980 dollars) were estimated for each possible path through the Bridge Model, based on several published sources of cost data223 (Appendix II). Interventions that alter the baseline assumptions about current acute care and its costs may be specified by changing the case fatality rates and unit costs. For example, a perpatient cost for the paramedic program evaluated by Eisenberg, et al,'4 might be added to the unit cost for cardiac arrest patients in the Bridge Model, while increasing the survival rates to correspond to estimates of the efficacy of such programs.
NON-CHD DEATH
IN YEAR AFTER ICHD YEAR WITH CHD I: IFIRST'EVENT' J I ?? ARREST CABG I ? MII
EAT s
CO-H DETD ,"RETIRED" 85-Y.O D CH
E
FIGURE 4-The Disease History Model The Disease History (DH) Model includes 12 "states", four of which describe the 11 months subsequent to the initial presentation of CHD, and eight of which describe subsequent years. States are defined by the presence or absence of a history of cardiac arrest, myocardial infarction (MI), and/or coronary artery bypass grafting (CABG). In each year, a subject in the DH Model has certain transition probabilities for developing each type of event, each of which is associated with a case fatality rate and a unit cost. At the end of any given year, a subject in the DH Model may die from non-cardiac causes or from a new cardiac event, survive to the next year with or without one or more new events, or survive to age 85 without dying.
states was estimated by a simulation in which new CHD cases were run through the Bridge and DH Models for 35 years. During each model year, patients in each state, further stratified by age and sex, face a set of eight event probabilities (see Appendix II), corresponding to the 2x2x2 possible combinations among cardiac arrest, MI, and CABG they may experience during the next year. Each event and state has an annual probability of CHD and non-CHD death. These death rates, which we term case-fatality rates to highlight their dependence on the current event, also depend on the patient's CHD history (state), age range, and sex. Finally, each state-event combination is assigned a unit cost encompassing all CHD care during the year. At the end of each model year, persons are reassigned to states that reflect their updated CHD histories. For example, all persons in one of the four "new CHD" states are reassigned to one of the eight "continuing CHD" states for the next year, and persons who experienced their first MI as an event in the DH Model are reassigned to a state that includes MI as a descriptor. Several conventions and assumptions are employed in the DH Model: * All CHD events are assumed to occur at the beginning of the year; where multiple events occur during a model year, CABG is assumed to precede cardiac arrest or MI. * The number of prior events (-1) of a given type does not influence event probabilities or case fatality rates, although patients experiencing second or subsequent MIs (or arrests) are distinguished from first MIs (or arrests) by virtue of the fact that their state and event 1419
WEINSTEIN, ET AL.
classifications would both include MI (or arrest). Thus, the effect of this limitation is only to aggregate second and subsequent events. * After the first year following the initial event, the elapsed time since the first or subsequent CHD events does not explicitly affect event probabilities or case fatality rates. * To keep the number of cells in the model manageable, risk factor status is not considered as an explicit state variable in the DH model. These assumptions, while perhaps questionable at the individual level, are not likely to introduce major errors at an aggregate level. Case-Fatalitv Rates-Each combination of CHD event, CHD state (or history), age range, and sex is associated with a risk of death during any given model year, and an annual cost. The risk of death consists of three components: the risk associated with particular acute CHD events (arrest, MI, or CABG) that occur during the year;'4'$'937 the risk of death associated with chronic CHD and old myocardial infarction (ICDA categories 412 and 414) but not attributable to an acute CHD event;38 and the risk of death from non-CHD causes.'2 These risks were assumed to be mutually independent. Methods used to estimate these case-fatality rates and the unit costs from published sources2023 3940 are detailed in Appendix II. Interventions are specified in the Disease History Model as in the Bridge Model, by changing event probabilities, case fatality rates, and unit costs. A tabular summary of data used in the Bridge and DH Models is given in Appendix III. Outputs In summary, the model yields, for each age range and sex at annual intervals beginning 1980, estimates of the following variables for the US population aged 35-84: * the number and rate of all deaths and of CHD deaths; * the number of persons surviving to age 85, with or without CHD; * the number and rates of CHD events (cardiac arrest,
myocardial infarction, angina pectoris); * the number and incidence rates of new CHD cases; * the number and prevalence of persons with CHD; and * the resource costs for CHD, including therapeutic and preventive interventions. Model Calibration
In the CHD model, national data on the age-specific number of CHD and non-CHD deaths and the number of MIs were treated as facts. Within the model, certain variables, which had been estimated from one source or by a particular extrapolation method, were re-estimated if alternative, equally appealing sources or methods led to better agreement with the facts. Prominent among the variables about which we felt least confident and, therefore, justified in exploring alternatives in order to improve calibration, were: CHD incidence, particularly in the oldest age range: MI case-fatality rates in the oldest and lowest age ranges; CABG incidence rates; and CHD event rates among persons with a history of angina or CABG only. The data estimates and sources described above represent the end result of this calibration process. We recognize that calibration with 1980 facts does not imply that predictions for future years will be valid. As soon as detailed 1985 facts become available, a comparison of our predictions to actual events will represent such a validity test. 1 420
TABLE 1-Coronary Heart Disease Incidence, Prevalence, Mortality, and Cost Projections Year
Incidence
Prevalence
Mortality
Cost*
1980 1985 1990 1995 2000 2005 2010
692,117 729,235 759,583 792,006 834,522 888,438 953,750
5,977,405 6,700,639 7,230,904 7,625,001 7,973,869 8,385,046 8,939,816
432,613 486,428 540,557 567,798 596,777 608,434 632,304
$31.9 35.3 37.8 39.9 42.0 44.4 47.4
*Billions of 1980 dollars.
Baseline Projections
As an initial test of the model, we projected CHD incidence, prevalence, mortality, and cost (Table 1) in the United States, from 1980 to 2010, under the baseline assumptions, in which the essential characteristics of the population were assumed to be unchanged throughout the period. Although the model took into account favorable changes up to 1980 that were likely to affect the incidence of CHD, these baseline projections did not include the possibility that any of these characteristics may change further in a favorable direction (e.g., lower risk factors, higher case survival rates). Specifically, favorable trends in risk factors among persons turning 35 years of age prior to 1980 are accounted for as these cohorts age through the model, but later cohorts are assumed to have the same risk factor profile at age 35 as the 1980 cohort of 35-year-olds. Thus, these projections will overestimate the future burden of CHD if cohort trends in risk factors reduce incidence further, and if improvements in therapy reduce mortality and cost in persons with CHD.
Resiults By the year 2010, we project about a 10 per cent decline in CHD incidence rates, because of a more favorable risk factor status in newer cohorts, but the increase in the population aged 35-84 suggests that the estimated annual number of persons experiencing their first CHD event will increase by about 38 per cent, from about 690,000 per year in 1980 to about 950,000 per year in 2010. Based on the aging of the US population, the number of persons estimated to reach their 85th birthday will grow by about 70 per cent, from about 450,000 in 1980 to about 765,000 in 2010. The prevalence of CHD in the US population is projected to increase in absolute terms, from about 6.0 million in 1980 to about 9.0 million in 2010. This estimated 50 per cent increase in prevalence from 1980 to 2010 will actually be greater than the estimated 38 per cent increase in incidence, implying an increase in life-expectancy of persons with CHD. This increased projected life-expectancy is explained by demographic factors: the aging of the post-war "baby-boom" generation, including persons born in 1946-65, will result in greater increases in CHD in the 45-64 year-old age range than in older age ranges (Table 2), and these younger cases of CHD have a longer life expectancy than the older cases. Of the projected absolute increase in prevalent CHD in men of about 2.0 million cases between 1980 and 2010, about 65 per cent of the increase will be because of the "baby boomers" and only about 10 per cent will be because of the increased prevalence in men aged 75-84 years. The annual number of CHD deaths is projected to increase from about 430,000 in 1980 to about 630,000 in 2010, AJPH November 1987, Vol. 77, No. 11
CORONARY HEART DISEASE POLICY MODEL TABLE 2-Estimated Change in CHD Prevalence in Men, 2010 Versus 1980 Birth Years 2010
Age Range
Birth Years 1980 Group
Group
% Change in Number of Prevalent CHD Cases in this Age Range in 2010 Versus 1980
35-44 45-54 55-64 65-74 75-84
1936-45 1926-35 1916-25 1906-15 1896-1905
1966-75 1956-65 1946-55 1936-45 1926-35
+34 +86 +75 +35 +52
while the unadjusted CHD death rate will decline by about 4 per cent, again due to a shift toward a relatively younger average age among CHD cases. The annual number of CHD events, including new-onset angina, hospitalizations for acute myocardial infarction, and out-of-hospital cardiac arrests, is projected to increase from about 1.05 million to about 1.48 million during this period, despite a relative decline of about 7 per cent in the event rate. The costs of treating CHD in the 35-84 year-old age ranges are projected to increase by nearly 50 per cent, from about $31.9 billion to $47.4 billion, in constant 1980 dollars. The passage of the post-war baby-boom generation into older age ranges augers an even more dramatic increase in costs for the 20 years afiter 2010. Demographic-Epidemiologic Implications Under baseline assumptions, a
major factor in the increased absolute incidence of CHD is the maturation of persons born between 1946-65, who will be aged 45-64 in 2010. Despite a better risk-factor profile and hence a lower incidence rate of new CHD when compared to persons aged 45-64 in 1980, the aging of the baby-boomers would result in an estimated annual coronary heart disease incidence of 320,000 in men aged 45-64 by 2010, a 50 per cent increase compared to 1980. To offset the effects of the population growth on absolute incidence would require unprecedented reductions in risk factors. For example, to maintain in 2010 the same estimated annual incidence of about 210,000 new cases of coronary heart disease in men aged 45-64 that was found in 1980 would require: (a) that all men in the baby-boom generation have normal cholesterol levels (with a mean cholesterol level of 200 mg/dl) and normal diastolic blood pressures (with a mean diastolic blood pressure of about 81 mmHg), and that their cigarette smoking be only one-half that of current males age 45-64; (b) that these normal levels of cholesterol and blood pressure not change at all with advancing age; and (c) that men who achieve these risk-factor goals because of therapeutic interventions have the same CHD incidence rates as men who naturally have the same low-risk status.
Discu(ssion Mathematical simulation modeling41'44 can be a useful tool in forecasting the future resources required to manage a chronic disease and in guiding policy decisions that affect the allocation of present resources. Our compartmental simulation model appears to be a practical method for projecting CHD incidence, morbidity, mortality, and costs. Using readily available data, our assumptions yielded baseline results in 1980 that were well calibrated with actual, known events. The model's projections to the year 2010 emphasize that demographic trends, including the aging of the post-war baby-boom generation, will result in more than a 40 per cent increase in the CHD burden in terms of morbidity, mortality, AJPH November 1987, Vol. 77, No. 11
and costs in constant dollars, unless there are marked changes in risk factors or improvements in therapies. Furthermore, the continued aging of the post-war generation will present an even greater public health challenge in the next 30-year period, from 2010-2040. Unprecedented reductions in risk factors, well beyond the secular and cohort trends seen between 1960 and 1980, would be required to offset the effects of the growth of the population on the absolute numbers of new CHD cases.
Our model's structure is also designed to test the implications of any future changes or improvements in risk factors or therapies. The model can estimate the relative cost-effectiveness of a variety of single or multiple alterations, and it can determine how improvements in one area, such as better pre-hospital cardiopulmonary resuscitation, may have multiple effects, such as increasing the future need for intensive care units. While the current model's baseline projections did not include several newer therapies such as coronary angioplasty45 or emergent thrombolytic therapy,4647 these interventions can easily be incorporated into the model when data are sufficient to estimate their cost, benefit, and general applicability rates. In terms of our major current conclusions, which refer to absolute CHD incidence, these treatments of prevalent CHD would have no effect. The limitations of this model, both in its general use as an analytic tool and in relation to the specific baseline projections that we performed, should be understood to place our results in perspective. A number of simplifying structural assumptions have been made. For example, we decided early in the model design process to eliminate risk-factor status as a state variable in the Disease History sector of the model. This decision was driven by practical constraints; to include risk factors in the stratification of patients after their initial CHD event, in addition to crucial variables describing their CHD history, age, and sex, would have produced an unmanageable number of cells, even for our large mainframe computer. Although we can still model the effects of risk-factor modifications in patients who already have CHD, this simplification restricts our ability to model treatments that are explicitly targeted only at certain risk-factor groups within the CHD population. Nevertheless, we can mimic the effects of such targeted interventions by calculating average effects across risk-factor groups and entering the resulting pooled transition probabilities, case-fatality rates, and unit costs into the model. Another simplifying assumption was that CHD risk factors are distributed independently in the population, conditional upon age and sex. This assumption might lead to systematic underestimation of the effects of single risk-factor interventions under the logistic risk model, but it could also lead to overestimation of the effects of multiple risk-factor interventions, as in the simulation reported here. Our data sources represented non-institutionalized persons only, and our incidence rates were based on the Framingham Heart Study, in which Blacks were underrepresented. Thus, we cannot model interventions targeted by race or institutionalization, and our incidence estimates will be inaccurate to the extent to which either of these groups have unique risk-factor-adjusted incidence rates. We also assumed that the rate at which current and future cohorts would develop CHD could be explained by the distribution of known risk factors rather than by other secular or cohort effects. There are data to indicate that heart disease deaths in women have declined with each successive birth cohort since 1886, while deaths in all cohorts of men began to decline in about 1965.48 Our assumptions about risk factors are 1421
WEINSTEIN, ET AL.
consistent with these observed trends in men, in whom CHD is the overwhelming cause of cardiac death. The cohort effects seen in overall heart disease deaths in women, which cannot be explained by changes in CHD risk factors, may be because non-CHD heart disease, such as rheumatic heart disease, accounted for a higher percentage of heart disease deaths in women. We relied on readily available data for our baseline projections, extrapolating and pooling from multiple sources as needed. We believe that this procedure was appropriate for the global simulations performed to date. When we begin to use the model to forecast the effects of individual interventions, more primary data sources can be used to estimate cell-specific transition probabilities and case-fatality rates than was feasible at this stage. We have chosen to include certain clinical manifestations of CHD in the model and to exclude others. A notable exclusion is congestive heart failure, which is not included explicitly as an event or a state variable in the model. Again, the dimensionality of the model was our concern. However, patients with heart failure are included in the model among other states, such as prior myocardial infarction, and mortality due to congestive heart failure is reflected both in the case fatality rates for acute events and in the chronic CHD mortality rates. The costs of congestive heart failure are included in the average unit costs for each state-event combination. Thus, the effects of medical and surgical interventions for congestive heart failure can be simulated by the model, albeit indirectly.
Perhaps the most important limitation of this or any model concerns validity. The best validity test of a forecasting model lies in the concordance between predicted and actual events. We intend to perform such a test when 1985 vital statistics are available and to recalibrate the model so that it predicts both 1980 and 1985 facts to the extent that the precision of the model permits. In the meantime, our forecasts should be viewed with caution; they could be wrong to the extent that we have failed to foresee major future changes in the model's parameters or to the extent that we have misestimated their baseline values. Some of these oversights or errors may cancel, but others may be additive and accumulate over time. Nonetheless, these forecasts do represent our best projections based on the premise that the events of the recent past can be used as a guide to the future. The CHD Policy Model can be used to establish realistic target levels of mortality and morbidity as a result of initiatives in prevention or treatment. By capturing the interdependencies between prevention and treatment, the use of a comprehensive model such as this has distinct advantages over "partial" analyses4'49 of the effects of prevention or treatment programs in isolation. The results of such modeling, although not definitive and requiring cautious interpretation in light of the limitations of large-scale modeling, should nonetheless aid in the resolution of the continuing debates about the relative roles of prevention and treatment of CHD in an environment of limited resources.
APPENDIX I Construction of Risk Functions for CHD Incidence and Non-CHD Mortality
The following exponential approximation to a logistic risk function was used:
Pj(a,s,X,,X2,X3,X4) = Qj(a,s)exp{-1 Bij[(Xi-Xi(a,s))/cri(a,s)-0.5Bij]I
In this equation, a indexes age range s indexes sex j indexes events (1 = CHD, 2 = CHD death, 3 = all death); iindexes risk factors (I = diastolic blood pressure, 2 = serum cholesterol, 3 = smoking, 4 = relative weight); is the annual incidence rate for the Pi jth(a,s,X,,X2,X3,X4) event, among persons in a given age-sex cohort and with risk factor levels X1,X2,X3,X4; Xi is the level of the ith risk factor; Xi (a,s) is the mean value of the ith risk factor for the age range and sex ur1 (a,s) is the standard deviation of the it risk factor for the age range and sex; Qj (a,s) is the national incidence rate of the jth event, by age and sex; B1i is the standardized univariate coefficient from the Framingham Heart Study" for the ith risk factor as it contributes to the jth event. The risk function for non-CHD mortality was obtained as the difference between the risk functions for all-cause mortality and CHD mortality. The variables Xi (i = 1,2,3,4) were defined to be the conditional mean values of each risk factor, as calculated from the HANES data,8 within each risk stratum for each age range and sex. For example, the value of XI for the lowest 1 422
blood pressure stratum in 45-54 year-old females represents the average diastolic blood pressure among 45-54 year-old females whose diastolic blood pressure is below 95. The relative risk coefficients for CHD incidence (Bit) were based on the univariate coefficients from the Framingham Heart Study." Because of small sample size and high variability of estimates in some age-sex groups, some smoothing and extrapolation by age were required. The relative risk coefficients for CHD mortality (Bi2) and all-cause mortality (Bi3) were obtained similarly from the Framingham Heart Study" for the risk factors diastolic blood pressure (i = 1) and smoking (i = 3). Since the hypothesis that serum cholesterol and relative weight may be independent of non-CHD mortality is not refuted by the Framingham data," they were excluded from non-CHD mortality calculations. Estimates of overall CHD incidence (Q,) and CHD mortality (Q2) by age range and sex were based on the Framingham Heart Study" for ages 35-74, with a secular adjustment because CHD incidence in 35-64 year-olds has declined by one-fourth since the midpoint of the Framingham study.5 It was further assumed that the 65-74 year-old rates had declined by an intermediate factor of one-eighth. Estimates for ages 75-84 in both sexes were based on geometric extrapolation of the original Framingham rates11 from the two next younger age intervals. Estimates of national all-cause mortality among persons with no previous CHD, by age and sex (Q3) were obtained by adding non-CHD mortality rates from US Vital Statistics12 to the CHD mortality rates obtained from Framingham. AJPH November 1987, Vol. 77, No. 11
CORONARY HEART DISEASE POLICY MODEL APPENDIX 11 Detailed Specifications of Event Probabilities, Case-Fatality Rates, and Costs for the Bridge and Disease History (DH) Models
Bridge Model Thirty-day Mortality Rates
Cardiac Arrest-For cardiac arrests, the probability that patients survive to reach the hospital is assumed to be independent of age and sex based on data by Eisenberg, et al,'4 with baseline estimates corresponding to a standard community life-support program. The probability of myocardial infarction (MI) involvement in cardiac arrest was based on data of Schaffer and Cobb. 5 The probability of 30-day survival following cardiac arrest"4 was converted to age-specific probabilities by using the relative survival ratios reported by Stults, et al,'6 and assuming the age distributions in the two studies'14"6 to be comparable. Thirty-day survival following cardiac arrest was assumed to be the same whether MI was present or not, although the risk of subsequent coronary heart disease (CHD) events and, hence, longer-term survival was assumed to depend on the presence of MI, as described in the context of the Disease History (DH) Model. Myocardial Infarction (without arrest)-For acute MI without cardiac arrest, age-sex-specific 30-day mortality rates were based primarily on data from Minnesota'7 for 1980 but were pooled with other data as needed to increase sample size in certain age-sex cells. The sex-specific data for ages 65-74 (the most prevalent in the sample) were adjusted by estimates of the ratio of case-fatality rates for first MIs to all MIs. The Minnesota data for ages 55-64 were adjusted for first MI, then averaged with data from The Netherlands,'8 which had been adjusted to correspond with the lower overall case-fatality rate in the Minnesota data. Estimates for ages 45-54 were based on an average of the Minnesota data for 1970 and 1980, adjusted for first MI. The sex-specific case fatality rates for ages 35-44 were assumed to be equal to the adjusted Minnesota rates for ages 45-54. The sex-specific rates for ages 75-84 were estimated by multiplying the adjusted Minnesota rates for ages 65-74 by a factor reflecting the ratio of case fatality rates between ages 69+ and ages 60-69 in The Netherlands data. The resulting 30-day case fatality rates for MI in our oldest age group correspond well with data from Massachusetts hospitals.'9 Unit Costs Patients surviving MI or cardiac arrest were estimated to spend an average of four days in a coronary care unit (at $1,000 per day) plus 10 days in a general acute care bed (at $450 per day including ancillaries) and to incur $1,000 in professional fees and $500 in medications and outpatient tests during the first 30 days, for a total of $10,000. Patients dying of MI or cardiac arrest in the hospital were assumed to incur half these costs, or $5,000. A $200 cost was attributed to out-of-hospital arrest deaths. Costs of care for angina during the first month were based on the study by Hemenway, et alb-3 the estimate of $1,400 was based on $400 for every patient for medications and outpatient tests, plus hospitalization at an inclusive cost of $3,300 for 30 per cent of patients. Disease History (DH) Model Event Probabilities
Cardiac Arrest-The annual probability of a coronary attack (MI or cardiac arrest) in patients with a previous MI
(but no arrest) was estimated from six-month follow-up data AJPH November 1987, Vol. 77,
No. 11
from Stanford24 and extrapolated to one year according to the ratio of 12-month to six-month post-MI mortality rates as reported in a San Diego study.25 The percentage of coronary attacks that are arrests was based on the Framingham Heart Study follow-up of CHD patients.26 The resulting probability of cardiac arrest was made age-specific by assuming that the ratios between ages correspond to the ratios for annual mortality in post-MI patients in a New Zealand study27 and that the age distribution in the Stanford study (all patients were under 70) was comparable to that among under-70 patients in the New Zealand study. These age-specific probabilities were assumed not to depend on sex.28 For patients in the "new CHD, MI" state, the probability of cardiac arrest had to be adjusted to apply only to persons whose recent MI was their first. This was done by dividing the unadjusted rates by a factor reflecting a 2.2-fold increased risk of annual mortality in patients with an MI previous to the current one and an estimate that 22 per cent of patients in these databases had a previous MI.2729 This last adjustment provided the age-specific event rates for arrest among persons in their first year after MI as a first CHD event. The annual arrest rates in subsequent years among persons with a history of MI were obtained by multiplying these last rates by two-thirds, the assumed ratio of event rates in subsequent years versus the
first year post-MI.27
The probabilities of cardiac arrest in the first year and in subsequent years after an arrest were estimated from follow-up data on mortality30 and estimates of the percentage of CHD deaths attributable to arrest. 15 These probabilities were adjusted to apply separately to persons presenting with arrest as a first coronary event by multiplying by a factor reflecting a two-fold increase in risk of re-arrest if a history of prior CHD is present3' and a 45 per cent prevalence of prior CHD among these patients.30 3' These probabilities, in turn, were further adjusted to reflect the probability of MI involvement'5
and
an
estimated two-fold relative risk of re-event if the
these previous arrest was unaccompanied by MI.'5'32 Finally, probabilities were made age-specific by applying an extrapolated set of relative post-arrest mortality risks by age.30 These procedures resulted in age-specific estimates of the probability of re-arrest in the first or subsequent years after an arrest that had been accompanied or unaccompanied by MI. The annual sex-specific probabilities of arrest in persons with a history of "angina only" were based on sex-specific annual coronary attack rates (MI or arrest) and the percentages of coronary attacks that were arrests in the Framingham Heart Study follow-up of angina patients.26'33 These were made age-specific by assuming that age-specific CHD morto tality risk ratios from the New Zealand study27 applied the that and of with a assuming by history angina patients mean age in the Framingham follow-up sample was 60. The with corresponding cardiac arrest probabilities for persons (CABG) graft (with or without prior coronary artery bypass a history of MI or arrest) were estimated to be 10 per cent less than among patients without CABG, based on an overall 10 per cent reduction in annual mortality. This estimated reduction in annual mortality, which is approximately half of the reduction found in clinical trials,34 reflects the fact that persons routinely referred for CABG may be at greater risk 1423
WEINSTEIN, ET AL.
than their medically treated counterparts, in contrast to randomized trials in which the patients in both groups are drawn from the same population. The probability that a cardiac arrest will be accompanied by MI in a given year was estimated as in the Bridge Model.'5 Myocardial Infarction (without cardiac arrest)-The annual probability of re-MI without cardiac arrest in patients with a previous MI was estimated by multiplying the estimated annual coronary attack rate, as described above for a history of arrest,24 25 by the percentage of coronary attacks that were MIs in the Framingham follow-up.26 Then, as for arrest, the probability was made age-specific,27 and adjustments were made for the risk ratio between patients with a single versus multiple prior MIs.27-29 Finally, the re-MI probability in the first post-MI year was multiplied by the factor of two-thirds27 to obtain the re-MI probability in subsequent years. The probabilities of MI in the first year and in subsequent years after a cardiac arrest were estimated from the Stanford data to be approximately two-thirds those of re-arrest.24 Adjustments to apply to persons whose arrest was their first CHD event were made by multiplying the age-specific rates by the same adjustment factor used for re-arrest.3' Further adjustment to apply to persons with or without a history of MI accompanying their arrest was made as for re-arrest.'5'32 Finally, these probabilities were made age-specific.' These procedures resulted in age-specific estimates of the probability of MI (without arrest) in the first or subsequent years after an arrest that had been accompanied or unaccompanied by MI. The sex-specific probabilities of MI in persons with a history of "angina only" were estimated from Framingham data26 33 and were made age-specific by using the age-specific mortality ratios from the New Zealand follow-up study.27 Again, CABG was assumed to lower CHD event rates by 10 per cent. Coronary Artery Bypass Graft (CABG)-The annual probability that persons would undergo CABG was estimated by dividing the estimated number of 175,000 CABG operations in 1980 (extrapolation from NCHS)35 by the number of people with a history of CHD as calculated in the initialization of the DE Model. Separate probabilities for persons in their first year and subsequent years with CHD were obtained by applying the ratio of crossovers in year 1 to crossovers in subsequent years from the medically randomized groups in the Veterans Administration Trial36 and the Coronary Artery Surgery Study (CASS).34 These probabilities, in turn, were made age-specific by applying the following relative risk ratio: the fraction of the CASS population in a given age-sex group37 divided by the fraction of the US CHD population in the same age-sex group. For purposes of estimating the probabilities of multiple events, it was assumed that the risk
1 424
of CABG was independent of the occurrence of MI, cardiac arrest, or both in the same or previous years. Case-Fatality Rates
Cardiac Arrest-The age-sex-specific case-fatality rates for cardiac arrest (with or without MI) in the DH Model were the same as in the Bridge Model.'4"6 The risk of death during the year in which arrest occurred was assumed to be independent of the presence or absence of accompanying MI. Myocardial Infarction (without arrest)-The age-specific case-fatality rates for MI (with no arrest) were the same as those used in the Bridge Model for persons experiencing their first MI.'7-'9 For persons with a prior MI, the casefatality rate was multiplied by the factor relating mortality from subsequent MIs to mortality from first MIs.'8 Coronary Artery Bypass Graft (CABG)-The age-specific case-fatality rates (operative mortality rates) for CABG were based on the Coronary Artery Surgery Study (CASS).37 Since the overall operative mortality rates in this study were not different between patients with or without a prior MI in past years, these rates were applied to all patient histories except those in which an MI or arrest occurred in the same year as surgery. For these, the rates were multiplied by the factor relating operative mortality in patients with unstable angina to overall operative mortality.37 Patients with angina for more than one year and no other CHD events were assigned a lower operative mortality based on the ratio of operative mortality in patients with stable angina to overall operative mortality.37 Annual Mortality from Chronic CHD and other Causes
The risk of chronic CHD mortality was based on national statistics on the numbers of deaths, by age and sex in 1980, in ICDA categories 412 and 414.38 Chronic CHD death rates were, in turn, calculated by using as denominators the age-sex-specific CHD populations as estimated for 1980. The age-sex-specific probabilities of non-CHD death were obtained from vital statistics as in the DE Model.'2 Unit costs
Costs for cardiac arrests or MI occurring in the DH Model were estimated in 1980 dollars as in the Bridge Model. The acute cost of CABG was taken to be $20,000,39 to which was added the cost of 2.5 cardiac catheterizations (at $2,000) (40) to reflect the ratio of catheterizations to operations performed.39 To the costs for these acute events were added continuing annual costs, including medications, tests, physician visits, and rehospitalizations other than for surgery, based on the Hemenway, et al, study.23 These costs were estimated separately for four groups: patients who are in their first year with CHD and have not had CABG; patients who are in their second or later year with CHD and have not had CABG; patients who are in the first year after CABG; and patients who have had CABG in previous years but not the current year.
AJPH November 1987, Vol. 77, No. 11
CORONARY HEART DISEASE POLICY MODE APPENDIX IlIl Summary of Baseline Data and Their Sources for the Bridge and Disease History (DH) Models Variable Probability that initial CHD event is cardiac arrest, by age and sex Probability that initial CHD event is Ml, by age and sex
(.06, .12, .14, .17, .20) (.05, .09, .11, .13, .15) (.53, .51, .50, .49, .49) (.38, .38, .37, .37, .37) 0.41 0.019 (3.25, 6.53, 9.69, 14.04, 18.75) (.100, .303, .400, .197, 0) 2.2 0.22 0.67 0.24 0.137
Probability that an arrest is accompanied by Ml Annual probability of cardiac arrest, given history of Ml Age-relative risk of Ml or cardiac arrest, given history of Ml Assumed proportion of Mls in each age group of the index study24 Relative risk of CHD event in first year post-MI: prior CHD vs no prior CHD Assumed proportion of Ml patients with prior Ml Ratio of CHD event rates in subsequent years to first year after Ml Annual probability of death in first year after arrest Annual probability of death in subsequent years after arrest 0.73 Proportion of post-arrest deaths (within one year) attributable to re-arrest Relative risk of CHD event in first year post-arrest: prior CHD vs no prior CHD 2.0 0.45 Assumed proportion of arrest patients with prior CHD in the index studies15'30 2.0 Relative risk of CHD event: arrest with no Ml vs arrest with Ml (0.7, 1.0, 1.3, 1.7, 2.5) Relative risk of CHD event, given arrest history, by age (0, .43, 0, .57, 0) Assumed proportion of arrests in each age group of index studiesis5,30 (0.042, 0.015) Annual coronary attack rate (MI or arrest), history of angina 0.80 Proportion of coronary attacks that are Ml, given history of CHD 0.10 Fractional reduction in CHD event rates, CABG vs no CABG 0.078 Annual probability of Ml, given history of Ml 0.68 Annual probability of Ml post-arrest relative to probability of re-arrest 175,000 Estimated number of CABG operations, US, 1980 0.81 Ratio of CABG probability in first year versus subsequent years with CHD (.137, .281, .291, .130, 0) Proportion of CABG operations in age-sex group (.019, .042, .059, .041, 0)
Probability of survival to hospital, given arrest Probability of 30-day survival following arrest Relative 30-day survival ratios, by age, following arrest Probability of 30-day mortality following first Ml Relative 30-day mortality, subsequent vs first Ml Operative mortality, CABG Relative CABG mortality, CHD event in same year Relative CABG mortality, history of angina only for at least one year Chronic CHD annual mortality (ICDA 412,414) Acute cost of arrest non-survivors to hospital Acute cost of arrest or Ml survivors to hospital, not 30 days Acute cost of arrest or Ml survivors 30 days Cost of angina in first 30 days Cost of CABG surgery Cost of cardiac catheterization Catheterizations per CABG operation Cost of continuing care in first year with CHD, no CABG Cost of continuing care in subsequent years, no CABG Cost of continuing care in first year after CABG Cost of continuing care in subsequent years after CABG
Source
Valuea
0.114 0.04 (2, 2, 1.43, 0.86, 0.43) (.045, .045, .082, .152, .400) (.030, .030, .063, .132, .347) 1.5 (.008, .011, .024, .046, .058) (.034, .039, .040, .080, .123) 1.5 0.6 (.00460, .01070, .01841, .03267, .10591) (.00249, .00618, .01196, .02507, .09638) $
200 5,000 10,000 10,000 20,000 2,000 2.5 840 460
1,000 400
13b 13b 15 24, 25C, 26 27b 27 27-29 27-29 27 30 30
1i 31 30, 31 15, 32
30b 30bc 33b 26 34 24, 25c, 26 24 35 34, 36 37 14 14
16b 17-19 18 37
37b 37b
5, 11, 38 d d d d d d d d d d d
aWhere a 5 x 2 array of numbers appears, these refer to the five age ranges (35-44, 45-54, 55-64, 65-74, 75-84) and two sexes (M, F). Vectors of five or two numbers have analogous interpretations. bDenotes that some minor extrapolation or adjustment had to be applied, such as age interpolation or extrapolation, or extrapolation or interpolation of follow-up time. cDenotes that this source was used secondarily for adjustment or extrapolation of the primary source(s).
dSee text.
ACKNOWLEDGMENTS
Supported by grant number ROIHS04920 from the National Center for Health Services Research and Health Care Technology and by a grant from the Henry J. Kaiser Family Foundation. Dr. Goldman is a Henry J. Kaiser Family Foundation Faculty Scholar in General Internal Medicine. This paper was presented in part at the Annual Scientific Meeting of the Society for Medical Decision Making, Chicago, Illinois, October 22, 1986.
REFERENCES
1. National Center for Health Statistics, US Public Health Service: Vital Statistics of the United States, 1975. Washington DC: NCHS, USPHS, 1977. 2. National Center for Health Statistics: Unpublished data from the Health
AJPH November 1987, Vol. 77, No. 11
Interview Survey, 1979. 3. Rice DP, Hodgson TA, Kopstein AN: The economic cost of illness: A replication and update. Health Care Financ Rev 1985; 7:61-80. 4. Goldman L, Cook EF: The decline in ischemic heart disease mortality rates: An analysis of the comparative effects of medical interventions and changes in lifestyle. Ann Intern Med 1984; 101:825-836. 5. Pell S, Fayerweather WE: Trends in the incidence of myocardial infarction and in associated mortality and morbidity in a large employed population, 1957-1983. N. Engl J Med 1985; 312:1005-1011. 6. Kannel WB, Thom TJ: Declining cardiovascular mortality. Circulation 1985; 70:331-336. 7. US Bureau of the Census: Estimates of the civilian population of the United States by age, sex, and race: 1980-83. Current Population Reports,
1425
WEINSTEIN, ET AL.
8. 9.
10.
11.
12.
13. 14. 15.
16. 17. 18.
19.
20.
21. 22. 23.
24. 25.
26.
Population Estimates and Projections, series P-25, number 949. Washington DC: Govt Printing Office, 1984. National Center for Health Statistics: Unpublished data from the Second Health and Nutrition Examination Survey, 1976-1980. US Bureau of the Census: Preliminary estimates of the population of the United States by age, sex, and race, 1970-1981. Current Population Reports, Population Estimates and Projections, Series P-25, number 922. Washington DC: Govt Printing Office, 1982. US Bureau of the Census: Projections of the population of the United States, by age, sex, and race: 1982-2050. Current Population Reports, Population Estimates and Projections, Series P-25, number 922. Washington DC: Govt Printing Office, 1982. US Department of Health, Education, and Welfare: The Framingham Study: An epidemiological investigation of cardiovascular disease. Some characteristics related to the incidence of cardiovascular disease and death, 18-year follow-up. Section 30. Bethesda, MD: Public Health Service, 1973. National Center for Health Statistics: Vital Statistics of the United States Volume II, Part A: Mortality, 1979-1981. Washington DC: Govt Printing Office, 1981. Elveback LR, Connolly DC, Kurland LT: Coronary heart disease in residents of Rochester, Minnesota. II. Mortality, incidence, and survivorship, 1950-1975. Mayo Clin Proc 1981; 56:665-672. Eisenberg M, Bergner L, Hallstrom A: Paramedic programs and out-ofhospital cardiac arrest: I. Factors associated with successful resuscitation. Am J Public Health 1979; 69:30-38. Schaffer WA, Cobb LA: Recurrent ventricular fibrillation and modes of death in survivors of out-of-hospital ventricular fibrillation. N Engl J Med 1975; 293:259-262. Stults KR, Brown DD, Schug VL, Bean JA: Prehospital defibrillation by emergency medical technicians in rural communities. N Engl J Med 1984; 310:219-223. Gillum RF, Folsom A, Leupker RV, et al: Sudden death and acute myocardial infarction in a metropolitan area, 1970-1980: The Minnesota Heart Survey. N Engl J Med 1983; 309:1353-1358. Lie KI, Roels-van Ijsseldijk YC, van Capelle FJL: Factors influencing immediate prognosis of acute myocardial infarction. In: Lie K: Acute Myocardial Infarction in the Coronary Care Unit. Amsterdam: Peco, 1974; 60-69. Goldman L, Cook EF, Hashimoto B, Stone P, Muller J, Loscalzo A: Evidence that hospital care for acute myocardial infarction has not contributed to the decline in coronary mortality between 1973-1974 and 1978-1979. Circulation 1982; 65:936-942. Mulley AG, Thibault GE, Hughes RA, Barnett GO, Reder VA, Sherman EL: The course of patients with suspected myocardial infarction: the identification of low-risk patients for early transfer from intensive care. N Engi J Med 1980; 302:943-948. American Hospital Association: Hospital Statistics, 1981 Ed. Chicago: AHA, 1981. Health Care Financing Administration: Prospective payments for Medicare inpatient hospital services. Interim final rule. Federal Register September 1, 1983. Hemenway D, Sherman H, Mudge GH Jr, Flatley M, Lindsey NM, Goldman L: Comparative costs versus symptomatic and employment benefits of medical and surgical treatment of stable angina pectoris. Med Care 1985; 23:133-141. DeBusk RF, Kraemer HC, Nash E: Stepwise risk stratification soon after acute myocardial infarction. Am J Cardiol 1983; 52:1161-1166. Madsen EB, Gilpin E, Henning H, et al: Prediction of late mortality after myocardial infarction from variables measured at different times during hospitalization. Am J Cardiol 1984; 53:47-54. Kannel WB, Schatzkin A: Sudden death: Lessons from subsets in population studies. J Am Coll Cardiol 1985; 5:141B-149B.
1426
27. Norris RM, Caughey DE, Deeming LW, Mercer CJ, Scott PJ: Coronary prognostic index for predicting survival after recovery from acute myocardial infarction. Lancet 1970; 2:485-488. 28. Davis HT, DeCamilla J, Bayer LW, Moss AJ: Survivorship patterns in the post-hospital phase of myocardial infarction. Circulation 1979; 60:1252-1258. 29. Multicenter Postinfarction Research Group: Risk stratification and survival after myocardial infarction. N EngI J Med 1983; 309:331-336. 30. Eisenberg MS, Hallstrom A, Bergner L: Long-term survival after out-ofhospital arrest. N EngI J Med 1982; 306:1340-1343. 31. Baum RS, Alvarez H III, Cobb LA: Survival after resuscitation from out-of-hospital ventricular fibrillation. Circulation 1974; 50:1231-1235. 32. Goldstein S, Landis JR, Leighton R, et al: Characteristics of the resuscitated out-of-hospital cardiac arrest victim with coronary heart disease. Circulation 1981; 64:977-984. 33. Kannel WB, Feinleib M: Natural history of angina pectoris in the Framingham Study: Prognosis and survival. Am J Cardiol 1972; 29:154-163. 34. CASS Principal Investigators and their Associates: Coronary Artery Surgery Study (CASS): A randomized trial of coronary artery bypass surgery. Survival data. Circulation 1983; 68:939-950. 35. National Center for Health Statistics: Surgical operations in short-stay hospitals: United States, 1978. Vital and Health Statistics, series 13, number 61. Washington DC: Govt Printing Office, 1982. 36. Parisi AF, Peduzzi P, Detre K, Shugoll G, Hultgren HN, Takaro T: Characteristics and outcome of medical nonadherers in the Veterans Administration Cooperative Study of Coronary Artery Surgery. Am J Cardiol 1984; 53:23-28. 37. Kennedy JW, Kaiser GC, Fisher LD, et al: Clinical and angiographic predictors of operative mortality from the Collaborative Study in Coronary Artery Surgery (CASS). Circulation 1981; 63:793-802. 38. National Center for Health Statistics: Vital Statistics of the United States, 1980. Volume II-Mortality, Part A. DHHS Publication No. (PHS) 85-1101. Hyattsville, MD: NCHS, US Public Health Service, 1985. 39. Weinstein MC, Stason WB: Cost-effectiveness of coronary artery bypass surgery. Circulation 1982; 66(suppl III):III-56-III-66. 40. Levin DC: Invasive evaluation (coronary arteriography) of the coronary artery disease patient: Clinical, economic, and social issues. Circulation 1982; 66(suppl III):III-71-III-79. 41. Stokey E., Zeckhauser R: A Primer for Policy Analysis. New York: W.W. Norton, 1978; 89-1 14. 42. Drake AW, Keeney RL, Morse PM: Analysis of Public Systems. Cambridge, MA: MIT Press, 1972. 43. Pliskin JS, Tell EJ: A dialysis need forecasting model: a retrospective evaluation. Med Decis Making 1983; 3:489-500. 44. Luginbuhl WH, Forsyth BR, Hirsch GB, Goodman MR: Prevention and rehabilitation as a means of cost containment: the example of myocardial infarction. J Public Health Policy 1981; 2:103-115. 45. Foster ED, Fisher LD, Kaiser GC, et al: Potential for percutaneous transluminal coronary angioplasty before initial and repeat coronary artery bypass grafting in the Coronary Artery Surgery Study (CASS) Registry population. Am J Cardiol 1984; 53:112C-1 15C. 46. Kennedy JW, Ritchie JL, Davis KB, Stadius ML, Maynard C, Fritz JK: The western Washington randomized trial of intracoronary streptokinase in acute myocardial infarction: a 12-month follow-up report. N Engl J Med 1985; 312:1073-1078. 47. The TIMI Study Group: The Thrombolysis in Myocardial Infarction (TIMI) Trial. Phase I findings. N Engl J Med 1985; 312:932-936. 48. Patrick CH, Palesch YY, Feinleib M, Brody JA: Sex differences in declining cohort death rates from heart disease. Am J Public Health 1982; 72:161-166. 49. Weinstein MC, Stason WB: Cost-effectiveness of interventions to prevent or treat coronary heart disease. Ann Rev Public Health 1985; 6:41-63.
AJPH November 1987, Vol. 77, No. 11