SAS Group SAS Group Financial Update January‐February 2010 Analyst presentation, March 30, 2010 Analyst presentation, March 30, 2010
Not for release, publication or distribution in Australia, Canada, Japan or the United States 1
Disclaimer Neither these materials nor the presentation constitutes or forms part of any offer of securities in the United States or in any other jurisdiction. This presentation has been prepared by, and the information contained herein (unless otherwise indicated) has been provided by, SAS AB (“SAS”), to the best of its knowledge and belief, solely ( ) ( ) for the benefit of investment professionals and is provided in anticipation of SAS’ contemplated rights offering. These materials are being supplied to you solely for your information and for use at the presentation to analysts. The presentation, these materials and their contents are confidential and may not be reproduced, redistributed or passed on, directly or indirectly, to any other person or published, in whole or in part, by any medium or for any purpose. Neither these materials nor the presentation constitutes or forms part of any offer or invitation to sell or issue, or any solicitation of any offer to purchase or subscribe for, or any offer to underwrite or otherwise acquire any shares in SAS or any other securities nor shall they or any part of them nor the fact of their distribution or communication form the basis of, or be relied on in connection with, any contract, commitment or investment decision in relation thereto. Any such offer of securities would be made, if at all, by means of a prospectus or offering memorandum to be issued by SAS. Any decision to purchase securities in the context of any offering should be made solely on the basis of information contained in the final form of any prospectus, offering memorandum or other document published in relation to such an offering and any supplements thereto. d h d bl h d l h ff d l h The presentation and these materials are directed only at (i) persons who are outside the United Kingdom, (ii) investment professionals falling within Article 19(5) of the Financial Services and Markets Act 2000 (Financial Promotion) Order 2005 (as amended) (the “Order”), (iii) persons falling within Article 49(2)(a) to (d) of the Order (high net worth companies, unincorporated associations, etc.) or (iv) persons to whom an invitation or inducement to engage in investment activity (within the meaning of Section 21 of the Financial Services and Markets Act 2000) in connection with the offering may otherwise lawfully be communicated (all such persons together being referred to as "Relevant Persons"). These materials are directed only at Relevant Persons and must not be acted on or relied on by persons who are not Relevant Persons. Any investment or investment activity to which these materials relates is available only to Relevant Persons and will be engaged in only with Relevant Persons. This presentation and these materials contain forward‐looking statements, which are subject to risks and uncertainties because they relate to expectations, beliefs, projections, future plans and strategies, anticipated events or trends and similar expressions concerning matters that are not historical facts. Such forward‐looking statements involve known and unknown risks, uncertainties i i i d d d i il i i h hi i lf S hf d l ki i l k d k ik i i and other factors, which may cause the actual results, performance or achievements of SAS or the industry in which it operates, to be materially different than any future results, performance or achievements expressed or implied by such forward‐looking statements. Given these risks, uncertainties and other factors, recipients of these materials are cautioned not to place undue reliance on these forward‐looking statements. The forward‐looking statements referred to above speak only as at the date of the presentation. SAS will not undertake any obligation to release publicly any revisions or updates to these forward‐looking statements to reflect future events, circumstances, anticipated events, new information or otherwise except as required by law or by any appropriate regulatory authority. The information included in this presentation may be subject to updating, completion, revision and amendment and such information may change materially. No person, including SAS and its advisors, is under any obligation to update or keep current the information contained in the presentation and these materials and any opinions expressed in relation thereto are subject to change without notice. Neither SAS nor any of its advisors (including the joint global coordinators) make any guarantee, representation or warranty, express or implied, as to the accuracy, h ith t ti N ith SAS f it d i (i l di th j i t l b l di t ) k t t ti t i li d t th completeness or fairness of the information and opinions contained in this presentation, and no reliance should be placed on such information. None of SAS, its advisors, its directors, officers or employees accept any responsibility or liability whatsoever for any loss howsoever arising from any use of this presentation or its contents or otherwise arising in connection therewith. This presentation includes market share and industry data obtained by SAS from industry publications and surveys and internal SAS surveys. SAS does not have access to the facts and assumptions underlying the numerical data, market data and other information extracted from publicly available sources. As a result, SAS is unable to verify such numerical data, market data and other information. SAS assumes no responsibility for the correctness of any market share or industry data included in this presentation. Neither these materials nor this presentation is an offer of securities for sale in the United States or in any other jurisdiction. The securities contemplated to be offered by SAS will not be registered under the U.S. Securities Act of 1933, as amended (the “Securities Act”) and may not be offered or sold in the United States except to qualified institutional buyers as defined in Rule 144A d th S 144A under the Securities Act in reliance on Rule 144A or another exemption from, or transaction not subject to, the registration requirements of the Securities Act. No securities of SAS will be iti A t i li R l 144A th ti f t ti t bj t t th i t ti i t f th S iti A t N iti f SAS ill b registered under the applicable securities laws of any state or jurisdiction of Canada, Australia or Japan and, subject to certain exceptions, may not be offered or sold within Canada, Australia or Japan or to or for the benefit of any national, resident or citizen of Canada, Australia or Japan. By attending this presentation or by accepting any copy of the materials presented, you agree to be bound by the foregoing limitations.
2 Not for release, publication or distribution in Australia, Canada, Japan or the United States
Weak result Q1 as expected – unit cost significantly down as cost savings takes effect unit cost significantly down as cost savings takes effect
January‐February financial update published in order to provide the market with updated financial and January‐February financial update published in order to provide the market with updated financial and operating information prior to launch of rights issue January‐February results, EBT before non‐recurring items1, MSEK –960 in line with Core SAS plan • January and February are the weakest months of the year in terms of traffic revenue • Yield still under pressure Core SAS cost program on track, additional MSEK 800 implemented since year end • Unit cost2 down 7.0 %, RASK down 4.7% First quarter EBT before non‐recurring items1 estimated to be approximately SEK –1bn Preconditions for rights issue satisfied •Final agreement signed on March 12 with pilot and cabin crew unions of MSEK 500 in annual cost savings bi i f MSEK 500 i l t i •Refinancing of SEK 2 bn secured through issue of new bonds and convertible bonds offering of SEK 1.6 bn
1 2
In continuing operations. Currency and fuel adjusted for Scandinavian Airlines.
3 Not for release, publication or distribution in Australia, Canada, Japan or the United States
January‐February results
– in line with the Core SAS plan in line with the Core SAS plan Jan‐Feb 2010
Jan‐Feb 2009
Q1 2009
Revenues
5,888
6,951
11,296
EBT before non‐recurring items (continuing operations)
–960
–420
–889
EBT‐margin g
–16.3%
–6.0%
–7.9%
Income before tax in continuing operations
–1,048
–415
–979
Result development (MSEK)
First quarter 2010 estimate for EBT before non‐recurring items of approximately SEK –1bn
4 Not for release, publication or distribution in Australia, Canada, Japan or the United States
A strong common effort by our unions and employees by our unions and employees Final agreement of MSEK 500 in cost savings in collective agreements signed savings in collective agreements signed with pilot and cabin crew unions on March 12, 2010 • Includes salary reductions, reduction in pensions, allowances etc 3,100 FTE of 4,600 FTE reduced Total cost saving measures from union agreements in 2009‐2010 of SEK ~2 bn Achieved without any disruptions and with continued high quality in production SAS was the most punctual airline in SAS was the most punctual airline in Europe in 2009 5 Not for release, publication or distribution in Australia, Canada, Japan or the United States
Core SAS cost savings program ‐ extended to SEK 7.8 bn extended to SEK 7 8 bn from March 2010 from March 2010 FTE reduction increased from 3 000 to 4 600¹ 3,000 to 4,600
Annual effect (SEK bn)
2.0
4.0
Main initiativess
Original Core SAS cost program Feb 09
Union agreements Sales & Admin Purchasing Reorganization Flight operations
05 0.5
0.5
7.8
0.8
3.8
Added in Aug 09
Added in Nov 09
New initiatives Feb 10
New initiatives Mar 10
Total cost reduction program from Mar 10
Procurement in technical operations SGS/Blue1/ Widerøe
Admin and other Union agreements
Procurement related Admin SAS Tech improvements Productivity improvements
Final agreement with pilot and cabin crew unions valid from April 1
Reported as one cost program in 2010
1 Includes employee reductions from both the cost reduction program and capacity reduction.
6 Not for release, publication or distribution in Australia, Canada, Japan or the United States
Mats Lönnqvist Mats Lönnqvist CFO SAS Group
7 Not for release, publication or distribution in Australia, Canada, Japan or the United States
Core SAS cost savings program on track – significant unit cost reduction and improved results development in March 2010 significant unit cost reduction and improved results development in March 2010
Yield still under pressure but partly offset by improved load factor • Yield (currency adjusted) down 12.2% 1 • Load factor improved 5.0 p.u.2 • RASK down 4.7% 3 Improved results development expected in March, EBT estimate for the first quarter of approximately Improved results development expected in March EBT estimate for the first quarter of approximately SEK –1 bn Negative effects of currency exchange rates of total MSEK –719, compared to Jan‐Feb in 2009 Core SAS cost savings program of SEK 7.8 bn on track with 7.0% unit cost4 reduction during period Positive cash flow from operating activities Strengthening of the balance sheet through: Strengthening of the balance sheet through: • Issue of bonds (EUR) on the EMTN market with an aggregate principal amount of MEUR 60 (~MSEK 600) • SEK 1.6 bn offering due 2015 of convertible bonds on March 19, 2010 • Issue of bonds with an aggregate principal amount of SEK 1 bn secured on March 30, 2010
1 For Scandinavian Airlines compared to the same period in 2009. It should be noted that the yield was positive in Jan‐Feb 2009 primarily due to higher fuel surcharges imposed in early 2009. 2 For SAS Group, compared to the same period in 2009. 8 3 For Scandinavian Airlines, compared to the same period in 2009. Not for release, publication or distribution in Australia, Canada, Japan or the United States 4 For Scandinavian Airlines compared to the same period in 2009, currency and fuel adjusted.
Improving load factor but still pressure on yields still pressure on yields SAS Group p
Jan‐Feb Jan Feb 2010 2010
Traffic (RPK)
–4.1%
Passenger load factor Passenger load factor
+5 0 p u +5.0 p.u.
Scandinavian Airlines Yields (RPK), currency adj
–12.2%1
Total traffic rev / ASK
–4.7%
Fuel adj. unit cost
–7.0%
1 It should be noted that the yield was positive in January‐February
2009
primarily due to higher fuel surcharges imposed in early 2009.
9 Not for release, publication or distribution in Australia, Canada, Japan or the United States
Seasonally weak period, EBT MSEK – 960 but large cost reductions particularly in payroll expenses but large cost reductions, particularly in payroll expenses
Jan‐Feb 2010
Jan‐Feb 2009
Total operating revenue
5,888
6,951
Fuel
– 919
– 1,124 1 124
Government charges
– 655
MSEK
– 691
Payroll expenses
– 2,4341
– 2,9502
Other operating expenses operating expenses
– 2,141 2 141
– 1,931 1 931
Total operating expenses
– 6,149
– 6,696
EBITDAR before non‐recurring items
– 261
255
Leasing costs aircraft Leasing costs, aircraft
– 314 314
– 496 496
EBIT
– 865
– 517
EBT before non‐recurring items
– 960
– 420
1
Includes restructuring costs of MSEK 59 (Total restructuring cost amount to MSEK 68 in January‐February 2010)
2
Includes restructuring costs of MSEK 0 (Total restructuring cost amount to MSEK 0 in January‐February 2009)
Note: All figures are not currency adjusted
10 Not for release, publication or distribution in Australia, Canada, Japan or the United States
Significant changes in currency exchange rates affected the result by MSEK 719 compared to the same period in 2009 affected the result by MSEK – 719 compared to the same period in 2009
Currency effects MSEK on SAS Group, continuing operations: 2010 vs. 2009 Positive impact on revenues due to a significantly stronger NOK to SEK Positive impact on other operating costs mainly due to the weaker USD to SEK Weaker USD to SEK affected certain Weaker USD to SEK affected certain hedging arrangements negatively Weaker EUR to SEK affected net financial items, related to certain loan agreements with Spanair ith S i in January 2009 i J 2009
Jan‐Feb 2010 50
Total revenue
155
Total costs Forward cover costs & working capital
– 769
Income before depreciation
– 564
Financial items
– 155
Income before tax
– 719
11 Not for release, publication or distribution in Australia, Canada, Japan or the United States
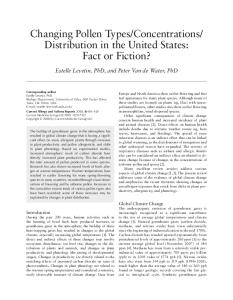
55% of targeted cost saving measures are already implemented are already implemented…
g Core SAS cost savings program (MSEK) Additional MSEK 800 implemented, taking the total to SEK 4 3 bn or 55% total to SEK 4.3 bn or 55% • Mainly purchasing related, e.g., new agreements with MRO and IT suppliers Additional 200 FTE reduced, Additional 200 FTE reduced taking the total to 3,100 or 67% of the planned reduction of 4,600 FTE Additional earnings effect Additional earnings effect of MSEK 450 as of February 28 with remaining effects of SEK ~5.2 bn in 2010‐2012 Unit cost1, down 7.0% 1 For Scandinavian Airlines compred
Potential
Implemented Dec 2009 Feb 2010
~1,900
~650
~750
~900
~400
~450
~1,800
~750
~850
Sales, marketing & Commercial
~600
~400
~550
Purchasing
~400
~100
~300
Blue1, Widerøe, Cargo Blue1, Widerøe, Cargo
600 ~600
450 ~450
450 ~450
~1,500
~700
~900
~100
~50
~50
~7,800
~3,500
~4,300
Cabin crew/Flight deck Ground services SAS Tech
Administration Other Total
with the same period in 2009, currency and fuel adjusted.
12 Not for release, publication or distribution in Australia, Canada, Japan or the United States
…leading to a large decrease in unit cost mainly due to lower cost for personnel and technical maintenance mainly due to lower cost for personnel and technical maintenance Volume, currency and method adjusted unit cost, Scandinavian Airlines, MSEK Unit cost
–7%
Payroll expenses
5,207
4,857
Jan‐Feb 2009
Jan‐Feb 2010
Technical maintenance
Leasing costs for aircraft costs
–31%
–22%
–10% 10% 2,229
2,016
462
319
369
289
Jan‐Feb 2009 Jan‐Feb 2009
Jan‐Feb 2010 Jan‐Feb 2010
Jan‐Feb 2009 Jan‐Feb 2009
Jan‐Feb 2010 Jan‐Feb 2010
Jan‐Feb 2009 Jan‐Feb 2009
Jan‐Feb 2010 Jan‐Feb 2010
13 Not for release, publication or distribution in Australia, Canada, Japan or the United States
Amortization profile of interest bearing liabilities of interest‐bearing liabilities SEK bn
4,4 4,4 3.5
Including syndicated revolving credit facility of 366 MEUR (utilized amount 240 MEUR) f 366 U ( ili d 240 U )
3.5
New bond of SEK ~ 1 bn Convertible bond
TBD
1.9
1.4 14 1.4
2010
2011
1.6 1,5
60 MEUR EMTN
1.7
1.2
1.7
0.6
2012
2013
0.3 0.3
0.3
2014
2015
0.6
0.2 0.2
0.2 0.2
2016
2017
2018
>2018 14
Not for release, publication or distribution in Australia, Canada, Japan or the United States
Transaction overview and indicative timeline for the rights issue and indicative timeline for the rights issue
Offering summary
Transaction structure: rights issue with pre Transaction structure: rights issue with pre‐emptive emptive rights for existing shareholders rights for existing shareholders Size: approx. SEK 5 billion Shares offered: Ordinary shares (pari passu with existing) Terms: subscription ratio and price expected to be announced on April 6, 2010 Listings: NASDAQ OMX Stockholm, NASDAQ OMX Copenhagen, Oslo Børs Joint Global Coordinators: J.P. Morgan, Nordea, SEB Enskilda Joint Lead Managers and Joint Bookrunners: J.P. Morgan, Nordea, SEB Enskilda, DnB NOR Markets, The Royal Bank of Scotland Co‐Lead Manager: Danske Markets
Use of proceeds
Strengthening of SAS's liquidity position Support implementation of remaining parts of Core SAS strategy
Indicative Timetable
6 April : Subscription price and subscription ratio are decided and announced th through a press release h l 7 April: Annual General Meeting 9 April : Publication of the prospectus 12 April : Record date for participation in the rights issue 15 April – 29 April: Subscription period 5 May: Announcement of outcome 15 Not for release, publication or distribution in Australia, Canada, Japan or the United States