Final Technical Report The Project on Remote Sensing Technologies for Ecosystem Management Treaties: A Case Study of Laguna Merín and Associated Wetlands John Mickelson (Land Information Specialist) CIESIN, Columbia University E-mail: john.mickelson @ciesin.columbia.edu Project Funded by the Department of State Grant DSS-LMAQM-03-H-0042
Introduction One of the purposes of the Project on Remote Sensing Technologies for Ecosystem Management Treaties is to inform national agencies in Brazil and Uruguay of the utility of remote sensing technologies for aiding decision support, treaty monitoring and transboundary conservation. The first component of this project resulted in a report documenting the utility of remote sensing for multilateral environmental agreements and trans-boundary conservation (de Sherbinin, 2005). In this report, we document the second component, a pilot application of remote sensing data and methodologies for Landsat WRS scene 222-83. This image captures much of Laguna Merín (Lagoa Mirim in Portuguese), a large freshwater lake that straddles the border between Brazil and Uruguay. Field work and calibration activities focused on two test sites: the eastern region of the Bañados del Este in northeastern Uruguay and the Arroio del Rei, south of the Taím Ecological Reserve in southern Brazil. These sites are located on opposite sides of border, within the southern portion of the lake. Products for the test sites are included within the complete Landsat scene classification.
-----------------The author wishes to acknowledge the valuable contributions of colleagues at IBAMA (Valdir Steinke, Christian Bierlink and Amauri de Sena Motta), PROBIDES (Gonzalo Picasso, Rosario Beyhaut, Eduardo Marchisi, Nestor Pérez, Gonzalo Picasso, Carlos Prigioni, Gustavo Sensión, and Alicia Torres),the US Fish and Wildlife Service (Frank Rivera), the University of Florida (Ignacio Porzecanski), and the Federal University of Rio Grande do Sul (Joao Meneghetti) in providing data or information that contributed to this report. He also wishes to express his gratitude for project funding from the U.S. Department of State Bureau of Oceans, Environment and International Scientific Affairs (OES) and to Alex de Sherbinin of CIESIN for his oversight, guidance and support. Additional reports and data for the Project on Remote Sensing Technologies for Ecosystem Management Treaties are available for download from the project website at: http://sedac.ciesin.columbia.edu/rs-treaties/laguna.html.
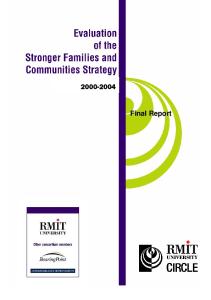
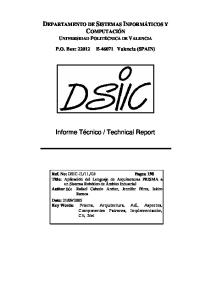
Background/Study Area The Laguna Merín (LM) watershed was our feature of interest, though time and resource limitations required that that we focus preliminary efforts within representative landscape examples from each side of the international border. Two roughly equal 40km x 40km regions, one each on either side of the national border dividing the lake (Panel 1B) were outlined for this phase of the project. Seasonally-timed field surveys conducted in March and October 2004 focused field reconnaissance and surveys within these regions. The hope was that patterns calibrated within the imagery of these areas could be extrapolated to similar features within the larger Landsat image. The international boundary between Brazil and Uruguay dissects the lake near its southern half (Panel 1B). While nearly 80% of the footprint and 63% of the coastline of Laguna Merin lies within the territory of Brazil (Table 1), nearly the opposite dynamics apply for the entire catchment draining into the lake (Image 1). The majority, (66%) of the catchment area, is located within Uruguay territory with 34% found within Brazil.
Brazil
#
A
B
Panel 1. Study Area A. Southeast boundary region of Brazil and Uruguay. B. Nested regions: Landsat World Reference System scenes covering LM- Path\Rows – upper right, 221-22, lower right, 221-23, upper left 222-22 and the scene chosen, 222-83. Nested internally are two polygons representing ~40x40km bi-national study focus sites. Laguna Merin is in the center
Background assessments of the region were predicated on the desire to establish, understand and map the spatial and temporal dynamics of important biological features, patterns and processes within the area as well as the stresses and threats to the systems. Through early project meetings and literature searches, it was established that one of more important functions that the region serves as is a stop-over for migratory water, wading and shorebirds (Birdlife International, 2006; Olivas, 1997; Ramsar Convention, 2000; PROBIDES 1997 and 1999) Also, the wetland complexes found within this region support a high proportion of the biodiversity
Brazil Uruguay
Image 1. Laguna Merin Watershed Boundary
Feature
Size (approximate)
Laguna Merin – (LM) watershed Area within Brazil Area within Uruguay Laguna Merin – Area Laguna Merin – Shoreline km. Area LM in Brazil Area LM in Uruguay Km. LM Coastline Brazil Km. LM Coastline Uruguay Bi-National Study areas (2) Landsat scene WRS 222-83
46,630 sq. km.
15719 sq. km. (34 %) 30911 sq. km. (66 %) 3990 sq. km. 844 km. 3115 sq.km (78 %) 875 sq. km (22%) 528 (63 %) 315 km (37%) 1,600 sq. km (ea.) 30,231 sq. km
Source Watershed basin built internally with GTopo30 (enhanced) 1km DEM “ “ GIS analysis, internal GIS analysis, internal GIS analysis, internal GIS analysis, internal GIS analysis, internal GIS analysis, internal GIS analysis, internal
Table 1. Laguna Merin Watershed divisions
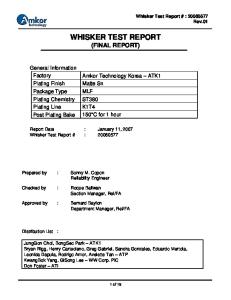
found within Uruguay (Olivas, 1997; PROBIDES, 1999; Rilla, 2000). Finally, in the face of increasing habitat encroachment and agricultural development, wetland conversion and habitat fragmentation looms as an important issue for resident aquatic and terrestrial faunal communities (Arrarte and Carlato, 1999; Olivas, 1997; PROBIDES, 1999; Ramsar Convention, 2000; Rilla, 2000). The region is climatically temperate, with evenly distributed annual rainfall on the average (Baethgen, 2004; INIA, 2005), though inter-annual variability can be great (Figure 1). The dominant ecosystems are grassland/pampas systems mixed with abundant wetlands and surface water. Very little original tree cover is left, except along riparian corridors (Arrarte and Carlato, 1999). Seasonal temperatures are moderate and relief is limited. Poor overall soil quality has historically limited agricultural production, partially explaining the prevalence of cattle ranching and livestock production within the region (Arrarte and Carlato, 1999). Modern use of fertilizers and irrigation technology over the past 20 years has greatly amplified the ability of farmers to expand the range of crops produced, with rice surpassing wheat production in the 1980s (Library of Congress, undated), especially in Uruguay.
3
Figure 1. Average monthly rainfall (mm). Uruguay station Treinte y Tres 1972-2003. Source INIA, Instituto Nacional de Investigacion Agropecuaria http://www.inia.org.uy/
Not surprisingly, it is water, and especially surface and soil inundation patterns and the systems dependant on water, that create characteristic and diagnostic signals of use when mapping this region with satellite data. The timing, quantity, quality, energetics, sediment and pollution loading, habitat and soil impacts of the hydrological cycle are all important components to regional system pattern and integrity. This cycle affects biological diversity, ecosystem function, quality of human life and agricultural productivity alike. It is the high range of variability and predictability in this pattern, both inter- and intra-annually that has made mapping the region challenging.
Conservation Targets: Based on meetings and outreach activities with partners, regional experts and stakeholders, we developed a draft set of conservation targets. The group agreed that the study region has been heavily impacted by human activities, and especially rice farming and cattle ranching. The range and type of remaining habitats thought to be of importance for regional species were cross-referenced to local, established conservation needs (IBAMA, 1997, 1999; Rilla, 2000). The following emerged as amongst the more valuable ecological systems for which we felt our work could provide useful information. 1. The Lagoon proper a. As a defining feature to the region b. Both source and sink of hydrological system i. Agriculture – irrigation source, reservoir, receptacle for run-off ii. Environmental systems 1. Aquatic fauna and flora habitat 2. Sustains riparian communities (one of last remaining semi-intact systems) iii. Commercial system for regional fisheries
4
2. Sand dunes, beaches, shorelines a. Nesting, feeding, breeding, perching, resting habitat for shore, wading, water fowl 3. Seasonally flooded vegetation and wetlands a. Seasonal flood plains provide important intermittent nutrient, detritus, sediment pulses b. High productivity systems c. Sensitive to both short and long-term hydrological disturbances (dry-down, flooding, vegetation sustainability, soil biogeochemical dynamics) 4. Riparian gallery forests (primarily on the Uruguayan side) a. One of few remaining, minimally disturbed systems within the region b. Among last remaining natural forested systems c. Habitat for arboreal fauna, birds, amphibians, etc.. d. Important buffer strips mitigate riparian sediment and nutrient intrusion from upslope cropping systems and run-off. 5. Dry upland forests (possibly including plantations). a. Poorly understood, ecologically 6. Rice/pasture matrices a. Dominant landscape change feature short/long term b. Ecological role poorly studied and understood (though potentially important)
System Gradients Accepting water as the dominant apparent landscape change feature and the principal agent driving vegetation response (of both managed crop/pasture and natural systems), we set about to map regional ecosystem patterns and processes as gradients of water/inundation and vegetation. Looking at vegetation, we assumed classes would grade from one end of a spectrum, permanent/tall (closed canopy tree systems, down to permanent scrub/shrub, and tall grass), to the other, seasonal/short (seasonally planted grass/crop lands). Hydrologically the range grades from deep, permanent standing water (marine, lake, river, stream, pond) to seasonal/shallow (seasonally flooded, intermittent floodplains and crop systems). The inbetween systems, those of medium-short height and intermittent (seasonal) inundation are of prime interest. The biogeochemical pulses of nutrients, sediments, and detritus found here are what makes these systems among some of the richest and most important in nature (Ellis, 2004; Sabo et al., 2005). Alluvial leaching and deposition of annual and inter-annual water courses can dramatically affect the productivity and function of both the managed and natural systems (Valett et al., 2004) and their functions as faunal habitat. The extent of seasonal inundation and permanent vegetation would be among the more important map components.
Key Patterns: Variability of Surface Inundation Depending on climate, length of season and water availability, there can be reasonable synchronicity and uniformity among the timing and extent of preparation, planting, phenology and harvesting periods of a particular crop for a given region. In such systems, many or most agents responsible for crop production tend to perform crop management within a similar time window, so that imagery can later capture synoptic and diagnostic crop phases over an entire watershed. But rice production for given plots within the study region 5
commonly includes a wide range of timing of inter-annual planting onsets (FAO, 2004). Also there is nearly always a rotation of several years between active rice cropping (2-3 years) on a particular field, after which it is allowed to fallow, grow over and then be grazed by cattle (FAO, 2004). The timing of the advent of this rotation, from one field to the next, appears to be temporally and spatially random or unpredictable, for any given year. The resulting variance in temporal and spectral patterns between these non-uniform plowing, flooding, seeding, growing, harvesting and pasturing epochs, makes mapping the actual footprint of rice fields problematic. We therefore chose an alternate strategy. Rather than map the more heavily impacted lands, we would map the systems and dynamics of permanent habitat and conservation interest (riparian forests, shorelines) and systems experiencing inter-annual flooding and inundation.
Data Selection Within the past decade, the capabilities of modern remote sensing classification and image processing methods and systems have extended our ability to use patterns derived not only from two and three dimensions (X, Y and Z), but now also from the fourth dimension, time. Our interest was in capturing and utilizing apparent intra-annual landscape changes from within the region to maximize detail in our land cover product. Three seasonal phases – driest, wettest and an intermediate phase – originally seemed apparent. But upon investigation, the range of unexplainable variability within and between the hydrological responses for each land cover unit added greater complexity to the classification model. With calibration and ground-truthing data a limiting factor, we chose the most recent, available, near-cloud-free, satellite imagery capturing the single wettest and driest landscape phases of imagery from within a single year. The chosen scenes were from September 26 and December 31, both from 2000. Landsat data were chosen due to a number of factors. High spectral, spatial and temporal dimensions; a deep historic imagery archive; high value to cost ratio; broad cross-application validation and ease of access were among them. In addition, a wide array of ancillary and reference information was gathered and used from among the project partners. Global and regional vector and raster data representing country boundaries, shorelines, cities and settled areas, elevation (DEM), streams, soils, conservation and protected areas, were among those used.
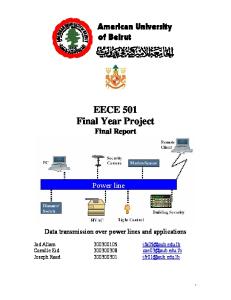
Satellite Data As is often-times the case in remote sensing studies, our desired study area fell within the juncture of 4 Landsat scenes: WRS Path/Row 221-82, 221-83, 222-82, and 222-83 (Panel 1B.). Since the international boundary dividing LM ran through scene 222-83, and a reasonable representation of cover types appeared to exist across borders, we chose a Landsat 7 ETM+ scene each from September 26 and December 31, 2000 (Panel 2.). Data were obtained as Level 1G Systematically corrected NLAPS data, UTM WGS84, 30m pixels, from the USGS Eros Data Center (EDC), referenced to World Reference System II (WRS-2) Path/Row 222/83.
6
Sensor
Date
Scene
Details
L7ETM+ L7ETM+ L7ETM+ L7ETM+
June 12, 2002 Sept. 26, 2000 Nov. 11, 2002 Dec. 31, 2000
222-83 222-83 222-83 222-83
UTM WGS84 m 30m UTM WGS84 m 30m UTM WGS84 m 30m UTM WGS84 m 30m
L5 L5 L5
June 10, 1987 Sept. 09, 1986 Nov. 11, 1984
222-83 222-83 222-83
UTM WGS84 m 30m UTM WGS84 m 30m UTM WGS84 m 30m
Table 2. Landsat data acquired by project
Landsat 7 ETM+ LE7_061202 – Intermediary wetness LE7_092600 – Wet Phase LE7_111902 – Dry Phase LE_123100 – Driest Phase
Landsat 5 TM L5_051087 Intermediary wetness L5_091286 Wet Phase L5_112584 Dry Phase
Table 3. Scene selection and seasonal phases across Landsat platforms.
Panel 2. Landsat 7 ETM+ images: Sept. 26, 2000 (bands 3,2,1) and Dec. 31, 2000 (bands 3,2,1)
Ground Truthing Field surveys carried out in March and October 2004 were an excellent and highly valuable kernel around which a longer term inventory of regional biodiversity can be compiled (data from the sample plots are available for download from the project website). Unfortunately, the placement and documentation of the remote sensing “ground truthing” portion of the field plot data were not optimal for calibration and testing of the image analysis. Ideally, ground control plots for these types of studies are located well within the boundaries (within 150m from the edge) of differing cover types. Locating plots centrally within homogeneous cover types yields greater confidence in the ground control data when considering image pixel spatial errors (nominally 1 pixel or 30m) and GPS errors. But the desire to describe maximum biotic diversity by the field team led to many plots being acquired at the spatial intersection between 2, 3 and even 4 ecotones. Pictures acquired during the field phase did prove highly valuable in aiding the visualization of map unit composition and vegetation structure. 7
Ancillary Data Our understanding of seasonal vegetation responses to climate variability within the region were greatly aided by the use of monthly Advanced Very High Radiometric Radiometer (AVHRR) vegetation Normalized Difference Vegetation Index (NDVI) composites obtained through Uruguay’s Instituto Nacional de Investigacion Agropecuaria (INIA) (Panel 3). These images show relative vegetation amount and greenness by month.
Panel 3. Maximum NDVI for the months October 1999-March 2000 (source: http://www.inia.org.uy/disciplinas/agroclima/lasat/ndvi.html).
A simple regional watershed basin model was constructed using enhanced 1km GTopo30 digital elevation data for the region. A rough though reasonable depiction of the extent of the LM drainage basin was generated (matching reasonably well the location and shapes of regional drainage networks), from which the country breakouts (area, % occurring within Brazil and Uruguay) presented previously were derived (Table 1 and Image 1). Early on in the project we considered the potential value and utility of a change product, with which to evaluate transformations occurring between the mid-1980s and the early 21st century. We obtained similarly timed Landsat 7 ETM+ and Landsat 5 TM data from the midlate 1980s and early 2000’s (Table 3). An early round of pre-processing and Iterative SelfOrganizing Data (ISODATA) clustering was performed, though time and resources prevented the detailed analysis of these data. The unprocessed imagery are available from the project website.
8
Image Preparation The September and December 2000 Landsat scenes were co-registered to within a nominal .5 pixel RMS error. Relief within the region is not extreme and high-quality DEMs were not available with which to perform ortho-rectification, so terrain correction was not performed. Checks of linear features and spatially and spectrally invariant features within each date matched well. Next, a range of derived products were generated from each image, with the intention to maximize land cover pattern and map unit uniqueness, seperability and signal across the range of gradients of vegetation and inundation found within differences between the two scenes. From each image, seven additional bands were created: a Normalized Difference Vegetation Index (NDVI) layer, the first three bands from a Principal Components analysis (PCA1, PCA2, PCA3) and the first three bands from a Tasseled Cap analysis (TCA1, TCA2, TCA3) (Table 4). Layer\Band 1 2 3 4 5 6 7 8 9 10 11 12 13 14 15 16 17 18 19 20 21 22 23 24 25 26 Table. 4
Source ETM_B1 ETM_B2 ETM_B3 ETM_B4 ETM_B5 ETM_B7 Derived Derived Derived Derived Derived Derived Derived ETM_B1 ETM_B2 ETM_B3 ETM_B4 ETM_B5 ETM_B7 Derived Derived Derived Derived Derived Derived Derived
Variable reflectance reflectance reflectance reflectance reflectance reflectance NDVI PC1 PC2 PC3 TC1 TC2 TC3 reflectance reflectance reflectance reflectance reflectance reflectance NDVI PC1 PC2 PC3 TC1 TC2 TC3
Date ETM092600 ETM092600 ETM092600 ETM092600 ETM092600 ETM092600 ETM092600 ETM092600 ETM092600 ETM092600 ETM092600 ETM092600 ETM092600 ETM123100 ETM123100 ETM123100 ETM123100 ETM123100 ETM123100 ETM123100 ETM123100 ETM123100 ETM123100 ETM123100 ETM123100 ETM123100
Range Wet Season
Dry Season
Final 26 Band layer stack image sequence used for classification.
Then the 13 bands from each of the image dates were layer-stacked to produce a single 26 band image. This image would then represent the full range of conditions and reflectance patterns found within the extremes of inundation states, allowing for the evaluation of those classes which are permanently inundated or vegetated and those which experience either inundation or green-up seasonally. 9
Classification A hybridized classification procedure was used to derive meaningful landscape units. Both image segmentation and traditional ISODATA clustering processes were involved. Since meaningful landscape units oftentimes exist at scales above that of a pixel or group of pixels, segmentation programs such as eCognition have continued to flourish, since they can produce map units based on metrics of similarity of both reflectance and spatial pattern. Outputs can be derived in the form of polygons which more closely approximate an intuitive (or cognitive) human understanding of landscape pattern. In our case we were able to produce units of landscape homogeneity which were similar both spectrally (with an underlying assumption of land cover uniformity) and spatially. These units could then be further spatially developed and enhanced based on assumptions and knowledge-bases of underlying conservation patterns and value (e.g. riparian corridor buffer zones, beach and sand systems adjacent to large, open water systems, etc.) (Panel 3).
Panel 3. Image segmentation example
The 26 band, bi-seasonal image stack was utilized in a number of eCognition runs, with a series of multi-resolution segmentations being performed. The intention was to balance the size, spatial pattern and uniformity of seasonally distinguishable processes that units would represent. Final polygon outputs were produced once patterns matching and understandable through the field work and expert knowledge were achieved. Output polygons contained the mean combined average reflectance (DN) value of all pixels within the polygon, for each of the 26 bands. In addition, an ISODATA clustering of the layer stack was performed using LeicaGeosystems ERDAS Imagine software (Image 2). Once again, the effort was to balance the need for detail with processing efficiency. The output classification of 100 spectrally separable classes was then compared to the field data and ancillary GIS data and interpreted to produce a final thematic output raster. Final map units were produced using a combination of the data products. The final product includes polygon units, constructed by the eCognition process, which have been calibrated to the cross-tabulated zonal statistics of the recoded 100 class raster image, taking advantage of the best of both datasets.
10
Image 2. ISODATA classification example
Results Of the initial conservation targets, final map units were upgraded as follows: 1. Laguna Merin proper and open water features a. Includes: marine, lake, rivers, streams, upland impoundments and permanent standing water tanks a. Derived spectrally, converted to polygon features by zonal statistics overlay of eCognition units and ISODATA raster classes. b. Labeled according to landscape position and size (marine, lake, river, inland impoundment/pond) 2. Sand Dunes, Beaches, Shorelines a. Includes some sand bar features within large riparian courses a. Derived spectrally, converted to polygon features by zonal statistics overlay of eCognition units and ISODATA raster classes. b. Overlap between bare earth, bare agriculture, dirt roads and berms, impervious surface and shoreline features, filtered spatially, through context specific proximity assessment with large, open water features 3. Seasonally flooded Vegetation and wetlands a. Important inter-annual change class b. Broken out well both through vector and raster processes. c. Derived spectrally, converted to polygon features by zonal statistics overlay of eCognition units and ISODATA raster classes. d. Important as nutrient and biogeochemical zones and hydrological connectivity. e. Potential need for breakout class, incorporating seasonal hydrological patterns, with varying levels of vegetation (see below). 4. Riparian Gallery Forests
11
a. Derived spectrally, converted to polygon features by zonal statistics and overlay of eCognition units and ISODATA raster classes. b. Last remaining natural forested systems c. Habitat for arboreal fauna, birds d. Important buffer strips mitigate riparian sediment and nutrient intrusion from upslope cropping systems and run-off. e. Corridors of permanent\seasonal water courses, bounded by vegetation. Class affiliation of adjacent polygon units external\adjacent to corridor proper, as riparian buffer zones. Arguably one of the more important conservation targets when considering ecological function (filtration), habitat composition and structure, ecosystem diversity. Could develop potential policy considerations and remediation strategies vis a vis agricultural practices by suggesting restoration of riparian vegetated strips through agricultural areas devoid of buffers (see below). 5. Dry Upland Forests including plantations a. Poorly understood, ecologically b. Preliminary analysis showed landscape footprint very limited within the region c. Minimal effort spend to refining map units for these features 6. Rice/Pasture matrices a. Dominant landscape change feature (decadal scales) b. Ecological role poorly studied and understood, though potentially important. c. Additional study required to understand inter and intra-annual changes, in order to map more accurately. d. Consideration of shift in dominant cropping practice, to more dry-ground rice farming (as is beginning to happen in southern Brazil), could have sizeable impact on ecological function and landscape water cycles. While processing the imagery and exploring landscape patterns in refinement of the classification, it became clear that a seventh category should be added to our list of import conservation targets. With water and hydrological connectivity playing such an important role within the region, our attention was drawn to the numerous drainage features and stream corridors that have had most apparent vegetation removed. Riparian buffer zones play critical roles, especially in agricultural and livestock pasture systems. Vegetated zones adjacent to streams and watercourses serve critical rolls by filtering runoff, taking up nutrients within deposited sediments, providing shade and canopy for stream courses (greatly improving conditions for faunal and macro-invertebrate communities), providing food to the stream and its communities through leaf and detritus, and by providing much needed habitat for a wide range of fauna. While our original work plan did not include breaking out these features, it is clear that they are very mappable. In addition, we think that important progress towards conserving and improving both regional habitat as well as water quality can be made through the investigation of restoration of key segments of important riparian and water courses. Efforts and successes of just such initiatives are well documented in the water quality literature (Groffman, 2003), and both on the ground restoration as well as agricultural manager education programs can have quick and measurable results. In addition to breaking out the above mentioned classes, a layer depicting the major agricultural zone, a region where seasonal flooding seemed to be most pronounced, was constructed. This region seems to approximate patterns found within the soils data provided by IBAMA, and with so long a history of active tillage and seasonal flooding, there is likely a 12
feedback between cropping and soil development. Consideration of potential riparian corridor restoration within this zone should be stressed, since the likelihood of sediment and accompanying contaminants, herbicides, pesticides and other agricultural run-off entering watercourses will be heightened within this region. Final map products have been formatted and made available for download via the project website.
Conclusions Most of the landscape of the Laguna Merín basin has been heavily modified by humans over the past 30 years. Informal appraisals of land cover trend patterns, comparing the 1984 Landsat 5 and the early 2000 Landsat 7 ETM+ imagery, showed that, within the two 40 km2 study areas, the footprint of rice production has changed little. It appears that this agricultural build-out had been accomplished by the time the early images had been taken. We know that the region is important for resident and migratory avian communities, especially the few remaining patches of unfragmented habitat. The last remaining components of local terrestrial and aquatic communities will no doubt need protection through the conservation, restoration and monitoring of ecosystems and biological resources. Based on early assessments of our field efforts, there appear to be a sufficient amount and quality of habitat and resources necessary to support populations of important indigenous flora and faunal species. Broad cross-agency and bi-national collaboration and partnerships for habitat protection, conservation and restoration, if implemented strategically, can ensure the long-term health and sustainability of the best of the region’s biological resources. Efforts underway at various levels – including among project collaborators at IBAMA and PROBIDES, and the 2004 inter-governmental “New Agenda for Cooperation and Frontier Development UruguayBrazil” which includes environmental issues (see http://www.crc.gub.uy/motivos.htm) – represent important steps for conserving remnants of the region’s natural habitat and ensuring that the area continues to support resident and passerine waterfowl, among other species of interest.
Future Work Hydrological studies of water quality, quantity, location, energetics and timing need to be undertaken and improved in order to understand this most important landscape variable. Now that reasonable quality (90m Shuttle Radar Topography Mission) DEM data are available, an integrated watershed and run-off model should be constructed, to better document the hydrological regime and its annual climate and human-induced patterns and variations. Water quality sampling needs to be coordinated across the watershed, to understand current conditions and monitor possible future trends or dynamics of importance. The roles, functions, impacts and tradeoffs involved with rice production within regional biotic cycles needs to be better understood. Especially when considering shifting modes of artificial (irrigated) landscape inundation and the potential impacts on migratory avian species. 13
Building on the valuable cross-national collaborations established with this project, it is our hope to leverage the work by encouraging increased cross-agency collaboration. Education and research partnerships at the university level can seek to fund shared graduate student positions, to further understanding of current environmental and agricultural status metrics. Technical outreach, technology transfer, training and data services can aid the development of robust and comprehensive information systems providing decision support to the region and surrounding areas. Coordination of data, mapping and conservation approaches with growing Open Source interoperability and shared international taxonomic standards can ensure that regional agencies can both access and provide content to a wide range of global observation systems. Integrated systems of natural resource conservation, bird monitoring networks, wetland and land cover databases can now be linked via detailed, threedimensional online mapping tools, to provide near real-time views on cities and continents as well.
References Arrarte, C. P. and G. Scarlato. (1999). The Laguna Merin Basin of Uruguay: From: Protecting Natural Heritage to Managing Sustainable Development. In Cultivating Peace:: Conflict and Collaboration in Natural Resource Management. D. Buckles. Ottowa, Canada, International Development Research Centre (IDRC). 99:300. Baethgen, W. E. (2004, 03/20/06). "Seasonal Climate Forecasts and Agricultural Sector of Uruguay." Retrieved 03/20/06, 2006, from http://iri.columbia.edu/climate/ENSO/societal/resource/example/Baethgen.html. Birdlife International (2006). Coastal Uruguay Marshes. Birdlife EBA OnLine Factsheets. Birdlife International. Retrieved 03/20/06, 2006, from http://www.birdlife.org/datazone/search/ebas_search.html?action=EbaHTMDetails.asp&sid=334&m=0
De Sherbinin, A. (2005). Remote Sensing in Support of Ecosystem Management Treaties and Transboundary Conservation. Palisades, NY: CIESIN at Columbia University. Available online at http://sedac.ciesin.columbia.edu/rs-treaties/RS&EMTreaties_Nov05_screen.pdf FAO. (2004). "Rice is Life: Uruguay." Rice Around the World Retrieved 03/20/06, 2006, from http://www.fao.org/rice2004/en/p19.htm. Groffman, P. M. a. M. K. C. (2003). "Denitrification Potential in Urban Riparian Zones." Journal of Environmental Quality 32 (May-June): 1144-1149. INIA, Instituto Nacional de Investigacion Agropecuaria (2006). Characterización Agroclimática- Estacion Treinta y Tres Precipitación acumulada - 1972 al Presente, INIA. http://www.inia.org.uy/, http://www.inia.org.uy/online/site/145524I1.php
Library of Congress, U. S. (Unknown). "Country Studies: Uruguay - Agriculture." Country Studies Online. Retrieved 03/20/06, 2006, from http://countrystudies.us/uruguay/55.htm. Ministry of Livestock, Agriculture and Fisheries (MGAP). Map of Bañados del Este Wetland Site. Available at http://www.mgap.gub.uy/Renare/SIG/CartaRAMSAR.htm Olivas, H. (1997). Uruguay Rice Exports and the Environment, American University – Online- Trade and Environment Database (TED). American University. http://www.american.edu/TED/hp1.htm http://www.american.edu/TED/uruguay.htm
14
PROBIDES (1997). Reserva de Biosfera Bañados del Este: Avances del Plan Director. PROBIDES. Rocha, Uruguay. 233 pp. PROBIDES (1999). Plan Director de la Reserva de Biosfera Bañados del Este. UNDP, GEF, MVOTMA, Rocha 152 pp. Ramsar Convention (2000). Information Sheet on Ramsar Wetlands - Bañados del Este, Wetlands International. Online: http://www.wetlands.org/RSDB/_COP9Directory/Directory/ris/6UY001en.pdf Rilla F. D. (2000) "Banados del Este Ramsar Site in Uruguay: Wetlands to Conserve." Global Biodiversity Forum - Session Documents Volume. http://www.gbf.ch/Session_Administration/upload/Francisco%20Rilla(1).doc
Parliament of Uruguay. 1977. Tratado Sobre Cooperación para el Aprovechamiento de los Recursos Naturales de la Cuenca de la Laguna Merín. Available at http://www.parlamento.gub.uy/htmlstat/pl/tratados/trat14748.htm
Sabo J.L., S. J., Dixon M, Gade K., Harms T, Heffernan J, Jani A., Katz G., Soykan C., Watts J., and J. Welter (2005). "Riparian Zones Increase Regional Species Richness Harboring Different, Not More, Species." Ecology 86(1): 56-62. Parliament of Uruguay, (1977). "Tratado Sobre Cooperación para el Aprovechamiento de los Recursos Naturales de la Cuenca de la Laguna Merín." Retrieved 03/17/06, 2006, from http://www.parlamento.gub.uy/htmlstat/pl/tratados/trat14748.htm
Valett, L.M.. et al.(2004). "Biogeochemical and Metabolic Responses to the Flood Pulse in a Semiarid Floodplain." Ecology Vol. 86(1): 220–234.
15