Feed Quality Assurance Programs for Feed Mills
Charles Stark, Ph.D. North Carolina State University
[email protected]
Use of trade names in this publication does not imply endorsement by the North Carolina Agriculture Research Service or the North Carolina Cooperative Extension Service of the products mentioned.
Types of Quality Programs ISO HACCP Safe Feed/Safe Food Comprehensive Quality Assurance Quality Control Program
National Grain and Feed Association
Presentation Objectives Define a Comprehensive Quality Assurance Program Outline Program Requirements Overview of QA/QC Testing Procedures Review Reporting Tools
Feeding Program Feeding Program Quality Assurance
Least Coast Formulation
Research
Performance
Ingredients
Matrix
University
Costs
Feed
Formula Specification
Field Studies
Animal Production
Quality Assurance Program Quality Assurance
Ingredient Specification
QA Lab
Feed Manufacturing
Regulatory & Certification
Nutrients Levels
Receiving
Receiving
FDA
Rejection Procedures
Analytical
Processing
Commercial Feed Law
Claims
Matrix Development
Finished Feed
HACCP, USDA Safe Feed/Safe Food
Comparison of QA Programs Commercial Feed Program
Pellet quality is critical Intense mycotoxin testing Feed guarantees Final product consistency Appearance Palatability
Shrink controls Profit from sale of weight Commercial feed laws
Integrated Feed Program
Pellet fines consistency Mycotoxin monitoring Nutrient requirements Optimal performance Profit from sale of animals or meat
Definitions Quality Assurance – comprehensive program of policies, procedures, and process controls that yield a consistent product. Quality Control – in-plant process measurements that insure quality parameters are met during receiving, manufacturing, and delivery.
Quality Assurance vs. Quality Control Quality Assurance Examples Management Tasks
1. 2. 3. 4. 5. 6.
Ingredient Specification Ingredient Analysis Plan Scale Testing Schedule Batch Tolerance Limits Medicated Sequence Finished Feed Assay Plan
Quality Control Examples Employee Tasks
1. 2. 3. 4. 5. 6.
Mycotoxin Assay Ingredient Moisture Particle Size Analysis Manufacturing Yields Conditioning Temp Set-point Pellet Quality
Quality Assurance Manual - Sections
Mission Statement Job Descriptions Training Program Quality Team Purchasing and Receiving Feed Manufacturing and Process Control Finished Feed Sampling, Inspection and Labeling Feed Shipment and Delivery Sanitation and Pest/Rodent Control Feed Product Investigations/Recalls Reports and Charts Critical Control Points Based on National Grain and Feed Association – Model Program and AFIA Safe Feed/Safe Food
Mission Statement At our company, quality assurance is a way of doing business, not simply a program. It requires a partnership effort and a continuing commitment on behalf of management and employees. Total quality management makes good business sense. It is one of the ways our firm differentiates its products and services in the highly competitive marketplace in which we operate, something that is vitally important to the continued success of our company and to those of us who work here.
Job Descriptions & Training Program Manager Supervisor Operators Task specific Competencies SOP training Evaluations Responsibilities
Document all training
Quality Assurance Teams A team should be formed to identify, evaluate, and control feed and food safety hazards.
PURCHASING AND RECEIVING
Quality Assurance Manual Purchasing and Receiving Overview/Objective Producing safe feed of desired quality starts with the grains and ingredients provided by suppliers. Purchasing and receiving standards represent the front line of defense in producing quality feeds. The quality of feed ingredients cannot be improved once they arrive at the mill. To help ensure that only quality ingredients are purchased and received, procedures need to be in place to provide guidance to employees performing these important purchasing and receiving functions.
Grain and Feed Ingredient Purchasing Grain and feed ingredient specifications Ingredient Specification - (example)
AAFCO Definition Typical Nutrient Analysis Analytical Method Physical Properties Basis for Rejection
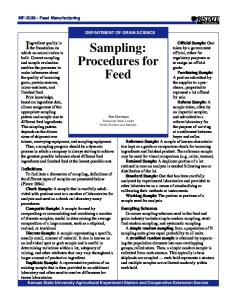
28.0 26.0 24.0
Average Value of Test Methods Intralaboratory Accuracy 30 Test Samples of DDGS Analyzed in Triplicate
26.9
26.8
22.0 20.0 18.0 16.0 14.0 12.0
13.0
12.7 10.7
10.2
10.0
9.9
9.2
9.0
8.9
9.0 7.6
8.0
7.6
6.0 4.0 2.0 Loss on Drying (Vacuum)
Loss on Drying (103C/5Hrs)
Loss on Drying (105C/3Hrs)
Loss on Drying (135C/2Hrs)
Moisture (Karl Fischer)
Crude Protein (Combustion)
Crude Protein (Kjedahl)
Crude Fat (Ethyl Ether)
Fat (Acid Hydrolysis)
Crude Fat (Pet Ether)
Crude Fat (Hexane)
Crude Fiber
Crude Fiber (Ankom)
0.0
AOAC 934.01
AOAC 935.29
NFTA 2.2.2.5
AOAC 930.15
AOAC 2001.12
AOAC 990.03
AOAC 2001.11
AOAC 2003.05
AOAC 954.02
AOAC 945.16
AOAC 2003.06
AOAC 978.10
AOCS Ba 6a-05
www.afia.org
Ingredient Variation Energy content of feeding fats at different moisture levels
Note: 0.5% mc difference @100 lbs fat/ton feed = $.10/ton finished feed Adapted from Meeker, D.L. and C.R. Hamilton. 2006
Suppliers Approved Supplier List List approval date & contact information Periodic visits to supplier
New Supplier Requirements Submit 3 samples from different lots for evaluation prior to first shipment Certificates or guarantees of analysis Ship 5 loads that meet specifications
Purchase Contracts • • • •
Date of contract Description of ingredient Quantity Quality & Terms – – – – – – – –
US Grade Mycotoxin level Price and payment terms Inspections and weights Trade Rules (NGFA, NOPA) Transportation specifications BSE Transportation Certificate Taxes and fees
Receiving Check Shipping Documents Ingredient identification, supplier, hauler Name and location of shipment destination Delivery ticket Lot number Ingredient labeling
Verify compliance with BSE regulations Confirm weights Compare shipper vs. receiver Check bag weights and number
Receiving • Sample and check ingredient – Sample before unloading • Test and analyze according to the schedule
– Check condition of truck • Biological, chemical, physical material
– Check initial discharge – Retain sample for ___months
• Check ingredient during unloading – Color, Texture, Odor, Moisture, Foreign material, Temperature
Sampling Patterns Hopper Bottom Sample Pattern
Dump Trailer Sample Pattern
Rejection of Ingredient Quality Questions and Issues STOP THE UNLOADING PROCESS!! Contact the Manager Wait for management instructions from:
Feed Mill Manager QA Manager Nutritionist Purchasing Agents
Rejection of Ingredient Contact individual with rejection authority Examine the delivery vehicle Contact driver and transportation company
Contact supplier: Same day or Next day
Take pictures of ingredients and trailer Complete rejection report
Soybean Meal
Wheat Middlings
x
x x
x
Frequency
x
Gross Energy
x
Amino Acids
x
Fumonisin
x
Zearalenone
x
DON
x
Aflatoxin
x
Sodium
x
Phosphorus
x
Calcium
x
Fiber
x
Fat
Moisture
Corn
Protein
Analytical Schedule
I-25
x
x
x
x
x
C-500 I-25
x
x
x
x
x
x
x x
x
x
x
C-250 I-25 C-100
•Develop a schedule based on received volume of ingredients vs. time. •Schedules based on time will skew matrix values unless they are weighted.
Receiving Tests Cereal Grain Moisture
Soft Ingredient Moisture
Corn Grading
Mycotoxins
www.romerlabs.com
Physical Methods of Evaluation Bulk density Particle size Angle of repose Coefficient of friction Flowability measurements.
Ingredient Bulk Density
Cereal Grains – Quart Method
Ingredient Bulk Density Loose Pack Density Vibrated Density Compacted Density
Loose Density Measurement Carefully screen off top to level material to box top level.
Courtesy of Fred Fairchild Kansas State University
Compacted Density Measurement Place spacer blocks on top of board in box to clear top edge of density box. Place board on top of the blocks and stack the appropriate weight on top of board.
Courtesy of Fred Fairchild Kansas State University
Vibrated Density Measurement Tap box gently on each side in sequence making circle around box.
Courtesy of Fred Fairchild Kansas State University
Ingredient Particle Size Particle size is typically specified based on material passing through a specific sieve. DDGS – 95% thru #10 Soybean Meal – 95% thru #10 Limestone – 99% thru #12 Salt – 90% thru #8
Ingredient Flow Evaluation
Ingredient Flow Evaluation Funnels with different size openings measures the flow characteristics of different ingredients.
Angle of Repose - DDGS
Photo credit Lee Johnston University of Minnesota
Angle of Repose
Drain Angle of Repose
Photo credit Lee Johnston University of Minnesota
FEED MANUFACTURING AND PROCESS CONTROL
Quality Assurance Manual Feed Manufacturing and Process Control – Overview/Objective • Maintaining consistent control over the quality and safety of the finished product requires applying quality assurance procedures at each step of the feed manufacturing process. Procedures have been developed for: – – – –
Grinding operations Batching and mixing operations Bagging operations Feed production and clean-out
Grinding Operation • Equipment – Maintain equipment according to manufacturer’s recommendations – Clean magnets daily – Inspect screens and hammers weekly – Adjust roll gaps daily; check roll parallel monthly
• Visual inspection – Check hammermill and roller mill – Check appearance of ground grain – Check screens for holes
Particle Size and Standard Deviation
Roller mill
Hammermill
Dgw, μm (Sgw)
Dgw, μm (Sgw)
1235 (1.98) 887 (1.83)
980 (2.52) 954 (2.49)
848 (1.84)
931 (2.49)
747 (2.03)
665 (2.49)
505 (2.02)
477 (2.25)
502 (1.97)
390 (2.12) Groesbeck, 2003
Roller Mill
Dgw 673 μm, Sgw 2.22
Dgw 679 μm, Sgw 1.62
Particle size of screen opening (microns)
Particle range 303-1494
4%
37
53
75
106
150
0% 212
37
53
75
106
150
212
300
425
600
850
1,180
1,700
2,360
0%
8%
300
4%
12%
425
8%
16%
600
12%
20%
850
16%
24%
1,180
20%
28%
1,700
24%
2,360
28%
3,350
Amount on each screen
Hammermill
3,350
Amount on each screen
Particle Size Standard Deviation
Particle size of screen opening (microns)
Particle range 419-1100 Groesbeck, 2003
Particle Size Analysis
Step #2 Rotap 10 min
Step #1 Weigh 100 g
Step #3 Record Weight
Step #4 Calculate Particle Size
Batching & Mixing • Equipment – Inspect scale hopper & mixer quarterly • Gates, Surge
– Inspect micro drum/tub weekly – Check scales • Internally – weekly or monthly • Externally - 2-4 times a year • Major scale fill test – 1/3 full + test wt. – 2/3 full + test wt.
– Zero scales daily or as needed – Check meters 4 times a year
Batching & Mixing Equipment Inspect turn head, 2-way valves, spouting annually Perform mixer test Installation Annually (minimum), recommend twice a year
Verify flushing procedures (Meds, Urea, BSE) Minimum of 10% of mixer capacity Installation Every three years
Clean finished feed magnet weekly
Batching & Mixing Master Formula File/Manufacturing Directions
Mixing directions (Wet/Dry mix time) Original formula Formula entry employee Date & time of formula entry Verification by management Date & time of formula removal Copy of feed tag Computer feed tag printout (bulk & bag) Date & initial by management
Batching & Mixing Verify Feed Formulation Manufacture according to formula Verify ingredients are approved for animal feed Check drug levels against medication bag & feed regulations Verify computer formula to paper copy “Master Formula File”
Active vs. Archived formula 1 year past shipment
Batching & Mixing Bulk Ingredients Weigh in descending order of weight to scale Bulk ingredient tolerances Warning/Alarm Accept/Reject policy
Locate ingredient base on scale resolution and call amounts
Batching System Micro Scale Major Scale
Minor Scale
Batching & Mixing Micro-system Check the weight of medication bags prior to dumping in the micro bins Verify the bins are labeled correctly Visually inspect bag vs. bin product When switching drug lot numbers the bin MUST run completely empty, record change on the production sheet Complete micro-bin bag dump log
Batching & Mixing • Hand-adds – Check accuracy of scale – Open bags MUST remain in original bag • Roll over or seal when not in use
– – – –
Label scoops for each ingredient Weigh ingredients into weigh buggy or container Check off hand-adds on the formula sheet Record drug amount & lot # on the hand-add sheet. – Dispose of all spills • Record drug spills on drug recon sheet
Batching & Mixing Batching Accuracy Major +/- ___ lbs/batch Minor +/- ___ lbs/batch Micro +/- ___ lbs/batch Liquid+/- ___ lbs/batch
Weight Discrepancy Range 1-2% of batch Document policy and procedures for discrepancy Initial accepted under/over limits
Batching & Mixing Mixer Fill Order 1. Major Scale Micro Scale Major Scale
Minor Scale
2. Minor Scale 3. Micro Scale 4. Hand-add 5. Liquid Time delay scales1-3 sec after each discharge
Batching & Mixing Typical mixing time Dry mix time 30 sec – 3 minutes
Wet mix time 30 sec – 2 minutes Based on liquid amounts
Validate mixing times CV< 10% Annually
Discharge mixer after mixing is complete
Batching & Mixing Mixing Plan/Sequence Group feed types Mix medicated feeds with the same drug from lowest to highest concentration Clean, flush or sequence according to policy BSE, Medication, Species, Age (market to starter)
Highly toxic drugs - physical clean-out Use Flush/Sequence when possible
Mixer Uniformity Tests - Quantab™ Step #1 Sample mixer
Step #3 Add 90 ml distilled water
Step #2 Weigh 10 g feed
Step #4 Record strip reading
Mixer Uniformity Evaluation CV
RATING
CORRECTIVE ACTION
< 10%
Excellent
None
10-15%
Good
Increase mixing time by 25-30%
15‐20%
Fair
20% +
Poor
Increase mixing time by 50%, look for worn equipment, overfilling, or sequence of ingredient addition Possible combination of all the above Consults extension personnel or feed equipment manufacturer
Batching & Mixing Problems Fat sprayed on ribbon and shaft
Fat balls created by poor application and mixing
Pelleting • Pelleting Parameters – Conditioning temperature – Die specification – Conditioning time • Pick arrangement • RPM
• Pelleting Report – Formula – Tons – Die size & length
Cooling Parameters Cooler bed depth Final moisture content Pellet temperature +/- 5 F of ambient
Weather conditions Air temperature Humidity
www.bliss-industries.com
Batching Records Feed Production Records Date/Time Formula Name/Number Lot number Number of batches Theoretical vs. actual production Location of feed after mixing Operators name
Production Records • Daily production records – – – – – – – – –
Feed production reports Feed delivery reports Receiving reports Bulk ingredient inventory Bag ingredient inventory Feed inventory Micro bin inventory Drug reconciliation Maintenance items • Boiler, magnets
Production Records Drug Reconciliation Daily Count full bags Weigh opened bags Determine the quantity in the micro system
Per Shift Bags added to micro system
Reconcile Theoretical vs. Actual use
Feed Manufacturing Tests KSU PDI Test
Particle Size Analysis
Mixer Evaluation
NIR
FINISHED FEED SAMPLING, INSPECTION AND LABELING
Quality Assurance Manual Finished Feed Sampling, Inspection and Labeling Overview/Objective Inspection and sampling of bulk and bagged feeds is important to ensure the quality and integrity of the feeds supplied to customers. In addition, regulatory and feed control agencies may require specific feed labels.
Finished Feed Testing Visual Inspections Uniform color and texture
Nutrient Content Moisture, Protein, Fat – 2-3 samples/wk Moisture, Protein, Fat, Ca, P, Na – 5-6 samples/month
Pelleted Feed Pellet Fines Pellet Quality (PDI)
Finished Feed Analysis Moisture
Protein
Gross Energy
Pellet Quality Tests Step #1 Whole Pellets
Step #3 Weigh back Pellets
Step #2 Test Sample
Holmen
Kansas State PDI
FEED SHIPMENT AND DELIVERY
Quality Assurance Manual Feed Shipment and Delivery Overview/Objective Quality assurance does not stop once the feed is manufactured and stored in the bulk bin. Accurate delivery of feed is essential for the proper growth and performance of the livestock and poultry for which the feed is intended.
www.ceipacer.com
Grower I
Loading Procedures Load-Out Flushing Procedures Medicated(withdrawal)
Non Non Non Non Med Med Med Med
Non Med
Med
Med
Med
Med
Delivery Unloading Unload from the back compartment first Open one compartment at a time Flush or sequence between feeds if required Document the unloading sequence if other than back to front Confirm the compartments are empty Report all feed spills and note on ticket Check to ensure the bulk bin lid is closed
Delivery Trailers Cleanout/Flushing Points Top
Compartment
Lift Auger
Floor Auger
Delivery Reports Emergency Outs Code based on reason Feed mill Grower/Customer
Tons hauled per driver Tons returned Average tons per load
SANITATION AND PEST/RODENT CONTROL
Quality Assurance Manual Sanitation and Pest/Rodent Control – Overview/Objective • Proper sanitation and controlling birds, pests and rodents are important elements of a quality assurance program. • Rodents and birds can consume sizeable quantities of feed and grain. But they can cause far more damage to feed plant operations by contaminating ingredients, product containers, finished products and plant facilities.
Feed Mill Pests Stored-Product Insects Beetles (Coleoptera) Moths (Lepidoptera) Mites (Psocoptera) Rodents Norway rat Roof rat House mouse Birds Pigeons European starlings House sparrows
All damage product Some damage equipment or mill structures All are potential carriers of disease
Pesticide and Baiting Program • Rodent control – Licensed employee – Pest control company
• Bird control – Pest control company
• Pest Control Contractor – – – –
License and contract on file MSDS/Safety information on products Written report Accompany contractor on each monthly visit
Inspection Routine Inspections Tall weeds and grass Debris that harbors rodents (pallets) Equipment that is stored close to the building Proper drainage (no standing water) Feed mill roof for leaking bucket elevators, spouting, cyclones, bag houses, exhaust fans
Feed Mill Sanitation A safe, clean and well maintained feed mill does not “just happen” it takes the efforts of management, operators and maintenance. Management has to set the example and standards Operators need to alert management about potential problems before breakdowns occur Maintenance needs to work with operators to keep equipment maintained and sealed to prevent dust leaks
Sanitation Promptly clean up grain spills and litter from inside and outside of the plant Pallets should be stacked neatly Broken bags taped and product cleaned up ASAP Sanitation Program Operators assigned areas Sanitation crew – rotation based on priority Regular mill shutdowns
FEED INVESTIGATIONS & RECALLS
Recall Steps Identify the Problem Notify the Recall Leader Collect Contact information Notify “Top Management” Review production data and laboratory analysis Determine type and quantity of products involved Evaluate the severity and determine the action Recall (Yes/No) Regulatory notification (Yes/No)
Quality Assurance Manual Feed Product Investigations/Recalls Overview/Objective Each step in feed quality assurance is designed to ensure that the customer is provided with consistently safe, wholesome feed products. Despite the best of efforts, there may be occasions when a customer voices a complaint or lodges a claim or product liability suit, alleging that the feed was inferior and resulted in substandard performance by the animals to which it was fed. There also may be occasions when a product recall becomes necessary because of a quality or labeling error.
Types of recalls External Recall: Removal of the product from the market after distribution has been made beyond the direct control of the feed company where it was manufactured. Internal Recall: Removal of the product from the market, none of which has been distributed beyond the direct control of the feed company where it was manufactured. Retention: The temporary withholding of the product from the market or from further processing or shipment by the company because of evidence that the product does not meet the quality specifications of the formula and/or the label.
Recall Team Recall Leader (Data Collector) Production or Sales Research/Nutrition/Quality Assurance Feed Manufacturing Communications Legal Counsel Top Management
Take Home Message • Determine Goals and Objectives for the Quality Assurance Program • Develop a Quality Assurance Manual – Ingredients Specifications – Processing Parameters/Targets – Standard Operating Procedures
• Train Employees • Monitor Results – Statistical Process Control – Concise Reports
Questions
NC State Feed Mill Education Unit