Bachelor Thesis Economics Supervisor: Nienke Ruijs
FDI and Economic Growth Testing the relationship between FDI and economic growth in developing countries
Name: Sibren Vegter Student No.: 0448281 Faculty: Economics and Business
Table of Contents Introduction
3
FDI and economic growth in developing countries FDI: Definition and Characteristics General Definition of FDI Characteristics of FDI Growth theories that encompass FDI and economic growth The neoclassical growth tradition Endogenous growth theory Absorptive capacity: The transmission channels of FDI Human Capital Financial System Political and Institutional Framework Endogeneity in relationship FDI and economic growth
5 5 5 5 7 7 8 9 9 11 12 14
Methodology Variables and data Dataset and sample Dependent variable Independent variables Control variables Model Specification Serial correlation
16 16 16 16 16 18 19 21
Results
22 22 26
FDI and economic growth in developing countries FDI and economic growth across regions Conclusion
29
Literature
31
Appendix A: Descriptive Statistics Appendix B: Wooldridge test for serial correlation Appendix C: List of countries passing the threshold values
34 34 35
2
Introduction International economic organisations, such as the World Bank, consider Foreign Direct Investment (FDI) as an effective tool to reduce poverty in developing countries. The United Nations millennium declaration even stipulates that an increase in FDI to developing countries will lead to a significant reduction of poverty rates (Asiedu and Lien; 2011). FDI constitutes flows of capital from multinational corporations between different countries. In the next section we will define FDI in more detail. The streams of FDI to developing countries started to increase from the 70s onwards and with it the attention of policy advisors, governments and economists (Zhang; 2001). FDI is something different from aid and grants received by developing countries which generally go under the name of Official Development Assistance (ODA). These are usually provided by governments either bilaterally or through UN institutions, like the World Bank. In contrast, FDI has as general incentive to earn a profit for multinational corporations and governments are usually not involved in this process. In recent decades these streams have grown much larger because the world has become more interconnected. Also, financial deregulation and trade liberalization has contributed to the surge of FDI streams to developing countries. Multinational corporations are nowadays less connected to a certain country and their streams of capital and investments have become more ‘footloose’ (UNCTAD; 2011). This could be presented as a potential threat since it has become easier for multinational corporations to quickly invest or withdraw their capital from certain countries. Nevertheless, FDI is usually presented as a blessing for developing countries since it brings in new foreign capital on which these countries are highly dependent. The purpose of this study is that we investigate whether FDI is truly beneficial for a developing country. Recently, there has been a surge in the economic literature about FDI considering its benefits and threats. The relationship between FDI and economic growth seems to be the main object of study in this line of literature. As the World Bank and UNCTAD emphasize that FDI is a key driver for the reduction of poverty rates and that FDI flows have increased significantly over the past decades it would be interesting to see if FDI really has a positive impact on a developing country. We measure this positive impact by increasing economic growth and investigate the relationship between FDI and economic growth. Therefore, we formulate the following research question: “How does FDI affect economic growth in developing countries?” In order to answer this research question we first give a general definition of FDI and describe its characteristics. The literature places special emphasis on two regions that attract significant FDI streams; East and South East Asia and Latin America. A third region we also find important is Sub Saharan Africa. These three regions will also be analyzed next to our main research question stated above. 3
This research also incorporates an empirical investigation in which we replicate an empirical study done by Durham (2004). We do use, however, a different dataset and estimation procedure. This makes our research relevant since we can compare our results with that of Durham but also, of course, with other studies. The investigation starts with providing a theoretical framework in which we present different growth theories, the transmission channels of FDI and endogeneity problems that exist when empirically analyzing FDI and economic growth. We then proceed with the methodology of our empirical analysis. Here we present our variables and data, we specify our estimation procedures and we test for serial correlation in our data. What follows next are the results of our empirical analysis. Finally, we conclude our research in the last section.
4
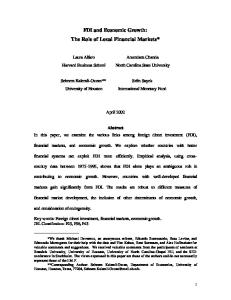
FDI and economic growth in developing countries FDI: Definition and Characteristics General definition of FDI Foreign direct investment (FDI) is generally defined as a form of international inter-firm cooperation through acquiring an effective voice in foreign firms. This encompasses the effective management decision power in, or ownership and control of, foreign firms. These two factors are often accomplished by having a significant equity stake in the foreign firm (de Mello; 1999). The United Nations Conference on Trade and Development (UNCTAD) states that at least 10 percent of equity ownership by investors is needed to acquire an effective say in the management of the foreign firms. These investors are multinational corporations seeking new markets and exploiting economies of scale. In addition, FDI is motivated by factor-price differentials such as cheap labour along with abundant resources and infrastructural conditions (Zhang; 2001). Next to acquiring a level of effective control of the foreign firm by multinational corporations, FDI also encompasses other broader non-equity forms of co-operation. These include leasing, licensing and franchising, but also broad Research & Development (R&D) co-operation (de Mello; 1999). This means that, next to having a managerial influence in the foreign firm, the multinational corporation also brings in new production processes, innovations and advanced technology to the foreign enterprise. Characteristics of FDI Now that we have a general idea about FDI, we turn to its characteristics. In figure 1 on the next page, the percentage of FDI to total GDP is plotted for East and South East Asia, South and Central America and Sub-Saharan Africa. From 1970 till 1985 we see that for all three regions the share of FDI to GDP was generally lower than one percent. Also, a downwardsloping trend is noticed for the Sub-Saharan African region. From 1985 till the beginning of the 2000s the share of FDI to total GDP peaked at 5 percent for all three regions. East and South East Asia was the first region where a rapid increase was witnessed in the beginning of the 90s. Then, South and Central America also saw an increase in FDI in the middle of the 90s and Sub-Saharan Africa followed a few years later. From the beginning of the last decade both East and South East Asia and South and Central America saw their FDI to GDP shares declining, while Sub Saharan Africa also witnessed a decline but once again peaked at 5 per cent at the end of the decade. The recent liquidity crisis had a dampening effect on FDI inflows to all regions. Figure 1 also plots the growth rates of the three regions averaged over 5 years; these are the dashed lines which correspond with the right y-axis. East and South East Asia seem to have the highest growth rates and only at the end of the 90s, with the Asian crisis at full
5
Figure 1. FDI inflows as percentage of total GDP and GDP growth to East and South East Asia, Latin America and Sub-Saharan Africa. Source: UNCTAD (2011) 6
10
East and South East Asia South America and Central America Sub-Saharan Africa East and South East Asia South America and Central America Sub-Saharan Africa
5
9
7
4 6
5
3
4
2 3
2
1 1
0
0
1970
1975
1980
1985
1990
1995
2000
2005
2010
Year swing, the average growth rate has dropped below 5 percent. The success of this region might explain why it has gotten so much attention in the literature that covered the relationship between FDI and economic growth (Zhang; 2001 and Bende-Nabende et. al.; 2003). From the mid 80s till the mid 90s growth was high and FDI to GDP ratios soared to unprecedented levels in that period. From figure 1 we can infer that South and Central America was hit hard by the sovereign debt crisis that emerged in South American countries at the beginning of the 80s. Growth rates in that period dropped from over 6 percent to less than one. From 1985 the region recovered and growth rates increased to 3 to 4 percent. In that same period FDI rose significantly and we see that this region has also gotten much attention in the literature about FDI and economic growth (Aitken and Harrison; 1999, Zhang; 2001). The case of Sub-Saharan Africa differs from the other two regions because only from the mid 90s onwards the growth rates have risen to substantial levels around one decade later than the other two regions. We also see that during this period FDI to GDP ratios have increased significantly. We should, however, be careful in interpreting this as FDI causing economic growth. There might be another unobserved third factor that causes the increase of 6
Percentage growth of GDP
FDI as percentage of total GDP
8
the GDP growth rates. In other words, correlation does not necessarily mean causation. Nevertheless, the FDI/Growth literature has recently changed its focus to this region (Asiedu; 2002; 2006, Hermes and Lensink; 2003, Naudé and Krugell; 2007 and Asiedu and Lien; 2011). From figure 1, it is hard to see how FDI relates to economic growth. Indeed, there are some periods that both FDI and growth increase significantly, but there are also periods that they go in the opposite direction. Therefore, we need to get a better understanding of how FDI can influence economic growth. We do so by first exploring the different growth theories stated in the literature. Secondly, we investigate which transmission channels are important for FDI to be able to enhance economic growth. Finally, we address endogeneity problems between FDI and economic growth that appear when FDI causes growth but growth can also cause an increase in FDI. Growth theories that encompass FDI and economic growth In the literature we find two major streams of growth theories; neoclassical or Solow growth theories and endogenous growth theories. The former theories explain economic growth through capital, labour and technology which are taken as exogenous, while the latter theories endogenize these factors for economic growth within the model. Technology plays an essential role in both growth theories for the enhancement of economic growth. More importantly, from the definition of FDI outlined in the previous section it is assumed that multinational corporations bring in (managerial) expertise, R&D and learning possibilities to the host country. The neoclassical growth tradition In the neoclassical tradition, Lapan and Bardhan (1973) argue that a developing country is more likely to make use of an advanced technique the greater its efficiency compared to the technology currently available. Actual adoption depends on the capital-labour ratio between the old and new technique; the smaller this difference, the more likely that the advanced technique is adopted. Findlay (1978) extends this argument of Lapan and Bardhan by stating that advanced technology is transferred to developing countries through multinational corporations via FDI. Advanced techniques and innovations are implemented most effectively when there is personal contact between those who already have the techniques and those who will eventually adopt it. Investments made by multinational corporations, in other words FDI, generally introduce new advanced techniques to the developing country. The difference between domestic and advanced foreign technology is defined as the technology gap (Wang and Blomström; 1992). A larger technology gap creates more spillovers to domestic firms in the developing country when the advanced technique is introduced through FDI. The idea is
7
that transfer of new knowledge and innovations will eventually enhance economic growth (Findlay; 1978, Wang and Blomström; 1992). Following the reasoning of the neoclassical growth theory outlined above, it seems that developing countries with the lowest technology level will benefit the most from advanced techniques brought in by FDI. In other words, developing countries with the largest technology gap will have the highest economic growth. This statement, however, assumes that it is always possible for a developing country to be able to adopt advanced techniques. This assumption contrasts with the findings of an empirical study done by de Mello (1999). He measures the degree of substitutability between domestic technology and advanced foreign technology by looking at the relationship between FDI and capital accumulation. From the results it becomes clear that advanced countries have a higher degree of FDI-related capital accumulation which implies a greater substitutability between old and new technologies. Developing countries seem to be less efficient in the use of new technologies embodied in FDI-related capital accumulation. In summary, we can not assume that domestic firms in developing countries are able to easily bridge the technology gap. Therefore, advanced technology brought in by multinational corporations via FDI can in most cases not be used at its full potential. It all depends on the absorptive capacity of the developing country to be able to utilize FDI efficiently (Durham; 2004, Girma; 2005). A somewhat more recent stream of new growth theories, often referred to as endogenous growth theories, emphasize the importance of the absorptive capacity of a country which seems to be essential for FDI to be successfully utilized. In the next paragraph we explore, in short, the basic fundamentals of endogenous growth theory. Endogenous growth theory In endogenous growth theories, technology is endogenous and is formed within the model. The basic idea behind this is formulated by Romer (1990); advances in technology arise because of actions taken by people who respond to marked incentives. This does not mean, however, that technological change is wholly dictated by the market. Nevertheless, new knowledge is translated into goods which exhibit practical value to earn a profit. Romer argues that knowledge can be seen as a public good which has the properties of nonrivalry and incomplete excludability. In other words, knowledge can be accumulated without bounds. However, an important separation needs to be made between ‘knowledge’ goods and skills -or human capital. The latter will cease to exist when a person dies, but his design, blueprint or law he generated will live on. It is important to make this distinction because knowledge and technology are not the same as human capital. Knowledge is incompletely excludable because its designs are often protected by the company through patents or copy rights (Romer; 1990). If this is the case, knowledge can still be acquired by imitating or mimicking the advanced technique.
8
The above assumptions about knowledge presented by Romer are important because knowledge is the key driver for technology. FDI brings new technology from advanced countries and, thus, new knowledge to developing countries. For knowledge spillovers to emerge, the developing country must have some ability to be able to utilise the new knowledge brought in by multinational corporations through FDI. This is known in the recent literature as the absorptive capacity of the developing country (Durham; 2004, Girma; 2005). In the endogenous growth model it is possible for technology to be affected by other factors. For instance, a developing country with a low absorptive capacity will not use the knowledge embodied in FDI in an efficient way. In other words, there is little room for technological diffusion and positive externalities to emerge and find their way to domestic firms. Therefore, technological change might be low even when FDI flows to the developing country are relatively high. Technology affects economic growth in the model which might be lower than expected (Balasubramanyam et. al.; 1996). The absorptive capacity of a developing country is essential for FDI to be successfully utilized. It can be seen as the transmission channel for FDI to enhance economic growth. However, absorptive capacity is still an abstract notion and it does not constitute one particular factor or channel. In the next section we investigate which transmission channels are important for FDI. This will give the idea of absorptive capacity a concrete meaning and can eventually be utilized in our empirical framework. Absorptive capacity: The transmission channels of FDI As outlined above, several channels or factors influence the efficient utilization of FDI in a developing country. It is important to stress that most of these factors do not only influence FDI but also have a direct impact on the growth pattern of a country. We start our investigation with human capital; since knowledge and technology are essential aspects of FDI enhancing economic growth. Human Capital For technology diffusion and knowledge spillover to appear in a developing country, the stock of the existing knowledge and competencies among the population in the country is of vital importance. This stock of knowledge among the population is generally defined as human capital. Borensztein et. al (1998) argue that if this stock of human capital is below some critical point, the country is unable to take advantage of the knowledge embodied in FDI. This is because, domestic firms in the country receiving FDI are unable to adapt to new technologies because workers simply do not have the skills or education. The distinction we made earlier between knowledge and human capital is essential here (Romer; 1990). New knowledge through more advanced technology is available in the country but utilisation is prevented by lack of human capital.
9
This brings in the concept of a threshold value for human capital posed by Borensztein et. al. (1998). If human capital is below this value; adoption of new technology seems to be impossible. In this case, FDI is unable to enhance economic growth because the more efficient technology can not be utilized. Borensztein et. al. test this hypothesis empirically by applying panel data regressions to 69 developing countries over the period ranging from 1970 till 1989. They find a significant positive interaction between FDI and human capital – measured by average male secondary school attainment. However, their results state that human capital needs to be at a certain value, the threshold, for FDI to be able to have a positive impact on economic growth. In a somewhat different study, Xu (2000) introduces a direct measure of technology transfer from multinational corporations. He measures technology transfer by looking at the expenditure of the multinational corporations’ affiliates in the developing country on royalties and license fees as a share of their total value added –or in other words the total FDI stream from the multinational corporation. With this measure Xu was able to distinguish the effect of technological diffusion and other productivity-enhancing effects. The regressions in this study show that in general a higher share in expenditures on license fees and royalties enhances economic growth. However, two important implications concerning human capital follow from the empirical analysis (Xu; 2000). First, when a distinction is made between developing countries and low developing countries in the regressions, the technology transfer coefficient turns statistically insignificant for low developing countries. In the same vein as Borensztein et. al., Xu argues that human capital is an important vehicle for technology transfer. Human capital is generally lower in low developing countries than in developing countries. When human capital enters the regression –again measured by average male secondary school attainment– and interacts with the technology transfer variable, the above argument is indeed true. Xu finds a threshold value for human capital which is at least twice as high as in the regressions of Borensztein et. al. A possible explanation for this might be that in Borensztein et. al. the total effect of FDI is used as a measure and Xu is only interested in technology transfer which is much more reliant on the level of human capital. The second implication that follows from Xu is found when technology transfer is regressed with respect to human capital. The coefficient for human capital turns out to be positive and significant. This indicates that human capital is of importance in attracting larger shares of expenditure on technology transfer from multinational corporations. However, it might also be the case that larger expenditure on technology transfer has a positive effect on the level of human capital. Thus, we should be careful in interpreting this relationship. Nevertheless, this gives an explanation why technology diffusion effect is much weaker in low developing countries with lower levels of human capital. It also gives an explanation for the results found earlier by de Mello (1999). Substitutability of technology is lower in developing countries because multinational corporations invest a smaller share in technology transfer than in more advanced countries.
10
The composition of FDI streams to developing countries in different regions of the world might give a more concrete answer about human capital used as a vehicle for FDI to enhance economic growth. Zhang (2001) argues that the manufacturing sector constituted about two thirds of the total FDI flows in East Asia and Latin America around 1988. In 1997, East Asia still had FDI flows to the manufacturing sector for over 60%. In Latin America, the multinational corporations shifted its attention to the services sector which constituted more than half of the total FDI flows. This might explain the surge in the FDI to GDP ratio for this region witnessed in figure 1. The manufacturing and services sectors are relatively knowledge intensive. In contrast with these regions, FDI flows to Sub Saharan Africa are mainly going to resource-rich countries (Asiedu; 2006). Resource extraction is not very knowledge intensive compared to the manufacturing or services sectors, so it seems that FDI in SSA creates much less knowledge spillovers and economic growth might be much smaller according to economic theory. Concluding, human capital is essential for efficient adoption of technology related to FDI. When levels of human capital are too low, FDI is not able to have a significant positive impact on economic growth. In addition, technology transfer (royalties and license fees) as a share of total FDI drops as human capital reaches lower levels. The differences of the composition of FDI streams per region might explain why some regions have higher growth rates than others. When human capital is at a sufficient level, however, this does not necessarily mean that economic growth will soar. Domestic firms need to be able to finance their investments on advanced technology. Otherwise, technological diffusion and knowledge spillovers are unable to materialize in the developing country. The next paragraph will look into this in greater detail. Financial System To take advantage of the new technology brought in by FDI in the developing country, domestic firms have to upgrade their production process, reorganize their organisational structure and educate their workforce. In other words, for technological diffusion to be successful domestic firms need to be able to finance these necessary investments. Often domestic firms in developing countries do not have the required amount of capital at their disposal and need to resort to external financing (Alfaro et. al; 2004). Domestic firms need to take out loans at banks or provide shares and bonds on financial markets to finance the investments. Developing countries often impose strict capital controls within their economy. This means that domestic firms are unable to fund their investments on global financial markets (Alfaro et. al; 2004). Therefore, it is important that the internal financial system of a developing country works efficiently and can allocate funds to domestic firms with profitable investment plans.
11
It seems from a theoretical point of view that the level of development of the financial system is crucial for domestic firms to reap the fruits of the new technology embodied in FDI. Durham (2004) empirically analyzes the interaction between the development of the internal financial system and FDI and on how they influence economic growth. He uses stock market capitalisation to GDP as a proxy to measure the level of development of the financial system. From the results it follows that FDI has a significant positive effect on economic growth that increases in magnitude with the development of the stock market. However, the stock market is an incomplete proxy to capture the whole financial system of a country. Therefore, we return to the empirical study of Alfaro et. al. (2004), they have a more extensive list of proxies measuring financial development. In addition to stock market capitalization, they also use liquidity (monetary aggregate M2 divided by GDP), private sector credit and bank credit. The interaction terms with FDI for these proxies are all significant and positive meaning that having a sound domestic financial system is an important factor for FDI to enhance economic growth. However, in contrast to the interaction terms the financial system proxies by themselves are insignificant in explaining economic growth. To cite Alfaro et. al. (2004); “having a well-developed financial sector is a means to an end and not an end in itself”. Hermes and Lensink (2003) argue that the level of financial development has some threshold value for FDI to be able to have a positive effect on growth just like with human capital. They define financial development as credit to the private sector as percentage of GDP. From their regressions they conclude that 37 out 67 countries satisfy the threshold value and that most of these countries are in Asia and Latin America. Summarizing the literature; a sufficient level of human capital and a sound financial system are essential channels through which FDI feeds economic growth. These channels should be freely available in the developing country for knowledge and technology to be allocated in the most efficient way. Recent literature has stressed that most developing countries do not have a political and institutional framework in which this is possible. The most important aspects within the political and institutional framework that influence FDI will be covered in the next paragraph. Political and Institutional Framework We begin our investigation with economic policies pursued by developing countries affecting FDI and economic growth. As already stated by Alfaro et. al. (2004), developing countries impose strict capital controls because they fear that domestic investors will only invest abroad, known as capital flight. The capital controls are an attempt of the government to protect the domestic market. Capital controls are one feature of the hypothesis advanced by Bhagwati and applied by Balasubramanyam et. al. (1996) to the FDI case. Bhagwati’s hypothesis stresses that a country can follow two strategies; an export promoting strategy or an import substituting strategy. Bhagwati defines an export promoting strategy as one where the effective exchange rate on exports equals the effective exchange
12
rate on imports. This allows for trade to be neutral. The import substituting strategy is one where the effective exchange rate on imports exceeds the effective exchange rate on exports. Imports suffer from tariffs, quotas and capital controls. The general argument for a country to follow the import substituting strategy is that it can rely on their internal market and it is not dependent on other countries. Also, countries are less affected by global crises because the country is less connected to the global economy (Balasubramanyam et. al.; 1996). When this hypothesis is applied to the FDI case, Balasubramanyam et. al. argue that in an export promoting environment FDI streams will find their most efficient use in the economy because it is not distorted and can move freely. This enhances competition within the country but, more importantly, also on the international level. Competition encourages investment in human capital and research and development which in the end will allow for technological diffusion to be successful. Thus, economic growth will be enhanced. The competitive environment that the export promoting strategy generates will also have a positive effect on the amount of FDI the developing country receives. In contrast, the import substituting strategy is only interested in the internal market. Investments are generally made to serve the internal market and firms do not look outside the borders. Hence, FDI in this case is only pointed at the internal market and its volume will be much smaller than in the export promoting strategy. Also, FDI is utilised in a less efficient way because it is distorted by the protective measures of the country (Balasubramanyam et. al.; 1996). Balasubramanyam et. al (1996) test the hypothesis empirically through dividing countries into two groups; export promoting countries and import substituting countries. They classify export promoting countries as countries with a relatively high imports to GDP ratio because this indicates that they have a relatively low level of import protection. It follows from their analysis that FDI has a relatively larger positive effect on economic growth in export promoting countries than import substituting countries. From the results they argue that for the export promoting countries domestic investment has a very small coefficient and is insignificantly different from zero. Moreover, FDI has a significantly positive effect on economic growth and could be seen as a driving force in the growth process for these countries. However, using more recent data Durham (2004) does not find a significant positive effect of the level of trade interacting with FDI to enhance economic growth. Trade is a continuous variable in his analysis and this might explain the different results. Nevertheless, it is not yet clear if Bhagwati’s hypothesis is proven empirically. We should take care in stating that an export promoting strategy is in all cases a superior strategy to attract FDI. In an empirical study, Asiedu (2002) argues that openness to trade –a good proxy to measure an export promoting strategy– attracts significantly less FDI for Sub Saharan African countries compared to developing countries in other regions. This suggests that trade liberalisation is less effective in generating FDI flows to Sub Saharan African countries compared to other developing countries. Asiedu and Lien (2011) give a possible explanation why this might be true. As noted before, FDI in Sub Saharan Africa seems to focus mostly on natural resources which is often a heavily regulated and tightly
13
controlled sector. Therefore, having close ties with the government is essential for the multinational corporation to be able to gain access to their natural resources. As a consequence, the multinational corporation does care less about the country pursuing trade restrictions since the sector in which it is working is already heavy regulated. In recent literature, attention has shifted from studying strictly economic policies and institutions, as in Bhagwati’s hypothesis, to political and institutional factors (Asiedu; 2006). Borensztein et. al. (1998) already uses ordinal variables as political rights and institutions in their regressions. The political rights variable is not significant, but the institutions variable is positive and significant and contributes to economic growth. However, Borensztein et. al. do not let these variables interact with FDI, thus there is not much to be said about political rights and institution as a vehicle for FDI to enhance economic growth. In contrast, Durham (2004) lets FDI interact with a property rights index and a corruption index in his regressions. These two indexes are proxies for institutional development in a country. The interaction with FDI produces a threshold for the property rights index and 11 out of 32 countries in the sample pass this threshold. The interaction of FDI with the corruption index turns out to be statistically insignificant, which means that FDI might not be affected by corruption in the growth process. Now that we covered the most important transmission channels found in the literature, we proceed by addressing some problems that emerge when analyzing the relationship between FDI and economic growth empirically. These problems have to do with endogeneity and make the estimated regression coefficients biased and inconsistent. Endogeneity in relationship FDI and economic growth The literature mentioned above about FDI investigates how and to what extent FDI affects economic growth. This is known as the hypothesis of FDI-led growth. However, FDI can also be driven by growth, or in other words economic growth causes FDI. On the one hand, growth enhances demand and creates new opportunities in the host country for multinational corporations to enter the market, hence FDI will increase. On the other hand, growth will increase human capital and infrastructure in the host country. These improving conditions can be a catalyst for attracting FDI. Another scenario could be that both FDI and economic growth cause each other through feedback (Zhang; 2001, Basu et. al. 2003). It seems plausible when we apply the endogenous growth model that feedback emerges because FDI brings in new technology and knowledge. This increases the efficiency of FDI being absorbed in the country which makes the country more competitive and enhances productivity. Multinational corporations increase their FDI flows because investing in this country has become more profitable. Causality runs both ways in the relationship between FDI and economic growth, thus we have an endogeneity problem.
14
Borensztein et. al (1998) notice that their cross-country regressions may be subject to endogeneity. They overcome endogeneity by applying instrumental variable techniques. However, they argue that finding an ideal instrument is not possible. Nevertheless, they use lagged values of FDI, a log value of total GDP, a log value of area and continental dummies for East Asia and South Asia as instruments to control for the endogeneity problem. The results of these regressions are qualitatively similar to the results where instrumental variable techniques were not applied. The instruments used are, however, far from perfect since they still correlate with the error term. This still makes the coefficients biased and inconsistent and it seems that another technique should be applied to control for endogeneity. Nair-Reichert and Weinhold (2001) argue that using a lagged explanatory FDI variable is a possible solution to control for endogeneity bias. This is because multinational corporations are unable to forecast how and to what extent the economy is going to grow in the middle to long term. The lagged decisions of the multinational corporations to invest (the lagged FDI variable) therefore are not cause by economic growth. Durham (2004) argues that the various instruments suggested in the literature which he used in his 2SLS models are largely unidentified. In other words, the instruments are highly irrelevant in explaining FDI. Instead, Durham uses lagged FDI variables as suggested by Nair-Reichert and Weinhold. An important assumption for using lagged FDI values is that investment decisions must not be driven by forward-looking expectations of multinational corporations. Results from a study conducted by Easterly et. al. (1993) suggest that growth rates in developing countries are for a large part determined by random shocks. According to Easterly et. al. this means that growth rates in these countries are almost impossible to predict. Thus forward looking expectations by multinational corporations on whether to invest in developing countries are highly unlikely or even impossible. It seems that finding the right instrument has two serious pitfalls. First, the instruments suggested in the literature are not exogenous since they correlate with the error term. Second, the instruments are irrelevant in explaining FDI. Therefore, instrumental variables regression fails to provide consistent and unbiased estimators, thus it is not a good solution for solving for endogeneity in this case. Using lagged values of FDI can be a solution for solving endogeneity as long as FDI is not driven by forward looking expectations, which seems to be true for developing countries. We now turn to the methodology of the empirical analysis. In this analysis we replicate the methodology done by Durham (2004) to some extent. There are, however, some important differences between this analysis and the one done by Durham. First, we use a different dataset which contains more countries and spans a longer period from 1996-2001 compared to 1984 till 1998. Second, we use panel data regressions instead of cross country regressions. Finally, we incorporate some other control variables which seem to be important in other studies and are excluded in the study done by Durham.
15
Methodology In the empirical analysis we investigate the relationship between FDI and economic growth. We incorporate the transmission channels found in the literature described above into our empirical investigation. As said, we replicate the methodology done by Durham (2004) but by using a different dataset and panel data regressions we can add to the discussion about FDI and economic growth in the literature. In this section we first describe the dataset and the variables which we use in our regressions. Second, we specify our empirical model and come up with different regression equations that estimate growth with respect to FDI and control variables. Variables and data Dataset and sample The dataset used in the analysis is taken from Chervin & Van Wijnbergen (2010). The data covers 155 Official Development Assistant (ODA) receiving countries listed by the OECD from 1966-2001. These countries are generally known as the developing countries. This is an important difference compared to the dataset that Durham uses. In this dataset developed countries are also included. To correct for business cycle influences the data is averaged into blocks of 4 years. Sources of the data that are used in the analysis are the Anarchy of Numbers dataset by Roodman (2004), the Penn World Table 6.2 and growth rates taken from the World Bank (2011). Data about FDI is gathered from the UNCTAD which covers yearly flows and stocks of FDI over a period from 1970-2001. Dependent variable As the dependent variable for economic growth we use real GDP growth constructed by the World Bank. This variable compensates for inflation but not for population growth since it measures the growth of total GDP in a country and not per capita. Independent variables Durham (2004) uses three different measures of FDI collected from three different data sources in his regression. We only use one FDI measure gathered from the UNCTAD. This measure is not used by Durham in his regression, so different results are expected when we perform our regression. Next to the FDI variable, we use variables to measure the transmission channels mentioned in the discussion of the literature. These are human capital, financial system and the political/ institutional framework. We largely follow Durham’s choice in variables.
16
However, we use some different measures for these variables. We will now describe each independent variable in more detail. FDI is measured by the share of FDI inflows to total GDP in a country. The inflow variable is used and not the stock variable, because FDI inflows measure the amount of FDI coming in which represents new knowledge and technology. As is discussed above, it is hard for multinational corporations to predict growth rates in developing countries, especially if they are 4 years ahead as in our dataset. Therefore, we use lagged values of FDI inflows to correct for the issue of endogeneity and therefore we lag FDI inflows by one period (t-1). Human capital is defined as the mean years of male secondary school attainment of those over 25 years of age. According to Barro and Lee (1993), this measure of human capital seems to be the one that is most significantly correlated with growth. A higher value of this variable generally means a higher level of economic growth. Durham (2004) uses the exact same measure as we use in our regressions. The variable of the financial system is calculated as the share of the monetary aggregate M2 to GDP. M2 is usually defined as currency and deposits (M1) plus savings, small money market funds and time deposits. If the ratio of M2 to GDP increases this means that the amount of money circulating in the financial system is higher. This could indicate a better functioning financial system. It has to be stressed that this measure of the financial system is far from perfect, but data about financial institutions in developing countries has generally been scarce. Durham (2004) uses stock market capitalisation as an indicator for the development of the financial system. However, this measure is not present in our dataset and therefore we use M2 to GDP. The political and institutional framework is measured by two variables. Bhagwati’s hypothesis is tested by openness defined as the share of total exports and imports to GDP also used by Durham (2004). A higher value of this ratio implies a country is more open to international trade; an export promoting country in the terminology of Bhagwati. Institutional quality is measured by the International Country risk guide (ICRGE) indicator. This indicator is a continuous variable that ranges between 0 and 10 and is based on the level of corruption, bureaucratic quality and the rule of law within a country. This is a somewhat different indicator than the ones that Durham (2004) uses. He uses three variables to measure institutional quality; a regulation index, a property rights index and a corruption index. The ICRGE captures the first and the third effect into one index and also adds bureaucratic quality as another factor. An advantage of using just one averaging index is that we can control for all three factors at once instead of controlling for just one factor which is done in the study of Durham.
17
Control variables In order to generate regressions that cover the effect of FDI inflows on GDP growth, we need to control for other factors that influence economic growth. We use the same control variables as Durham (2004); the investment ratio, initial GDP per capita, population growth and the education rate. Next to these four, we also include government consumption as a fifth control variable. As in Durham, inflation does not need to be controlled for since it is already compensated in the dependent variable. A trivial component affecting economic growth is domestic investment which is measured by the share of total investment to GDP. In most macroeconomic textbooks investment is the key driver in the IS-LM model. We follow the same procedure as with FDI and lag total investment by one period to overcome the endogeneity problem. Another factor influencing economic growth is rooted in general growth theory. Both neoclassical and endogenous growth models state that countries converge to their steady state income. This implies that countries with low levels of GDP per capita have higher growth rates than countries with high levels of GDP per capita since they are farther away from their steady state income. These countries enjoy a catching up effect through capital accumulation and an increasing savings rate (Mankiw et. al.; 1992). It is therefore essential to include initial GDP per capita for each period in order to control for this effect. The natural logarithm of initial GDP is taken so we are able to convert changes into percentages. Population growth is included as a control variable because our dependent variable real GDP growth is not compensated for this. Therefore, this control variable does a different job when compared to the research by Durham (2004). He uses a real GDP per capita growth variable as independent variable which is already compensated for population growth. We expect population growth to have a positive effect on economic growth. The education rate or human capital is important for growth since it is an important tool for the application of technology in a country. However, human capital is already used as a transmission channel and independent variable in our model. Nevertheless, as in Durham (2004) it is an important variable to control for economic growth and we need to include it in all our regressions. Government consumption is our fifth control variable and is also used by Borensztein et. al. (1998) and Alfaro et. al. (2004). The idea is that government consumption has a negative impact on economic growth since it does not add structurally to the economy like government investments. Government consumption can be seen as a leakage from the economy. We use the share of government consumption to GDP to measure government consumption.
18
In appendix A we find the descriptive statistics for both the dependent and independent variables. The dependent variable real GDP growth is on average 3.48%. When we look at FDI as a share of GDP it becomes apparent that FDI inflows can be negative. The UNCTAD states in their data that FDI flows consist of equity capital, reinvested earnings and intracompany loans. When one of these is negative and is not positively offset by the remaining components FDI inflows are negative. This can be seen as reverse investment or disinvestment by the multinational corporation. What stands out from appendix A is that there is missing data across all the variables. A glimpse at the data suggests that especially in the first five periods values seem to be missing. Model Specification The basic regression equation estimating economic growth on its determinants -FDI and control variables- can be specified as follows: Yit = β0 + β1INVESTi(t-1) + β2INITIALGDPit + β3POPGROWTHit + β4SCHOOLINGit β5GOVCONSUMPTIONit + β6FDIi(t-1) + uit (fixed effects) (1) Where Y is real growth per capita, INVEST is lagged total investment as share of GDP, INITIAL GDP is the natural logarithm of GDP, POPGROWTH is population growth, SCHOOLING is the average years of male secondary schooling, GOVCONSUMPTION is the share of government consumption to GDP, FDI is the share of lagged values of FDI to GDP and u is the error term. As indicated in equation (1) we use fixed effects estimation procedure in our models. The advantage of using fixed effects estimations is that we are controlling for the average differences across countries in any observable or unobservable predictions (also called unobserved heterogeneity). This is done by creating country dummies that will soak up all the across country action. This allows us to explore the relationship between economic growth and FDI plus control variables within a country. The basic specification of Equation (1) does not say anything about the transmission channels which are so important according to the literature. An interaction term is needed to be able to know how human capital, the financial system and the political/institutional factors work as a channel for FDI. The regression equations with the interaction terms are specified as follow, for estimating the effect of human capital on FDI: Yit = β0 + β1INVESTi(t-1) + β2INITIALGDPit + β3POPGROWTHit + β4SCHOOLINGit + β5GOVCONSUMPTIONit + β6FDIi(t-1) + β7(FDIi(t-1)*SCHOOLINGit) + uit (fixed effects) (2)
19
For estimating the effect of the financial system on FDI: Yit = β0 + β1INVESTi(t-1) + β2INITIALGDPit + β3POPGROWTHit + β4SCHOOLINGit + β5GOVCONSUMPTIONit + β6FDIi(t-1) + β7(FDIi(t-1)*M2it) + β8M2it + uit (fixed effects) (3) Where M2 is the ratio of M2 to GDP. For estimating the effect of the political/institutional framework on FDI: Yit = β0 + β1INVESTi(t-1) + β2INITIALGDPit + β3POPGROWTHit + β4SCHOOLINGit + β5GOVCONSUMPTIONit + β6FDIi(t-1) + β7(FDIi(t-1)*OPENNESSit) + β8OENNESSit +uit (fixed effects) (4) Yit = β0 + β1INVESTi(t-1) + β2INITIALGDPit + β3POPGROWTHit + β4SCHOOLINGit + β5GOVCONSUMPTIONit + β6FDIi(t-1) + β7(FDIi(t-1)*ICRGEit) + β8ICRGEit + uit (fixed effects) (5) Where OPENNESS is the share of imports and exports to GDP and ICRGE is the international country risk guide as described in the variables and data section. Equations (2), (3), (4) and (5) can be used to calculate threshold values for the transmission channels. For FDI to have a positive effect in these equations the sum of β6 and β7 have to be positive. Following Borensztein et. al. (1998), the threshold value is the minimum value of the transmission channel to make the effect of FDI positive. In our case it can be calculated as: Threshold (SCHOOLING, M2, OPENNESS, ICRGE) =
(β6 /β7)
(6)
Equation (6) needs to be interpreted carefully because it must only by applied to a case where β6 is negative and β7 positive. When both are positive (negative) the effect of FDI on economic growth is positive (negative) for all levels of the transmission channel. We now have estimations to calculate the general effect that FDI has on economic growth together with its transmission channels. However, from figure 1 we can infer that growth rates and FDI to GDP ratios differ across regions. Therefore, three dummy variables are introduced to control for the effect per region. We let these regional dummies interact with FDI so that we are able to see how FDI influences growth in these regions. By including dummy variables we cannot make use of the fixed effects estimation procedure anymore because this procedure omits slow moving variables. We therefore are forced to use the random effects estimation procedure. The model can be specified as follows:
20
Yit = Yit = β0 + β1INVESTi(t-1) + β2INITIALGDPit + β3POPGROWTHit + β4SCHOOLINGit + β5GOVCONSUMPTIONit + β6FDIi(t-1) + β7(FDIi(t-1)*SSAit) + β8(FDIi(t-1)*EASTASIA it) + β9(FDIi(t-1)*LATINAMERICAit) + β10SSAit + β11EASTASIAit + β12LATINAMERICAit + uit (random effects) (7) Where SSA, EASTASIA and LATINAMERICA are the dummy variables for Sub Saharan Africa, East and Southeast Asia and Latin America respectively. We exclude dummy variables for other regions because including them all will result in the dummy variable trap which is an instance of perfect multicollinearity. Countries not included or grouped are located in Eastern Europe, the Middle East, North Africa (above the Sahara) and the Pacific. Serial correlation We have to know if our dataset suffers from auto correlation or serial correlation. If this is the case there is correlation of variables with itself over a certain time period. Serial correlation makes the reported estimators biased and inconsistent. A test for serial correlation with panel data is the Wooldridge test. This method uses the residuals from a regression in firstdifferences. By first-differencing the data the method will remove time-invariant variables and the constant (Appendix B). Wooldridge’s procedure regresses the residuals obtained from the regression with first-differenced variables on their lags. Then it tests if these coefficients of the lagged residuals are equal to -0.5 (Drukker; 2003). When these coefficients significantly differ from -0.5 there is reason to suspect there is serial correlation within the dataset. Appendix B reports the first-differenced variables of our basic regression equation (1) and most importantly the p-value on which we reject the nullhypothesis that there is no first-order autocorrelation. We find p=0.2179 so we can not reject the null-hypothesis and therefore we have no reason to suspect that our basic regression equation suffers from autocorrelation of its variables. Appendix B also reports the p-values for all our other regression specification (2)-(5) and (7). For all regression equations we do not reject the null-hypothesis if we use α=0.05. We therefore use linear regression of our specified models without autoregressive elements since we do not have reason to suspect autocorrelation for all our regression equations. In the next section we will turn to the results of the models specified in this section. As we replicate some aspects of the empirical analysis of Durham (2004) we will contrast our findings with his findings. Next to this, we also contrast our results with other similar empirical studies found in the literature.
21
Results FDI and economic growth in developing countries The regression results of equations (1)-(5) specified in the previous section are summarized in table 1 found on the next page. It needs to be stressed that we are using lagged FDI variables (t-1) thus the period on which we regress the equations runs from 1974 to 2001. Regression (1) presents our basic specification. The control variables have the expected sign but the coefficients of schooling and government consumption are insignificant. Compared to Durham (2004) we see that population growth has the opposite sign and is significantly negative in his regression. This is probably because our growth variable is not compensated for population growth. Durham uses real GDP per capita growth as the independent variable and therefore population growth becomes negative because higher growth means a dampening effect on GDP per capita. In other words, GDP has to be divided among more people. FDI has a positive effect on economic growth in our basic specification and is statistically significant. This contrasts with the findings of Durham who discovers a negative effect. Again, it has to be stressed that we use a different estimation method because we use panel data. More importantly, a different dependent variable is used. Our findings are more in line with Nair-Reichert and Weinhold (2001) who also find a positive FDI coefficient for their panel data regressions. Their sample is, however, much smaller with only 24 developing countries and we have 75 countries in our basis regression. Regressions (2)-(5) present the results of the various transmission channels through which FDI enhances economic growth according to the literature. Regression (2) lets FDI interact with human capital as is specified in equation (2) in the previous section. The control variables have again the expected signs, however, schooling and government consumption are again statistically insignificant. We get perverse signs for coefficients β6 and β7, so we are not able to construct a threshold value in which FDI becomes positive in effecting GDP growth, as in Borensztein et. al. (1998). Durham (2004) also gets these perverse signs of for the coefficients of FDI and the interaction term in his regressions. However, the coefficient of FDI is statistically significant. We could say that there exists a negative threshold for human capital implying that FDI in a country above this threshold will have a negative impact on economic growth. This could indicate that FDI in a country with a higher level of human capital contributes less to economic growth which is in contrast with what the literature about FDI tells us. There it is stated that human capital should be at least at some substantial level to be able to absorb the knowledge embodied in FDI (Borensztein et. al.; 1998, Xu; 2000). When we take a look at the descriptive statistics in Appendix A for schooling we can see that the threshold value is more than two standard deviations above its mean. This means 22
Table 1 The effect of FDI on GDP growth (Equations (1)-(5)). Panel data regressions with fixed effects for the period 1974-2001 (4 years average).
Independent variable: Total investment (as share of GDP in %) Ln (Initial GDP) Population Growth (%) Schooling Government Consumption (as share of GDP in %) FDI (as share of GDP in %) FDI*Schooling
Regression (dependent variable is GDP growth): (1) (2) (3) (4)
(5)
0.084** (0.038) -3.766*** (0.853) 1.465*** (0.239) 0.538 (0.573) -0.048 (0.045) 0.202** (0.089)
0.084** (0.039) -3.688*** (0.902) 1.676*** (0.329) 0.086 (0.632) -0.054 (0.048) 1.559*** (0.378)
FDI*M2
0.085** (0.036) -2.550*** (0.849) 0.971*** (0.240) -0.152 (0.590) -0.053 (0.043) -0.007 (0.117)
0.022 (0.039) -4.122*** (0.862) 1.478*** (0.233) -0.145 (0.594) -0.049 (0.044) 0.710*** (0175)
0.003 (0.002) 0.014 (0.023)
M2 (as share of GDP in %) FDI*Openness
-0.004*** (0.001) 0.052*** (0.011)
Openness (as share of GDP in %) FDI*ICRGE ICRGE Intercept
0.086** (0.038) -3.651*** (0.857) 1.471*** (0.239) 0.886 (0.631) -0.052 (0.045) 0.319** (0.126) -0.127 (0.097)
28.006*** (6.282) 0.158 460 (75)
-0.240*** (0.072) 0.646*** (0.191) 24.500*** (6.694) 0.223 398 (64) 6.483†a
26.897*** 20.254*** 28.510*** (6.333) (6.178) (6.354) R-squared 0.162 0.235 0.206 Observations (Countries) 460 (75) 455(75) 460 (75) †b d 2.513 2.588 163.785†a Threshold value: –(β6/β7) Standard errors in parenthesis. * significant at 10%; ** significant at 5%; *** significant at 1% † Indicates a negative threshold; FDI contributes negatively to GDP growth when this threshold is passed a both coefficients β6 and β7 are significant c coefficient β6 is insignificant and coefficient β7 is significant d both coefficients β6 and β7 are insignificant
23
that a lot of countries do not pass this negative threshold and FDI enhances economic growth for these countries in our regressions. In fact all developing countries in our dataset have lower values for schooling for at least one period (Appendix C). However, we should not conclude that schooling is not important for GDP growth since it affects FDI negatively in enhancing economic growth. The coefficient of schooling is much higher than that of FDI, However, schooling is not significant in this regression so we should take care in interpreting this coefficient. What we can infer from regression (2) is that this could be some proof for the technology gap hypothesis in the neoclassical growth tradition argued by Findlay (1978) and Wang and Blomström (1992) that a larger technology gap creates higher economic growth in the ‘backward’ country. The technology gap in regression (2) is human capital measured as years of secondary schooling. Lower values of this proxy probably mean a larger difference between the developing country and the multinational corporations. This larger technology gap might be beneficial for FDI to have an enhancing effect on GDP growth. Although we should approach this claim with some scepticism since the coefficient of FDI has a much lower value than schooling. Moreover, our r-squared for regression (2) is pretty low which means that the model has a poor fit. The effect of the financial system on FDI is summarized in regression (3). The control variables have the expected signs except for schooling coefficient which now turns negative. The FDI coefficient is negative and statistically insignificant. FDI interacting with M2 to GDP creates an insignificant positive coefficient. Both FDI and the interaction term are really close to zero in this regression. We can construct a positive threshold, but since both coefficients are insignificant we do not report any countries in appendix C. Compared to Durham (2004), the regression share the same signs although the coefficients in Durham’s regressions are much larger. Also, the interaction term is statistically significant in Durham’s analysis. He uses, however, stock market capitalisation as a proxy for the development of the financial system. This might be a better indicator but it is often not available for most developing countries, thus we had to resort to this proxy which has a better coverage across developing countries The M2 to GDP coefficient is insignificant on its own indicating that the proposition of Alfaro et. al. (2004) seems to hold; the financial system is a means to an end and not an end itself. Regression (4) tests the hypothesis put forward by Bhagwati that a more open economy creates a more competitive and efficient environment for FDI so it can be allocated in the most optimal way available. The coefficient of lagged investment now turns insignificant and is much smaller than in the previous regressions. The effect of Initial GDP seems to be even more pronounced indicated by the higher coefficient. Again schooling is negative and insignificant. When we turn to FDI and the interaction term we see that they are both
24
significant. However, the coefficients, like in regression (2) again have the opposite signs and there does not seem to exist a positive threshold value. This contrast with the findings of Balasubramanyam et. al (1996) which finds a significantly positive effect for openness to have on FDI. Their methodology differs in which they make an arbitrarily separation of countries with an open economy (export promoting) and closed economy (export substituting). In our regression we use a continuous variable to measure openness and this gives different results. Moreover, our findings also differ from Durham (2004) he does find a threshold in which the effect of FDI on economic growth turns positive. However, the FDI and the interaction term are both insignificant. Thus, the threshold is not really a good explanation of the data. As in regression (2), we can construct a negative threshold value in which the effect of FDI on GDP growth turns negative. This threshold value is almost two standard deviations above its mean and all countries are under this threshold for at least one period in the sample. The openness coefficient is positive and significant indicating that a higher share of exports and imports to GDP contributes positively to GDP growth. Countries with a large share of imports and especially exports might also be more dependent on natural resources as their main channel of income (Asiedu; 2002). These sectors are generally less knowledgeintensive. Therefore, FDI to these countries might be less beneficial since there are less knowledge spillovers. FDI might than have some negative effect on economic growth as is witnessed in regression (4). Finally, Regression (5) gives information about the effect of political and institutional development in a country via the measure ICRGE. Lagged investment becomes significant again next to initial GDP and population growth. Schooling and government consumption are again insignificant. For the lagged FDI variable we now see a relatively large positive coefficient which is significant. The interaction term FDI and ICRGE is negative and significant and we again find a negative threshold which only 4 countries do not pass for all periods. However, a high level of political and institutional development is beneficial for economic growth according to the ICRGE variable. Only a small share effects growth negatively in the interaction term. These findings contrast with Durham (2004) who does find positive threshold values for the regulation, property rights and corruption indexes. The relationship between FDI and economic growth turns positive when these threshold values are passed. A possible explanation of the different results with respect the political and institutional development might be that our sample period is much longer. This variable has changed a lot over time and especially in the beginning of our sample period the ICRGE measures are relatively low compared to later periods. Concluding, the general relationship between FDI and GDP growth seems to be positive according to our results. This supports most studies found in the literature, however not the
25
one that we are replicating here by Dunham (2004). He finds a negative although insignificant relationship between FDI and economic growth. The results of the transmission channels which are reflected in regression (2)-(5) are not confirming the theories found in the literature. For human capital we get a somewhat same result as Durham and we find some support for the technology gap hypothesis. The financial system does not seem to do much for FDI as a transmission channel since both lagged FDI and the interaction term are insignificant. M2 to GDP as proxy for financial development might be the weakest link here and other proxies may be of better use, such as stock market capitalisation in the analysis by Durham (2004). However, missing data may create some problems when using this proxy. The export promoting strategy by Bhagwati is not confirmed by our results. However, we do get a relatively high and significant coefficient for lagged FDI in regression (4) which does confirm the main findings in the literature that FDI enhances economic growth. The political and institutional framework is also not a transmission channel that positively interacts with FDI. Nevertheless, once again we see that we get a significant positive value for the FDI coefficient. Next, we show the results of regression equation (7). With this regression we want to know if the relationship between FDI and economic growth differs from region to region. We stick to the same sample of developing countries but know introduces dummy variables for the different regions as specified in the model specification section. We should stress that the upcoming section is not a replication of the research done by Durham (2004) anymore. The sole purpose of regressions (7)-(10) is to investigate the relationship of FDI and GDP growth across regions. FDI and economic growth across regions Table 2, found on the next page, presents regression (7). This regression consists of three interaction terms which allows us to compare the general relationship of FDI and economic growth across regions. Total investment and population growth are significant and with the expected signs. Initial GDP, Schooling and Government consumption have the expected signs but are insignificant. FDI is positive and significant which indicates that it has a positive effect on growth when controlled for the three regions; Sub Saharan Africa, East and South East Asia and Latin America. This means that in other regions than these regions FDI has a significant positive effect on economic growth. These regions are Eastern Europe, the Middle East, North Africa (above the Sahara) and the Pacific area. All three the interaction terms are negative but insignificant so we have to take caution in claiming that FDI has a negative effect on GDP Growth. However, for East and South East Asia the dummy variable has a higher significant coefficient than the interaction term and this offsets the negative interaction term. Growth will increase but it is not due to the FDI component. The same can not be said about the other regions since their coefficient for the dummy variables are insignificant and negative.
26
Table 2 The effect of FDI on GDP growth analyzed per region (equations (7)). Panel data regressions with random effects for regression (7). Regression (8)-(10) is our basic specification (equation (1)) but with the sample split per region and estimated with fixed effects. All regressions are done over the period 1974-2001 (4 years average). Regression (dependent variable is GDP growth): (7) (8) Sub Saharan (9) East and (10) Latin Africa South East Asia America Independent variable: Total investment (as share 0.081*** 0.060 0.163** 0.190** of GDP in %) (0.027) (0.063) (0.076) (0.083) Ln (Initial GDP) -0.045 -2.004 -1.864 -6.955*** (0.430) (1.715) (1.866) (1.898) Population Growth (%) 0.989*** 1.814*** 0.542 -0.216 (0.194) (0.337) (0.767) (1.041) Schooling 0.274 0.614 0.656 0.566 (0.388) (1.592) (1.244) (0.984) Government Consumption -0.014 0.003 0.196 -0.305*** (as share of GDP in %) (0.022) (0.102) (0.131) (0.065) FDI (as share of GDP in %) 0.374* 0.272** -0.250 -0.239 (0.209) (0.139) (0.220) (0.179) FDI*SSA -0.139 (0.237) FDI*East Asia -0.543 (0.273) FDI*Latin America -0.345 (0.276) SSA -0.559 (0.928) East Asia 2.064*** (0.961) Latin America -0.211 (0.812) Intercept 0.231 10.651 10.929 62.490*** (3.521) (11.502) (13..193) 14.716 R-Squared 0.223 0.235 0.173 0.258 Observations (Countries) 460 (75) 166 (28) 83 (13) 137 (21) Standard errors in parenthesis. * significant at 10%; ** significant at 5%; *** significant at 1%
Regression (7) seems not that informative in comparing the relationship between FDI and GDP growth. Therefore, we split the sample per region and then regress our basic specification equation (1) and we obtain regressions (8), (9) and (10). From the results it is shown that the control variables differ substantially across the regions. Investment is insignificant for Sub Saharan Africa but it is significant for the other two regions. Initial GDP has a relatively high and significant coefficient in Latin America but it is insignificant in the
27
other two regions. Population growth is only significantly positive for Sub Saharan Africa. The three regions all have an insignificant schooling coefficient although it is positive. Sub Saharan Africa and East and South East Asia have perverse signs for government consumption but Latin America has a significantly negative coefficient for this variable. This is probably due to the sovereign debt crisis that emerged in the beginning of the 80s in Latin America. The large government debt in this region dampened GDP growth and thus this effect is indicated with a negative sign in regression (10). When we turn to the FDI variable we see something interesting happening. The coefficient is positive and significant in Sub Saharan Africa but negative and insignificant in the other regions. We started our research stating that East and South East Asia and Latin America have gotten much attention in the literature about FDI and economic growth. However, we now see in our empirical findings that it is not these two regions but Sub Saharan Africa where FDI has a positive impact on economic growth. An explanation for this rather strange finding might be found by referring back to figure 1. There we see in the case of East and South East Asia that after a relatively large decline of GDP growth in the beginning and mid 90s, the FDI to GDP ratio starts the climb to unprecedented levels till the end of the 90s. In our regression models we use lagged FDI to control for endogeneity but because of the 4 year lag in the FDI variable we can see that FDI and economic growth move in opposite direction. Hence, we find a negative impact on economic growth in our regression for this region. We can draw a somewhat identical picture for Latin America. For Sub Saharan Africa the story is rather different, a 4-year lag in FDI seems to still follow the path of GDP growth. Therefore, we have a positive of FDI on economic growth for this region.
28
Conclusion We started our analysis of the relationship between FDI and economic growth by first introducing some growth theories that incorporated FDI into their models. These theories are for a large part determined by transfer of technology and knowledge spillovers. In the neoclassical growth tradition technology is taken as exogenous and by this assumption it is not stated how these countries are able to utilize new technology coming in via FDI. In other words, it is simply assumed that countries can always adopt new technologies. Therefore, a larger technology gap creates higher economic growth. Recent literature argues that this is a flawed assumption since developing countries are generally not able to fully absorb the knowledge embodied in FDI. Endogenous growth theory makes it possible for technology to be affected by other factors. From these models it becomes clear that countries have some sort of absorptive capacity which allows them to be able to adopt new technologies. The absorptive capacity in this study is defined by three transmission channels: the level of human capital, the development of the internal financial system and the political and institutional framework. Human capital is of vital importance since it constitutes the knowledge and skills of the country. Then, the level of human capital determines if a country is able to adapt to new technologies. It is argued in the literature that there is a threshold which has to be passed by developing countries for FDI to have a positive effect on economic growth. The internal financial system is an important tool that allows domestic firms to finance new technologies brought in by multinational corporations. Most domestic firms in developing countries suffer from capital controls and are not able to finance their investments from international capital markets. These factors hold back investment decisions by domestic firms, thus FDI is not used at its full potential in the developing country. The political and institutional framework of a country is the last important factor of the absorptive capacity of a country. Trade should not be restricted via tariffs, quotas and capital controls, according to Bhagwati’s hypothesis. FDI will be used most efficiently when trade is not distorted and allowed to move in a competitive environment. In some regions this channel might be of less importance since natural resources constitute a large share of total FDI inflows in these regions. This is because it is already necessary for multinational corporations to work closely with local governments. Institutional and political development is important, since it allows to speed up knowledge spillovers because multinational corporations are less uncertain about their rights being protected. The relationship between FDI and economic growth seems to be suffering from an endogeneity bias since FDI can effect economic growth but economic growth can also affect the amount of FDI flows. In this case higher growth rates attract more FDI flows. We control for this endogeneity bias by using lagged variables of FDI. Multinational corporations can generally not predict growth rates for developing countries so hereby we remove the effect that economic growth has on attracting FDI to a country. 29
In the empirical analysis we replicate the study of Durham (2004) but we use panel data estimations with fixed effects instead of cross-sectional regressions. Also, our dependent growth variable is constructed in a different way and is not compensated for population growth. The results show a general positive effect of FDI on economic growth which contrasts with the findings of Durham. We do not find threshold values of the transmission channels for when passed; the effect of FDI on economic growth turns positive. However, we find negative thresholds for human capital, openness and the political and institutional framework. When a country is above this threshold the effect of FDI on GDP growth turns negative. Our empirical evidence for human capital with the negative threshold gives some support for the technology gap hypothesis. Developing countries seem to benefit more from FDI when there knowledge gap is larger. The financial system does not seem to have a pronounced effect as a transmission channel for FDI to enhance GDP growth. This could be because M2 to GDP is not a good proxy for measuring the development of the financial system. Durham uses stock market capitalisation as a proxy, but this measure is much less available for developing countries in our sample. Bhagwati’s hypothesis stating that a country with an export promoting strategy reaps more benefits from FDI than an import substituting is not supported by our empirical evidence. A possible explanation could be that developing countries with a high ratio of export plus imports to GDP are generally more involved in sectors as natural resource exploitation which is less knowledge-intensive. The empirical analysis conducted across regions exposes some interesting findings. FDI in Sub Saharan Africa seems to have a positive impact on economic growth. However, this positive relationship is not found in East and South East Asia and Latin America. The use of 4-year lagged FDI variables to control for endogeneity might cause this rather strange result because lagged FDI and GDP growth seem to move in opposite directions in these two regions. Nevertheless, more research needs to be done for the Sub Saharan African region as figure 1 and our empirical evidence implies. Also, better instruments need to be found to control for the endogeneity bias since lagged FDI variables are not perfect because there are large fluctuations between the share of FDI to GDP over time (see figure 1).
30
Literature Aitken, B., J. and A. E. Harrison (1999), Do Domestic Firms Benefit from Direct Foreign Investment? Evidence from Venezuela, The American Economic Review, Vol. 89 (3), 605-618 Alfaro, L., A. Chanda, S. Kalemli-Ozcan and S. Sayek (2004), FDI and economic growth: the role of local financial markets, Journal of International Economics, Vol. 64 (1), 89112 Asiedu, E. (2002), On the Determinants of Foreign Direct Investment to Developing Countries: Is Africa Different?, World Development, Vol. 30 (1), 107-119 Asiedu, E. (2006), Foreign Direct Investment in Africa: The Role of Natural Resources, Market Size, Government Policy, Institutions and Political Instability, The World Economy, Vol. 29 (1), 63-77 Asiedu, E. and D. Lien (2011), Democracy, Foreign Direct Investment and Natural Resources, Journal of International Economics, Vol. 84 (1), 99-111 Balasubramanyam, V. N., M. Salisu and D. Sapsford (1996), Foreign Direct Investment and Growth in EP and IS Countries, The Economic Journal, Vol. 106 (1), 92-105 Barro, R and J. W. Lee (1993), International comparisons of educational attainment, Journal of Monetary Economics, Vol. 32 (3), 361–394 Basu, P., C. Chakraborty and D. Reagle (2003), Liberalization, FDI, and Growth in Developing Countries: A Panel Cointergration Approach, Economic Inquiry, Vol. 41 (3), 510-516 Bende-Nabende, A., J. L. Ford, B. Santoso and S. Sen (2003), The Interaction between FDI, Output and the Spillover Variables: Co-integration and VAR Analyses for APEC, 1965-1999, Applied Economic Letters, Vol. 10 (3), 165-172 Bhattacharyya, S. and R. Hodler (2010), Natural Resources, Democracy and Corruption, European Economic Review, Vol. 54 (4), 608-621 Borensztein, E., J. De Gregoria and J-W. Lee (1998), How does Foreign Direct Investment Affect Economic Growth, Journal of International Economics¸Vol. 45 (1), 115-135 Chervin, M., and S. Van Wijnbergen (2009). Economic Growth and the Volatility of Foreign Aid. University of Amsterdam and Tinbergen Institute. de Mello, L. R. (1999), Foreign Direct Investment-led Growth: Evidence from Time Series and Panel Data, Oxford Economic Papers, Vol. 51 (1), 133-151 Durham, J., B. (2004), Absorptive Capacity and the Effects of Foreign Direct Investment and Equity Foreign Portfolio Investment on Economic growth, European Economic Review, Vol. 48 (2), 285-306 31
Easterly, W.. Kremer, M., Pritchett and L., H., Summers (1993), Good Policy or Good Luck? Country Growth Performance and Temporary Shocks, Journal of Monetary Economics, Vol. 32 (3), 459-483 Findlay, R (1978), Relative Backwardness, Direct Foreign Investment, and the Transfer of Technology: A Simple Dynamic Model, The Quarterly Journal of Economics, Vol. 92 (1), 1-16 Girma, S. (2005), Absorptive Capacity and Productivity Spillovers from FDI: A Threshold Regression Analysis, Oxford Bulletin of Economics and Statistics, Vol. 67 (3), 281 306 Hansen, H. and J. Rand (2006), On the Causal Links Between FDI and Growth in Developing Countries, The World Economy, Vol. 29 (1), 21-41 Hermes, N. and R. Lensink (2003), Foreign Direct Investment, Financial Development and Economic Growth, Journal of Development Studies, Vol. 40 (1), 142-163 Lapan, H. and P. Bardhan (1973), Localized Technical Progress and Transfer of Technology and Economic Development, Journal of Economic Theory, Vol. 6 (1), 585-595 Li, X. and Lui, X. (2004), Foreign Direct Investment and Economic Growth: An increasingly Endogenous Relationship, World Development, Vol. 33 (3), 393-407 Nair-Reichert, U. and D. Weinhold (2001), Causality Tests for Cross-Country Panels: a New Look at FDI and Economic Growth in Developing, Oxford Bulletin of Economics and Statistics, Vol. 63 (2), 153-171 Naudé, W., A. and W. F. Krugell (2007), Investigating Geography and Institutions as Determinants of Foreign Direct Investment in Africa Using Panel Data, Applied Economics, Vol. 39 (10) 1223-1233 Romer, P.,M. (1990), Endogenous Technological Change, Journal of Political Economy, Vol. 98 (5), 71-102 Sachs, J., D. and A. M. Warner (2001), Natural Resources and Economic Development: The Curse of Natural Resources, European Economic Review, Vol. 45 (4-6), 827-838 UNCTAD (2011). Foreign Direct Investment in LDCs: Lessons Learned from the Decade 2001–2010 and the Way Forward. Retrieved from http://www.unctad.org/en/docs/diaeia2011d1_en.pdf Wang, J.-Y. and M. Blomström (1992), Foreign investment and technology transfer: A simple model, European Economic Review, Vol. 36 (1), 137-155 World Bank, (2012, March 1), Money and quasi money (M2) as % of GDP. Retrieved from http://data.worldbank.org/indicator/FM.LBL.MQMY.GD.ZS
32
Xu, B. (2000), Multinational enterprises, technology diffusion, and host country productivity growth, Journal of Development Economics, Vol. 62 (2), 477-493 Zhang, K. H. (2001), Does Foreign Direct Investment Promote Economic growth? Evidence From East Asia and Latin American, Contemporary Economic Policy, Vol. 19 (2), 175-185
33
Appendix A: Descriptive Statistics Descriptive statistics of dependent variable and independent variables (all developing countries) N (=1395) Mean Standard Min Max Deviation GDP growth (%) 994 3.480 4.835 -33.329 36.037 (dependent variable) Total investment as share 1157 12.814 8.448 1.61 91.48 of GDP (%) Ln (Initial GDP) 1018 7.527 0.92 4.214 10.756 Population Growth (%)
1232
2.038
1.496
-4.361
16.09
Schooling
710
0.853
0.752
0.011
4.004
Government Consumption as share of GDP (%) FDI as share of GDP (%)
1157
23.759
11.947
2.970
78.639
886
2.147
4.060
-16.734
54.804
M2 as share of GDP (%)
900
32.812
30.148
2.715
534.589
Openness as share of GDP (%) ICRGE
1156
78.147
51.172
2.800
440.666
981
4.499
1.894
0
10
Appendix B: Wooldridge test for serial correlation Wooldridge test of regression equation (1) for serial correlation ∆ GDP growth (%) Coefficients Standard t error (dependent variable)
P>|t|
95% confidence interval
∆ Total investment as share of GDP (%) ∆ Ln (Initial GDP)
0.099
0.051
1.96
0.054
-0.002
0.201
-4.733
4.026
-1.18
0.244
-12.758
3.292
∆ Population Growth (%)
0.484
0.301
1.61
0.112
-0.116
1.085
∆ Schooling
0.532
0.780
0.68
0.497
-1.022
2.087
0.081
-1.72
0.089
-0.230
0.022
0.116
-1.75
0.085
-0.432
0.029
∆ Government -0.138 Consumption to GDP (%) ∆ FDI as share of GDP -0.202 (%) H0: no first-order autocorrelation F(1, 69) = 1.546 Prob > F = 0.2179
34
Wooldridge test of regression equation (2) for serial correlation: H0: no first-order autocorrelation F(1, 69) = 1.616 Prob > F = 0.2080 Wooldridge test of regression equation (3) for serial correlation: H0: no first-order autocorrelation F(1, 69) = 2.854 Prob > F = 0.0956 Wooldridge test of regression equation (4) for serial correlation: H0: no first-order autocorrelation F(1, 69) = 0.951 Prob > F = 0.3328 Wooldridge test of regression equation (5) for serial correlation: H0: no first-order autocorrelation F(1, 60) = 2.699 Prob > F = 0.1056 Wooldridge test of regression equation (7) for serial correlation: H0: no first-order autocorrelation F(1, 69) = 2.135 Prob > F = 0.1485
Appendix C: List of countries passing the threshold values of the transmission channels for FDI to have a positive effect on economic growth Schooling (=2.588) Insignificant threshold
Openness (