Failure Mode & Effects Analysis
www.esi-intl.com
© 2002 by Jeffrey A. Veyera
All Rights Reserved
FMEA OVERVIEW LEARNING OBJECTIVES: • To understand Failure Mode & Effects Analysis (FMEA) concepts and terms • To know when to use FMEA • To be able to lead a process improvement team through successful FMEA completion • To know how to analyze FMEA results • To be able to craft risk mitigation plans informed by FMEA results
© 2002 by Jeffrey A. Veyera
All Rights Reserved
2
WHY COMPLETE AN FMEA? “First reckon, then risk.” Field Marshal Helmuth Graf von Moltke, 1800-1891 Risk is unavoidable in business. Every product we design and manufacture, every process we perform, every action we undertake carries with it some risk of failure, no matter how remote. Despite the dire consequences product or process failure may bring, we often do not take the time to evaluate and mitigate risk prior to launching a product or process.
Benefits of a Properly-Executed FMEA: • Improved product/process functionality & robustness • Reduced warranty/liability costs • Fewer manufacturing problems • Improved products and processes • Reduced business process issues • Greater customer satisfaction FMEAs PROVIDE A COMPLETE PICTURE OF RISK EXPOSURE © 2002 by Jeffrey A. Veyera
All Rights Reserved
3
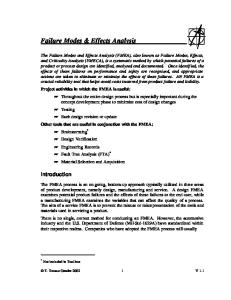
WHEN DO WE COMPLETE AN FMEA?
Measurable Y
Potential Xs
Improve Improvement strategy (mean shift and/or spread reduction)
Critical Xs Customer CTQs Initial Performance of Y (in Zst)
Performance Targets for Xs
Improvement model Control plan Implementation plan
Financial model* Updated Storyboard*
Post-project Performance of Y (in Zst) Transition plan
Business CTQs Project 4-Blocker*
Control
Confidence level & interval of above
Lessons learned* Risk analysis
Updated Storyboard*
Updated Database
Risk mitigation plan Performance target for Y (in Zst)
Project documentation (E-file, etc.)
Updated Database New Process Description (SIPOC, etc.)
Updated Storyboard*
Updated Storyboard* Updated Database
Updated Storyboard* Updated Database Updated Database Accept Champion Review 1 Signed: (Champion)
(Process Owner)
(BB/MBB)
Accept Champion Review 2 Signed: (Champion)
Accept Champion Review 3 Signed: (Champion)
(Process Owner)
(Process Owner)
(BB/MBB)
(BB/MBB)
Accept Champion Review 4 Signed: (Champion)
(Process Owner)
(Champion)
(Process Owner)
(BB/MBB)
* indicates template exists for deliverable which must be used
(BB/MBB)
(Finance Owner)
(Finance Owner)
© 2002 by Jeffrey A. Veyera
Accept Champion Review 5 Signed:
All Rights Reserved
4
Review 5
Process Description (SIPOC, etc.)
Analyze
Review 4
Measure
Review 3
Review 2
Project Charter*
Review 1
Define
TYPES OF FMEA There are two main types of FMEA: Design FMEAs, which are used to evaluate products, and Process FMEAs, which are used to evaluate processes.
PROCESS FMEA
DESIGN FMEA • Focuses on product risk • Breaks product down into subsystems for risk analysis • More technical in nature • Failure modes tied to external customer/end user CTQs • Does not rely on process controls to reduce risk • Does consider manufacturability issues • Relies upon clear definition of design intent
• Focuses on process risk • Breaks process down into steps for analysis • More transactional in nature • Failure modes tied to internal and external customer CTQs • Relies upon process controls to reduce risk • Does not contemplate product design issues • Requires clear definition of process flow
MAJOR DIFFERENCE IS WHETHER PRODUCT OR PROCESS IS STUDIED © 2002 by Jeffrey A. Veyera
All Rights Reserved
5
ELEMENTS OF FMEA Component to be evaluated
Symptoms of failure
Negative outcomes
Root causes of failure mode
Detection methods
Control Cause
Control
Effect Cause
Control
Cause
Control
Failure Mode Effect
Control Cause Control
Process Step/ Product/System
Control Failure Mode
Effect
Cause Control Control Cause Control
Effect Cause
Failure Mode Effect
Control Control
Cause
Control Severity (1-10) © 2002 by Jeffrey A. Veyera
X
Probability (1-10)
All Rights Reserved
X
Detection = Risk Priority (1-10) Number (RPN) 6
PERFORMING A DESIGN FMEA Gather Team of Experts Analyze & Improve • Should represent all subsystems/ • Calculate RPN components in design • Action plan • Should have detailed knowledge • Implement plan of design Determine Effects of Failure• Recalculate RPN • For each failure mode • List one or more possible impacts upon customer • Rank occurrence Determine Failure Modes Determine Causes of Failure • List every subsystem in • List one or more root causes Item/Process Column • Identify Controls allowing for • For each subsystem, list detection or prevention of root 2-3 ways it can fail cause • Rank severity according to • Rank detection provided scale © 2002 by Jeffrey A. Veyera
All Rights Reserved
7
PERFORMING A PROCESS FMEA Gather Team of Experts • Should represent all process steps • Should have detailed Determine Effects of Failure knowledge of process • For each failure mode • List one or more possible impacts upon customer • Rank occurrence Determine Failure Modes • List every process step in Item/Process Column • For each step, list 2-3 ways it can fail • Rank severity according to provided scale © 2002 by Jeffrey A. Veyera
Analyze & Improve • Calculate RPN • Action plan • Implement plan • Recalculate RPN
Determine Causes of Failure • List one or more root causes • Identify Controls allowing for detection or prevention of root cause • Rank detection All Rights Reserved
8
FMEA OBJECTIVE SCALES--SEVERITY Without objective scales, FMEAs can become exercises in frustration as the team tries to rank severity, occurrence, and detection to calculate RPN. The scales below can be used to objectively rank these areas: Effect
SEVERITY of Effect
Ranking 10
Hazardous without warning
Potential failure mode impacts safety of product without prior warning.
Hazardous with warning
Potential failure mode impacts safety of product with prior warning.
9
Very High
Potential failure mode renders product inoperative and irreparable without impact on safety.
8
High
Potential failure mode renders product inoperative but repairable without impact on safety.
7
Moderate
Product inoperative with minor damage
6
Low
Product inoperative without damage
5
Very Low
Product operative with significant degradation of performance (>50%)
4
Minor
Product operative with some degradation of performance (>10%)
3
Very Minor
Product operable with minimal interference (10% or less)
2
None
No effect
1
© 2002 by Jeffrey A. Veyera
All Rights Reserved
9
FMEA OBJECTIVE SCALES--OCCURRENCE Occurrence is based upon the probability of failure. To use, one must calculate the failure rate for a given element, then convert that failure rate to DPMO (defects per million opportunities) and apply the scale below. PROBABILITY of Failure Very High: Failure is almost inevitable
High: Repeated failures
Moderate: Occasional failures
Low: Relatively few failures
Remote: Failure is unlikely
Failure Prob 500,000 in 1,000,000 (1.5 Sigma)
Ranking 10
308,538 in 1,000,000 (2.0 Sigma)
9
158,655 in 1,00,000 (2.5 Sigma)
8
66,807 in 1,000,000 (3.0 Sigma)
7
22,750 in 1,000,000 (3.5 Sigma)
6
6,210 in 1,000,000 (4.0 Sigma)
5
1,350 in 1,000,000 (4.5 Sigma)
4
233 in 1,000,000 (5.0 Sigma)
3
32 in 1,000,000 (5.5 Sigma)
2
3.4 in 1,000,000 (6.0 Sigma)
1
© 2002 by Jeffrey A. Veyera
All Rights Reserved
10
FMEA OBJECTIVE SCALES--DETECTION Detection is based on the effectiveness of the process controls and the probability that they will adequately detect potential root causes of failure. Once this effectiveness is known, simply apply the scale below to rate detection. Detection
Likelihood of DETECTION by Design Control
Ranking 10
Absolute Uncertainty
Design control cannot detect potential cause/mechanism and subsequent failure mode
Very Remote
8 or < 3---there is a tendency to exaggerate DO use complementary tools such as Pareto analysis to inform results DO review RPN rankings at end to “sanity check” results DO use FMEA to follow up on required improvement actions FOLLOW THESE TIPS TO MAXIMIZE CHANCE OF SUCCESS © 2002 by Jeffrey A. Veyera
All Rights Reserved
13