Publication of the International Union Against Cancer
Int. J. Cancer: 107, 551–556 (2003) © 2003 Wiley-Liss, Inc.
EXPRESSION OF MICROSOMAL PROSTAGLANDIN E SYNTHASE-1 IN INTESTINAL TYPE GASTRIC ADENOCARCINOMA AND IN GASTRIC CANCER CELL LINES Bastiaan P. VAN REES1,†, Anna SIVULA2,3,†, Staffan THORE´ N4, Hiroshi YOKOZAKI5, Per-Johan JAKOBSSON4, G. Johan A. OFFERHAUS1 and Ari RISTIMA¨ KI2,3* 1 Department of Pathology, Academic Medical Center, Amsterdam, The Netherlands 2 Molecular and Cancer Biology Program, Biomedicum Helsinki, University of Helsinki, Helsinki, Finland 3 Department of Pathology, Helsinki University Central Hospital, Helsinki, Finland 4 Department of Medical Biochemistry and Biophysics, Karolinska Institutet, Stockholm, Sweden 5 First Department of Pathology, Hiroshima University School of Medicine, Hiroshima, Japan Gastrointestinal carcinomas synthesize elevated levels of prostaglandin E2 (PGE2), which has been mechanistically linked to carcinogenesis. Recently, microsomal prostaglandin E synthase-1 (mPGES-1) was cloned, which seems to be inducible and linked to cyclooxygenase-2 (Cox-2) in the biosynthesis of PGE2. We examined expression of mPGES-1 in intestinal type gastric adenocarcinomas and in gastric cancer cell lines. The transcript for mPGES-1 was elevated in 57% (4/7) of gastric carcinomas as detected by Northern blot analysis. Moderate to strong mPGES-1 immunoreactivity was observed in 56% (5/9) of the carcinomas as detected by immunohistochemistry. Furthermore, mPGES-1 mRNA, protein and microsomal PGES activity were detected in gastric adenocarcinoma cell lines that originated from intestinal type tumors (MKN-7 and MKN-28). In contrast to Cox-2, however, expression of mPGES-1 mRNA or protein were not induced by phorbol 12-myristate 13-acetate (PMA) or interleukin-1 (IL-1) in any of the gastric cancer cell lines tested (MKN-1, -7, -28, -45 and -74). Two gastric cancer cell lines (MKN-45 and MKN-74) did not express mPGES-1 and lacked microsomal PGES activity, but were still able to synthesize PGE2. Because all gastric cell lines expressed cPGES as detected by immunoblotting, it is possible that Cox-2 can interact with cPGES or with some other yet unidentified PGES in gastric cancer cells. Furthermore, our data show that regulatory mechanisms that drive expression of mPGES-1 and Cox-2 dissociate in gastric cancer cell lines. © 2003 Wiley-Liss, Inc. Key words: A549; carcinogenesis; Cox-1; Cox-2; cyclooxygenase; gastric cancer; HSC-39; KATO III; PGES; prostaglandin E synthase; MKN-1; MKN-7; MKN-28; MKN-45; MKN-74
Gastric and colon cancer tissues release higher levels of prostaglandin E2 (PGE2) when compared to nonneoplastic mucosa.1,2 This phenomenon seems to be specific for PGE2 because levels of other prostanoids were not increased. PGE2 has been shown to be mechanistically linked to carcinogenesis, because it inhibits apoptosis and enhances growth and motility of colon cancer cells.3,4 A recent study also demonstrated that PGE2 can mediate its action by transactivation of epidermal growth factor receptor in gastric epithelial cells, colon cancer cells and in rat gastric mucosa.5 Furthermore, mice lacking PGE2 receptor subtypes EP1 or EP4 showed a decreased formation of chemically induced aberrant crypt foci,6,7 and genetic disruption of EP2 receptor decreased number and size of intestinal polyps in Apc⌬716 mice.8 Thus, synthesis of PGE2 seems to be mechanistically linked to formation of gastrointestinal neoplasias. Prostaglandin E synthase (PGES) is the terminal isomerase involved in the synthesis of PGE2. Two distinct isoforms of PGES have been cloned,9 –11 of which cytosolic PGES (cPGES) seems to be constitutively expressed,11 whereas microsomal PGES-1 (mPGES-1) seems to be inducible and responsible for delayed PGE2 synthesis in response to inflammatory stimuli.9,10,12–14 Recent studies have described overexpression of mPGES-1 in lung, colon and endometrial adenocarcinomas.15–17 It is not, however,
known whether mPGES-1 is expressed in gastric cancer. Here we describe the expression of mPGES-1 in human gastric cancer specimens and in gastric cancer cell lines. MATERIAL AND METHODS
Patient samples Seven intestinal type primary gastric adenocarcinoma specimens and their paired control samples of gastric mucosa that contained no macroscopic tumor tissue or histologically detectable cancer cells were obtained from surgically removed tissues that were frozen in liquid nitrogen and stored at ⫺70°C until extraction of total RNA. In addition, 9 archive samples of intestinal type gastric adenocarcinoma were analyzed by using immunohistochemistry. RNA isolation and Northern blot analysis Total RNA was extracted by using the TriZol Reagent (Life Technologies, Paisley, Scotland) and analyzed by Northern blotting as described previously.18 Purified cDNA fragments of human Cox-2 (1.8 kb)19 and mPGES-1 (459 bp)9 were used as probes. Loading was controlled by -actin, which was visualized by autoradiography, or by staining ribosomal 28S RNA with GelStar (FMC Bio Products, Rockland, ME). Ratio of mPGES-1 and -actin was calculated from quantitation of the expression levels by using a high performance CCD camera (Cohu 4910 series with on-chip integration; Cohu, San Diego, CA) and with Scion Image 1.57 software (Scion, Frederick, MD) on a Macintosh personal computer. Immunohistochemistry Formalin fixed and paraffin embedded specimens were sectioned (4 –5 m), deparaffinized, and microwaved for 2.5 min in 800 W and for 15 min in 440 W in 0.01 M Na-citrate buffer (pH Grant sponsor: Academy of Finland; Grant sponsor: Finnish Cancer Foundation; Grant sponsor: Helsinki University Central Hospital Research Funds; Grant sponsor: Sigrid Juselius Foundation. †The first two authors contributed equally to this paper. *Correspondence to: Molecular and Cancer Biology Research Program, Biomedicum Helsinki, Room B512b, University of Helsinki, P.O. Box 63 (Haartmaninkatu 8), FIN-00014 Helsinki, Finland. Fax: ⫹358-9-191 26700. E-mail: ari.ristimaki@hus.fi Received 20 September 2002; Revised 9 January 2003, 7 May 2003, 28 May 2003; Accepted 13 June 2003 DOI 10.1002/ijc.11422
552
VAN
REES ET AL.
6.0). The slides were then immersed in 0.6 % hydrogen peroxide in methanol for 30 min and then in blocking solution (0.01 M Tris, 0.1 M MgCl2, 0.5% Tween-20, 1% BSA, 5% normal goat serum) for 1 hr to block endogenous peroxidase activity and unspecific binding sites, respectively. Immunostaining was carried out with a rabbit mPGES-1 anti-human affinity-purified polyclonal antibody preparation (160140; Cayman Chemical, Ann Arbor, MI) or with a Cox-2 specific anti-human monoclonal antibody (160112; Cayman Chemical) both in a dilution of 1:50 in the blocking solution at 4°C overnight. The sections were thereafter treated with goat anti-rabbit or with goat anti-mouse immunoglobulins (1:200; Vector Laboratories Inc., Burlingame, CA). Antibody binding sites were finally visualized by avidin-biotin peroxidase complex solution (Vectastain ABComplex, Vector Laboratories) and 3-amino9-ethylcarbazole (Lab Vision Co., Fremont, CA). The specificity of the antibody was determined by preadsorption of the primary antibody with human mPGES-1 control peptide or with human Cox-2 control peptide (20 g/ml, Cayman Chemical Co.) for 1 hr at room temperature before the staining procedure. The counterstaining was carried out with Mayer’s hemalum (Merck, Darmstadt, Germany). The intensity of the staining was estimated on a scale from 0 (absent), 1 (weak), 2 (moderate), 3 (strong) in consensus of 3 investigators (BvR, AS and AR). Cell culture Gastric carcinoma cell lines originated either from well or moderately differentiated intestinal type tumors (MKN-7, MKN-28 and MKN-74), from poorly-differentiated diffuse type tumors (MKN-45, HSC-39 and KATO III), or from an adenosquamous carcinoma (MKN-1). The cells were cultured in RPMI-1640 supplemented with 10% FCS (HyClone, Logan, UT), 2 mM Lglutamine, and antibiotics (BioWhittakerEurope, Verviers, Belgium), and maintained in 37°C at 5% CO2 in air. A lung adenocarcinoma-derived cell line (A549, American Type Tissue Collection ATCC, CCL-185) was maintained in Dulbecco’s modified Eagle medium (DMEM) supplemented with 10% FCS, Lglutamine and antibiotics. Before each experiment the confluent cultures were starved for 24 hr in RPMI-1640 or DMEM containing 0.5% FCS and then treated with or without human recombinant interleukin-1 (IL-1) (10 ng/ml; R&D Systems, Minneapolis, MN) or phorbol 12-myristate 13-acetate (PMA, 10 ng/ml; Sigma, St. Louis, MO) in starvation medium in 10-cm tissue culture dishes for 2– 48 hr. Western blot analysis The cells were lysed in RIPA buffer (150 mM NaCl, 1% NP-40, 1% sodium deoxycholate, 0.1% sodium dodecyl sulfate, 1 mM EDTA, 50 mM Tris pH 8.0) supplemented with Complete mini protease inhibitor cocktail tablets (ROCHE Diagnostics GmbH, Mannheim, Germany) and centrifuged at 14,000g for 15 min. Protein concentration was measured with bovine serum albumin protein assay (Pierce, Rockford, IL). Proteins (70 g) were resuspended in sample loading buffer (74 mM Tris-HCl pH 6.8, 2% SDS, 12% glycerol, 5% -mercaptoethanol, and 0.015% bromophenol blue), and separated by SDS (12 or 15%)-PAGE. The proteins were transferred electrophoretically to Hybond-C extra nitrocellulose membranes (Amersham Pharmacia Biotech, Buckinghamshire, UK). Nonspecific binding was blocked by TBSNP40-5% low-fat dry milk solution overnight at 4°C. For immunodetection membrane was incubated with the polyclonal mPGES-1 antibodies (1:250), with a monoclonal Cox-2 antibody (1:1,000), with a monoclonal Cox-1 antibody (1:500; 160110; Cayman Chemical), or with a cPGES anti-human affinity-purified polyclonal antibody preparation (1:250; 160150; Cayman Chemical) for 1 hr at room temperature. The membrane was washed 3 times in TBS-NP40, and incubated with sheep anti-mouse antibodies (Cox-2 and Cox-1) or donkey anti-rabbit (mPGES-1 and cPGES) conjugated to horseradish peroxidase (1:2,000; ECL Western blotting analysis system, Amersham Pharmacia Biotech) for 1 hr at room temperature. After 4 washes with TBS-NP40,
mPGES-1, Cox-2, Cox-1 and cPGES proteins were visualized by enhanced chemiluminescence (Amersham Pharmacia Biotech). PGES enzyme assay All cell lines were first incubated in starvation medium (0.5% FCS) over night, washed twice with 3 ml of PBS, and then trypsinized. Thereafter, the cells were centrifuged in complete culture media (3 ml) at 500g for 10 min followed by 2 washes with PBS (5 ml). Cell pellets were then snap frozen in a CO2/ethanol bath and stored at ⫺80°C. Microsomal and cytosolic PGES activities were evaluated from lysates that originated from one 10-cm cell culture dish as described previously.12 Measurement of PGE2 The cancer cell lines were plated on 12-well cell culture clusters and then treated with or without PMA (10 ng/ml; Sigma) and NS-398 (5 M; Cayman Chemicals) for 24 hr, after which the cells were washed once with RPMI-1640 and incubated further with arachidonic acid (10 M, Sigma) for 20 min. PGE2 was analyzed from the media by using EIA (Cayman Chemical). RESULTS
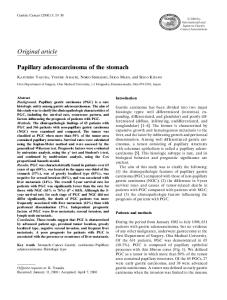
We first evaluated expression of mPGES-1 in gastric adenocarcinoma specimens. Four of seven (57%) carcinomas showed elevated levels of mPGES-1 mRNA (range 1.4 –3.7-fold) and the mean elevation was 1.9 ⫾ 0.4-fold (range ⫽ 0.8 –3.7) when compared to paired nonneoplastic gastric mucosa as detected by Northern blot analysis (Fig. 1). Subsequently, expression of mPGES-1 protein was evaluated in 9 gastric adenocarcinoma samples using immunohistochemistry. Moderate to strong mPGES-1 immunoreactivity was observed in the cytoplasm of gastric cancer cells in 5 of 9 (56%) cases (Fig. 2a). In addition, strong immunoreactivity was observed in surface lining cells of the nonneoplastic gastric glands adjacent to the tumor in all cases studied (Fig. 2b). Cox-2 was expressed by the gastric cancer cells in 66% of the cases. Although coexpression of mPGES-1 and Cox-2 was evident in one of the gastric cancer specimens (Fig. 2a,c), we failed to detect this in the rest of the samples. In contrast to mPGES-1, Cox-2 protein was not expressed by the superficial nonneoplastic epithelial cells as detected by immunohistochemistry (Fig. 2d). Expression of mPGES-1 and Cox-2 mRNAs were evaluated in 5 gastric cancer cell lines after incubation with and without PMA or IL-1 for 2, 6, 24 and 48 hr and detected by Northern blot analysis. A lung adenocarcinoma cell line (A549) served as a positive control for induction of mPGES-1 by IL-1.9 Expression of mPGES-1 and Cox-2 were induced by both PMA and IL-1 in A549 cells (Fig. 3). The peak induction for mPGES-1 was observed at the 24-hr time-point and for Cox-2 at the 6-hr time-point.
FIGURE 1 – Expression of mPGES mRNA in intestinal type adenocarcinoma of the stomach. Northern blot hybridization analysis of mRNA extracted from gastric cancer specimens (T) and from their paired nonneoplastic control samples (C) was carried out by using probes for human mPGES and -actin as the loading control. Four of seven tumor specimens are shown that expressed an elevated level of mPGES mRNA when compared to their controls.
PROSTAGLANDIN E SYNTHASE IN GASTRIC CANCER
553
FIGURE 2 – Human gastric tissues were stained with mPGES-1 and Cox-2 antibodies. (a,c) Intestinal type gastric adenocarcinoma. (b,d) Non-neoplastic mucosa adjacent to the tumor. Expression of mPGES-1 was evident in both gastric cancer cells (a) and in the adjacent nonneoplastic surface epithelium (b). Cox-2 expression was seen only in the cancer cells (c), but not in the nonneoplastic epithelium (d). An antigenic peptide was used as a blocking control (inserts). Original magnification ⫽ 200⫻.
FIGURE 3 – Expression of Cox-2 and mPGES-1 transcripts in five gastric adenocarcinoma cell lines and in a lung adenocarcinoma cell line (A549, which served as a positive control for induction of mPGES-1). The cells were incubated with or without IL-1 (10 ng/ml) or PMA (10 ng/ml) for 2– 48 hr. Cox-2 (top panel) and mPGES-1 (middle panel) mRNAs were detected by Northern blot analysis. For Cox-2 the 6-hr incubation time-point and for mPGES-1 the 24-hr incubation time-point are shown. Exposure times were 6 hr for the A549 Cox-2 blot, 2 days for the A549 mPGES-1 blot, 10 days for MKN-45 and MKN-74 mPGES-1 blots, and 1 day for the rest of the blots. Ribosomal RNA 28S served as loading control (bottom panel).
Three gastric carcinoma cell lines expressed mPGES-1 in a constitutive and noninducible manner (MKN-7 ⬎ MKN-28 ⬎ MKN1), whereas 2 of the cell lines (MKN-45 and MKN-74) did not
express detectable amounts of mPGES-1 mRNA, not even after induction (Fig. 3). In fact, PMA downregulated mPGES-1 mRNA expression in 2 of the cell lines (MKN-1 and MKN-28) at 6-hr,
554
VAN
REES ET AL.
FIGURE 4 – Expression of Cox-2, mPGES-1, Cox-1, cPGES, and -actin (as a loading control) proteins in the five gastric adenocarcinoma cell lines and in the lung adenocarcinoma cell line (A549). The cells were incubated with or without IL-1 (10 ng/ml) or PMA (10 ng/ml) for 2– 48 hr and the proteins were detected by Western blot analysis. For Cox-2 the 24-hr incubation timepoint is shown and for the rest the 48-hr incubation time-point. Exposure times were 15 sec for the A549 Cox-2 blot and 5 min for the rest of the blots. TABLE I – ACTIVITY OF PGES ENZYMES IN MICROSOMAL (mPGES) AND CYTOSOLIC (cPGES) FRACTIONS OF FIVE GASTRIC CANCER CELL LINES AND IN A LUNG ADENOCARCINOMA CELL LINE (A549)1 Cell line
mPGES activity
A549 MKN-1 MKN-7 MKN-28 MKN-45 MKN-74
135 62 405 408 ND ND
mPGES protein Ctr
PMA
Fold
0.14 0.49 2.35 1.26 ND ND
0.76 0.53 2.71 1.02 ND ND
5.4 1.1 1.2 0.8 ND ND
cPGES activity
12 2 14 18 8 9
cPGES protein Ctr
PMA
Fold
0.56 0.75 0.36 0.69 1.53 1.93
0.25 1.49 0.30 1.24 0.89 1.17
0.4 2.0 0.8 1.8 0.6 0.6
1 Microsomal and cytosolic PGES activities were measured from proteins that were isolated from cell lysates that originated from one 10 cm culture dish. The lysates were thereafter incubated on ice for 1 min in the presence of 10 M PGH2, after which PGE2 (pmol) was measured by using the EIA (see Materials and Methods for details). Densitometric values of mPGES/-actin and cPGES/-actin are from untreated (Ctr) and PMA-treated cells as measured from the immunoblots shown in Figure 4. ND, below detection limit.
24-hr and 48-hr time-points. In contrast to mPGES-1, Cox-2 mRNA expression was induced by PMA or IL-1 in all cell lines tested (Fig. 3). Expression of mPGES-1 protein was induced only in the positive control cell line (A549) as detected by Western blot analysis (Fig. 4). No mPGES-1 expression was detected in MKN-45 or MKN-74 cells. In contrast to Cox-2, expression of mPGES protein was not induced by PMA or IL-1 in any of the cell lines tested (Fig. 4). Thus, these data are consistent with the mRNA expression data as shown in Figure 3. Cox-1 protein was expressed clearly by only one cell line (MKN-1), whereas low levels were present in MKN-7, MKN45, MKN-74 and A549 cells (Fig. 4). In addition, there was an increase in Cox-1 protein expression after PMAtreatment in MKN-45 and MKN-74 cells. Variable amounts of cPGES protein were detected in each gastric cancer cell, and a modest induction of protein expression was detected in 2 of the gastric cancer cell lines (MKN-1 and MKN-28) (Fig. 4).
Microsomal and cytosolic PGES activities were analyzed next. Activity of mPGES (microsomal) was observed in 3 gastric cancer cell lines (MKN-1, MKN-7 and MKN-28) and in A549 cells (Table I). In contrast, MKN-45 and MKN-74 were devoid of any detectable mPGES activity. These data are consistent with mPGES mRNA and protein expression data shown in Figures 3 and 4. Activity of cPGES (cytosolic) was detected in all cell lines tested without any clear correlation with the protein expression data (Table I). Combined activities of Cox and PGES enzymes were studied by measuring conversion of arachidonic acid to PGE2 in cell cultures that were pretreated with PMA or a Cox-2 selective inhibitor NS-398 (5 M) for 24 hr. PMA induced PGE2 production in all cell lines, and NS-398 inhibited significant proportion of both basal (73–92%) and PMA-induced (78 –95%) PGE2 synthesis (Table II). Two gastric cancer cell lines that synthesized the highest levels of PGE2 were MKN-45 and MKN-74. These 2 cell lines, however, were the ones least responsive to the treatment with
555
PROSTAGLANDIN E SYNTHASE IN GASTRIC CANCER TABLE II – SYNTHESIS OF PGE2 BY FIVE GASTRIC CANCER CELL LINES AND BY THE A549 LUNG CANCER CELL LINE1 Cell line
A549 MKN-1 MKN-7 MKN-28 MKN-45 MKN-74
PGE2 synthesis (Inhibition by NS-398)
Cox-2 protein
Cox-1 protein
Ctr
PMA
Fold
Ctr
PMA
Fold
Ctr
PMA
Fold
3205 ⫾ 184 (90%) 709 ⫾ 62 (73%) 222 ⫾ 14 (74%) 402 ⫾ 36 (93%) 2453 ⫾ 163 (91%) 1003 ⫾ 108 (92%)
48899 ⫾ 1226 (89%) 6193 ⫾ 1181 (95%) 1615 ⫾ 45 (78%) 22915 ⫾ 2152 (93%) 4329 ⫾ 197 (95%) 2093 ⫾ 46 (93%)
15.3 8.7 7.3 57 1.8 2.1
1.10 0.24 0.38 0.27 1.41 0.93
1.97 0.95 1.07 1.26 1.41 1.46
1.8 4.0 2.8 4.7 1.0 1.6
0.08 0.52 0.08 ND 0.08 0.17
0.07 0.57 0.08 ND 0.25 0.36
0.9 1.1 1.0 ND 3.1 2.1
Cells were first incubated with or without PMA (10 ng/ml) for 24 hr, after which the cells were washed once, and then incubated with arachidonic acid (10 M) for 20 min. The effect of NS-398 (5 M) on both untreated and PMA-treated cultures is shown as % of inhibition when compare to the cultures that did not receive any NS-398. PGE2 (pg/ml) was measured by using EIA, and the results are shown as means ⫾ SEM (n ⫽ 3). Densitometric values of Cox-2/-actin and Cox-1/-actin are from untreated (Ctr) and PMA-treated cells as measured from the immunoblots shown in Figure 4. ND, below detection limit.
PMA (2-fold induction). Interestingly, MKN-45 and MKN-74 cells did not express any mPGES mRNA, protein or activity. In contrast, cell lines that expressed mPGES (MKN-1, MKN-7, MKN-28 and A549) were much more responsive to PMA-treatment in respect to PGE2 production (7- to 57-fold induction). Furthermore, we have shown previously that 2 gastric cancer cell lines that derived from diffuse signet ring cell type tumors (KATO III and HSC-39) expressed low or nondetectable levels of Cox-2 mRNA and protein and converted relatively low amounts of arachidonic acid to PGE2.20 Our current data suggest that these 2 cell lines do not express any detectable mPGES-1 mRNA, protein or enzymatic activity (data not shown). DISCUSSION
We have studied the expression of mPGES-1 in primary gastric adenocarcinomas and in gastric cancer cell lines. Our results show that expression of mPGES-1 transcript is elevated by approximately 2-fold in the gastric carcinoma specimens when compared to paired nonneoplastic mucosa, and that expression of mPGES-1 protein localized to the cancer cells in 56% of the tumor specimens. It was reported recently that mPGES-1 is expressed in 79 –100% of lung, colorectal and endometrial carcinomas.15–17 Although expression of mPGES-1 was low or nondetectable in normal bronchial mucosa, nonneoplastic colonic epithelium and secretory phase endometrium,15–17 we found high levels of mPGES-1 expression in nonneoplastic gastric surface epithelium next to the tumors. Because lipopolysaccharides have been shown to induce mPGES-1 expression in normal rat stomach,10 it is possible that tumor-derived factors stimulate expression of mPGES-1 in the nonneoplastic surface epithelium of the gastric mucosa. Alternatively, this expression may be of physiological nature, because mPGES-1 mRNA expression has been detected in normal human stomach tissues.9 Proinflammatory cytokines IL-1 and tumor necrosis factor-␣ induce coordinately mPGES-1 and Cox-2 expression in lung and colorectal cancer cell lines.12,16,17 In addition, we found that mPGES-1 expression is induced by PMA in the lung adenocarcinoma A549 cell line. Although expression of Cox-2 and conversion of arachidonic acid to PGE2 was induced (by PMA or IL-1 or both) in the gastric cancer cell lines, mPGES-1 expression was not stimulated in any of them. This suggests that regulation of mPGES-1 and Cox-2 expression occur via separate pathways in gastric cancer cell lines. It was shown recently that transcription of mouse mPGES-1 is regulated by Egr-1, but not by several other transcription factors that are known to induce Cox-2.21 Because
Cox-2 is also regulated at posttranscriptional mRNA stability level,19 these differences in regulation of expression may also depend on differences in mRNA stability and its regulation. We have published previously that expression of Cox-2 transcript is elevated by approximately 10-fold in gastric cancer tissues, whereas Cox-1 is not, and that Cox-2 protein expression is predominantly a property of the intestinal type gastric tumors.18,20 Our current data show that Cox-2 is the most important Cox enzyme in production of PGE2 in gastric cancer cells. This is supported our data that show that most of basal and PMA-induced PGE2 production was blocked by the Cox-2 selective inhibitor NS-398. Thus, although some of the cell lines express Cox-1 and this expression was slightly induced by PMA in two of the cell lines, Cox-1 plays a minor role in synthesis of PGE2 in gastric cancer cells. mPGES-1 was expressed in 2 of 3 cell lines that derived from intestinal type tumors (MKN-7 and MKN-28) and in one that originated from an adenosquamous tumor (MKN-1). None of the cell lines that derived from diffuse type tumors expressed mPGES-1 (MKN-45, KATO III and HSC-39). Interestingly, two of the cell lines (MKN-45 and MKN-74) that were devoid of mPGES-1 expression were still able to release PGE2. This may depend on cPGES, because its activity and protein expression were detected in all cell lines tested. Similarly to our data, it was published recently that a thyroid epithelial cell line (KAT-50) expressed only Cox-2 and cPGES but not Cox-1 or mPGES and was still able to synthesize PGE2.22 Alternatively, this may depend on a newly characterized mPGES-223 or some other yet unidentified PGES. Our data suggest that mPGES expression may be necessary for efficient PMA-induced (and Cox-2 dependent) synthesis of PGE2 because the induction was higher in the cell lines that expressed mPGES (MKN-1, MKN-7 and MKN-28) when compared to the cell lines devoid of mPGES (MKN-45 and MKN74). In conclusion, our data show that mPGES-1 is expressed in intestinal type gastric adenocarcinoma specimens and in gastric cancer cell lines. Cox-2 is the most important Cox enzyme in PGE2 production in gastric cancer cells, and expression of mPGES-1 may be necessary for high induction of PGE2 synthesis in these cells. Furthermore, regulatory mechanisms that drive expression of mPGES-1 and Cox-2 dissociate in gastric cancer cell lines. ACKNOWLEDGMENTS
We want to thank Ms. Tuija Hallikainen for excellent technical assistance.
REFERENCES
1. 2. 3.
Rigas B, Goldman IS, Levine L. Altered eicosanoid levels in human colon cancer. J Lab Clin Med 1993;122:518–23. Uefuji K, Ichikura T, Mochizuki H. Cyclooxygenase-2 expression is related to prostaglandin biosynthesis and angiogenesis in human gastric cancer. Clin Cancer Res 2000;6:135– 8. Sheng H, Shao J, Morrow JD, Beauchamp RD, DuBois RN. Modu-
4. 5.
lation of apoptosis and Bcl-2 expression by prostaglandin E2 in human colon cancer cells. Cancer Res 1998;58:362– 6. Sheng H, Shao J, Washington MK, DuBois RN. Prostaglandin E2 increases growth and motility of colorectal carcinoma cells. J Biol Chem 2001;276:18075– 81. Pai R, Soreghan B, Szabo IL, Pavelka M, Baatar D, Tarnawski AS.
556
6.
7.
8.
9.
10.
11.
12.
13.
14.
VAN
REES ET AL.
Prostaglandin E2 transactivates EGF receptor: a novel mechanism for promoting colon cancer growth and gastrointestinal hypertrophy. Nat Med 2002;8:289 –93. Watanabe K, Kawamori T, Nakatsugi S, Ohta T, Ohuchida S, Yamamoto H, Maruyama T, Kondo K, Ushikubi F, Narumiya S, Sugimura T, Wakabayashi K. Role of the prostaglandin E receptor subtype EP1 in colon carcinogenesis. Cancer Res 1999;59:5093– 6. Mutoh M, Watanabe K, Kitamura T, Shoji Y, Takahashi M, Kawamori T, Tani K, Kobayashi M, Maruyama T, Kobayashi K, Ohuchida S, Sugimoto Y, et al. Involvement of prostaglandin E receptor subtype EP4 in colon carcinogenesis. Cancer Res 2002;62: 28 –32. Sonoshita M, Takaku K, Sasaki N, Sugimoto Y, Ushikubi F, Narumiya S, Oshima M, Taketo MM. Acceleration of intestinal polyposis through prostaglandin receptor EP2 in Apc⌬716 knockout mice. Nat Med 2001;7:1048 –51. Jakobsson P-J, Thor´en S, Morgenstern R, Samuelsson B. Identification of human prostaglandin E synthase: a microsomal, glutathionedependent, inducible enzyme, constituting a potential novel drug target. Proc Natl Acad Sci USA 1999;96:7220 –5. Murakami M, Naraba H, Tanioka T, Semmyo N, Nakatani Y, Kojima F, Ikeda T, Fueki M, Ueno A, Oh-ishi S, Kudo I. Regulation of prostaglandin E2 biosynthesis by inducible membrane-associated prostaglandin E2 synthase that acts in concert with cyclooxygenase-2. J Biol Chem 2000;275:32783–92. Tanioka T, Nakatani Y, Semmyo N, Murakami M, Kudo I. Molecular identification of cytosolic prostaglandin E2 synthase that is functionally coupled with cyclooxygenase-1 in immediate prostaglandin E2 biosynthesis. J Biol Chem 2000;275:32775– 82. Thor´en S, Jakobsson P-J. Coordinate up- and down-regulation of glutathione-dependent prostaglandin E synthase and cyclooxygenase-2 in A549 cells. Inhibition by NS-398 and leukotriene C4. Eur J Biochem 2000;267:6428 –34. Stichtenoth DO, Thor´en S, Bian H, Peters-Golden M, Jakobsson P-J, Crofford LJ. Microsomal prostaglandin E synthase is regulated by proinflammatory cytokines and glucocorticoids in primary rheumatoid synovial cells. J Immunol 2001;167:469 –74. Han R, Tsui S, Smith TJ. Up-regulation of prostaglandin E2 synthesis by interleukin-1 in human orbital fibroblasts involves coordinate
15.
16.
17.
18. 19. 20.
21.
22.
23.
induction of prostaglandin-endoperoxide H synthase-2 and glutathione-dependent prostaglandin E2 synthase expression. J Biol Chem 2002;277:16355– 64. Jabbour HN, Milne SA, Williams AR, Anderson RA, Boddy SC. Expression of COX-2 and PGE synthase and synthesis of PGE2 in endometrial adenocarcinoma: a possible autocrine/paracrine regulation of neoplastic cell function via EP2/EP4 receptors. Br J Cancer 2001;85:1023–31. Yoshimatsu K, Altorki NK, Golijanin D, Zhang F, Jakobsson P-J, Dannenberg AJ, Subbaramaiah K. Inducible prostaglandin E synthase is overexpressed in non-small cell lung cancer. Clin Cancer Res 2001;7:2669 –74. Yoshimatsu K, Golijanin D, Paty PB, Soslow RA, Jakobsson P-J, DeLellis RA, Subbaramaiah K, Dannenberg AJ. Inducible microsomal prostaglandin E synthase is overexpressed in colorectal adenomas and cancer. Clin Cancer Res 2001;7:3971– 6. Ristim¨aki A, Honkanen N, J¨ank¨al¨a H, Sipponen P, H¨ark¨onen M. Expression of cyclooxygenase-2 in human gastric carcinoma. Cancer Res 1997;57:1276 – 80. Ristim¨aki A, Garfinkel S, Wessendorf J, Maciag T, Hla T. Induction of cyclooxygenase-2 by interleukin-1␣. Evidence for post-transcriptional regulation. J Biol Chem 1994;269:11769 –75. Saukkonen K, Nieminen O, van Rees B, Vilkki S, H¨ark¨onen M, Juhola M, Mecklin JP, Sipponen P, Ristim¨aki A. Expression of cyclooxygenase-2 in dysplasia of the stomach and in intestinal-type gastric adenocarcinoma. Clin Cancer Res 2001;7:1923–31. Naraba H, Yokoyama C, Tago N, Murakami M, Kudo I, Fueki M, Oh-Ishi S, Tanabe T. Transcriptional regulation of the membraneassociated prostaglandin E2 synthase gene. Essential role of the transcription factor Egr-1. J Biol Chem 2002;277:28601– 8. Han R, Smith TJ. Cytoplasmic prostaglandin E2 synthase is dominantly expressed in cultured KAT-50 thyrocytes, cells that express constitutive prostaglandin-endoperoxide H synthase-2. Basis for low prostaglandin E2 production. J Biol Chem 2002;277:36897–903. Tanikawa N, Ohmiya Y, Ohkubo H, Hashimoto K, Kangawa K, Kojima M, Ito S, Watanabe, K. Identification and characterization of a novel type of membrane-associated prostaglandin E synthase. Biochem Biophys Res Commun 2002;291:884 –9.