Fracture Mechanics of Concrete Structures Proceedings FRAMCOS-3 AEDIFICATIO Publishers, D-79104 Freiburg, Germany
EXPERIMENTAL INVESTIGATION OF OVER-REINFORCED CONCRETE BEAMS OF THREE DIFFERENT TYPES OF CONCRETE AND AT TWO DIFFERENT SIZE SCALES
J. P. Ulfkjaer, European Cmmnission, Joint Research Centre, Institute for Systems, Infonnatics and Safety, Italy
Abstract Experimental results from twelve beam experiments is presented. Three different materials at two size scales have been tested. The results are presented as load displacement curves and as moment rotation curves. Key words: Compression failure, four point Bending, normal strength concrete, high strength, steel fibre. 1 Introduction The goal is to investigate whether current modelling techniques, in combination with standard test data on strain softening of concrete under mode I and uniaxial compression are sufficient tools for correctly predicting the behaviour of over-reinforced concrete beams. The reason for choosing over-reinforced concrete beams is that they are relatively simple to test and that the softening part of the compression behaviour has a significant influence of the overall behaviour of the beams. Three different types of concrete at two different size scales have been tested.
1253
2 Experiments 2.1 Materials 2.1.1 Steel Two different types of steel were used. Ribbed steel bars and stranded wires. It was necessary to use stranded wires in the beams with high compressive strength in order to ensure a compressive failure. Three uniaxial tensile tests have been performed for the ribbed steel bars. The initial modulus of elasticity was measured using a device attached directly on the specimens. The initial modulus of elasticity was detennined as E,.b = 22200 GPa and the yield strength as 650 MPa. Three uniaxial tensile tests have been performed for the stranded wires. The initial modulus of elasticity was measured using a device which measures directly on the specimens. The initial modulus of elasticity was detennined as Esw = 197000 GPa. The rest of the stress-strain relationship could not be measured due to difficulties with the grips. 2 .1.2 Concrete A nonnal strength concrete (NSC), a very brittle high strength concrete (HSC) and a similar concrete, but with an added large amount of steel fibres (FRHSC) have been tested. The composition of the three materials can be seen in table 1. Table 1. Composition of the three types of concrete. Units are kg/m3 Cement Densit Binder Silica Fume Pozzolith 80 N Water Steel Fibres Sand (0 mm- 0.25 mm) Sand (0.25 mm - 1 mm) Sand (1 mm - 4 mm) Sand (0 imn - 2 mm) Sand (2 mm- 4 mm)
NSC 212 0 9.96 1.57 155 0 0 0 0 945 1001
HSC 0 971 0 0 146 0 176 357 716 0 0
FRHSC 0 971 0 0 158 503 176 357 716 0 0
Different reference parameters have been determined usmg different
1254
measurement techniques and boundary conditions. compressive strength, the tensile strength and the fracture energy are shown in 2. a more detailed description of stress strain curves in compression reference is made to Ulfkjaer, 997).
Table 2. Compressive strength, uniaxial tensile energy of three types fonnat Mean/Coefficient Type of concrete NSC FRHSC
Compressive strength
Tensile strength
22.75/2.0 117.74/9.0 114.41/4.0
1.89/17.7 4.83/9.71 7 .14/02.9
85/14 125/35.9 3780/l
beams are tested in four point bending at two ~A~~~A~AAL largest beam geometry is exactly twice scale scales are given the names 'small' and (i.g. a be of a strength concrete largest size 2.2.1 Small specimens the dimensions length 3 800 mm, of type thickness 100 1mn three tested. For simplicity the same reinforcement very high compressive nine beams. Due to ~~A~'AA-·•A~ concrete it was necessary to use 8 "'..-..-."'". . '"''°'nl to · an over reinforced fracture in three layers, three bars in the two lowest layer layer. layers are (centre of gravity mm from bottom of beam. centre of gravity) is 23. 6 imn wires are 26.4 mm in the two lowest layers,
1255
concrete
2.2.2 Large specimens Three beams with the dimensions length 7 500 mm, span: 7200 mm, depth 400 mm, and thickness 200 imn of nonnal strength concrete were tested. Originally it was planned to scale the small beams by a factor of two including the reinforcement. It was however, not practically possible to arrange 32 stranded wires in the mould. Instead, 9 ribbed bars were used. The ribbed bars are placed in three layers, with three bars in each layer, 40 1mn, 80 1mn and 120 imn from the bottom of the beam. The cover in the vertical direction (to centre of I:,rravity) is 41 mm and the distance between the bars is 59 nun.
2.3 Test Set-up The beams were subjected to four point bending in a servo-controlled materials testing system. At both supports horizontal displacements and rotations were allowed, and at one support rotation around the beam axis were also allowed. At the load point rotations were allowed around two axes. This should reduce the influence of axial nonnal forces and torsion. At both end a stop was placed at the top of the beam to prevent the beam from sliding off the supports. The stroke was measured using a built-in LVDT (Linear Variable Differential Transfonners). The vertical displacements were measured at nine points using LVDTs. The horizontal displacements of the beam were measured at both beam ends using two L VDTs. Between the loads a set of measuring frames were fixed to the beam. frames were attached to the beams in three points and with three L VDTs attached to each frame. The L VDTs were thus measuring the horizontal displacement between two frames in three points. By assuming that plane sections remain plane it is possible to calculate the mean strain field in each measuring field.
2.3 Test procedure The rate of loading was chosen such that the peak load would be reached within 5-10 minutes. A typical experiment would take about 30 minutes. signals, together with time, t, were recorded using a data logger and a computer. The tests were controlled by a feedback signal that
1256
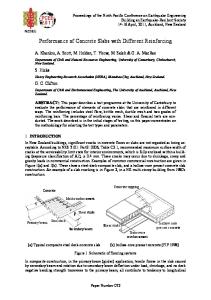
Fig. 1. Photo of the large beam. The acqms1tlon left) and the servo control (to the right) can be seen. included contributions from both the shown a photo of test set-up for one
and
COD.
3 Results 3.1 Load displacement and moment curves The results are presented as Load-displacements curves rotation curves, were the displacement is rotation is the rotation at the supports. included by calculating a force gives moment in the loading points, and by adding The rotation at supports are by adding and by dividing by distance the two figure 7 the results from the small beam figure 9 the curves for the large The peak load, deformation at peak rotation at peak are shown in table 3.
1257
IS
NSC Small
NSC Small
18
30
16
25 14
12 ~ 10 0
~
~
8
s
0 10
6
~
4
NSC la ... NSC2b NSC le
2
0'--~--~~---~---~
60
40
20
0
1
2
3
Rotation [-]
Displacement Fig. 2. Load displacement curves for NSC for the small beams.
x
10-5
Fig. 3. Moment rotation curves for NSC for the small beams.
HSC
HSC
60
NSC la NSClb NSC le
5
o.__~~..__~~.__~__,
0
15
Q)
90 , - - - - - - - - , HSCa HSCb HSCc
50
../'
80
I'
'J'....
70
S6o
HSC a HSCb
fr
/
~---H_s_c_c__. _,. ./~-'
./ .
~........., 50 5s 40
/
l
'.I
l'
/ :.
.
~ 30 20
10
10 o.__~~_._~~~...._~
20
40
60
0
Displacement [mm] Fig. 4. Load displacement curves for HSC.
2
Rotation [-]
4 x
-5
10
Fig. 5. Moment rotation curves for HSC.
1258
FRHSC
70
FRHSC
120
60
100
50
~40
80
:
\
/.·
"d
C5 30
c 60
s0
~
20 FRHSC a FRHSCb FRHSCc
20
40
60
:
f.·
~
~
10
I.·
.;....>
\: i
I:
40 20
80
4
2
[mm]
Rotation
x
curves
6. Load FRHSC.
6
curves
/
.. ·.. I ·..\
\
..
NSC2a NSC2b NSC2c
20
40
60
80
2
Displacement [mm]
x
1259
Table 3. Peak characteristics for beam tests. Type NSC Size 1 No. 1 NSC Size 1 No. 2 NSC Size 1 No. 3 FRHSCa FRHSCb FRHSCc HS Ca HS Cc NSC Size 2 No. 1 NSC Size 2 No. 2 NSC Size 2 No. 3
[mm] 21.55 20.49 20.96 52.07 54.15 48.97 57.25 52.88 57.04 .89 47.61 52.88
Upeak
[kN] 16.92 15.94 16.37 66.90 63.45 59.93 54.49 55.48 . 59.18 60.00 61.68 70.65
Ppeak
[1mn- l J l.687e-5 l .582e-5 l.648e-5 4.306e-5 4.536e-5 4.029e-5 4.387e-5 4.294e-5 4.636e-5 1. 734e-5 1.93 le-5 2. l 79e-5
af)eak
[kNm] 25.39 23.90 24.56 100.3 95.17 89.90 81.72 83.21 88.77 90.01 92.5 106.0
Mpeak
4 Conclusions results from twelve beam tests have been presented. It is seen that the behaviour is highly dependent on the material type and also a size effect is seen. the high strength concrete and the ultra high strength concrete the influence of the descending branch of the stress strain relationship is of highly impmiance.
5 beam experiments repmied here were perfonned by M.Sc. Lone Pedersen, M.Sc. Kim Bundgaard and M.Sc. Torben M0rch during their masters project.
6 References
Pedersen, L.H., Bundgaard, K. and M0rch, (1996), Compression Concrete Beams, Aalborg University, Masters Thesis, pp. 1162. Ulfkjaer, Van Mier and Stang (1997), Invitation to Competition on .................. .: . of Over-Reinforced Concrete Beams, pp. l - 33.
1260