Exchange Rates and the Extensive Margin of Exports Daria Taglioni (World Bank) 1 March 2012
The relationship between the level of a currency and trade is multi-faceted and complex. Reflecting this complexity, empirical tests yield mixed findings and imply that the nature of the impact of a change in the level of the exchange rate on trade cannot be clearly and univocally identified. This paper suggests that - well before any considerations on elasticity and adjustment patterns - the initial effect of a change in the level of the exchange rate on trade is a priori ambiguous in sign, statistical significance and intensity. The reason for this indeterminacy is that such impact will depend on the specific characteristics both of the economy at large and of the individual firms populating it. Focusing on the short-run effect of a change in the level of the exchange rate on exports, it highlights one source of indeterminacy or ambiguity on the impact of such a change in the level of the exchange rate on exports. It suggests that a change in the level of the exchange rate has two opposed effects. On the one hand it tends to reduce the value in national currency of the export sales and the profit margins of exporters. On the other hand however, it unlocks pro-competitive effects through a variety of channels arising due to increased competition both on the domestic and foreign market. Hence, an important contribution of this paper is to show that the offsetting effects of exchange rate movements can be clearly detected by using improvements derived from theoretical refinements (the "new-new" trade theory) and new statistical information (firm-level data). Empirically, we test separately for these effects by quantifying the effect of changes in the value of the exchange rate on each of the margins of trade (intensive, firm-extensive, market-extensive, and product-extensive). A novelty of this paper is to further decompose the net effects at each of the margins in entries and exits. In other words we are able to test separately the effects for firm that start their export activity from the effect on firm that cease exporting, as well as for entries into new markets from exits from old markets, and for venturing into the export of new products from the phasing out of old products.
JEL codes: JEL Codes: F12, F14, F31
1 - Introduction Throughout history, international trade and monetary relations have demonstrated to be closely entangled (Irwin 2011). A key element of their interaction is the effect that exchange rates have on international trade flows. Overall, the effect of increased exchange rates variability (volatility) on trade has dominated the literature on the subject (IMF 1984, 2004). However, since the mid-2000s, the relationship between the level (misalignment) of exchange rates and trade is increasingly more debated both in academic and policy fora. Part of this debate focuses on the extent to which changes in the level of the exchange rate - i.e. changes leading to the under/over valuation of the domestic currency or, so to speak, the price of domestic goods relative to foreign goods - can affect economic growth via a boost/dampening of a country’s exports (Rodrik, 2008; Mattoo and Subrumanian, 2010; and Berg and 1
The author gratefully acknowledges input from Jose Daniel Reyes and Tolga Cebeci. This is a preliminary version of the paper. Please do not distribute or circulate without the prior consent of the author (
[email protected])
1
Miao, 2010). The reasoning revamps an argument first made by Keynes in 1931, according to which, the effect of unanticipated currency devaluations bears similarities with the effects of the joint imposition of an export subsidy and an import tariff on all goods. Recently, the debate on exchange rate misalignments has gained further steam. Some hold the view that the global economy is currently characterized by persistent exchange-rate misalignments and that these are creating trade frictions worldwide. As a result, in recent months, there has been a new "trend to address what is perceived as currency undervaluation through trade measures: exchange rate developments fed into requests by industries for more tailored assistance and protection from foreign competition" (WTO 2011a). Stressing this view, some analysts argue that the WTO should adopt trade rules that allow nations to neutralize the effects of exchange-rate misalignments (Thorstensen et al. 2011). However, the rich body of theoretical and empirical studies, excellently reviewed by the WTO (Auboin and Ruta, 2011 and WTO, 2011b), clearly shows that the relationship between the level of a currency and trade is so multi-faceted and complex that no conclusive and bold statement can be made on the effects of an undervalued or overvalued currency on trade. Standard economic theory suggests that, under perfect market conditions, an exchange-rate misalignment has no long-run effect on trade flows. At the same time, models that assume market distortions, such as information problems or product market failures foresee the possibility of impacts of a currency shock on the real side of the economy, e.g. an unforeseen change in the level of the exchange rate can alter the relative price of domestic vs. foreign goods to the extent that some prices in the economy are sticky (e.g. Korinek and Serven, 2010). As the WTO review highlights, however, movements in nominal exchange rates can alter relative prices and affect international trade flows only under given assumptions and in the short-run. The intensity of the trade effects of a currency shock is destined to peter out over the medium-term as relative prices adjust and converge towards the levels at which they reflect structural differences between the competitive bases of different countries, i.e. the so-called non-price dimension of competitiveness. Importantly, the above literature assumes that when prices are sticky and other necessary conditions hold, the nature of the impact of a change in the level of the exchange rate on trade can be clearly and univocally identified. Yet, as we will discuss in this paper, this is not the case. Well before any considerations on elasticity and adjustment patterns, it can be shown that the initial effect of a change in the level of the exchange rate on trade is a priori ambiguous in sign, statistical significance and intensity. The reason for this indeterminacy is that such impact will depend on the specific characteristics both of the economy at large and of the individual firms populating it. The stability and sophistication of the financial markets (Taglioni and Zavacka, 2012), the extent to which domestic exporters hedge against foreign exchange risk (Fabling and Grimes, 2008), the currency in which they invoice their products (Staiger and Sykes 2010) and the type of exposure of firms to trade (Ekkholm et al 2012) all affect the exchange rate-trade nexus. For example, when the domestic value added content of exports is low (i.e. when the import content of exports is high), a devaluation may lead to the paradoxical effect of harming the domestic industry. By increasing the price of imported components, denominated in foreign currency, a lower value of the domestic currency may lead to overall higher costs of production for the final product. Standard economic models that abstract from the 2
sophistication of modern global production structures would therefore draw erroneous conclusions on the sign and significance of the trade effect (Evenett, 2010). Reflecting the underlying conceptual complexity, empirical tests yield mixed findings and do not allow for conclusive statements. For instance, a currency undervaluation is sometimes found to have a positive impact on exports (e.g. Freund and Pierola 2008, Rodrick, 2008 and Berg and Miao, 2010), but the size and persistence of these effects are not consistent across different studies (e.g. Haddad and Pancaro 2010). Other studies find that export volumes tend to be broadly insensitive to time-series changes in exchange rates. The elasticity of aggregate exports to real exchange rate movements is typically found to be low, in particular as countries tend to become more industrialized. It is below unity for example in Hooper, Johnson, and Marquez (2000) while in international real business cycle models, the elasticity used for simulations can be as low as 0.5. As Berman et al. (2012) highlight, movements of nominal and real exchange rates also tend to have a modest effect on other aggregate variables related to exports such as import prices, consumer prices, and the volumes of imports. For example, the lack of sensitivity of prices to exchange rate movements has been documented by Goldberg and Knetter (1997) and Campa and Goldberg (2005; 2010). Gopinath and Rigobon (2008) on their part suggest that price rigidities cannot fully explain this phenomenon. This paper contributes to the above debate by focusing on the short-run effect of a change in the level of the exchange rate on exports. Namely, it highlights one source of indeterminacy or ambiguity on the impact of such a change in the level of the exchange rate on exports. It suggests that a change in the level of the exchange rate has two opposed effects. On the one hand it tends to reduce the value in national currency of the export sales and the profit margins of exporters. On the other hand however, it triggers pro-competitive effects through a variety of channels. These stem from the increased competition both on the domestic and foreign market. Hence, an important contribution of this paper is to show that the offsetting effects of exchange rate movements can be clearly detected by using improvements derived from theoretical refinements (the "new-new" trade theory) and new statistical information (firm-level data). To show this, we first outline a theoretical model accounting for the industry reallocations triggered by a change in the level of the exchange rate. We then provide an empirical assessment of the key testable hypotheses derived from the theory. The empirical analysis uses individual transaction level data, i.e. firm exports of a specific product to a specific market in a given year. Through the use of micro-data, we are able to quantify the effect of changes in the value of the exchange rate on each of the margins of trade (intensive, firm-extensive, market-extensive, and product-extensive). The methodology proposed in this paper also allows further separating the effect for firm that start their export activity from the effect on firm that cease exporting, as well as for entries into new markets from exits from old markets, and for venturing into the export of new products from the phasing out of old products. The possibility to estimate separately the effects of the value of a currency on each of the margins of trade allows to partly separate the pro-competitive effects of a currency revaluation from the negative effects. As we will show, the first are more likely to materialize through the extensive margin while the latter through the intensive margin. Separating the effects and the margins of trade is also particularly important from a policy perspective. It helps countries identify polices that help achieving the growth 3
model they intend to pursue. In other words, from the perspective of the policy maker, it matters to identify what role the exchange rate plays on each of the following distinct firm decisions or capabilities: the ability for incumbent exporters to sell more of the same products to the same markets (intensive margin), the decision of new firms to start exporting, and those determining market and product differentiation strategies. It also matters to learn if the effects are determined by changes in entry patterns or by developments in terms of survival and exit patterns. All in all, the detailed analysis at the margins of trade allows more informed policy responses to exchange rate developments. Besides allowing more targeted policy advice, there is an additional – methodological – advantage in testing the trade effects of exchange rate changes on firm level data. The use of micro-data allows overcoming a number of problems of endogeneity and reverse causality which are intrinsic to more aggregate indicators: the export decisions of individual firms are less likely to influence the exchange rate than aggregate or sectoral trade flows. A corollary of the argument put forward by this paper is that estimating exchange rate misalignments is equally difficult. It requires the same deep understanding of how the effective distribution of firms in the domestic economy leads to given aggregate results and it calls for the use of models of firm heterogeneity in evaluating the dynamic response of firms and the supply-side potential of the economy. The paper is organized as follows. Section 2 discusses firms’ trade responses to exchange rate shocks from a theoretical perspective. Section 3 presents a firm-level econometric investigation of the key hypotheses discussed in Section 2. It does so using firm level data from four middle-income countries: Chile, FRY Macedonia, Pakistan and Turkey. Section 4 discusses the policy implications of the findings of the paper and shortly discusses the difficulties in evaluating exchange rate misalignments. Finally, Section 5 concludes.
2 - Trade responses of firms to foreign exchange rate shocks Real exchange rate appreciations of the domestic currency are usually feared by a country’s export sector because they are viewed as a loss in the ability of the domestic industry to compete on international markets. With the growth model of many countries being export-led, governments are particularly sensitive to exchange rate developments. They assume that through the harmful effect on export volumes, real exchange rate appreciations of the domestic currency will also harm the overall profitability of domestic firms, as well as investment and employment. However, both the exposure of the domestic export sector and its response to exchange rate shocks are still debated. Starting with an economy’s exposure to trade and to currency shocks, the overall impact is determined by the composition of the firms populating the economy. Recent theoretical and empirical findings stress that firm heterogeneity is very significant even within narrowly defined industries (Melitz, 2003 and Bernard et al. 2007). Indeed, the extent to which a real exchange rate shock changes the overall competitive pressure faced by a firm is determined by its own firm-specific exposure. According to Campa and Goldberg (2001) the channels of exchange rate exposure are three: firms’ export sales; firms’ 4
purchases of imported inputs; and import competition faced in the domestic market. In other words, the effect on individual firms will notably depend on the share of the firm’s exports relative to overall sales, on the ratio between imported and domestic inputs and on the degree of competition faced on domestic and foreign markets: a real appreciation of the domestic currency will tend to squeeze profits for firms that sell a large share of their output on foreign markets and that are paid in (depreciated) foreign currency while facing production costs in (appreciated) national currency. By contrast, the profit margin may increase for firms whose production relies on imported inputs, as the latter will become cheaper after a revaluation of the domestic currency. Finally, import competition on the domestic market will become higher for firms operating in less protected sectors. Turning to how firms respond to a change in the value of the domestic currency, two opposed lines of argument are often heard. A first view is that revaluations of the real exchange rate, by inducing a loss of price competitiveness of domestic exporters in foreign markets, leads to a contraction of exports and market share losses. Another strand of arguments however suggests that exchange-rate induced changes in price or cost-competitiveness may have favorable allocative effects domestically, leading to structural increases in non-price competitiveness. The increasing challenges on both the export and domestic markets would favor a reallocation of resources towards the most dynamic domestic producers, i.e. those producers that are quicker to adapt with strategies of internal reorganization, introduction of best practice techniques, faster product cycles and better product quality (Marin, 1984 and Ekholm et al, 2012). The argument is similar to the one made for the effect of increases in import competition. 2 In what follows we will show that these two lines of argument are both well grounded and do in fact coexist in theoretical models of international trade.
2.1 - Changes in the level of the exchange rate and gains from trade: insights from trade theory Over time, developments in trade theory have been characterized by increasing attempts to include "real life" complexities in the basic trade models of Ricardo and of Heckscher and Ohlin. An important objective of such attempts is a realistic definition of what channels are likely to be most relevant for generating the gains from trade, given a changing economic landscape. In what follows, we briefly remind the reader that – following the changes in the dominant production model as well as ever more complex real and financial linkages between countries – the effect of exchange rate developments on trade has gained in complexity. This will allow us to show how the trade theories that were generated over the course of the years to describe such changes help understanding better the contradictory effects of exchange rate developments on trade nowadays. Table 1 offers a synthetic summary of the effects of a revaluation of the exchange rate, as envisaged by the various theories summarized in the paragraphs below. From the industrial revolution to WWI the pattern of international trade was mainly characterized by the exchange of manufactured goods from industrialized countries for imports of raw materials from less-developed countries. World trade was mostly "inter-sectoral", and was explained by international 2
The pro-competitive effects of increased import competition on industrial production, exports and overall GDP growth has been investigated empirically by Lawrence and Weinstein (1999) using evidence from Japan and Korea.
5
differences in relative factor endowments and technologies. Countries' specialization in production and in exports was in accordance with their relative costs of production (i.e. having a "comparative advantage" in relatively "cheap" sectors): the so-called "specialization effect" of trade liberalization. The theories of Ricardo and of Heckscher and Ohlin were developed to explain such patterns of international trade. Since WWII, however, a dominant share of international trade has been taking place within industries among countries having relatively similar endowments and technological development (Linder, 1961; Grubel and Lloyd, 1975). This led to the appearance of new trade theories, the principal characteristic of which is the attention to the details of market structure. Two distinct strands of literature - both relevant to understanding the nexus between exchange rates and trade - underline the different mechanisms at play. The first strand of literature asserts that horizontal product differentiation within sectors assigns market power to firms even in sectors characterized by a large number of competitors that are free to enter and exit the market (Krugman, 1980). In this setup of "monopolistic competition" with increasing returns to scale, the following results apply. First, firms operate at a given minimum scale if they want to break even. Second, within a sector, firms specialize in the production of distinct varieties of their differentiated goods. Third and last, intra-industry trade arises because consumers love variety, but countries can produce only a limited number of varieties, depending on their "size", i.e. their resource endowment. Hence, in this setting, the revaluation of the domestic currency has two distinct effects. On the one hand, it induces a profit squeeze for exporters, through a lower value of their sales in domestic currency. On the other hand, the revaluation of the domestic currency leads to a "variety effect" insofar as it induces more import competition and in so doing broadens the range of varieties available for domestic absorption (consumption but also intermediate goods for further processing). The greater availability of imported varieties on the domestic market allows domestic producers to produce more sophisticated and higher quality varieties themselves. A second strand of new trade theory is built on an "oligopolistic competition" set-up where a few large firms sell homogeneous products and, due to trade barriers, achieve larger market shares at home than abroad (Brander and Krugman, 1983). Whenever they are able to discriminate in terms of prices between domestic and foreign customers, they are willing to accept smaller profit margins abroad than at home, therefore selling additional units of their output abroad. This gives rise to bilateral trade within industries even between identical countries. As firms charge lower margins on foreign than on domestic sales, the resulting exchange is sometimes called "reciprocal dumping". In this set-up, a revaluation of the domestic currency further reduces the profit margin on the foreign market for domestic firms. As competition on the domestic market increases – foreign firms are able to charge lower prices for the homogeneous good – also the profit margin on the domestic market falls for domestic firms. The result is an average compression of the profit margin for domestic firms everywhere and an increase in their perceived elasticity of demand. The compression of profit margins has efficiency-enhancing consequences called the "pro-competitive effect". If production faces increasing returns to scale at the firm level, tougher competition for domestic firms due to the revaluation of the exchange rate has an additional efficiency-enhancing effect. The reason is that, to restore profitability, firms compensate for the decrease in prices resulting from the pro6
competitive effect by raising their output. Then, in the presence of increasing returns, rising output leads to a decline in the average cost of production. This efficiency gain is called the "scale effect". Recent analyses of micro-datasets tracking production and international involvement at the firm and at the plant levels demonstrate that firm heterogeneity along a number of dimensions plays an important role in aggregate outcomes. In this setting, tougher competition generated by a revaluation of the domestic currency and the presence of scale economies implies also that the most performing firms will expand and grow - both domestically and internationally - and least performing firms will exit the market altogether. In the ensuing selection process, the scale of surviving firms increases as this improves their profitability. As a result, technologies are used more efficiently - the so called "rationalisation effect". Average firm productivity also rises, as less productive firms exit - the so called "selection effect". Finally, frameworks modeling the ever more widespread practice to fragment production internationally, highlight that when the import content of domestic exports is high, a devaluation may lead to the paradoxical effect of harming the domestic industry. By increasing the price of imported components, denominated in foreign currency, a lower value of the domestic currency may lead to overall higher costs of production for the final product. Standard economic models that abstract from the sophistication of modern global production structures would therefore draw erroneous conclusions on the sign and significance of the trade effect (Evenett, 2010). Taken together, these models all show that while profit margins and the value of exports are directly harmed by a revaluation of the exchange rate, in a sort of mechanical way, the increase in competition leads to pro-competitive effects which materialize through a variety of channels. As we will discuss in Section 3.1, our empirical methodology is aimed at testing and comparing the importance of the two contrasting effects. Table 1: Revaluation of the domestic currency through the lenses of trade theory
7
REVALUATION OF THE DOMESTIC CURRENCY: Channels: Export sales (value in domestic currency) Models of Horizontal Product Differentiation Oligopolistic Competition or "Reciprocal Dumping" Models
↓unit value, ↓profit margins
Competition on the domestic market
Purchase of foreign inputs
↑ # varieties sold (substitutes vs. complements) Pro-competitive effect through reduction in profit margins
Models with Increasing Returns to Scale
↓unit value leads to ↑ volumes and ↓average cost of production
Pro-competitive effect through increase in volumes
Models of Firm Heterogeneity
↓unit value, ↓profit margins, ↑firm exits
Pro-competitive effect through reallocation of production from less to more competitive firms
Models of International Fragmentation of Production
Cheaper, in particular if denominated in foreign currency
2.2 – A Stylized theoretical framework for assessing firm-level export growth following a revaluation of the domestic currency Building on the stylised facts and theoretical insights described in Section 2.1, our model which builds on Melitz and Ottaviano (2008) and Ottaviano, Di Mauro and Taglioni (2009), provides an account of the determinants of trade and of the mechanisms of adjustment to a revaluation of the exchange rate as realistic as possible, as this comprises the existence of intra-industry trade, firms’ market power and heterogeneity, existence of scale economies and consumers’ love of variety. The main purpose of the model is to provide a solid theoretical underpinning for the evaluation of the multi-faceted effects of a change in the level of the exchange rate. The basic logic of the model is intuitive and it is summarized in Table 1. Consider a sector in which firms differ in terms of efficiency in the use of available inputs. A revaluation of the domestic currency (i.e. a devaluation of the foreign currency) leads foreign producers to target the domestic market more, therefore lowering the markups and the operating profits of domestic firms. At the same time, however, while all domestic firms face a squeeze in profit margins from exports, some of them retool their access to such foreign markets and generate additional profits from their foreign ventures: these are the firms that take advantage from the increase in the varieties of inputs available in the domestic market (Models of Horizontal Product Differentiation), that are efficient enough to cope with the increased costs of reaching foreign customers (Models of Reciprocal Dumping), that react by increasing the scale 8
of production (Models with Increasing Returns to Scale), that benefit from a more efficient allocation of resources domestically (Models of Firm Hereogeneity) or that see the costs of production decrease, due to cheaper imports (Models of Fragmentation of Production). In the process, a number of firms – the least productive and those unable to afford the profit margin squeeze – will be forced to exit. The selection process will eventually increase the average efficiency of surviving firms, and lead to lower average prices and mark-ups (Melitz and Ottaviano, 2008).
2.2.1 - Main features of the model Our model is to be seen in the tradition of the new trade theories briefly surveyed in Section 2.1. Most notably, it exhibits the following five main features. First, the market structure is one of monopolistic competition. Each firm in a sector produces only one variety of a differentiated good. Consumers have inelastic demand and love to have as many varieties to choose from as possible. Second, in order to enter in a sector and start producing, firms must pay ex-ante fixed entry costs, which include for example the research and development (R&D) costs needed to create and market a new variety. With respect to their nature these costs are therefore “sunk”, i.e. cannot be recovered, should firms exit the market later on. Bringing entry (and exit) to the forefront, our analysis focuses on the extensive margin effects of a change in the level of the exchange rate. Third, in addition to the entry costs, firms incur production costs and delivery costs, which include not only transportation fees – both within a country and for shipping abroad – but also all tariff and non-tariff costs needed to reach the final consumers. All these costs – which vary by sector and by destination country – can be summarized in a single indicator. As customary in the literature we will refer to this single indicator as the “freeness of trade”. Fourth, trade flows are driven by technology and demand, and there is no role for international cost differentials arising from different relative resource endowments, which are instead critical in the Heckscher-Ohlin trade theory mentioned in Section 2.1. In this sense our model is primarily aimed at discussing intraindustry trade dynamics. Fifth and last, in our model the size of the destination markets matters. The larger are the markets, the tougher the competition in terms of the increased elasticity of demand faced by firms and thus the lower are the markups. In this tougher competitive environment, firms have to achieve a larger scale of operations in order to break even, and this is possible only for the most efficient firms, i.e. those with the lowest marginal costs. Accordingly, the key indicator of industry performance in the model will be the “cut-off” marginal cost. This is the maximum marginal cost that can be profitably sustained by firms in the market. The inverse of the cut-off cost is the minimum productivity or efficiency of firms that are able to at least break even. Knowing how the cut-off varies following a revaluation of the domestic currency will be enough to evaluate all the ensuing changes in terms of productivity and exports. As Melitz and Ottaviano (2008) shows the cost- cut-off parameter is also sufficient to describe other key variables, including prices, markups, output and overall welfare. With our empirical application in mind, our economic model is designed to describe an economy consisting of several countries and several manufacturing sectors (more on this in the empirical section of the paper). Each manufacturing sector (henceforth indexed by the subscript “s”) supplies a differentiated good. This good is available in a certain range of varieties which are traded in
9
monopolistic competitive markets. 3 While in the real world firms can be multi-product, in the model we assume that each firm-variety combination behaves as an independent firm. Since we do not assess cross-product firm decisions in this paper, we believe that our simplifying assumption does not affect the outcome of the model. The rest of the economy is represented by a single residual homogeneous good, which serves as the numeraire (i.e. unit of value). The homogeneous good is freely traded in perfectly competitive markets and it is sold at the same price by all firms across the economy. The market for this good will also absorb all labour imbalances in the economy so that nominal wages – but not real ones – will be constant in the model.
2.2.2 - Industry equilibrium Our model is formally described in Appendix 1. It accommodates several countries and several sectors that differ from each other along several dimensions. While this is important for the empirical application, the intuitive logic of the model can be usefully grasped by concentrating on the simplest case of a single manufacturing sector, labeled “s”, that operates in two identical countries, labeled “h” (mnemonic for “here”) and “t” (mnemonic for “there”). In the following description we focus on country h (i.e. the country whose currency is revalued) with the understanding that everything applies in the reverse way to country t, i.e. the country whose currency depreciates. As already mentioned, to introduce a new variety of a good produced in sector s and country h, a firm incurs a (sector-and-country) specific R&D sunk cost, which we call fsh. Typically, due to the uncertain R&D outcome, the entrant does not know in advance what will be the marginal cost connected to the production of the new variety that he wants to launch on the market, i.e. it does not know how efficient it will be in producing its variety relative to the production of all other varieties in the market (and actually whether it will be able to produce it at all, given market conditions). To capture such uncertainty, we assume that the marginal cost of production c is determined randomly upon entry as a draw from a sector and country-specific probability distribution. The production cost distribution is portrayed in the middle panel of Figure 1 where, for any firm, possible cost draws range from a lower external bound equal to 0 (i.e. where c can approximate 0, but always remaining strictly positive) to a country and sector-specific upper bound equal to cA,sh. The panel shows a realistic situation (see Box 1 for details) in which high cost draws for firms (large c) are much more likely than low cost draws (low c). Two are the key parameters in this panel. The first is cA,sh, which identifies the maximum possible cost of producing a variety (i.e. the worst possible return from the investment in R&D) in sector s and country h. The inverse of cA,sh, which we call osh, is an index of “absolute advantage”: the higher it is, the more cost effective country h is in producing good s and the more likely it is for a firm willing to introduce a new variety in sector s of country h to succeed. The second key parameter is represented by the curvature, or “shape” ks, of the cost distribution curve. The parameter ks, is a direct measure of the bias of the distribution of sector s towards high cost outcomes (i.e. inefficient firms). Hence, the larger ks is, the more likely it is for a new variety in sector s to have 3
Monopolistic competition can be considered as a reasonable macroeconomic representation of the market structure in our manufacturing sectors as long as sectors are fairly aggregated and our model allows for the procompetitive effect of richer variety presented in Section 2.1.
10
high marginal costs of production. Given these parameters – technological in nature - country h has a “comparative advantage” in sector s with respect to country t and another sector S if (cA,sh/ cA,Sh)1 the factor measuring these additional costs of delivering goods from country h to country t (and vice versa), the equilibrium export cut-off level is simply cshh/dsht, implying that an exporter has to be dsht times more efficient than a domestic producer in order to make the same amount of sales in the same country.
2.2.3 - Effects of a currency revaluation on the key parameters of the model For a given domestic cut-off level, foreign firms (i.e. exporters to market h) expect higher profits if the currency of h increases in value relative to the currency of t. This is the case because sales take place in the currency of h but production costs are denominated in the currency of t. In this case the curve of expected profits in the bottom panel of Figure 1 would shift upwards for firms from t. A detailed gallery of the outcomes for the effect of a currency revaluation in country h is portrayed in Figure 2, where the effect on the domestic market is presented in the top panel, while the middle and the bottom panel present the effect on the foreign market, respectively when country h is small, i.e. does not affect the overall industry equilibria (middle panel) and in the case it is large enough to affect overall industry outcomes (bottm panel). For a given level of the domestic cut-off, a larger country size, weaker product differentiation, better technological opportunities and freer trade all imply higher expected profits. The effects of a revaluation of the domestic currency will lead to a number of industry reallocations. Starting with the industry reallocations on the domestic market, the effects are shown graphically by the upward shift of the Expected profits curve in panel (a) of Figure 2 and the corresponding shift to the left of the intersection point between the curves representing respectively Expected profits and Entry costs. As shown graphically, the new equilibrium domestic cut-off cshh will have a lower level. This outcome is due to the following sequence of events: the higher expected profits (for foreign firms) resulting from the higher profit margins granted by the revaluation of the domestic currency will induce the entry of new foreign firms, which increases competition in the domestic market of country h, thereby causing firms’ markups to shrink and making survival harder for the weakest among the incumbents. Tougher competition hits all firms, by squeezing their profit margins, but sinks only some of the least efficient ones, i.e. those firms that had marginal costs just below the cut-off before the shock, and that, as a result of the shock, see their sales disappear thereby failing to break even. As only relatively more efficient firms survive, the average efficiency of the industry rises, thereby leading to a lower level for the domestic cut-off cshh, as previously mentioned. This selection effect is accompanied by an increase in the average scale of firms as well as by a decrease in the average price and markup, revealing that scale and pro-competitive effects are also at work. For a given reduction of the domestic cut-off, the intensity of the selection effects depends on the number of firms that exit the market. What percentage of firms exits when the cut-off falls by a percentage point? Given the discussion in the previous section (see Box 1 for details), the answer is clearly ks per cent. Hence, we refer to ks as the “sensitivity to firm selection”, or more technically to the “elasticity of the extensive margin” of industry adjustment, which is high in sectors characterized by large fractions of high cost firms.
14
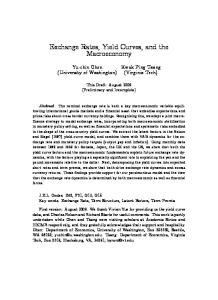
Figure 2: Industry reallocations following a revaluation of the domestic currency
Expected profits/Entry costs Expected profits Delivery cost
h
fs
ht
hh
ht
hh
cs =cs /ds
h
cs
Cut-off cost
cA,s
(a) Industry reallocations on the domestic market (country h)
Expected profits/Entry costs Expected profits Delivery cost
h
fs
th
tt
th
cs =cs /ds
tt
cs
t
cA,s
Cut-off cost
(b) Industry reallocation on the foreign market (country t)
Turning to the effect on the foreign market, we observe a squeeze in profit margins for firms from country h trying to sell to country t. This effect on profit margins materializes through higher delivery costs, that per our assumption also include the costs associated to the handling of production in the home currency and sales in the foreign currency. The effect is therefore a reduction of profit margins for exporters from country h. As a first-round effect, this will lead the least efficient exporters from h to cease exporting and the most efficient exporters to squeeze their profit margins from sales in country t. Also, according to models of industrial organization, the squeeze in profits is likely to induce the more dynamic domestic producers to strategies of internal reorganization, introduction of best practice techniques, faster product cycles and better product quality. Less dynamic exporters will be instead forced to exit the market. The effect of this is a reallocation of resources from less competitive to more competitive firms, which ultimately boosts growth. At the same time, the expected squeeze in profit margin, will induce a number of firms in pulling out of market t, leading to overall less competition of 15
this market. The benefit for firms from country t is exemplified by a shift to the right of the cost cutoff ctt. Summarizing the above mechanisms, the domestic cut-off cshh determines the average efficiency, the average scale, the average price and the average markup of firms selling the products of sector s to consumers in country h. Similarly, the foreign cut-off cstt determines the average efficiency, the average scale, the average price and the average markup of firms selling the products of sector s to consumers in country t. Hence, the key channels through which a change in the level of the exchange rate affects a country’s exports is the domestic cut-off in country h and country t. In turn, the domestic and foreign cut-offs are determined by six key parameters: -
the country-specific market size Lh and Lt ;
-
the sector-specific product differentiation Ds;
-
the sector-and-country specific absolute advantage osh and ost;
-
the sector-specific elasticity of the extensive margin ks;
-
the sector-and-country specific entry cost fsh and fst;
-
the delivery cost dsht and dsht, which are specific to the sector, the country of origin and the country of destination.
In particular, we have argued that larger domestic market size Lh and absolute advantage osh as well as a smaller degree of product differentiation Ds, of elasticity of the extensive margin ks, of entry costs level fsh and of delivery costs dsht translate in larger shifts of the equilibrium cut-off on both the domestic and foreign market following a change in the level of the exchange rate (see Box 4 for the formal expression of cshh as a function of the various parameters and Appendix 1 for its derivation).
2.2.4 – Linking the theoretical model to the intensive and extensive margins of trade: testable hypotheses The model above clarified that a change in the level of the exchange rate affects overall exports of a country through distinct channels. While some of the effects will be negatively signed, others are likely to be positively signed. The overall impact is therefore a priori indeterminate in terms of sign, significance and intensity. Empirically, we do not have priors on the effect of a change in the level of the exchange rate on firms’ export flows. This is our first testable hypothesis. Export sales - denominated in domestic currency – of mature products, of homogeneous goods or of products from sectors the degree of product differentiation is low are likely to be negatively affected by a revaluation of the domestic currency. As we expect little innovation and market power for such products, we also expect that their export will be mainly taking place through existing trade flows. Hence, our second testable hypothesis is that – if the overall effect of a currency revaluation on export flows is negative, most of this effect will stem from the intensive margin of trade. A corollary of this
16
reasoning is that countries whose export growth relies more strongly on the intensive margin of trade are likely to see a higher and more robust negative effect. This is the third hypothesis that we will test. Meanwhile, trade theory identifies several sources of pro-competitive effect of a revaluation of the exchange rate. These stem from increased competition on both domestic and foreign markets. We associate this effect primarily with the extensive margin of trade, and in particular with the entry of new firms into exporting, with their access to new markets and the introduction of new products. Hence our next set of testable hypotheses concerns the extensive margin. To start with, if a pro-competitive effect exists, new exporters, new product varieties and the entry into new markets are likely to be positively associated to a currency revaluation. These trade flows are also likely to be less elastic to price shocks due to their firm and product specific knowledge that grants market power, at least in the entry phase. Hence our fourth testable hypothesis is that the extensive margin is likely to mitigate or offset the negative effect of the currency shock on the intensive margin. The mitigating effect should primarily materialize through firm, market and product entries. The effect on exits is less clearly defined. On the one hand, the negative effect on export sales may induce the less performing firms to exit the market. On the other hand, as firms undergo increased competitive pressure on their incumbent products and markets, they will invest in strategies that boost their non-price competitiveness. As we have seen from the models – and reflecting consensual wisdom from the wide body of literature on firm heterogeneity -incumbent exporters represent the most competitive firms in the domestic economy. The selection/rationalization effect mentioned in the theoretical model implies that, as the least competitive firms exit the market, the overall contribution of exists to export growth may be less negatively or outright positively affected by a currency revaluation. Summing up, in our stylized representation of the world, one should expect the following testable hypotheses to hold: 1. The overall effect of a change in the level of the exchange rate is likely to differ from country to country. 2. For those countries where the effect is negative, we expect the intensive margin to drive the results. A currency revaluation leads to a negative effect on the intensive margin of exports: the market power of firms on mature products is low and competition takes place mainly on price grounds. Countries whose export growth relies more strongly on the intensive margin of trade are likely to see overall a higher and more robust negative effect. 3. The extensive margin should however mitigate or offset the negative effect of the currency shock on the intensive margin. As firms undergo increased competitive pressure on their incumbent products and markets, they will invest in strategies that boost their non-price competitiveness. The mitigating effect should primarily materialize through firm, market and product entries. 4. The effect on exists is a priori indeterminate. On the one hand a stronger competitive pressure on existing trade flows will lead some firms to exit specific products, markets or exporting activity altogether. On the other hand, as the pro-competitive effect also concerns incumbent exporters – by definition the most competitive – the selection effect may imply totally or partially offsetting
17
effects. In other words, the overall contribution of exists to export growth may be less negatively or outright positively affected by a currency revaluation. The cost of imported inputs and the other key parameters listed in section 2.2.3 are also likely to influence the exchange-rate and exports link. For example the intensity of the effects for firms with higher import content of production is likely to be lower both for the intensive and extensive margin. Similarly, assuming that higher quality goods benefit of greater product differentiation and market power we would also expect that a higher quality of exports affects positively the response of the extensive margin to exchange rate shocks. We leave the assessment of these parameters and channels for future research.
3 - Assessing the impact of a change in the level of the exchange rate on firm exports 3.1 - Estimation strategy In order to investigate the effect of a change in the level of the exchange rate on firm exports we rely on firm level data and focus on the allocative effects through the full decomposition of export growth along the intensive and extensive margins of trade. The basic unit of observation is the export value of a given firm to a given product in a HS-8 digit product. Accordingly, we define export growth along each of the margins as follows. Export growth at the intensive margin is measured by referring to all flows (firmmarket-product specific) that already existed in the previous year. The firm extensive margin captures export growth generated by the churning of firms. It detects export gains by newly established exporters and export losses due to exiting exporters. The market extensive margin identifies all export changes by incumbent exporters to new destinations and exits from old destinations. Finally the product extensive margin is associated with exports due to product portfolio changes. For each incumbent exporter in each existing destination it detects export growth due to the introduction of new products and to the phasing out of old products. As a further step in decomposing the margins of export growth, we also distinguish between entries and exits for each of the margins. We use the above decomposition as the basis for a firm-level econometric investigation of the determinants of export growth, focusing on the impact of a change in the level of the exchange on each of the margins of exports. Specifically, we identify via regression analysis the impact of a change in the level of the exchange rate on export growth overall and then distinguishing for impacts at the intensive margin and at each of the extensive margins, i.e. firm, market and product extensive margin. Finally we also estimate separate impacts for new firms starting export activity and firms exiting exports, for incumbent exporters entering new destinations and for those exiting old destinations, and for incumbent exporters increasing their product range as separated from those phasing out some products. We test the effect of the exchange rate via interaction terms.
3.2 - Data The data used in this analysis consists of separate sets of firm level data obtained from governmental sources in Chile, FYR Macedonia, Pakistan and Turkey and a dataset of bilateral tariff data at the HS-6 18
digit level from the International Trade Centre.4 The first firm level dataset – available for all four countries - contains customs export data for goods transactions in the period 2001-2010, where exports are expressed at the raw-transaction level. The data reports all legal export transactions at the HS-8 digit product level. For each export transaction it reports a unique firm identifier (VAT number), the date of the transaction, its value in US dollars and national currency, the destination market, the quantity exported, and the customs checkpoint. Aggregating the raw transaction data, we obtain our basic unit of analysis: firm annual value of exports, by HS-8 digit product and by destination. The second dataset – available for Turkey only - provides a wide range of other information on individual firms and for the years 2006-2008. We will therefore design a baseline specification that can be tested on data from all four countries and a more detailed specification for Turkey, exploiting the richer set of available data.
3.3 - The margins of trade We decompose trade flows along a variety of trade margins. We compute separately annual export growth from the firm-specific custom data for each of the margins of trade. Within each margin we further decompose the contribution of entries separated from exits. Export growth is computed using the so called “mid-point growth rate” (Davis and Haltiwanger, 1992 as applied to firm-level exports by Bricongne et al. 2011). A main advantage of this methodology is that it allows estimating growth rates associated with newly created or destroyed flows. Other methodologies which use normal growth rates are unable to do so and for this reason they rely on probabilistic methodologies to quantify the impact of determinants of exports at the extensive margin. Mid-point growth rates are computed as follows. For a firm i exporting a value x to a country c of product k at year t, the mid-point growth rate is defined as: 𝑔𝑖𝑐𝑘𝑡 =
𝑥𝑖𝑐𝑘𝑡 − 𝑥𝑖𝑐𝑘(𝑡−1)
1 + 𝑥𝑖𝑐𝑘(𝑡−1) � 2 �𝑥𝑖𝑐𝑘𝑡
This growth rate measure is symmetric around zero, and it lies in the closed interval [-2,2] with exits (entries) corresponding to the left (right) endpoint. Similarly, the weight attributed to each flow gickt is given by the relative share of the flow in total exports, where total refers to the exports of the whole population of a country’s firms: 𝑠𝑖𝑐𝑘𝑡 =
𝑥𝑖𝑐𝑘𝑡 + 𝑥𝑖𝑐𝑘(𝑡−1)
�∑𝑐 ∑𝑖 ∑𝑘 𝑥𝑖𝑐𝑘𝑡 + 𝑥 ∑𝑐 ∑𝑖 ∑𝑘 𝑥𝑖𝑐𝑘(𝑡−1) �
Finally, the year-on-year growth rate of the total export value is given by summing each individual flow gickt weighted by sickt: 𝐺𝑡 = � � � 𝑠𝑖𝑐𝑘𝑡 ∗ 𝑔𝑖𝑐𝑘𝑡 𝑐
4
𝑖
𝑘
Market Access Map, Market Analysis Tools, International Trade Centre, www.intracen.org/marketanalysis.
19
The G measure is monotonically related to the conventional growth rate measure (grt), and it represents a good approximation of the latter for small growth rates. Both growth measures are linked by the following identity: 𝐺𝑡 ≈
2𝑔𝑟𝑡 (2 − 𝑔𝑟𝑡 )
At the aggregate level the index approximates well standard measures of growth rate.
3.4 – Baseline empirical model and identification of the overall impact of a change in the level of the exchange rate The aim of this section is to identify the impact of a change in the level of the exchange rate on the ability of firms to increase their exports at the intensive margin and at the extensive margin. We use the effects on the extensive margin to investigate diversification. The extensive margin is defined as a new flow, where we distinguish between new firms starting export activity, an incumbent exporter entering new destinations or an incumbent exporter exporting new products in destinations where it is already present. Our baseline equation estimates export growth over data for four countries: Chile, FRY Macedonia, Pakistan and Turkey, by means of ordinary least squares (OLS). The baseline equation specification is designed to be tested when customs data only are available. As mentioned in section 3.2 a more complete specification will be carried out for Turkey, where a richer set of data is available. The baseline specification takes the following form:
𝑔𝑖𝑐𝑘𝑡 = 𝛼 + 𝛽 ∗ 𝑑𝑙𝑛(𝑅𝐸𝑅)𝑐𝑘6 𝑡 + 𝛾 ∗ dln(𝑛𝑒𝑡𝑖𝑚𝑝𝑜𝑟𝑡)𝑐𝑘6 𝑡 + 𝛿 ∗ 𝑡𝑎𝑟𝑖𝑓𝑓𝑐𝑘6 𝑡 + 𝑑𝑙𝑛(𝑐𝑢𝑠𝑡𝑜𝑚𝑠_𝑡𝑖𝑚𝑒𝑐𝑡 ) 𝜂 ∗ 𝑠𝑑(𝑡𝑎𝑟𝑖𝑓𝑓)𝑐𝑘4 𝑡 + 𝜙 ∗ 𝑃𝑇𝐴𝑐𝑡 + 𝜃 ∗ + 𝑓𝑒 + 𝜀𝑖𝑐𝑘𝑡 ln (𝑑𝑖𝑠𝑡𝑎𝑛𝑐𝑒𝑐 )
Our dependent variable, the mid-point growth rate of firm i exports is defined in Section 3.3. It has three dimensions: time t, HS8 product k, and destination c. It is computed on flows in value. We observe the export performance of all firms that exported at least once over the period of reference. This is possible because the mid-point growth rate allows computing rates also for entries and exits. We explain the change in exports with the following variables: First we include a measure that tracks the change in the level of the bilateral real exchange rate, i.e. the log-difference measure dln(RER). Second, we include a variable that accounts for developments in foreign demand. The term dln(netimport) is the log difference in overall demand in each destination market for imports in the product. We compute this demand as product-specific net imports, where the exports from the exporter country object of the assessment have been subtracted from the total imports of each destination country. This procedure allows avoiding endogeneity problems. Third, we also document trade costs. We have three separate measures. The first and second measures are based
20
on bilateral, product-specific tariffs. 5 The third measure is aimed at measuring fixed entry costs. The tariff in levels is included, as this directly affects the marginal cost that a firm has to face to export in a given destination. We use the tariff level as a proxy for variable costs, proportional to the volume of exports. Moreover, we compute two measures for fixed costs. First we use the standard deviation at the HS-4 digit sector level of individual HS-6 digit tariffs. The idea is to capture the effect of the complexity of the tariff system on exports. We assume that the complexity of the tariff system in the destination country is a source of important information costs for a firm willing to enter the market. Second, proxying fixed costs to entry, we track the change in total number of days it takes to fulfill the customs procedures in Macedonia and in the destination country. In order to take into account non-linearities in trade costs, we deflate this measure by distance between the exporter and the destination country. The underlying idea is that changes in trade costs in further away countries should have less of an impact on the export decisions of exporting firms than corresponding changes in neighboring countries. We assume that a reduction in the number of days needed for clearing merchandise at the customs is correlated with a more general effort of a country to simplify import procedures and thereby reduce the fixed costs of entry to the market. We use data from the World Bank Doing Business database. We also account for Preferential Trade Agreements (PTA) between the exporter and the importer, as documented by the WTO database associated to the 2011 World Trade Report on Regionalism (WTO, 2011c). Finally we add time-varying HS2 fixed effects to the specification. These act as sectoral deflators, controlling for any time-varying sectoral determinants, including any sector specific shocks and changing composition effects or sectoral differences in the degree of integration in global value chains. We find that – across countries – export growth is positively correlated with foreign demand. The effect of a revaluation of the domestic currency differs from country to country (Table 2). The effect is negative and significant for FYR Macedonia, Pakistan and Turkey, but it is not significant for Chile. Turning to the other control variables we find the following results. The tariff level has no significant impact on export growth, except in Pakistan. We also include a measure of trade policy complexity, namely the standard deviation of tariffs within a sector. The complexity of the tariff regime has clear impacts on the information costs a firm has to face. It turns out that also tariff policy complexity only matters for Pakistan. PTAs also do not have any significant impact on firm-level trade flows overall. Digging further in the reasons of this non-significance can be the object of a separate investigation. Finally, we also measure the effect on export growth of the fixed costs to export, that we approximate with the change in total number of days for handling customs procedures (summing costs at the importer and exporter side). While this is only a partial measure of fixed costs to export, we assume that it is representative of more general issues. We assume that a reduction in the number of days for customs handling is likely to be correlated with a more general public effort to reduce a range of costs affecting firms. We find that this measure has a significant and strongly negative effect on export growth for Turkish firms, it does not affect exports by Chilean and Pakistani firms and it has a positive and significant effect for firms from Macedonia. Again, the sources of the different impacts should be the
5
Source for the tariff data: Market Access Map, Market Analysis Tools, International Trade Centre, www.intracen.org/marketanalysis.
21
Overall, this first set of results confirms our first hypothesis from the theory. The overall effect of a change in the level of the exchange rate is likely to differ from country to country. Table 2: Baseline regression: determinants of firm level export growth (national currency)
VARIABLES dln(RER) dln(net imports) ld(tariff) - mfn ld sd(tariff) - mfn3 PTA ldtime_xm2 Constant
CHL MKD PAK gr_pesos gr_dinars gr_rupees -0.131 (0.213) 0.053*** (0.015) -0.066 (0.066) -0.024 (0.031) -0.012 (0.017) 0.085 (1.199) -0.119 (.)
-1.000*** (0.326) 0.076** (0.031) 0.007 (0.111) -0.013 (0.028) -0.038 (0.044) 1.306*** (0.393) 0.199 (570.852)
Observations 128792 98356 R-squared 0.008 0.011 Robust standard errors in parentheses *** p1 is the factor measuring the cost increase per unit sold that is linked to international
(
ht s
)
(
)
deliveries. Hence, the marginal exporter from country h to country t is necessarily
d sht times more
c ht = c tt / d ht
s s . Quantities (4) and efficient than the marginal local producer in country in country t, i.e. s (5) are both decreasing in c, meaning that less efficient firms are able to sell lower quantities and
h t therefore achieve a smaller market share. The case of two identical countries (such that L = L ,
d sht = d sth and c shh = c stt ) is represented in the top panel of Figure 1 in the main text. If entrants draw their marginal costs from a Pareto distribution with cumulative density function
(
G sh (c) = c / c Ah , s
)
( )
ks
g sh (c) = k s c k s −1 / c Ah , s
ks
and probability density function (the latter is portrayed in the middle panel of Figure 1; see Box 1 for details), all average performance measures of the industry in country h are directly determined by the domestic cut-off. In particular, the average marginal cost, the average price and the average markup are respectively:
k c = s c shh ks + 1 ,
2k s + 1 hh cs ps = 2(k s + 1) ,
h s
(6)
h
c shh m = 2(k s + 1) . h s
and
The average quantity, the average revenue and the average profit are:
Lh c shh qs = 2 Ds k s + 1 , h
(7)
( )
2
Lh c shh r = 2 Ds k s + 2 , h s
and
( )
2
c shh Lh P = 2 Ds (k s + 1)(k s + 2 ) . h s
The (indirect) utility associated with demand (1), as achieved by a local resident, is:
Uh = Ih + (8)
1 As − c shh 2 Bs
(
) A
s
−
k s + 1 hh c s ks + 2
which shows that any decrease in the domestic cut-off
f
c shh generates higher welfare. h
At the entry stage firms incur the sunk entry cost s in country h until this is exactly matched by expected profits. Since all firms are identical before drawing their marginal costs, they share the same expected profits. For each possible country of destination t, these consist of two ingredients: the profit of the average seller in the market
34
tt
(9)
( )
2
Ps =
c stt Lt 2 Ds (k s + 1)(k s + 2 ) ,
and the probability of being efficient enough to sell in that market:
c sht prob = h c s, A
ks
ks
c stt ht = h Ts c s, A
ht s
(10)
where the second equality is granted by
( )
T ht = d ht
c sht = c stt / d sht and by the definition of the bilateral trade
− ks
s freeness index s . Summing up across all 13 countries of destination, expected profits match the sunk entry cost as long as
12
(11)
tt s
∑ prob ⋅ P = t =1
ht s
(c )
∑ [T (c ) 2 D (k + 1)(k + 2 ) − ks h s, A
s
s
12
t =1
s
tt k s + 2 s
ht s
]
Lt = f sh
,
which is portrayed in the bottom panel of Figure 1 in the case of two identical countries. Since a free entry condition like (11) holds for each of our n countries, we have a system of n equations in n unknown domestic cut-off costs. Its solution gives an equilibrium domestic cut-off cost for each country:
c (12) where
hh s
[
13 C sth / f st o st ∑ 2 D (k + 1)(k + 2) t =1 = s s h s Ts L
o st = 1 / c tA, s
( )
ks
is the index of absolute advantage,
matrix, whose element
]
1
ks +2 ,
Ts
is the determinant of the trade freeness
th Tsht indexes the freeness of trade from country h to country t, and Cs is the
T th
co-factor of its s element. In the case of two identical countries the cut-off cost corresponds to the intersection between the entry cost and the expected profit curves in Figure 1. Finally, the model also yields a “gravity equation” for aggregate bilateral trade flows. A firm operating in sector s with cost c and exporting from country h to country t generates export sales
rsht (c) = p sht (c)q sht (c) where the quantity exported qsht (c) is given by (5) with the associated price:
(13)
p sht (c) =
1 tt c s + d sht c 2s .
(
)
35
Aggregating these export sales
rsht (c) over all exporters from country h to country t (with cost c below
c sht = c stt / d sht ) yields the aggregate bilateral exports from country h to country t:
(14)
EXPsht =
1 N Eh o sh 2 Ds (k s + 2)
( ) L (c ) (d ) ks
t
tt k s + 2 s
ht − k s s
h
where N E is the number of entrants in sector s and country h. This is a “gravity equation” insofar as it determines bilateral exports as a log-linear function of bilateral trade barriers and country characteristics. As in Helpman, Melitz, and Rubinstein (2008), (14) reflects the joint effects of country size, technology (absolute advantage), and distance on both the extensive (number of traded goods) and intensive (amount traded per good) margins of trade flows. Similarly, (14) highlights how, holding the importing country size Lt fixed, tougher competition in that country, reflected by a lower exports by making it harder for potential exporters to break into that market.
36
cstt , dampens