PAK. J. FOOD SCI., 23(1), 2013: 1- 9 ISSN: 2226-5899
Evaluation of some thin layer drying models and effective moisture diffusivity of yam (Dioscorea rotundata) slices B. K. Koua1*, P. M. E. Koffi2, F. W. Fassinou1, H. Y. Andoh2, P. Gbaha2 and S. Touré1 1
Laboratoire d’Energie Solaire, UFR-SSMT- Université Félix Houphouet- Boigny de Cocody- Abidjan, 22 BP 582 Abidjan 22, (COTE D’IVOIRE) 2
Laboratoire d’Energie Nouvelle et Renouvelable, Département de Mécanique et Energétique- Institut National Polytechnique Félix Houphouet- Boigny de Yamoussoukro, B.P. 1526 Yamoussoukro *
Corresponding author:
[email protected]
ABSTRACT In this study, thin layer drying characteristics of yam were investigated experimentally in a convective dryer. The drying experiments were conducted at drying air temperatures of 35, 40 and 45 °C and at an airflow rate of 0.60 m/s. Seven thin layer drying models available in the literature were fitted to the experimental data. The fit quality of the proposed models was evaluated by using the determination of coefficient (r2), reduced chi-square (χ2), root mean square error (RMSE) and sum of residuals. The modified Page, Page and Weibull models showed a better fit to experimental drying data as compared to other models. The effective moisture diffusivity of the yam is found to increase with the drying air temperatures and ranged between 10.08x10⁻¹⁰ and 11.21x10⁻¹⁰ m2/s. Using the effective diffusivity and an Arrhenius type relationship, it is found that yam activation energy is 28.76 kJ/mol. Keywords: Yam; thin layer drying; Effective moisture diffusivity; Activation energy.
INTRODUCTION Yam belongs to the genus Dioscorea (family Dioscoreaceae). It is an important source of carbohydrate for lot of people in the world. Therefore, it can be found in Africa, the West Indies and parts of Asia, south and Central America and Oceania. Yams are cultivated through the tropics and in parts of the sub-tropics and temperate zones. In West Africa and New Guinea yam is a primary agricultural commodity. Yam is also used as health foods and herbal medicinal ingredients in Asia countries including Korea, China and Japan (Kim et al., 2005). It must be noticed that yam contributes more than 200 dietary calories per capita daily for more than 150 million people in West Africa and serves as an important source of income to the farmers (Badaleye, 2003). Moreover, it should be noted that yam plays an important role in Central and West Africa such as food security, social and cultural role. Although yam is sought as a staple food or health food, yam tubers have high water content (approximately 70% wet basis) at harvest and therefore cannot be preserved for a long time under ambient conditions (Gikuru & Olwal, 2005). This is a disability for its storage and its international marketing. Therefore many research works are done in the world to find the mean of its preservation and to reduce the post harvest loss which is in the range of 25 to 60% according to Girardin (1996).Yam post harvest loss in Côte d’Ivoire is 40% which is consistent with the previous values given. This high post harvest loss percentage constitutes a big loss for farmers which are confronted with the problem of preserving their harvested crops to prevent spoilage during storage. Drying is probably the
oldest and the most important method of food preservation practiced by humans. This process improves the food stability, since it reduces considerably the water and microbiological activity of the material and minimizes physical and chemical changes during its storage. Drying is a complex thermal process involving simultaneous heat and mass transfer (Yilbas et al., 2003). The materials are dried by thin layer drying due to faster drying with minimum loss of nutrients. In order to improve drying behaviour of yam slices, it is important to develop a better understanding of the controlling parameters of this complex process. Mathematical models are used for enabling simulation of the drying process under different conditions. Many mathematical models have proposed to describe the drying process, of them, thin layer drying models have been widely in use. These models can be categorized as theoretical, semi-theoretical and empirical (McMinn, 2006). Many studies have emphasized drying kinetics and thin layer drying models for fruits and vegetables – cassava, ginger and okra (Ahouannou et al., 2000), banana and mango (Talla et al., 2001; Koua et al., 2009), apricot (Doymaz, 2004), banana (Jannot et al., 2004), peach (Kingsly et al., 2007), mulberry (Akpinar, 2008) apple (Goyal et al., 2008), carrot (Kaya et al., 2009), leaves of inga edulis (Silva et al., 2011), pumpkin and green pepper (Guiné and Barroca, 2012). Some works have been published concerning processing attributes of yam. Montes et al. (2008) observed the effect of drying air temperature on the drying time and calculated the effective diffusivity and activation energy for drying of yam. Fioreze and Morini (2000) studied the drying characteristics of yam and simulated the drying as a function of the drying air
1 Pakistan Journal of Food Sciences (2013), Volume 23, Issue 1, Page(s): 1-9
PAK. J. FOOD SCI., 23(1), 2013: 1- 9 ISSN: 2226-5899
conditions and of the initial and final water content of yam. Falade et al. (2007) determined the effect of pretreatment and of drying air temperature on the drying of yam. However, study on thin layer drying models of yam has not been reported yet. In this study, the thin layer drying behaviour of yam in a convective dryer is investigated and a mathematical modelling by using the thin layer drying models is performed. Additionally, the effective diffusivity and the activation energy of yam slices are computed. MATERIAL AND METHODS Material Fresh yam was procured from local market in Abidjan, Côte d’Ivoire. After thorough cleaning and washing, the yams were peeled and sliced into 20 x 10 x 25 mm (width x thickness x length) using a mechanical slicer. The initial water content was determined by drying in an oven at 103 °C a sample of yam until constant weight and amounted to 2.29 kg water/kg dry basis. The analysis was carried out in triplicate. Experimental apparatus The drying apparatus was a convective dryer. It consists of an electrical fan providing the desired air velocity, a heating unit and a drying chamber. The heating control unit has an electrical heater (3 kW) placed inside an air-duct. The drying chamber was made of wood covered with metallic sheets. The air passed from heating unit and heated to the desired temperature and then channelled to the drying chamber. The samples were uniformly arranged in a thin layer on a steel perforated tray. The drying air temperature in the drying chamber was measured directly using 0.001 m diameter chromel/alumel thermocouples with measurement precision of ± 1 °C. The required air flow rate for drying was kept at the desired level at about 3 cm just above the tray surface using a hot wire anemometer with discrete probe. Weight loss of samples was recorded by using a digital display electronic balance (type Metter PL 1200) with a sensitivity of 0.01 g. Experimental procedure Drying experiments were performed at drying temperatures varying from 35 to 45 °C, with 5 °C increment, and a constant air velocity of 0.60 ± 0.01 m/s for all circumstances. The weight of tray with the samples was measured with a digital balance and recorded at 15 min interval for all temperature range selected for the study. For measuring the weight of the samples during the experimentation, the tray with samples was taken out of the drying chamber, weighed on the digital top pan balance and placed back on the drying chamber. The digital balance was very close to the drying unit. The drying procedure was preceded until no appreciable variation of the weight of the samples was recorded. All drying experiments were
conducted in triplicate and the average of the water content at each value was used for the drawing of the drying curves. The weight of the sample was converted to water content (X) on dry basis using the standard formula. Where W is the weight of sample and Wd is the weight of dry material in the sample.
W Wd Wd Theoretical formulations X
(1)
Mathematical modelling of drying curves The data for the water content obtained for the drying temperatures 35, 40 and 45 °C were converted into moisture ratio, Xr. The dimensionless moisture ratio of the sample was defined according to Eq. (2) where X0 represents the product initial water content and Xeq is the equilibrium product water content given by the sorption isotherms and depending on drying air conditions. X X eq (2) Xr X 0 X eq However, the reduced water content was simplified according to Akgun and Doymaz (2005) and Thakor et al. (2005), since the Xeq values are relatively smaller when compared to X and X0, for long drying times and one can write: X (3) Xr X0 In this study, the drying rate (DR) of yam slices was calculated by the application of the following formulas (Jannot et al., 2004): At initial time t0, the drying rate, DR0, is calculated as: X X1 dX (4) DR 0 ( )0 0 dt t1 t 0 At each time ti, i varying from 1 to f – 1, the drying rate is calculated as: Xi Xi Xi 1 dX 1 X DR i ( )i ( i 1 ) (5) dt 2 ti ti 1 ti 1 ti At the final time tf, the drying rate, DRf, is calculated as: X Xf dX (6) DR f ( )f f 1 dt tf tf 1 The experimental data of moisture ratio versus drying time were fitted to the most important semi-theoretical models, which are widely used in the scientific literature to describe the kinetics of the drying process. In this study, the experimental drying data of yam slices at different temperatures were fitted into seven (7) commonly used thin layer drying models, listed in Table (1). Table 1: Mathematical models of the experimental drying
2 Pakistan Journal of Food Sciences (2013), Volume 23, Issue 1, Page(s): 1-9
PAK. J. FOOD SCI., 23(1), 2013: 1- 9 ISSN: 2226-5899
Non-linear regression analyses are done by using the Statistical routine. The coefficient of determination (r2), reduced chi-square (χ2), root mean square error (RMSE) and sum of residuals were calculated for each model in order to test their accuracy in reproducing the Model
Model
number
name
1
Henderson
Equation
References
Xr = a exp(- kt)
Henderson
and Pabis
and Pabis (1961)
2
Lewis
Xr = exp(- kt)
Bruce
3
Midilli et
Xr = a exp(- ktn) + bt
Midilli et
(1985)
al. 4
Modified
al. (2002) n
Xr = exp(- (kt) )
Page
Overhults et al. (1973)
5
Page
n
Xr = exp(- kt )
Page (1949)
6
Two term
7
Weibull
Xr = a exp(- kt) + b
Henderson
exp(- k0t)
(1974)
t X r exp( ( ) )
Corzo et al. (2008)
The effective moisture diffusivity is an important transport property in food and other materials drying processes modelling, being a function of temperature and water content in material (Liu et al., 2009; Doymaz, 2012). Fick’s second law of diffusion equation, symbolized as a mass diffusion equation for drying agricultural products in a falling rate period, is shown in the following equation: X r (10) D eff 2 X r t where Deff is the effective moisture diffusivity (m2/s) and t is the drying time (s). An analytical solution of the second law diffusion (Eq. (10)), developed by Crank (1975) under the assumption of a one dimensional moisture movement with no volume change, constant diffusivity, uniform initial water content distribution and negligible external resistance was assumed. Where L is the thickness of the product sample (m) Xr
2 D eff (11) 8 1 exp ( 2n 1) 2 t 2 2 2 n 0 ( 2n 1) L
For long drying times, Xr < 0.6, Eq. (11) can be further simplified to retain only the first term of the series allowing rewriting Eq. (11) in a logarithmic form as follows (Ramesh et al., 2001; Schössler et al., 2012). 2 D eff 8 (12) ln(X r ) ln( ) t 2 2 L
1 1 N 2 RMSE ( X rth , i X r exp, i ) 2 (9) N i 1 where Xrexp,i is the ith experimental moisture ratio, Xrth,i is the ith predicted moisture ratio, N and n are the number of observations and constants, respectively. The best model obtained in this stage was used to predict the duration of drying time necessary to achieve the required equilibrium water content.
Based on this equation, the moisture diffusivity Deff can be determined applying the method of slopes (Mazutti et al., 2010; Schössler et al., 2012). Diffusivities were typically determined by plotting experimental drying data in terms of ln(Xr) versus drying time in Eq. (12), providing a straight line with the slope given by: 2 D eff (13) Slope 2 L The dependence of the effective moisture diffusivity on temperature may be described by an Arrhenius-type relationship as follows (Doymaz, 2004; Rafiee et al., 2010; Xiao et al., 2010): E (14) D eff D 0 exp( a ) RT where Ea is the activation energy (kJ/mol), D0 is the Arrhenius pre-exponential factor of Arrhenius equation (m2/s), R is the universal gas constant (R = 8.314J/molK) and T is the absolute drying air temperature (K). From the slope of the straight line of ln(Deff) versus reciprocal of T, described by the Arrhenius equation, the activation energy, Ea, could be calculated.
Effective moisture diffusivity
RESULTS AND DISCUSSION
experimental data. The higher values of the coefficient of determination (r2) and the lower values of the reduced chi-square (χ2), RMSE and sum of residuals were chosen for goodness of fit (Midilli and Kucuk, 2003; Celma et al., 2012). These parameters can be calculated as: N 2 (X rth , i X r exp, i ) i 1 (7) 2 Nn N Re siduals ( X r exp, i X rth , i ) i 1
(8)
Drying characteristics
3 Pakistan Journal of Food Sciences (2013), Volume 23, Issue 1, Page(s): 1-9
PAK. J. FOOD SCI., 23(1), 2013: 1- 9 ISSN: 2226-5899
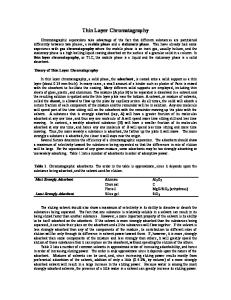
The yam slices were dried at 35, 40 and 45 °C and at an airflow rate of 0.60 m/s in a forced convective dryer in thin layer with thickness of 10 mm. The initial water content of yam was found to be around 2.29 kg water/kg dry basis and the final water content was 0.12 kg water/kg dry basis. The characteristics of drying curves for yam slices are shown in Figs. 1 and 2. It is clear that the water content and moisture ratio of yam decrease continuously with drying time. Decrease in water content and moisture ratio indicates that diffusion has governed the internal mass transfer. Drying curves exhibited behaviour typical for drying food (Zielinska and Markowski, 2007 and 2010) and indicated an initial high rate of water removal. The total drying time required to reach the final water content of yam slices were 555, 465 and 390 min at the drying air temperatures of 35, 40 and 45 °C, respectively. The decrease in drying time with an increase in the drying air temperature has been reported for many agricultural products (Rafiee et al., 2010; Falade and Solademi, 2010, Zielinska and Markowski, 2010; Doymaz, 2012). The Figure (3,4) showed the drying rate (DR) versus drying time and the variations of drying rate with water content of the yam slices at drying air temperatures of 35, 40 and 45 °C and at an airflow rate of 0.60 m/s. It was also observed that the drying rates were higher at elevated drying air temperatures. As seen in Figs. 3 and 4, two falling rate periods for convective drying of yam slices were observed in all the drying processes. Separation of first and second falling rate periods was taken to be at about the moisture ratio of 0.28. Two falling rate periods are typically observed for drying of hygroscopic products (Schössler et al., 2012). Theoretically, the drying process starts with a period of constant drying rate, where the drying rate is controlled by external conditions when moisture transfer to the product surface is sufficient to keep it constantly wet. This period is rarely observed in food drying studies and several authors reported that no constant rate period occurred during drying of different agricultural products (Krokida et al., 2003; Togrul, 2006; Mazutti et al., 2010; Schössler et al., 2012). It can be seen that at higher water content, the increase in temperature has more considerable effect on the drying rates than at lower water content, which was almost negligible at the end. It was further observed that water loss was faster at the start of drying than at the end. The reduction in the drying is mainly due to reduction in water content as drying advances. The rate of migration of water from inner surface to outer surface decreases at the final stage of drying and hence lower drying rates (Rajkumar et al., 2007; Kumar et al., 2012). Mathematical modelling of the drying curves
The water content data obtained at different drying air temperatures were converted to dimensionless moisture ratio (Eq. (1)) and then fitted to seven thin layer drying models (Table 1). Nonlinear regression analysis was used to estimate the parameters of those seven models. The statistical results from models are summarized in Table 2. The best model describing the thin layer drying characteristics of yam slices was chosen as the one with the highest r2 values and the lowest χ2, RMSE and sum of residual values. For all models, r2 values were > 0.98, χ2 < 0.00299, RMSE < 0.05172 and sum of residuals < 0.77404. Of all the models tested, the modified Page, Page and Weibull models give the highest values of r2 and the lowest values of χ2, RSME and sum of residuals. Accordingly, the modified Page, Page and Weibull models were selected as the suitable models to represent the thin layer drying characteristics of yam slices. Figures (5-7) compare experimental data with those predicted with the modified Page, Page and Weibull models for yam slices at 35, 40 and 45 °C. As shown in Figs. 5 - 7, the prediction using the models showed Xr values banded along a straight line, which showed the suitability of these models in describing the drying characteristics of yam slices. To take into account the effect of drying temperature on the model parameters and attempting to generalise the model, a regression analysis was applied to set up the relationship between these parameters and the drying temperature for the yam slices at the airflow rate of 0.60 m/s. The regression equations of these parameters against drying temperature for each experimental condition are presented in Table 3. Determination of effective moisture diffusivity The values of effective moisture diffusivity (Deff) of yam slices for the two falling rate periods were calculated using Eq. (13) and are presented in Table 4. The values of Deff in the first falling rate period ranged from 8.28x10⁻¹⁰ to 11.83x10⁻¹⁰ m2/s, whereas for the second period the variation was from 9.30x10⁻¹⁰ to 13.18x10⁻¹⁰ m2/s. The values of Deff in overall falling rate period ranged from 8.70x10⁻¹⁰ to 12.51x10⁻¹⁰ m2/s. The average effective moisture diffusivity for first, second and overall falling rate periods were 10.08x10¹⁰ , 11.21x10⁻¹⁰ and 10.62x10⁻¹⁰ m2/s, respectively. The effective moisture diffusivities in the second falling rate period were greater than those found for the first falling rate period. Similar results have been reported by Wang et al. (2007) and Kumar et al. (2012). As expected, the values of Deff increased greatly with increasing drying air temperature, which is in accordance with the previous studies (Mohapatra and Rao, 2005; Chandrashekar, 2008; Thorat, 2012). When yam
4 Pakistan Journal of Food Sciences (2013), Volume 23, Issue 1, Page(s): 1-9
PAK. J. FOOD SCI., 23(1), 2013: 1- 9 ISSN: 2226-5899
Table 2: Result of statistical analysis on the mathematical models for yam slices T (°C)
Model
Model coefficients
number 1
Drying
r2
χ2
RMSE
constants a = 1.0398
Sum of residuals
k = 0.0052
0.9998
0.000148
0.011853
0.354482
k = 0.0051
0.9995
0.000096
0.009646
0.281162
b = - 0.00000675
k = 0.00178
0.9935
0.000798
0.026773
0.113679
4
n = 1.0201
k = 0.00496
0.9999
0.000009
0.003059
0.035116
5
n = 1.0201
k = 0.00446
0.9999
0.000009
0.003065
0.035577
6
a = - 17.2239
k = 0.00998
0.9823
0.002989
0.051719
0.184125
b = 18.2279
k0 = 0.00949 0.9999
0.000009
0.003056
0.034908
k = 0.0063
0.9987
0.000197
0.013606
0.360828
k =0.0061
0.9997
0.000049
0.006938
0.131304
b = - 0.00000653
k =0.00189
0.9955
0.001532
0.036613
0.774042
4
n = 1.0214
k = 0.00601
0.9999
0.000010
0.003125
0.029968
5
n = 1.0214
k = 0.00539
0.9999
0.000010
0.003124
0.029925
6
a = - 17.2449
k = 0.00999
0.9957
0.000514
0.021216
0.006876
b = 18.2309
k0 = 0.00966 0.9999
0.000010
0.003117
0.029521
k = 0.0074
0.9988
0.000179
0.012876
0.285659
k =0.0072
0.9997
0.000055
0.007276
0.124566
b = - 0.00000547
k =0.00139
0.9911
0.002187
0.043163
0.549355
4
n = 1.0216
k = 0.00708
0.9999
0.000010
0.003047
0.024879
5
n = 1.0216
k = 0.00636
0.9999
0.000010
0.003045
0.024782
6
a = - 17.3447
k = 0.00979
0.9997
0.000031
0.005176
0.067451
b = 18.3309
k0 = 0.00965 0.9999
0.000010
0.003055
0.025284
2 3 35
a = 1.00288; n = 1.1898
7
α = 1.0201; β = 201.4139
1
a = 1.0418
2 3 40
a = 0.99878; n = 1.1998
7
α = 1.0214; β = 166.4256
1
a = 1.0399
2 3 45
7
a = 0.98978; n = 1.2987
α = 1.0216; β = 141.2551
5 Pakistan Journal of Food Sciences (2013), Volume 23, Issue 1, Page(s): 1-9
PAK. J. FOOD SCI., 23(1), 2013: 1- 9 ISSN: 2226-5899 0.016
2.5
2
Drying rate (kg water/kg db min)
Water content (kg water/kg db)
0.014
1.5 45°C 40°C
1
35°C 0.5
0.012 0.01
40°C
0.006
35°C
0.004 0.002 0
0 0
100
200
300
400
500
0
600
Drying time (min)
1
0.016
0.9
0.014 Drying rate (kg water/kg db min)
0.8 0.7 0.6
45°C
0.5
40°C
0.4
100
200
300 Drying time (min)
400
500
600
Fig. 3: Drying rate versus drying time at different temperatures
Fig. 1: Thin layer drying curves of yam slices at different temperatures.
Moisture ratio
45°C
0.008
35°C
0.3 0.2
0.012 0.01 0.008 45°C
0.006
40°C
0.004
35°C
0.002
0.1 0 0
100
200
300
400
500
600
Drying time (min)
Fig. 2: Moisture ratio versus drying time at different temperatures
0 0
0.5
1 1.5 Water content (kg water/kg db)
2
2.5
Fig. 4: Drying rate versus water content at different temperatures.
6 Pakistan Journal of Food Sciences (2013), Volume 23, Issue 1, Page(s): 1-9
1
1
0.9
0.9
0.8
0.8
0.7
0.7
0.6 0.5
Predicted X r
Predicted X r
PAK. J. FOOD SCI., 23(1), 2013: 1- 9 ISSN: 2226-5899
45°C 40°C
0.4
35°C
0.3
0.6 45°C
0.5
40°C
0.4
35°C
0.3
0.2
0.2
0.1
0.1
0 0
0.2
0.4
0.6
0.8
0
1
0
Experimental Xr
0.2
0.4
0.6
0.8
1
Experimental Xr
Fig. 5: Comparison of experimental and predicted moisture ratio by the modified Page model
Fig. 7: Comparison of experimental and predicted moisture ratio by the Weibull model.
1
-21
0.9
-20.9
0.8
-20.8
0.6 0.5
Ln(Deff )
Predicted X r
0.7
45°C 40°C
0.4
35°C
-20.7 Overall period
-20.6
0.3 0.2
First period Second period
-20.5
0.1
-20.4
0 0
0.2
0.4
0.6
0.8
1
Experimental Xr
Fig. 6: Comparison of experimental and predicted moisture ratio by the Page model
0.00314
0.00316
0.00318
0.0032
0.00322
0.00324
0.00326
1/T (K-1)
Fig. 8: Arrhenius-type relationship between effective moisture diffusivity and reciprocal absolute temperature.
7 Pakistan Journal of Food Sciences (2013), Volume 23, Issue 1, Page(s): 1-9
PAK. J. FOOD SCI., 23(1), 2013: 1- 9 ISSN: 2226-5899
molecules leading to higher moisture diffusivity (Xiao et al., 2010). The values of Deff obtained from this study lie within in general range 10-11 – 10-9 m2/s for drying of food materials (Wang et al., 2006).
3.
4.
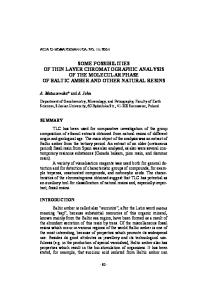
Determination of activation energy The activation energy can be determined from the slope of Arrhenius plot, ln(Deff) versus reciprocal of absolute temperature. The ln(Deff) as a function of 1/T was plotted in Fig. 8. The slope of the line is (- Ea/R) and the intercept equals to ln(D0). The results show a linear relationship due to Arrhenius type dependence as described in Eqs. (15), (16) and (17). First falling rate period 3500 D eff 7.15x10 5 exp( ) ( r 2 0.995) (15) T Second falling rate period 3418 D eff 6.13x10 5 exp( ) ( r 2 0.999) (16) T Overall falling rate period 3460 (17) D eff 6.65 x10 5 exp( ) (r 2 0.998) T The calculated values of activation energy for yam were 29.09, 28.42 and 28.77 kJ/mol for first, second and overall falling rate periods respectively. These values are similar to those proposed in the literature by Falade et al. (2007) for different varieties of yam e.g. between 25.26 and 72.47 kJ/mol. The values of activation energy were within the general range of 12.7 - 110 kJ/mol for various food materials (Zogzas et al., 1996).
5.
6.
7.
8.
9. 10.
11.
12.
13.
Conclusion In this study, drying kinetics of yam was investigated as a function of drying conditions. Drying of yam slices occurred in falling rate period; no constant rate period of drying was observed for the present study, which implies that moisture removal from the material was governed by diffusion phenomenon. Increasing the temperature of drying air decreases the drying time. According to statistical analysis applied to seven thin layer drying models, the modified Page, Page and Weibull models gave the best representation of drying data under all experimental conditions. The effective moisture diffusivity of yam was computed from Fick’s second law, the values of which varied between 10.08x10⁻¹⁰ and 11.21x10⁻¹⁰ m2/s over the temperature range of 35 – 45 °C. The average value of activation energy of yam was found to be 28.76 kJ/mol.
14.
15.
16.
17.
18.
References 1.
2.
Ahouannou, C., Jannot, Y., Lips, B. and Lallemand, A. 2000. Caractérisation et modélisation du séchage de trois produits tropicaux : manioc, gingembre et gombo. Sci. Aliments. 20: 413-432. Akgun, C.A. and Doymaz, I. 2005. Modeling of olive cake thin layer drying process. J. Food Eng. 68: 455-461.
19.
20.
21.
Akpinar, E.K. 2008. Mathematical modeling and experimental investigation on sun and solar drying of White mulberry. J. Mech. Sci. Technol. 22: 1544-1553. Badaleye, T. 2003. Raising the status of the yam, a major food crop in West Africa. ANB-BIA Supplement issue/Edition, 463: 1-3. Bruce, D.M. 1985. Exposed layer barley drying three models fitted to new data up to 150 °C. J. Agric. Eng. Res. 32: 337-347. Celma, A.R., Cuadros, F. and Lopez-Rodriguez, F. 2012. Convective drying characteristics of sludge from treatment plants in tomato processing industries. Food and Bioproducts Processing 90: 224-234. Chandrashebar, S. 2008. Modeling drying kinetics of mustard in fluidized bed. Inter. J. Food Eng. 4(3): 1-14. Corzo, O., Bracho, N., Pereira, A. and Väsquez, A. 2008. Weibull distribution for modelling air drying of coroba slices. LWT- Food Sci. Technol. 41: 2023-2028. Crank, J. 1975. The mathematics of diffusion. 2nd ed. London: Oxford University Press. Doymaz, I. 2004. Convective air drying characteristics of thin layer carrots. J. Food Eng. 61 (3): 359-364. Doymaz, I. 2012. Evaluation of some thin layer drying models of persimmon slices (Diospyros kaki L.). Energy Convers. Manage. 56: 199-205. Falade, K., Olurin, T., Ike, E. and Aworh, O. 2007. Effect of pre-treatment and temperature on airdrying of Dioscorea alata and Dioscorea rotundata slices. J. Food Eng. 80 (4): 1002-1010. Falade, K.O. and Solademi, J.S. 2010. Modelling of air drying of fresh and blanched sweet potato slices. Inter. J. Food Sci. Technol. 45: 278-288. Fioreze, R. and Morini, B. 2000. Yam (Dioscorea sp.) drying with different cuts and temperatures: experimental and simulated results. Cienc. Tecnol. Alimentos 20 (2): 262-266. Gikuru, M. and Olwal, J.O. 2005. The drying kinetics of kale (Brassica oleracea) in a convective hot air dryer. J. Food Eng. 71(4) : 373-378. Girardin, O. 1996. Technologie après récolte de l’igname: étude de l’amélioration du stockage traditionnel en Côte d’Ivoire. Thèse de doctorat en sciences techniques. Ecole polytechnique fédérale de Zurich, Suisse. Goyal, R.K., Mujjeb, O. and Bhargava, V.K. 2008. Mathematical modeling of thin layer drying kinetics of apple in tunnel dryer. Inter. J. Food Eng. 4(8): Article 8. Guiné, R.P.F. and Barroca, M.J. 2012. Effect of drying treatments on texture and color of vegetables (pumpkin and green pepper). Food and Bioproducts Processing 90: 58-63. Henderson, S.M. (1974). Progress in developing the thin layer drying equation. Transaction of the ASAE, 17(6): 1167-1168 Henderson, S.M. and pabis, S. 1961. Grain drying theory. II. Temperature effects on drying coefficients. J. Agric. Eng. Res. 6(3): 169-174. Jannot, Y., Talla, A., Nganhou, J. and Puiggali, J-R. 2004. Modeling of banana convective drying by the
8 Pakistan Journal of Food Sciences (2013), Volume 23, Issue 1, Page(s): 1-9
PAK. J. FOOD SCI., 23(1), 2013: 1- 9 ISSN: 2226-5899
22.
23.
24.
25.
26.
27.
28.
29.
30.
31.
32.
33.
34.
35.
36.
37.
38.
drying characteristic curve (DCC) method. Drying Technol. 22 (8): 1949-1968. Kaya, A., Aydin, O. and Demirtas, C. 2009. Experimental and theoretical analysis of drying carrots. Desalination 237: 285-295 Kim, S.S., Koh, K. H., Mee, S. and Oh, M. S. 2005. Preparation and quality of dried yam chip snack coated with ascorbic acid cocrystallized sucrose. Food Sci. Biotechnol. 4 (5)/ 661-666. Kingsly, R.P.,Goyal, R.P., Manikantan, M.R. and Ilyas, S.M. 2007. Effect of pretreatments and drying air temperature on drying behaviour of peach slice. Inter. J. Food Sci. Technol. 42: 65-69. Koua, K.B., Fassinou, W.F., Gbaha, P. and Toure, S. 2009. Mathematical modelling of the thin layer solar drying of banana, mango and cassava. Energy 34: 1594-1602. Krokoda, M.K., Karathanos, V.T., Maroulis, Z.B. and Marinos-Kouris, D. 2003. Drying kinetics of some vegetables. J. Food Eng. 59(4): 391-403. Kumar, N., Sarkar, B.C. and Sharma, H.K. 2012. Mathematical modelling of thin layer hot air drying of carrot pomace. J. Food Sci. Technol. 49: 33-41. Liu, X., Qju, Z., Wang, L., Cheng, Y., Qu, H. and Chen, Y. 2009. Mathematical modeling for thin layer vacuum belt drying of panax notoginseng extract. Energy Convers. Manage. 50: 928-932. Mazutti, M.A., Zabot, G., Boni, G., Skovronski, A., Oliveira, D.D., Lucio, M.D., Oliveira, J.V. et al. 2010. Mathematical modeling of thin layer drying of fermented and non-fermented sugarcane bagasse. Biomass and Bioenergy 34: 780-786. McMinn, W.A.M. 2006. Thin layer modeling of the convective, microwave, microwave-convective and microwave-vacuum drying of lactose powder. J. Food Eng. 72: 113-123. Midilli, A. and Kucuk, H. 2003. Mathematical modelling of thin layer drying of pistachio by using solar energy. Energy Convers. Manage. 44(7): 1111-1122. Midilli, A. and Kucuk, H. And Yapar, Z. 2002. A new model for single layer drying. Drying Technol. 20: 1503-1513. Mohapatra, D. and Rao, P.S. 2005. A thin layer drying model of parboiled wheat. J. Food Eng. 66: 513-518. Montes, E. J., Tores, R. G, Andrade, R. D. P., Pérez, O.A.S., Marimon. J. L. E and Meza, I.I.H. 2008. Modelado de la cinética de secado de ñame (Dioscorea rotundata) en capa delgada. Revista Ingeniería E Investigación 28 (2): 45-52. Overhults, D.D., White,G.M., Hamilton, M.E. and Ross, I.J. 1973. Drying soybeans with heated air. Transaction of the ASAE 16: 195-200. Page, G.E. 1946. Factors influencing the máximum rates of air drying shelled corn in thin layers. Department of Mechanical Engineering, Purdue University, Purdue, USA, M.S. Thesis Rafiee, S., Sharifi, M., Keyhani, A., Omid, M., Jafari, A., Mohtasebi, S.S., et al. 2010. Modeling effective moisture diffusivity of orange slices (Thompson Cv.). Inter. J. Food Properties 13:32-40. Rajkumar, P., Kaailappan, R., Viswanathan, R. and Raghavan, G.S.V. 2007. Drying characteristics of
39.
40.
41.
42.
43.
44.
45. 46.
47.
48.
49.
50.
51.
52.
foamed alphonso mango pulp in a continuous type foam mat dryer. J. Food Eng. 79: 1452-1459. Ramesh, M.N., Wolf, W., Tevini, D. and Jung, G. 2001. Influence of processing parameters on the drying of spice paprika. J. Food Eng. 49: 63-72. Schössler, K., Jäger, H. and Knorr, D. 2012. Effect of continuous and intermittent ultrasound on drying time and effective diffusivity during convective drying of Apple and red bell pepper. J. Food Eng. 108: 103-110. Silva, E.M., Da Silva, J.S., Pena, R.S. and Rogez, H. 2011. A combined approach to optimize the drying process of flavonoid-rich leaves (Inga edulis) using experimental design and mathematical modelling. Food Bioproducts Processing 89: 39-46. Talla, A., Jannot, Y., Kapseu, C. and Nganhou, J. 2001. Etude expérimentale et modélisation de la cinétique de séchage des fruits tropicaux : Application à la banane et à la mangue. Sci. Aliments 21(5) : 499-518. Thakor, N.J., Sokhansanj, S., Sosulski. F.W. and Yannacopoulos, S. 2005. Mass and dimensional changes of single canola kernels during drying. J. Food Eng. 40: 153-160. Thorat, I.D., Mohapatra, D., Sutar, R.F., Kapdi, S.S. and Jagtap, D.D. 2012. Mathematical modeling and experimental study on thin layer vacuum drying of ginger (Zingiber officinale R.) slices. Food and Bioprocess Technology 5(4): 1379-1383. Togrul, H. 2006. Suitable drying model for infrared drying of carrot. J. Food Eng.77(3): 610-619. Wang, Z., Junhong, S., Chen, F., Xiaojun, L. and Xiaosong, H. 2007. Mathematical modelling on thin layer microwave drying of apple pomace with and without hot air predrying. J. Food Eng. 80: 536-544. Wang, Z., Sun, J., Liao, X., Chen, F., Zhao, G., Wu, J. and Hu, X. 2006. Mathematical modelling on hot air drying of thin layer apple pomace. Food Res. Inter. 40(1): 39-46. Xiao, H.W., Pang, C.L., Wang, L.H., Bai, J.W., Yang, W.X. and Gao, Z.J. 2010. Drying kinetics and quality of monukka seedless grapes dried in an air-impingement jet dryer. Biosystem Eng.105: 233-240. Yilbas, B.S., Hussain, M.N. and Dincer, I. 2003. Heat and moisture diffusion in slab products to convective boundary. Heat and Mass Transfer 39: 471-476. Zielinska, M. and Markowski, M. 2010. Air drying characteristics and moisture diffusivity of carrots. Chemical Engineering Processing: Process Intensification 49: 212-218. Zielinska, M. and Markowski, M. 2007. Drying behavior of carrots dried in a spout-fluidized bed dryer. Drying Technol. 25: 261-270. Zogzas, N.P., Maroulis, Z.B. and Marinos-Kouris, D. 1996. Moisture diffusivity data compilation in foodstuffs. Drying Technol. 14: 2225-2253.
9 Pakistan Journal of Food Sciences (2013), Volume 23, Issue 1, Page(s): 1-9