Annals of Biomedical Engineering, Vol. 31, pp. 207–220, 2003 Printed in the USA. All rights reserved.
0090-6964/2003/31共2兲/207/14/$20.00 Copyright © 2003 Biomedical Engineering Society
Estimation of Musculotendon Properties in the Human Upper Limb BRIAN A. GARNER1 and MARCUS G. PANDY2 1
Department of Engineering, Baylor University, Waco, TX and 2Department of Biomedical Engineering, University of Texas, Austin, TX (Received 1 May 2002; accepted 2 December 2002)
Abstract—The purpose of this study was to develop and apply a general method for estimating the architectural properties of human muscles in vivo. The method consists of a two-phase, nested optimization procedure in which the values of peak isometric force, optimal muscle-fiber length, and tendon slack length are calculated for each musculotendon actuator, knowing muscle volume and the minimum and maximum physiological lengths of the actuator. In phase I, the positions of the bones and the activation levels of the muscles are found by maximizing the isometric torque developed for each degree of freedom at each joint. In phase II, the architectural properties of each musculotendon actuator are found by matching the strength profile of the model to that measured for subjects. The method is used to estimate the architectural properties of 26 major muscle groups crossing the shoulder, elbow, and wrist. Wherever possible, the model calculations are compared against measurements obtained from anatomical studies reported in the literature. Architectural data obtained from our work should be useful to researchers interested in developing musculoskeletal models of the upper limb. © 2003 Biomedical Engineering Society. 关DOI: 10.1114/1.1540105兴
muscles in humans, and the properties of muscles and tendons can change over time in the same individual 共e.g., as the person ages or changes his/her activity level兲.7 One of the most difficult parameters to estimate is tendon slack length. Values of this parameter are reported sparingly in the literature, possibly due to the difficulty in distinguishing the aponeurotic part of tendon from the muscle belly proper. The accuracy of movement simulation models can depend greatly on the values assumed for tendon slack length, as this parameter determines the compliance and therefore the force response of the actuator as a whole.5,43 It is important, therefore, to have reasonable estimates of tendon slack length in particular. The purpose of this study was to develop and apply a general method for estimating values of tendon slack length, peak isometric muscle force, and optimal musclefiber length of human musculotendon actuators in vivo. The method we present is a two-phase, nested optimization procedure in which the architectural properties of muscles are found by matching modeled and measured strength profiles for various joints comprising a whole limb. An important feature of the method is that, together with the measured strength profiles, only three parameters need to be specified for each musculotendon 共MT兲 actuator before the values of the remaining parameters can be found; these three parameters are muscle volume and the minimum and maximum MT lengths. We used the method to estimate the architectural properties of 26 major muscle groups crossing the human shoulder, elbow, and wrist.
Keywords—Musculoskeletal, Modeling, Muscle, Tendon, Parameter optimization, Joint torque.
INTRODUCTION An important component of any model of the human musculoskeletal system is a model of the musculotendon actuator. Zajac43 proposed a generic model that can be customized to specific muscles by specifying the values of five parameters: peak isometric muscle force and the corresponding fiber length and pennation angle, muscle’s intrinsic maximum shortening velocity, and tendon slack length. This phenomenological Hill-type model accounts for the force-length-velocity property of muscle and can be used to calculate muscle force if values of musculotendon length, velocity, and muscle activation are known. Although the Hill model has been used extensively in human movement modeling studies,31 finding appropriate values for some of its parameters can be difficult. Values appearing in the literature vary widely for even the same
MUSCULOSKELETAL MODEL OF THE UPPER LIMB Details of the arm model are presented in Garner and Pandy,14,16 so only a brief summary is provided here. Thirteen degrees of freedom 共dof兲 were used to describe the positions and orientations of seven bones in the model: clavicle, scapula, humerus, radius, ulna, carpal bones, and the hand 共which was represented as a single rigid body兲. Two holonomic constraints were used to
Address correspondence to Marcus G. Pandy, PhD, Department of Biomedical Engineering, ENS 610, University of Texas at Austin, Austin, Texas 78712. Electronic mail:
[email protected]
207
208
B. A. GARNER and M. G. PANDY
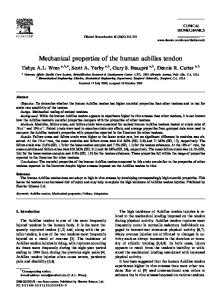
FIGURE 1. Normalized forcelength relationships for muscle. Peak isometric force, F M o , is the maximum force developed when fully-activated muscle is held at its optimal length, L M o . Active muscle force „solid line…, which is assumed to scale linearly with activation, is developed between M 0.5L M o and 1.5L o . Passive force is developed only when muscle is stretched beyond its optimal length „dashed line….
model the articulation between the scapula and the thorax. The locations of the joint centers and the positions and orientations of the joint axes of rotation were derived from three-dimensional representations of bone surfaces reconstructed from medical cross-sectional images.16 The medical images, which were obtained from the National Library of Medicine’s Visible Human Project, display axial cross sections of a human male cadaver taken at 1 mm intervals from head to toe. The entire set of images constitutes a high-resolution ‘‘digital’’ cadaver. The model was actuated by 42 muscle bundles, which represented the actions of 26 muscle groups in the upper limb. Each MT actuator was represented as a threeelement Hill-type muscle in series with tendon. The path of each muscle was calculated using a computational algorithm based on the obstacle-set method.15 Using this method, the path of the cross-sectional centroid of each muscle was approximated by a series of straight and curved line segments connected together at ‘‘via’’ points. Curved line segments represented portions of the muscle path that wrapped around underlying anatomical structures 共obstacles兲 such as bones and other muscles. These structures were modeled mathematically as simple geometric shapes 共e.g., a sphere or cylinder兲, and a muscle’s path was found by computing the shortest distance around the obstacles and between endpoints. In this way, the path of a muscle can be calculated for any given configuration of the bones in the model. The locations of via points and the positions and orientations of obstacles used to model muscle paths were derived from threedimensional representations of the muscle surfaces reconstructed from the visible human male 共VHM兲 image
set. The modeled muscle paths were validated against experimental moment arm data.14 REPRESENTING MUSCULOTENDON PARAMETERS Values of the parameters in our model of musculotendon actuation are not independent. For example, peak isometric muscle force (F oM ) is assumed to be proportional to physiological cross-sectional area 共PCSA兲,43 where PCSA is defined as the ratio between muscle volume and optimal muscle-fiber length: PCSA⫽Vol/L oM . The proportionality constant relating F oM to PCSA represents the maximum muscle stress, which has been assigned values ranging from 22035 to 360 kPa.36 We assumed a value of 330 kPa for muscles in the upper limb.39 Optimal muscle-fiber length (L oM ) and tendon slack length (L sT ) are also related. Due to its force-length property, there is a limited range of fiber lengths over which a muscle can operate effectively. Zajac43 represented this ˜M property in terms of normalized muscle force (F M M ˜ M ⫽L M /L ). ⫽F M /F o ) and normalized fiber length (L o As is evident from Fig. 1, the effective operating range of muscle begins at roughly 0.5L oM and ends at 1.5L oM ; muscle cannot generate active force beyond these lengths. In addition, when muscle is stretched to lengths greater than 1.2L oM , it generates a significant amount of passive force. Brand et al.7 discussed the importance of this operating range with respect to the required excursion of a muscle. These investigators defined muscle excursion as the difference between the maximum physiological
Estimation of Musculotendon Properties in the Human Upper Limb
209
FIGURE 2. Diagram illustrating the relationships between optimal muscle-fiber length, L M o , tendon slack length, L sT , and the minimum and maximum physiological lengths of a muscle, M M L min and L max , and a musculoMT MT and L max , tendon actuator, L min respectively. For the purpose of illustration, pennation angle is assumed to be zero. „a… When tendon slack length is large, muscle-fiber length is small; thus, muscle excursion will be small. „b… Conversely, when tendon slack length is small, muscle-fiber length is large, and muscle excursion will be large.
MT length (L max ) and the minimum physiological length MT (L min) of the muscle. Minimum and maximum physiological lengths correspond to the extreme lengths of an MT actuator when a joint is moved through its full range of motion. Assuming a muscle will operate effectively over most of the range of motion of a joint, the optimal fiber length of the muscle should be related to the excursion of the actuator. Specifically, for muscles with a large excursion, one can expect the value of L oM to be relatively large; conversely, for muscles with a small excursion, the value of L oM should be relatively small. Unfortunately, the relationship between optimal musclefiber length and MT excursion has been shown to vary widely among muscles, and it cannot be used to define the value of L oM precisely. For example, Brand et al.7 found that measured ratios of optimal muscle-fiber length and MT excursion varied from 0.76 to 2.35 for muscles of the forearm. Also affecting the relation between optimal musclefiber length and MT excursion is the value of tendon
slack length, L sT . Because the total length (L MT) of a MT actuator is given by the sum of muscle length (L M ) 共corrected for pennation兲 and tendon length (L T ), tendon length will affect the length of the muscle when the MT MT actuator is at L min and L max . If, for simplification, tendon is assumed to be sufficiently stiff so that a change in its length is negligible compared to a change in muscle length, then all variation in MT length (L MT) can be attributed to a change in muscle length. If an actuator has minimum and maximum physiological lengths which are both relatively large, then one can expect the value of L sT to be large and the value of L oM to be small 关Fig. MT is relatively small, then L sT 2共a兲兴. Conversely, if L min should be small and L oM should be large 关Fig. 2共b兲兴. It is MT MT , and L max are all related. clear, then, that L oM , L sT , L min To model these relationships, we chose to express L oM M M , which and L sT in terms of two quantities, ˜L min and ˜L max represent, respectively, the minimum and maximum physiological muscle lengths normalized by L oM . Formu-
210
B. A. GARNER and M. G. PANDY M 2 P min⬅ 冑共 ˜L min 兲 ⫺sin2 共 ␣ o 兲 ,
共5兲
M 2 P max⬅ 冑共 ˜L max 兲 ⫺sin2 共 ␣ o 兲 .
共6兲
Solving Eqs. 共3兲 and 共4兲 for L oM and L sT we obtain L oM ⫽
L sT ⫽
FIGURE 3. Relationship between pennation angle and muscle-fiber length. All muscle fibers are assumed to be arranged in parallel, to have the same length, L M , and to insert at an angle, ␣, on tendon. As the muscle fibers shorten, ␣ increases, while the width of the muscle, w, remains constant. The equations show how pennation angle can be expressed in terms of optimal muscle-fiber length, the value of pennation angle at peak isometric muscle force, and normalized muscle-fiber length, L˜ M .
las for transforming between the parameter set, L oM and L sT , and the normalized minimum and maximum physiM M ological muscle lengths, ˜L min and ˜L max , are derived below. Note that although tendon compliance is neglected in the derivation of these transformation equations, its effect is taken into account in the calculation of the unknown MT parameters described below 共see Parameter Estimation Method in Methods兲. From Figs. 2 and 3 it can be seen that
MT MT ⫺L min 兲 共 L max
共 P max⫺ P min兲
共7兲
,
MT MT ⫺ P minL max 兲 共 P maxL min
共 P max⫺ P min兲
共8兲
.
MT Thus, L oM and L sT may be expressed as functions of L min , MT ˜ M M MT MT ˜ L max , L min , and L max . If the values of L min and L max are M M known, the only remaining unknowns are ˜L min and ˜L max . The transformation Eqs. 共5兲–共8兲 are helpful because one M M might expect values of ˜L min and ˜L max to be somewhat M similar for all muscles in the body. Specifically, ˜L min should fall somewhere near the minimum of the ascendM ing region of muscle’s force-length curve 共i.e., ˜L min M ⬃0.5), while ˜L max should lie in the vicinity of the miniM mum of the descending region 共i.e., ˜L max ⬃1.5) 共see Fig. 1兲. Finally, if the volume of a muscle is known, F oM can be found using L oM as follows:
F oM ⫽ 共 330 kPa兲共 PCSA兲 ⫽ 共 330 kPa兲
冉
Volume L oM
冊
, 共9兲
where the constant 330 kPa represents maximum muscle stress.39 METHODS
MT M ⫽L sT ⫹cos 共 ␣ 兲 L min , L min
共1兲
MT M ⫽L sT ⫹cos 共 ␣ 兲 L max , L max
共2兲
where ␣ is the pennation angle of muscle. From Fig. 3 it is also apparent that cos ␣ may be expressed as ˜ M ) 2 ⫺sin2(␣ )), so that Eqs. 共1兲 and 共2兲 be(L oM /L M 冑(L o come MT M 2 L min ⫽L sT ⫹L oM 冑共 ˜L min 兲 ⫺sin2 共 ␣ o 兲 ⫽L sT ⫹L oM P min ,
MT M 2 L max ⫽L sT ⫹L oM 冑共 ˜L max 兲 ⫺sin2 共 ␣ o 兲 ⫽L sT ⫹L oM P max ,
共3兲
共4兲
where ␣ o is the pennation angle corresponding to peak isometric muscle force, and the symbols P min and P max , introduced merely for simplicity, are given by
Measurement of Joint Torque-Angle Curves Measured torque-angle curves were used to estimate the architectural properties of 42 muscles in the model arm. The experiments were conducted on three healthy, active, males 共age 25⫾3 years, mass 84⫾7 kg, and height 185⫾3 cm兲. A Biodex dynamometer was used to measure the active torques developed at the shoulder, elbow, and wrist during maximum voluntary isometric contractions of the muscles. The strength profile of each subject was comprised of 14 maximum isometric torqueangle curves, the data for which were obtained from a large number of individual maximum isometric torqueangle trials. Each trial consisted of a maximum contraction given at a specific joint 共shoulder, elbow, or wrist兲 with the joint placed in a specific configuration 共e.g., the elbow flexed to 30° with the forearm in the neutral position兲. Torque-angle curves were generated for flexion, extension, abduction, adduction, internal rotation and ex-
Estimation of Musculotendon Properties in the Human Upper Limb
211
FIGURE 4. Flow chart showing the two main phases of the parameter estimation method described in the text. Note that phases I and II are interdependent since changing the MT parameters in phase II can alter some of the joint angles calculated in phase I. The algorithm iterates back and forth between phases I and II until the best possible match is obtained between the torqueangle curves calculated by the model and those measured for the subjects.
ternal rotation of the shoulder; for flexion and extension of the elbow; for pronation and supination of the forearm; and for flexion, extension, radial deviation, and ulnar deviation of the wrist. Measurements were made over practically the full range of movement of each joint. For example, maximum elbow flexion torque was measured from full extension to 120° of flexion in 15° increments of elbow flexion, with the humerus positioned alongside the torso and the wrist fully extended. Subjects exerted maximum effort against the arm of the dynamometer for 3 s and peak torque was recorded. To minimize the effects of fatigue, subjects were encouraged to rest between each contraction, and data for each subject were recorded over a two-day period. For each joint, data were averaged across the three subjects and then pooled with maximum isometric torque-angle data reported in the literature2,10,12,17,21,26,30,34,41 to create a combined average. A third-order polynomial was then fitted to each combined average torque-angle curve resulting in fourteen polynomial functions representing the average strength profile for the upper limbs of our subjects. Calculation of Muscle Volume The volume of each muscle in the model was calculated by adding the volumes of the cross-sectional slices defined by the VHM images. The volume of a slice was computed as the product of the thickness between images and the cross-sectional area of the muscle within the
image. Because some broadly shaped muscles were modeled using multiple bundles 共e.g., the three heads of deltoid were modeled separately兲, the total volume computed for these muscles was divided among the separate bundles according to PCSA ratios reported by Johnson et al.22 共see Garner and Pandy14 for details兲. Calculation of Extreme Musculotendon Lengths The transformation Eqs. 共5兲–共8兲 that relate L oM and L sT M M to ˜L min and ˜L max require the minimum and maximum musculotendon lengths to be known. For each actuator, we calculated these extreme physiological lengths based on the geometrical representations of the muscle path and on the simulated joint range-of-motion limits. However, because most muscles cross more than one joint, and also because many joints have multiple dofs, calculating values of the minimum and maximum musculotendon lengths is not a simple task. In the case of multiple dof joints such as the shoulder, for example, the range-of-motion limits constitute a whole sinus of jointangle configurations,13 and the unique joint-angle configuration corresponding to a position of extreme physiological length for an individual muscle is not easily found. To compute the extreme physiological lengths of each actuator, a forward-dynamics simulation problem was solved using the musculoskeletal model of the arm. For example, to find the minimum physiological length of a given muscle, a 100 N tensile force was applied along
212
B. A. GARNER and M. G. PANDY
FIGURE 5. Flow charts showing details of phases I and II of the parameter estimation method. „a… The purpose of each simulated trial in phase I is to compute the muscle activation levels together with any unspecified joint angles in order to maximize the isometric torque developed at a given joint. Joint angles and muscle activations are calculated using initial guesses for values of M M L˜ min and L˜ max . Kinematic measurements of bone positions could not be obtained for some joints in the body „e.g., the sternoclavicular and acromioclavicular joints…, so these unknown joint angles are also treated as variables in the optimization problem. „b… The purpose of phase II is to calcuM late the optimum values of L˜ min M ˜ and L max , which are then used to find values of peak isometric muscle force, optimal muscle-fiber length and tendon slack length. Values of the joint angles and muscle activations obtained from phase I are left M unchanged. Values of L˜ min and ˜L M are found by minimizing max the sum of the squares of the differences between the strength profile in the model and that measured for the subjects.
the path of the muscle that caused the muscle to shorten. The simulation was performed until one extreme of the joint’s range of motion was reached and static equilibrium was attained. To find the maximum physiological length, the procedure was repeated using a 100 N compressive force that caused the muscle to lengthen. Parameter Estimation Method The overall goal of the method is to find values of F oM , L oM , and L sT for all actuators in the model that result in the best possible match between the strength profile of the model and that measured for the subjects. Values of muscle pennation angle ( ␣ o ) were obtained from the literature and did not play a part in the param-
eter estimation. For muscles in the human arm, pennation angle is relatively small 共⬍20°兲 and has little effect on the force response of an actuator.25,27,43 Muscle’s intrinsic M maximum shortening velocity, v max , was also not part of the parameter estimation because the problem was solved under isometric conditions and shortening velocity was assumed to be zero. The procedure begins by specifying initial guesses for all the unknown MT parameters in the model 共see Fig. 4兲. Note that because Eqs. 共5兲–共8兲 give the unknown MT M M and ˜L max , reasonably good parameters in terms of ˜L min guesses can be made for the initial values of these parameters. The method itself is divided into two interdependent phases. In phase I, the model is used to simulate
Estimation of Musculotendon Properties in the Human Upper Limb
each of 116 maximum isometric torque-angle trials similar to those performed by the subjects. In each trial, values of the MT parameters are left unchanged, and the muscle activation levels 共plus any unspecified joint angles; see later兲 are calculated in order to maximize the isometric torque developed at the joint. In phase II, the muscle activation levels are left unchanged, and the values of the MT parameters are found so that the torqueangle curves in the model are matched as closely as possible to those measured for the subjects. For simulated trials involving the elbow and wrist, all joint angles required to completely specify the relative configurations of the humerus, forearm, and hand were known in advance. For elbow extension at 30°, for example, the humerus was positioned alongside the torso, the elbow was flexed to 30°, the forearm was supinated, and the wrist was in neutral. Thus, only the muscle activations needed to produce maximum elbow-joint torque needed to be found. For trials involving the shoulder, however, it was not possible to completely specify the configurations of some of the bones in the model. For example, in the trial for maximum shoulder flexion torque at 45° of shoulder flexion, the humerus was positioned at 45° of flexion, but the corresponding positions of the clavicle and scapula were unknown. This is because it is not possible to accurately measure the threedimensional positions of these bones with surface markers mounted on the subjects. So, instead of specifying arbitrary positions for the clavicle and scapula in these trials, we included the glenohumeral, acromioclavicular, and sternoclavicular joint angles as variables in the optimization problem. Thus, for simulated trials involving the shoulder, phase I calculated the muscle activation levels and the glenohumeral, acromioclavicular, and sternoclavicular joint angles needed to produce maximum net muscle torque. The following sections describe the details of phases I and II in turn.
Phase I—Maximizing Joint-Torque Output In this phase, one optimization problem is solved for each trial simulated by the model 关see Fig. 5共a兲兴. The goal of each optimization problem is to compute the muscle activation levels together with any unspecified joint angles in order to maximize the isometric torque developed at the joint. Phase I begins by specifying the joint angles prescribed by the protocol followed in the experimental trials, and an initial guess is then made for the values of the remaining 共unspecified兲 joint angles and the muscle activation levels. Because the values of all MT parameters are left unchanged in phase I, these parameters are computed only once using the current valM M and ˜L max and Eqs. 共5兲–共8兲. Musculotendon ues of ˜L min force is then found based on the current estimates of the
213
values of the MT parameters, joint angles, and muscle activations. The net muscle torque at each joint is found from M M ¯ i ,LD min i ⫽ f 共 ¯q i ,a ,LD max 兲,
共10兲
where the subscript i denotes the ith simulated trial, i is the joint torque generated in the ith simulated trial, ¯q is the vector of joint angles, ¯a is the vector of muscle M M activations, and LD min , LD max are vectors of normalized minimum and maximum physiological lengths of the muscles. For the simulated trials in which all the joint angles are known 共i.e., those trials involving the elbow and wrist兲, each optimization problem solved in phase I can be stated as follows: maximize J 共 ¯a i 兲 ⫽ i .
共11兲
Additional constraints were introduced for the simulated trials involving the shoulder, and in these cases the optimization problem can be stated as ¯ i兲⫽i , ,a maximize J 共 ¯q unspec i spec subject to xˆ hum•xˆ hum i ⫽1,
pទ AC⫽0,
共12兲
spec zˆ hum•zˆ hum i ⫽1, 共13兲
␣ទ scap⫽0,
共14兲
is a vector containing the unspecified joint where ¯q unspec i angles for the ith simulated trial. Equations 共13兲 constrain the x and z axes of the humerus in the model (xˆ hum and zˆ hum) to remain aligned with the x and z axes of the spec ˆ spec humerus measured in the experiments (xˆ hum i and z hum i ). Equations 共14兲 constrain all components of the linear accelerations of the acromioclavicular joint (pទ AC) and the angular acceleration of the scapula ( ␣ទ scap) in the model to be zero. This ensures that the muscles of the upper shoulder girdle 共i.e., those that do not cross the glenohumeral joint兲 develop sufficient force to hold the shoulder in static equilibrium during a simulated trial.
Phase II—Estimating Musculotendon Parameters A single optimization problem is solved in phase II 关see Fig. 5共b兲兴. The goal of this phase is to find the values of the unknown MT parameters which give the best possible match between the strength profile of the model and that measured for the subjects. Thus, the optimization problem can be stated as M M ,LD max minimize J 共 LD min 兲⫽
116
兺 关共 i ⫺ stdi 兲 2 兴 ,
i⫽1
共15兲
214
B. A. GARNER and M. G. PANDY
TABLE 1. Muscle belly volumes reported in the literature compared to those computed from the VHM medical images. For muscles with multiple heads only total volume is given. The model estimates of muscle volume are noticeably larger than values obtained from cadaver dissection studies. Volume (cm3) Muscle Group
Model
Subclavius Serratus anterior Trapezius Levator scapulae Rhomboid minor Rhomboid major Pectoralis minor Pectoralis major Latissimus dorsi Deltoid Supraspinatus Infraspinatus Subscapularis Teres minor Teres major Coracobrachialis Triceps brachii Biceps brachii Brachialis Brachioradialis Supinator Pronator teres Flexor carpi radialis Flexor carpi ulnaris Extensor carpi radialis Extensor carpi ulnaris
8.80 358.56 457.89 71.92 117.77 117.77 73.14 676.40 549.69 792.87 89.23 225.36 318.52 38.70 231.40 80.01 619.99 365.84 265.96 83.19 34.11 80.41 56.97 67.66 166.61 28.65
Wood (1989)
Veegera (1991)
193.37 370.35
204.80 185.80 37.90
27.86 40.97 52.44 268.75 339.21 386.73 39.33 85.21 121.26 24.58 70.46 21.30 298.24 108.15 49.98 40.97
71.40 41.50 202.60 226.10 314.40 36.20 109.80 138.60 28.30 88.30 30.60 99.70 111.20
Bassett (1990)
Winters (1988)
303.30 209.30 475.10 56.70 153.00 207.90 132.60 37.20 152.00 128.00
Chen (1988)
An (1981)
Veeger (1997)
Cutts (1991)
23.00 44.00 53.00 12.40
283.02 113.21 84.91 37.74 23.58 18.87 23.58 47.17 18.87
152.60 64.20 59.30 21.90 10.90 18.70 12.40 15.20 34.10 14.90
42.00 379.00 128.00 122.00 66.00 17.00 33.00 33.02 46.89 82.92 36.04
a
See Ref. 38.
subject to L sT ⭓0
for all muscles,
共16兲
where i denotes the ith trial for both the model and the subjects, i is the maximum joint torque calculated in the is the corresponding ith trial for the model, and std i average maximum joint torque measured for the subjects. M Equation 共16兲 ensures there are no combinations of ˜L min M T and ˜L max that result in a negative value of L s for any actuator. Note that only the values of the MT parameters are changed in phase II; the joint angles and muscle activations found in phase I are left unchanged during phase II. M Initial guesses were made for the values of ˜L min and ˜L M , these being typically 0.5 and 1.2, respectively. No max more than ten iterations of the computational algorithm were needed to meet the convergence criterion. Values M for ˜L min were constrained to lie between 0.1 and 0.8, M were bounded between 0.7 and 1.6. while those for ˜L max The average difference between the computed and measured joint torques across all trials was 4 N m.
RESULTS Values of muscle volume, physiological crosssectional area, and peak isometric force calculated for the VHM cadaver were all much larger than corresponding values reported in the literature 共Tables 1 and 2兲. For example, summed volumes for the model pectoralis major and trapezius were 676 and 458 cm3, respectively, compared to 269 and 370 cm3 reported by Wood et al.,42 and 203 and 186 cm3 reported by Veeger et al.37 共Table 1兲. The sizes of the model biceps and triceps were also roughly three times larger than those of the specimens used in the literature studies. Summed volumes for biceps and triceps for the VHM cadaver were 366 and 620 cm3, respectively, compared to 100 cm3 for biceps and 100–300 cm3 for triceps reported by Winters and Stark,41 Wood et al.,42 Bassett et al.,6 and Veeger et al.37 Calculated values of optimal muscle-fiber lengths were in general agreement with data obtained from anatomical studies. Fiber lengths 共average of the separate bundles for each muscle group兲 of deltoid, biceps, tri-
Estimation of Musculotendon Properties in the Human Upper Limb
215
TABLE 2. PCSA reported in the literature compared with those computed by the model. For muscles with multiple heads, only the total PCSA is given. In the model, PCSA was computed by dividing muscle volume by optimal muscle fiber length „ L M o …. These values were multiplied by a factor of 330 kPa „see Ref. 39… to compute peak isometric force „ F M o …. As with volume, the model PCSA values are generally larger than the literature values. PCSA (cm2) Muscle group
F oM (N… Model
Model
Subclavius Serratus anterior Trapezius Levator scapulae Rhomboid minor Rhomboid major Pectoralis minor Pectoralis major Latissimus dorsi Deltoid Supraspinatus Infraspinatus Subscapularis Teres minor Teres major Coracobrachialis Triceps brachii Biceps brachii Brachialis Brachioradialis Supinator Pronator teres Flexor carpi radialis Flexor carpi ulnaris Extensor carpi radialis Extensor carpi ulnaris
143.76 677.30 802.25 124.78 221.45 217.12 160.59 1175.01 461.89 2044.65 687.99 1100.13 1178.38 223.27 514.57 150.02 2332.92 849.29 853.76 101.56 186.36 592.31 368.63 561.00 755.76 265.58
4.36 20.53 25.70 3.78 6.71 6.62 4.87 36.20 14.33 81.98 20.84 33.32 35.69 6.77 15.59 4.55 76.30 25.90 25.88 3.08 5.65 17.96 11.16 16.99 24.89 8.04
Wood (1989)
Veeger (1991)
Johnson (1996)
12.38 23.57
13.93 15.99 2.82
10.50 13.00 2.30 1.30 4.40 3.30
3.54 3.58 3.90 13.12 12.60 22.04 4.55 5.69 9.95 2.36 5.78 1.15 11.40 3.39 4.45 1.43
6.27 3.74 13.65 8.64 25.90 5.21 9.51 13.51 2.92 10.02 2.51 6.84 6.29
12.20 3.00 6.00 7.80 2.10 4.10
Bassett (1990)
Chen (1988)
13.19 12.31 24.90 7.09 17.00 25.99
18.30
11.05 1.96 4.61 4.80
Keatinga (1993)
Veeger (1997)
An (1981)
Lieberb (1992)
Cutts (1991)
43.10 4.02 5.88 13.50 2.58
16.80 11.70
2.10 13.81 5.34 5.55 2.87 1.65
18.80 4.60 7.00 1.50 3.40 3.40 2.00 3.20 5.30 3.40
1.33 4.13 1.99 3.42 4.19 2.60
4.90 5.60 13.90 5.60
a
See Ref. 24. See Ref. 28.
b
ceps, and extensor carpi radialis obtained from the model were, respectively, 12.8, 14.2, 8.8, and 7.3 cm 共Table 3兲. Corresponding values reported in the literature are 13.2 cm for deltoid,6 14.3 cm for biceps,3 8.3 cm for triceps,3 and 9.9 cm for extensor carpi radialis.29 It should be noted that even though differences are evident between the fiber lengths estimated for the model and values reported in the literature, there are also differences among the results for the various anatomical studies. For example, Bassett et al.6 reported a fiber length of 18 cm for biceps, which is a good deal higher than the value of 14 cm given by An et al.3 Also, Cutts et al.9 found fiber lengths of roughly 8 cm for flexor carpi ulnaris, which is nearly twice the values given by Amis et al.,2 Brand et al.,7 and Winters and Stark.41 Relatively few measurements are available with which to compare the model estimates for tendon slack length. Chen8 and Winters and Stark41 reported triceps tendon slack lengths of 19.9 and 19.3 cm, respectively, which compare favorably with the value of 19.1 cm estimated in the model 共Table 3兲. Tendon slack length for the
model biceps was found to be 23.0 cm, which is also in reasonable agreement with data reported by Chen8 and Winters and Stark41 共18.2 and 20.5 cm, respectively兲 共Table 3兲. Loren et al.29 measured tendon slack lengths for several actuators crossing the wrist, and their results show values of 24.8 cm for extensor carpi radialis and 23.1 cm for flexor carpi radialis. Corresponding values obtained for the model were 26.8 and 27.1 cm, respectively 共Table 3兲. The normalized minimum and maximum physiologiM M and ˜L max , for nearly all the muscles in cal lengths, ˜L min the model lie in the force-generating range of 0.5–1.5 共Fig. 6兲. The lengths estimated for coracobrachialis 共CRCB兲 indicate that this muscle operates near the flat region of its force-length curve for practically the entire range of glenohumeral joint motion, although the muscle never actually reaches the length at which peak force is developed 共i.e., muscle-fiber length remains less than L oM for the full range of shoulder joint motion兲. In contrast, the medial head of triceps brachii 共TRCm兲 in the model
216
B. A. GARNER and M. G. PANDY
T TABLE 3. Muscle fiber lengths „ L M o … and tendon slack lengths „ L s … reported in the literature compared with those computed in the model. Where necessary, values for multiple heads were averaged together. For most muscles, values for optimal muscle fiber length vary considerably between studies. Values used in the model were optimized so that joint strength computed in simulated torque-angle tests matched the strength of human subjects.
Optimal length (cm) Muscle fiber
( L oM )
Tendon ( L Ts )
Muscle
Bassett Chen Keating An Amis Winters Brand Cutts Loren Chen Winters Loren Model (1990) (1988) (1993) (1981) (1979) (1988) (1981) (1991) (1996) Model (1988) (1988) (1996)
Subclavius Serratus anterior Trapezius Levator scapulae Rhomboid minor Rhomboid major Pectoralis minor Pectoralis major Latissimus dorsi Deltoid Supraspinatus Infraspinatus Subscapularis Teres minor Teres major Coracobrachialis Triceps brachii Biceps brachii Brachialis Brachioradialis Supinator Pronator teres Flexor carpi radialis Flexor carpi ulnaris Extensor carpi radialis Extensor carpi ulnaris
2.02 17.47 18.84 19.02 17.55 17.90 15.03 19.00 39.27 12.80 4.28 6.76 8.92 5.72 14.84 17.60 8.77 14.22 10.28 27.03 6.04 4.48 5.10 3.98 7.28 3.56
22.55 34.60 13.20 6.90 9.30 8.70
13.30
16.80 9.90 12.10 17.95
7.93 5.64 7.50 4.12 4.90
8.70 11.15
8.30 14.30 9.00 16.40 3.30 5.60 5.80 4.80 6.55 4.50
operates between 0.4L oM and 1.4L oM , suggesting that this muscle may develop force over the full range of motion of the shoulder and elbow. A few muscles in the model M M have values of ˜L min and ˜L max that lie outside the forceproducing range. Superior head of latissimus dorsi M M 共LTDt兲, for example, has values of ˜L min and ˜L max of 0.2 and 0.8, respectively; this muscle can therefore produce force in the model only when its fibers are near their maximum physiological lengths. DISCUSSION The purpose of this study was to develop and apply a general method for estimating the architectural properties of human musculotendon actuators. The method consists of a two-phase, nested optimization procedure in which the values of MT parameters are found by matching modeled and measured strength profiles. In phase I, the activation levels of the muscles plus any unspecified joint angles are calculated in order to maximize the isometric torque developed for each dof of each joint. In phase II, values of the unknown MT parameters are
6.70 15.30 12.30 14.20 4.70 6.70 8.00 4.80 7.80 3.40
7.33 14.50 9.00 16.00 7.00 7.00 5.00 7.00 4.00
16.10 2.70 5.10 5.20 4.20 7.70 4.50
6.81 8.42 6.41 6.44
5.98 4.19 9.91 5.88
5.07 0.34 0.46 0.90 0.44 0.46 0.24 6.35 15.19 5.38 13.03 5.58 4.94 4.55 5.79 4.23 19.05 22.98 1.75 6.04 2.48 11.58 27.08 27.14 26.80 28.18
2.25 6.43
19.90 18.20
19.33 20.50 3.00 7.00 5.00 21.00 20.00 20.50 21.00
23.08 20.78 24.78 21.58
found by matching the strength profile of the model to that measured for subjects. We used the method to estimate the architectural properties of 26 major muscle groups crossing the shoulder, elbow, and wrist. A significant feature of our work is that the results are based on a detailed model of the upper limb. The model was developed from a high-resolution set of muscle and bone geometric data obtained from a single specimen, the VHM cadaver. Thirteen dofs were used to describe the relative positions and orientations of seven bones: clavicle, scapula, humerus, radius, ulna, carpal bones, and the hand. The joints were actuated by 42 muscle bundles representing the actions of 26 muscle groups in the upper limb. Previous investigators have developed models of the shoulder girdle, elbow, and wrist,1,23,27 but the model used in this study is the first to include all of the major dofs from the sternum down to the wrist.14,16 There are also a number of important features of the parameter estimation method itself. First, the algorithm we present is general in the sense that it can be applied to any number of muscles crossing any number of joints with any number of dofs. To be implemented, the algo-
Estimation of Musculotendon Properties in the Human Upper Limb
217
FIGURE 6. Diagram showing the operating range predicted for each muscle in the arm model. The left and right edges of each M M dark bar define the normalized minimum and maximum physiological lengths of each musculotendon actuator, L˜ min and L˜ max , respectively. The position of each dark bar illustrates the portion of the force-length curve on which muscle develops active force. For example, all the trapezius muscles „trap 1–4… operate mainly on the ascending region of their force-length curves „i.e., L˜ M Ë1.0…. Muscle symbols are: subclavius „SBCL…, serratus anterior superior „SRAs…, serratus anterior middle „SRAm…, serratus anterior inferior „SRAi…, trapezius C1–C6 „TRPc…, trapezius C7 „TRPc7…, trapezius T1 „TRPt1…, trapezius T2–T7 „TRPt2…, levator scapulae „LVS…, rhomboid minor „RMN…, rhomboid major T1–T2 „RMJt2…, rhomboid major T3–T4 „RMJt3…, pectoralis minor „PMN…, pectoralis major clavicular „PMJc…, pectoralis major sternal „PMJs…, pectoralis major ribs „PMJr…, latissimus dorsi thoracic „LTDt…, latissimus dorsi lumbar „LTDl…, latissimus dorsi illiac „LTDi…, deltoid clavicular „DLTc…, deltoid acromial „DLTa…, deltoid scapular „DLTs…, supraspinatus „SUPR…, infraspinatus „INFR…, subscapularis „SBSC…, teres minor „TMN…, teres major „TMJ…, coracobrachialis „CRCB…, triceps brachii long „TRClg…, triceps brachii medial „TRCm…, triceps brachii lateral „TRClt…, biceps short „BICs…, biceps long „BICl…, brachialis „BRA…, brachioradialis „BRD…, supinator „SUPR…, pronator teres „PRNT…, flexor carpi radialis „FCR…, flexor carpi ulnaris „FCU…, extensor carpi radialis long „ECRl…, extensor carpi radialis brev „ECRb…, and extensor carpi ulnaris „ECU….
rithm requires that three properties of each MT actuator 共muscle volume and the minimum and maximum physiological lengths of the actuator兲 be known and that measurements of maximum isometric torques be available for most of the joints of interest. Although it is not necessary for isometric torque-angle curves to be used at all joints, the reliability of the results is increased when measurements of net muscle torques are available for as many joint dofs as possible. Another important advantage of our method is that muscle properties are estimated consonant with the model assumed for the muscle paths. The procedure typically followed in musculoskeletal modeling studies is to use values of MT parameters obtained from cadaver dissections.4,11,20,32,33 This is somewhat problematic because cadaver specimens usually differ in age, size, and strength, and MT parameters obtained from these specimens are not likely to be compatible with the musculoskeletal geometry 共i.e., muscle paths兲 assumed in the model. In addition, for some regions of the body, par-
ticularly the upper limb, very few studies have reported values of optimal muscle-fiber length, and even fewer data are available for tendon slack length. A particularly useful feature of the method is that it is relatively easy to give a good initial guess for the un˜ M and ˜LM ). The parameter known MT parameters (L min max ˜LM represents the minimum fiber length of the muscle min normalized by its optimal value. Assuming a muscle operates on the active region of its force-length curve for M the full range of motion of the joint it spans, ˜Lmin should 18 have a value somewhere between 0.5 and 1.0. SimiM should have a value somewhere between 1.0 larly, ˜Lmax and 1.5. Because these criteria hold for any muscle crossing any number of joints, it is easy to provide good initial guesses for the unknown values of the MT parameters in any model. The idea of using in vivo joint torque-angle data to estimate muscle properties is not new. Hatze19 first used this approach to estimate the properties of the three
218
B. A. GARNER and M. G. PANDY
heads of triceps brachii in the human arm. In that study, torque-angle curves measured for maximum voluntary contractions of the triceps were matched to the maximum isometric extension torque calculated using a simple 共one dof兲 model of the elbow joint. Although our method is similar in principle to the one described by Hatze,19 there are some important differences. Our method capitalizes on known properties of a MT actuator 共muscle volume and the extreme physiological lengths兲 to limit the number of unknown parameters to two. Hatze’s method requires four parameters to be optimized for each muscle. We also used a change of variables 关Eqs. 共5兲–共8兲兴 to express the unknown parameters in a form that allows their initial values to be found quite easily. Perhaps most importantly, Hatze tested his method on a relatively simple model which consisted of three muscles crossing a single dof hinge joint. Our method was tested on a 13 dof model of the arm actuated by 42 muscles, with all the muscles producing torque about many dofs simultaneously 共e.g., the long head of triceps crosses both the elbow and shoulder, which together have four dofs in the model兲. There are also some limitations of the method. Perhaps most significantly, it does not guarantee a unique set of results. Values of maximum isometric muscle force, optimal muscle-fiber length, and tendon slack length for each actuator are obtained by matching the strength profile of the model to that measured for subjects. Because the muscles and bones of the upper limb comprise a mechanically redundant system, it is possible for this requirement to be satisfied by more than one set of MT parameters. Nonetheless, the values given in Tables 1–3 should approximate reasonably well the properties of the muscles in the VHM cadaver because 共1兲 the architectural properties of each actuator were constrained by the calculated values of muscle volume and the maximum and minimum musculotendon lengths; 共2兲 the results of a large number of simulated trials were included in the optimization calculations; and 共3兲 the model simulations were performed over a large region of the configuration space of the arm. More confidence could be gained in the model results by perturbing the values of the MT parameters and resolving the optimization problem. If the algorithm converges to the same solution, then one may conclude that the calculations are relatively insensitive to small changes in the initial guesses. Even though estimates of parameter sensitivity to model assumptions and measurement errors were not obtained in this study, we believe our method is at least partially substantiated by the fact that the model predictions compare favorably with results obtained from cadaver dissections 共see Tables 2 and 3兲. Quantifying the sensitivity of the optimization solution to changes in the input parameters, specifically muscle volumes, minimum and maximum musculoten-
don lengths, and the measured torque-angle curves, is an important issue that should be addressed in future work. A second limitation is that the accuracy of the results depends on the availability of maximum isometric joint torques. While numerous studies have reported torqueangle curves for the shoulder, elbow, and wrist, a complete set of measurements for even a single joint is difficult to obtain. Winters and Kleweno40 recorded maximum isometric torque-angle curves for flexion and abduction, but not for internal rotation. Delp et al.10 recorded the maximum torques developed by the wrist muscles for flexion-extension and radial-ulnar deviation, but no data were reported for combined movements of the wrist. Also, muscles that cross more than one joint contribute simultaneously to the torques developed at all the spanned joints. Thus, the net torque developed at a primary joint is affected by changes in the configuration of a neighboring joint. Although our method can account for the possibility of muscles crossing multiple joints, in practice it is difficult to obtain a complete set of torqueangle curves for all possible configurations of each joint. Thus, estimates obtained for the biarticular muscles in the model may be limited by the absence of a full complement of experimental torque-angle data for the arm. It is also quite difficult to measure isometric torques for some joints in the upper limb, specifically the sternoclavicular and acromioclavicular joints which form part of the shoulder girdle. Estimates obtained for muscles crossing these joints may therefore be less reliable than those for which maximum isometric torqueangle data were available. Finally, our results for the wrist muscles may be limited by the fact that the extrinsic finger and thumb flexors and extensors were not included in the model. The hand extrinsics can contribute significantly to the maximum isometric torques developed at the wrist. Neglecting the involvement of these muscles is likely to mean that the peak isometric strengths of the other muscles at the wrist are overestimated in the model. Perhaps most noticeable from our results is the fact that the volumes and cross-sectional areas of the muscles of the VHM cadaver are much larger than the values reported by others 共Tables 1 and 2兲. The most likely explanation is that the measurements reported in the literature are based on cadavers obtained from elderly donors, while the VHM dataset is based on a relatively young, muscular male. On the other hand, our estimates of optimal muscle-fiber length and tendon slack length are in reasonable agreement with data available in the literature 共Table 3兲, which is not surprising given that the lengths of the bones and the ranges of motion of the joints are not likely to be very different for the VHM cadaver and the specimens used in anatomical studies. In summary, the computational method presented in this paper should be useful to researchers interested in
Estimation of Musculotendon Properties in the Human Upper Limb
developing musculoskeletal models of the human body. Although it was applied to the upper limb here, the method itself is general and can be used to estimate the properties of MT actuators in the lower limb without modification. For each actuator in the model, values of peak isometric force, optimal muscle-fiber length, and tendon slack length are calculated knowing muscle volume and the extreme 共minimum and maximum兲 lengths of the actuator. The muscle architectural data obtained in this study should also be useful to those interested in developing models of the upper limb, because much of these data, especially tendon slack lengths, were not previously available.
ACKNOWLEDGMENTS Partial funding for this work was provided by NASA Grant Nos. NGT-51025 and NAG9-805. The authors thank the National Library of Medicine for making available to us the Visible Human Project dataset. Support provided by the Visualization Laboratory at The University of Texas Center for High Performance Computing is also gratefully acknowledged.
NOMENCLATURE M
F F oM ˜F M v oM ␣ ␣o LM L oM ˜L M M L min M L max ˜L M min ˜L M max LT L sT L MT MT L min MT L max
muscle force peak isometric muscle force muscle force normalized by F oM maximum shortening velocity of a muscle pennation angle of a muscle pennation angle at the optimal muscle-fiber length L oM muscle-fiber length optimal muscle-fiber length muscle-fiber length normalized by L oM minimum physiological muscle-fiber length maximum physiological muscle-fiber length minimum physiological muscle-fiber length normalized by L oM maximum physiological muscle-fiber length normalized by L oM tendon length tendon slack length musculotendon actuator length minimum physiological musculotendon actuator length maximum physiological musculotendon actuator length
219
REFERENCES 1
Amis, A. A., D. Dowson, and V. Wright. Elbow joint force predictions for some strenuous isomeric actions. J. Biomech. 13:765–775, 1980. 2 Amis, A. A., D. Dowson, and V. Wright. Muscle strengths and musculoskeletal geometry of the upper limb. Eng. Med. (Berlin) 8:41– 48, 1979. 3 An, K. N., F. C. Hui, B. G. Morrey, R. L. Linscheid, and E. Y. Chao. Muscles across the elbow joint: A biomechanical analysis. J. Biomech. 14:659– 669, 1981. 4 Anderson, F. C., and M. G. Pandy. Dynamic optimization of human walking. J. Biomech. Eng. 123:381–390, 2001. 5 Anderson, F. C., and M. G. Pandy. Storage and utilization of elastic strain energy during jumping. J. Biomech. 26:1413– 1427, 1993. 6 Bassett, R. W., A. O. Browne, B. F. Morrey, and K. N. An. Glenohumeral muscle force and moment mechanics in a position of shoulder instability. J. Biomech. 14:659– 669, 1990. 7 Brand, P. W., R. B. Beach, and D. E. Thompson. Relative tension and potential excursion of muscles in the forearm and hand. J. Hand Surgery 6:209–219, 1981. 8 Chen, J. J. Quantitative architectural analysis of human upper-extremity muscles. PhD dissertation, University of Virginia, 1988. 9 Cutts, A., R. M. Alexander, and R. F. Ker. Ratios of crosssectional areas of muscles and their tendons in a healthy human forearm. J. Anatomy 176:133–137, 1991. 10 Delp, S. L., A. E. Grierson, and T. S. Buchanan. Maximum isometric movements generated by the wrist muscles in flexion-extension and radial-ulnar deviation. J. Biomech. 29:1371–1375, 1996. 11 Delp, S. L., J. P. Loan, M. G. Hoy, F. E. Zajac, E. L. Topp, and J. M. Rosen. An interactive graphics-based model of the lower extremity to study orthopaedic surgical procedures. IEEE Trans. Biomed. Eng. 37:757–767, 1990. 12 Engin, A. E., and I. Kaleps. Active muscle torques about long-bone axes of major human joints. Aviat., Space Environ. Med. 51:551–555, 1980. 13 Engin, A. E., and S. M. Chen. Statistical data base for the biomechanical properties of the human shoulder complex—I: Kinematics of the shoulder complex. J. Biomech. Eng. 108:215–225, 1986. 14 Garner, B. A., and M. G. Pandy. Musculoskeletal model of the human arm based on the visible human male dataset. Comput. Methods Biomech. Biomed. Eng. 4:93–126, 2001. 15 Garner, B. A., and M. G. Pandy. The obstacle set method for representing muscle paths in musculoskeletal models. Comput. Methods Biomech. Biomed. Eng. 3:1–30, 2000. 16 Garner, B. A., and M. G. Pandy. A kinematic model of the upper limb based on the visible human project 共VHP兲 image dataset. Comput. Methods Biomech. Biomed. Eng. 2:107– 124, 1999. 17 Gonzalez, R. V., E. L. Hutchins, R. E. Barr, and L. D. Abraham. Development and evaluation of a musculoskeletal model of the elbow joint complex. J. Biomech. Eng. 118:32– 40, 1996. 18 Gordon, A. M., A. F. Huxley, and F. J. Julian. The variation in isometric tension with sarcomere length in vertebrate muscle fibres. J. Physiol. (London) 184:170–192, 1966. 19 Hatze, H. Estimation of myodynamic parameter values from observations on isometrically contracting muscle groups. Appl. Phys. (Berlin) 46:325–338, 1981. 20 Hoy, M. G., F. E. Zajac, and M. E. Gordon. A musculoskeletal model of the human lower extremity: The effect of
220
B. A. GARNER and M. G. PANDY
muscle, tendon, and moment arm on the moment-angle relationship of musculotendon actuators at the hip, knee, and ankle. J. Biomech. 23:157–169, 1990. 21 Hutchins, E. L. The musculoskeletal geometry of the human elbow and wrist: An analysis using torque-angle relationships. Masters thesis, The University of Texas at Austin, 1993. 22 Johnson, G. R., D. Spalding, A. Nowitzke, and N. Bogduk. Modelling the muscles of the scapula: Morphometric and coordinate data and functional implications. J. Biomech. 29:1039–1051, 1996. 23 Karlsson, D., and B. Peterson. Towards a model for force predictions in the human shoulder. J. Biomech. 25:189–192, 1992. 24 Keating, J. F., P. Waterworth, J. Shaw-Dunn, and J. Crossan. The relative strengths of the rotator cuff muscles. J. Bone Jt. Surg., Br. Vol. 75B:137–140, 1993. 25 Klein-Breteler, M. D., C. W. Spoor, and F. C. T. Van der Helm. Measuring muscle and joint geometry parameters of a shoulder for modeling purposes. J. Biomech. 32:1191–1197, 1999. 26 Knapik, J. J., J. E. Wright, R. H. Mawdsley, and J Braun. Isometric, isotonic, and isokinetic torque variations in four muscle groups through a range of joint motion. Physical Therapy 63:938 –947, 1983. 27 Lemay, M. A., and P. E. Crago. A dynamic model for simulating movements of the elbow, forearm, and wrist. J. Biomech. 29:1319–1330, 1996. 28 Lieber, R. L., M. D. Jacobson, B. M. Fazeli, R. A. Abrams, and M. J. Botte. Architecture of selected muscles of the arm and forearm: Anatomy and implications for tendon transfer. J. Hand Surgery 17A:787–798, 1992. 29 Loren, G. J., S. D. Shoemaker, T. J. Burkholder, M. D. Jacobson, J. Friden, and R. L. Lieber. Human wrist motors: Biomechanical design and application to tendon transfers. J. Biomech. 29:331–342, 1996. 30 Otis, J. C., R. F. Warren, S. I. Backus, T. J. Santner, and J. D. Mabrey. Torque production in the shoulder of the normal young adult male. Am. J. Sports Med. 18:119–123, 1990. 31 Pandy, M. G. Computer modeling and simulation of human movement. Annu. Rev. Biomed. Eng. 3:245–273, 2001.
32
Pandy, M. G., F. E. Zajac, E. Sim, and W. S. Levine. An optimal control model for maximum-height human jumping. J. Biomech. 23:1185–1198, 1990. 33 Raasch, C. C., F. E. Zajac, B. Ma, and W. S. Levine. Muscle coordination of maximum-speed pedaling. J. Biomech. 30:595– 602, 1997. 34 Reiser, R. F. Development of geometric and muscle-specific parameter values for musculoskeletal modeling of the shoulder joint. Masters thesis, The University of Texas at Austin, 1993. 35 Spector, S. A., P. F. Gardiner, R. F. Zernicke, R. R. Roy, and V. R. Edgerton. Muscle architecture and force-velocity characteristics of cat soleus and medial gastrocnemius: Implications for motor control. J. Neurophysiol. 44:951–960, 1980. 36 Steindler, A. Postgraduate lectures in orthopedics, diagnosis, and indications. Springfield, Illinois: Charles C. Thomas, 1950. 37 Veeger, H. E., Y. Bing, K. N. An, and R. H. Rozendal. Parameters for modeling the upper extremity. J. Biomech. 30:647– 652, 1997. 38 Veeger, H. E., F. C. van der Helm, L. H. van der Woulde, G. M. Pronk, and R. H. Rozendal. Inertia and muscle contraction parameters for musculoskeletal modeling of the shoulder mechanism. J. Biomech. 24:615– 629, 1991. 39 Weijs, W. A., and B. Hillen. Cross-sectional areas and estimated intrinsic strength of the human jaw muscles. Acta Morphology Aeerl.-Scand 23:267–274, 1985. 40 Winters, J. M., and D. J. Kleweno. Effect of initial upper limb alignment on muscle contributions to isometric strength curves. J. Biomech. 26:143–153, 1993. 41 Winters, J. M., and L. Stark. Estimated mechanical properties of synergistic muscles involved in movements of a variety of human joints. J. Biomech. 21:1027–1041, 1988. 42 Wood, J. E., S. G. Meek, and S. C. Jacobsen. Quantitation of human shoulder anatomy for prosthetic arm control—I. Surface modelling. J. Biomech. 22:273–292, 1989. 43 Zajac, F. E. Muscle and tendon: Properties, models, scaling, and application to biomechanics and motor control. In: CRC Critical Reviews in Biomedical Engineering, edited by J. R. Bourne. Baltimore; Williams & Wilkins, 1989, Vol. 17, pp. 359– 411.