Estimating Mechanical Properties of Shale From Empirical Correlations Per Horsrud,* SPE, SINTEF Petroleum Research
Summary Borehole-stability prediction requires knowledge of the mechanical properties of the formations which is rarely available in shale sections. This paper presents empirical correlations to assist in predicting shale mechanical properties. The correlations are based on extensive laboratory testing of shale cores primarily from the North Sea. The acoustic P-wave velocity is a primary input parameter in several of the correlations; thus, various sources of the P-wave velocity such as sonic wireline, sonic measurement while drilling (MWD), and acoustic measurements on cuttings may be used to obtain somewhat continuous estimates of shale mechanical properties. Borehole-stability evaluations can be made at different stages in the drilling process (planning, while drilling, and post-analysis). Other applications of the correlations where shale mechanical properties are required are evaluation of overburden compaction during depletion and optimization of the drilling process (selection of bit type, bit parameters, etc.). Introduction The properties and response of shale are important for the petroleum industry in basin modeling, interpretation of seismic response, and drilling with respect both to potential boreholestability problems and drillability. However, the shales are not the primary target; therefore, shale samples (cores) from deep boreholes are scarce because of the additional cost related to coring operations in deep boreholes. Stability problems during drilling may be very costly. Drilling of long sections at high angles in shales may represent a considerable challenge. This has motivated operators to core and test potentially troublesome shales in the overburden.1 Coring, however, can provide only discrete data points for use in a stability evaluation and can cover only a very limited depth range. There is an obvious need for methods that can provide shale properties both on a more continuous basis and at less cost. Such methods can be based on different information sources (e.g., wireline logs, MWD, and drill cuttings). Static mechanical properties are not measured directly by any of these tools. More or less empirical correlations have been used extensively in sandstones and to some extent in shales and mixed lithologies.2–5 Publicly available correlations often suffer from an overrepresentation of strong rock samples, which is not ideal for a stability evaluation. Further, they are based frequently on published data from different sources, where it is difficult to control the consistency of test material, test procedures, and data interpretation. This paper presents correlations which have been developed from a dedicated testing program on a number of shale cores, mainly from the North Sea. The testing program included measurements of a wide range of petrophysical and mechanical properties. Several of the shales were potential candidates for instability problems; thus, weak shales also are represented in this data set. Procedures and Apparatus for Triaxial Testing of Shales Shales have certain characteristic features that make them difficult to handle correctly. The two most important characteristics are low permeability6–9 and sensitivity to contacting fluids. * Now with Statoil Research Center, Trondheim Copyright © 2001 Society of Petroleum Engineers Original SPE manuscript received for review 11 February 1999. Revised manuscript received 15 August 2000. Paper (SPE 56017) peer approved 27 March 2001.
68
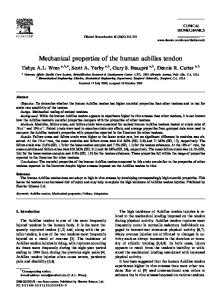
Special precautions must be taken to preserve the core,1 and special conditions must be applied during laboratory handling and testing.2,6,10 The shale is unloaded from pressure and temperature, and this may cause damage and alterations in several ways (e.g., creation of microcracks, disking, and reduced saturation caused by expansion). A shale taken from a deep borehole may not be 100% saturated under atmospheric conditions. This makes the laboratory testing susceptible to artifacts10,11 unless special procedures are applied. Because of the low permeability of these shales, testing of mechanical response can be very time-consuming and thus relatively expensive. The field cores that were tested were all well preserved so that loss of pore water after coring was prevented. Test samples were drilled from the core with the sample axis normal to the apparent bedding plane. The samples used for triaxial testing were 11/2 in. in diameter and approximately two times longer than the diameter. The triaxial tests were run as consolidated-undrained (CU) tests, a commonly used type of test for low-permeability shales. The tests consisted of the three segments illustrated in Fig. 1: loading to a predetermined level of confining pressure and pore pressure; consolidation (i.e., a period of constant confining pressure and drainage of the pore fluid against a constant pore pressure); and undrained axial loading under a constant axial displacement rate until failure of the sample. In this last phase, the pore pressure will increase because of the undrained boundary condition. Internal instrumentation of the test sample is shown in Fig. 2. In addition to measurement of external load, pressure, and deformations, the pore pressure at both ends of the sample and acoustic-wave trains in both the axial and radial directions are recorded. The time required to run a test depends on the permeability of the shale. Concepts from soil-mechanics testing can be applied to determine when consolidation is completed, and also to determine the appropriate displacement rate in the undrained part of the test,12 to make sure that pore-pressure equilibration is ensured throughout the sample. Shale Testing and Database Establishment Table 1 gives an overview of the field cores that have been tested and some key parameters for these shales. Some outcrop clays/mudstones included in the database13 and in the basis for the correlations are included. Table 1 shows a considerable spread in the properties of the shales. For Tertiary shales, porosity is generally high, with 55% porosity for the shallowest shale. As expected, porosity decreases with increasing depth and age, down to 3% porosity for the deepest shale. Triaxial testing is the primary basis for the empirical correlations developed. This paper will present how the shale properties of the correlations have been determined. At the initiation of the project it was difficult to anticipate which parameters could be correlated. An extensive test and characterization program was carried out for each core. This included additional testing and characterization such as mineralogy (X-ray diffraction), petrographic description using scanning electron microscopy (SEM), water content and bulk density, specific surface area, cation exchange capacity, pore size distribution, and permeability. For details about this and a more in-depth discussion of the shales, the reader is referred to another publication.6 Failure Properties. In the correlations for static mechanical properties, the failure properties of a linear Mohr-Coulomb failure criterion have been used (i.e., the uniaxial compressive strength, Co, and the failure angle, b). Because of the requirement of testing shales with a pore pressure, uniaxial compression tests cannot be June 2001 SPE Drilling & Completion
Stress
stress paths obtained from the triaxial tests of the Tertiary Paleocene (2) shale. The corresponding failure parameters, Co and b, were calculated using linear regression of the peak stress values. The stresspath plot uses the differential stress (axial minus radial stress) and the mean effective stress (axial stress plus two times the radial stress minus three times the pore pressure) on the axes; therefore, the properties of the straight line in the figure do not correspond directly to the Mohr-Coulomb failure properties. However, stress-path data can be transformed easily to effective principal stresses (smallest and largest) required by the Mohr-Coulomb criterion.
Axial stress Radial stress Consolidation
Pore pressure
Time Fig. 1—Schematic illustration of a CU triaxial test of shale.
used. The failure parameters have been interpreted from several tests at different effective confining pressures. Fig. 3 shows the
Static Elastic Properties. Static elastic properties, Young’s modulus and shear modulus, were obtained from the undrained triaxial part of the test. These were taken as tangent values of the stress vs. strain curve at 50% of the peak stress value. The same tests as used for the failure properties have been used to obtain one averaged value for each of the static elastic parameters. P-Wave Velocity. The P-wave velocity appeared to be an important parameter in the correlations. It was, however, necessary to
Pore pressure Steel piston (for axial stress) Confining oil (for radial stress)
Acoustic transducer (transmitter)
Permeable wrapping
Acoustic transducer (transmitter)
Permeable wrapping
Sintered plate
Sample
Sleeve
Acoustic transducer (transmitter)
Acoustic transducer (receiver and AE detector) Directions of radial strain measurements Sleeve Sintered plate
Axial strain LVDT transducer
Axial strain LVDT transducer
Acoustic transducer (receiver)
Steel piston Pore pressure Fig. 2—Triaxial cell instrumentation for CU triaxial testing of shale.
TABLE 1—BULK MINERALOGY AND POROSITY FOR SAMPLES FROM DEEP BOREHOLES IN THE NORTH SEA AND FROM OUTCROP MATERIALS Shale TM TE TP1 TP2 TP3 CRE UJ1 UJ2 UJ3 TR MJ Smectite London Clay Mo Clay
Geological Period Tertiary Miocene Tertiary Eocene Tertiary Paleocene (1) Tertiary Paleocene (2) Tertiary Paleocene (3) Cretaceous Upper Jurassic (1) Upper Jurassic (2) Upper Jurassic (3) Triassic Middle Jurassic Cretaceous Tertiary Tertiary
Depth (m) 1370 1570 1720 1870 1940 2090 3160 2630 2550 2440 4870 0 0 0
Clay Content 0.53 0.82 0.34 0.56 0.52 0.46 0.32 0.58 0.47 0.65 0.49 0.99 0.65 0.25
Chl .06 .02 .00 .01 .01 .03 .04 .06 .02 .06 .05 .00 .08 .00
Ka .15 .03 .0 .20 .23 .12 .12 .36 .14 .40 .11 .00 .10 .00
Clay types Mi/Ill .12 .06 .06 .03 .13 .12 .06 .10 .22 .13 .32 .00 .20 .03
ML .19 .00 .16 .03 .06 .18 .09 .06 .09 .06 .01 .00 .00 .00
Sm .01 .71 .03 .29 .09 .01 .01 .00 .00 .00 .00 .99 .27 .22
Porosity 0.55 0.41 0.31 0.34 0.31 0.29 0.30 0.10 0.17 0.15 0.03 0.57 0.45 0.72
Key: Chl=chlorite, Ka=kaolinite, Mi/Ill=mica and illite, ML=mixed layer, Sm=smectite.
June 2001 SPE Drilling & Completion
69
20
TABLE 2—CORRELATONS FOR PREDICTING STATIC MECHANICAL PROPERTIES OF SHALES
Differential stress , MPa
C o =14.3 MPa β = 49.1º
Co =
Co = 243.6 φ 10
3.23
E = 0.076v P
3.30
G = 0.03v P
2
S
0.99
3.4 MPa
0.98
3.7 MPa
0.99
0.4 GPa
0.99
0.2 GPa
5
0
5
10
15
20
Mean effective stress, MPa
Fig. 3—Stress paths of Tertiary Paleocene (2) shale.
find a consistent procedure of calculation that could take into account possible variations with stress level, sample variation, etc. The basis here is the set of samples from one given depth tested at different confining pressures to provide the static elastic properties and the failure properties previously discussed. At least one of the samples at each depth was tested at a confining pressure equal to or higher than the in-situ effective overburden. Although the P-wave velocity in high-porosity shales does not vary significantly with stress level, there may be significant variations in shales with lower porosity.14 The next step was to correct for possible sample variation. This is done by using the P-wave velocity at 2.5 MPa as a reference point, because all tests were run at effective confining pressures of 2.5 MPa or higher. First, the P-wave velocity for all the involved samples at a given depth is averaged; then the P-wave velocity at 2.5 MPa for the sample used to extract the P-wave velocity at the in-situ stress level is subtracted from this average value. The final P-wave velocity was corrected for changes occurring during the consolidation phase of the tests. This correction is included because the loading rate was not always low enough to ensure completely drained conditions during the loading phase. The sample therefore had to be left at constant load for some time to allow consolidation and equilibration. The P-wave velocity normal to the bedding at downhole stress is calculated as nP=nPs +(n– Pp2.5-nPp2.5)+DnPcon.
. . . . . . . . . . . . . . . . . . . . . (1)
Porosity. The porosity of the shales was estimated from determination of the free water content. The free water content was deter100 Correlation Correlation data points Tests after correlation establishment
90 80
60 50 40 30 20 10 0 2
2.5
3
3.5
4
4.5
Correlations Possible correlations between the measured static-mechanical properties of the shales and other parameters were investigated in both single variable and multivariate models. This paper will focus on the best correlations for predicting the static-mechanical properties of shales summarized in Table 2. The correlation coefficient, r 2, and standard error of the estimate, S=square root of the variance of the estimate, are included. Figs. 4 through 7 show the correlations plotted together with the data points. The number of data points does not always match the number of shales given in Table 1 because not all properties were available for all the shales. Included in Fig. 5 is the correlation given by Lashkaripour and Dusseault,4 showing a very similar relation between porosity and strength, Co=193.4f-1.143. Their correlation is based on 13 data points from publicly available sources and their own testing of shales that were generally stronger and with lower porosity. The mean of the uniaxial compressive strength is approximately 79 MPa; nine of these 13 points have 10% porosity or less. This difference between the two data sets may easily explain the difference between the correlations. It is evident from Table 2 that a correlation between porosity and P-wave velocity must also exist. This is given as (f in percent, nP in km/s) -2.37
f=227.8nP
,
. . . . . . . . . . . . . . . . . . . . . . . . . . . . . . . . . (2)
where r 2=0.98 and S=6.4%. 90
70
1.5
mined by drying a small sample at 105°C until constant sample weight was reached. With this method, it is necessary to have well preserved samples. An alternative is the more standard heliumporosity method which requires drying the sample at 60°C before measuring the porosity with helium. However, this latter method was found to give consistently lower porosity, and with a difference that increased with the smectite content.6 The main reason for this difference is believed to be the compaction of the smectite structure during the pretest drying.
Uniaxial compressive strength, MPa
Uniaxial compressive strength, MPa
2.93 0.77v P
- 0.96
0
5
5.5
P-wave velocity normal to bedding, km/s
Fig. 4—Correlation between uniaxial compressive strength and P-wave velocity normal to bedding. The uniaxial compressive strength is estimated from several tests at nonzero confining pressure using a linear Mohr-Coulomb failure criterion. 70
r
Correlation
15
Correlation
80
Data points
70
From Lashkaripour and Dusseault
60
4
50 40 30 20 10 0 0
10
20
30
40
50
60
70
80
90
Porosity, %
Fig. 5—Correlation between uniaxial compressive strength and porosity. June 2001 SPE Drilling & Completion
7
14
Correlation
12
Data points
Correlation
6
Data points Shear modulus, GPa
Young’s modulus, GPa
16
10 8 6 4
5 4 3 2 1
2 0
0 1.5
2
2.5
3
3.5
4
4.5
5
5.5
P-wave velocity normal to bedding, km/s
Failure Angle Estimation. The failure angle, b, in the Mohr-Coulomb failure criterion is a required parameter for a complete stability evaluation. The failure angle of a shale is normally in the 45 to 60° range, but this parameter is not directly available when core testing is not possible. Good correlations between the failure angle and other parameters have not been established, but certain trends have been found. • The failure angle tends to increase with shale strength (and then also with P-wave velocity). • The failure angle tends to decrease with increasing claymineral content. • The failure angle shows some dependence on kaolinite content. Table 3 lists these relations, including the correlation coefficient and the standard error of the estimate. Note that these correlations are rather poor, with a significant error of the estimate. One may also question the validity of using the P-wave velocity for determination of both the compressive strength and the failure angle. Used with care, these trends may help to reduce the uncertainty of the failure angle estimate, especially if several of the above trends can be used simultaneously. Similar trends have been found by others1 (e.g., increasing failure angle with increasing strength). P-Wave Velocities From Field Data. The good correlation between the laboratory-measured P-wave velocity of shales and the mechanical properties of the shales makes it possible to estimate the mechanical properties from several sources. Wireline Logs. Using the P-wave interval transit time from the sonic log, Dt P, in ms/ft, the correlations can be written as Co=0.77(304.8/Dt P)2.93,
. . . . . . . . . . . . . . . . . . . . . . . . . . . (3)
E=0.076(304.8/Dt P)3.23,
. . . . . . . . . . . . . . . . . . . . . . . . . . . (4) . . . . . . . . . . . . . . . . . . . . . . . . . . (5)
This implies that more or less continuous estimates of shale mechanical properties can be obtained directly from the sonic log in shale intervals. Fig. 8 shows examples of how the uniaxial compressive strength has been estimated from sonic log values for three differTABLE 3—CORRELATIONS BETWEEN FAILURE ANGLE AND OTHER PARAMETERS β 49.8º+0.3Co 39.9º+5.5vP 61.0º+0.13Ccl 50.7º–0.032Ccl + 0.24Cka
June 2001 SPE Drilling & Completion
r2 0.36 0.48 0.32 0.59
2
2.5
3
3.5
4
4.5
5
5.5
P-wave velocity normal to bedding, km/s
Fig. 6—Correlation between Young’s modulus and P-wave velocity normal to bedding.
and G=0.030(304.8/Dt P)3.30.
1.5
S 3.5 3.3 3.6 3.0
Fig. 7—Correlation between shear modulus and P-wave velocity.
ent wells. These estimates are compared with estimates from laboratory triaxial testing. As shown by the figure, there is reasonably good agreement between the estimates. MWD. An alternative to the sonic wireline log is to run the sonic in the MWD setup. This would provide a close to real-time mechanical properties log and could thus be used to continuously monitor borehole stability. MWD data were not available, however, and a comparison based on MWD sonic was not possible. Obtaining sonic logs both from MWD and wireline also opens up several interesting applications. This would provide a means of monitoring the time-dependent effects after drilling, comparing the response of the formation while drilling and some time after drilling, especially if the MWD is applied also during tripping. This may reveal effects of time-dependent instabilities, breakouts, etc. Drill Cuttings. Methods for sonic measurements on shale cuttings at the rigsite have been developed.15,16 The advantage of the cuttings/ cavings is that they can provide both more continuous measurements and closer to real-time (on the rig) estimates than core measurements. The disadvantage is that cuttings/cavings are more susceptible to alterations caused by the drilling process, such as drill fluid/drill-bit effects. Cuttings measurements also represent a potential for studying shale-fluid interactions and possible fluid effects on mechanical properties. Discussion of Corrections and Uncertainties P-Wave Velocity. The correlations are based on P-wave velocity measurements under laboratory conditions. Using the P-wave velocity from the sonic log instead introduces several possible uncertainties. Even if the stress dependence of the P-wave velocity is small for high-porosity shales,14 there may be unloading effects causing different effects on cores and downhole, and in particular on lower porosity shales. This has been addressed to a large extent by the correction scheme summarized in Eq. 1. The correlations are based on measurements at room temperature, while both static and dynamic shale mechanical properties are temperature dependent. Stiffness, strength, and P-wave velocity decrease with increasing temperature.6,17 Fig. 9 shows the P-wave velocity measured on core samples in the laboratory compared with the P-wave velocity from the sonic log at corresponding depths. One set of points shown has been corrected from the laboratory temperature (20°C) to the appropriate downhole temperature for each core. These corrections are based on measurements at room temperature and at 80°C. With only two temperatures, there is some uncertainty attached to these corrections, both with respect to interpolation and extrapolation beyond 80°C. Further testing is required to develop a more reliable and generally applicable temperature correction scheme. The laboratorymeasured P-wave velocity is, however, consistently higher than the P-wave velocity from the sonic log. This indicates that there is a 71
-5
6 P-wave velocity measured in lab
-4 Triassic
P-wave velocity from log, km/s
Depth relative to core depth, m
Tertiary Eocene
-3 -2
Lab value (TE)
-1
Lab value (TR)
0
Lab value (MJ)
1 2
Middle Jurassic
3
5
Lab-measured velocity corrected to downhole temperature
4
3
2
1
4 0
5
0
0
10
20 30 40 50 60 70 Estimated uniaxial compressive strength, MPa
80
Fig. 8—Uniaxial compressive strength estimated from sonic log and from laboratory triaxial tests.
systematic error, and apparently the temperature effect may account for at least some of this difference, because the agreement is improved when temperature corrections are applied. Ideally, the correlations should include a temperature-correction term to account for arbitrary downhole temperatures. Alternatively, one could apply a three-step correction scheme: correct the P-wave velocity from downhole temperature to 20°C; apply the correlation; and correct the estimated mechanical property to downhole temperature. Until such a correction scheme becomes available, it is recommended to use the logged P-wave velocity directly in the correlations. This will account for some of the systematically induced temperature error, although the final uncertainty is not known. Dispersion effects caused by the difference in frequency used in the laboratory and during downhole logging may contribute to a difference between logged and laboratory-measured velocities. However, assuming that Biot flow (fluid flow relative to the framework) and local flow or squirt flow (fluid flow between pores and cracks as a result of volume change induced by the sound wave) are the dominant mechanisms for frequency-dependent velocity dispersion, no correction is needed when applying ultrasonic results to downhole sonic measurements.18 If the shale is heterogeneous, the difference in sampling scale between the laboratory and sonic-logging tools is another possible source of error. An alternative to using the laboratory-measured P-wave velocity could be to correlate directly with the P-wave velocity obtained from sonic logging. However, not all the cored wells had been logged. Thus, the correlation would have been based on fewer data points. In most cases, the depth correction between drilled and logged depth is unknown. Basing the correlations on measurements of the same sample of material was considered to be more consistent and qualitatively more sound. The correlations with P-wave velocity are based on wave propagation normal to the bedding of the shale. The shales in the database exhibit some anisotropy, with a P-wave velocity parallel with the bedding that is 0 to 25% higher than normal to the bedding.14 This implies that sonic wireline or sonic MWD data should preferably be from near-vertical wells, given that the bedding is primarily horizontal. General Validity of the Correlations. An obvious question is how generally applicable these correlations may be (i.e., with respect to different shale types, geographical locations, etc). The data are mainly from the North Sea, and the Tertiary period has the largest sample population. A wide range of depths, porosities, and clay mineral constituents is covered within this population. Being aware of the large natural variation of shale properties and constituents, one has to exert some care when using the correlations in different areas. Such a generalization can be obtained only through further use and testing of the correlations. The author’s experience so far from the Norwegian Continental Shelf is 72
1
2 3 4 P-wave velocity from lab, km/s
5
6
Fig. 9—Comparison between log-derived P-wave velocity and laboratory-measured P-wave velocity (measured at 20°C and corrected to downhole temperature) at corresponding depths.
that additional data points fit well into the already established correlations (four cores have been tested since the correlations were established), thus providing some confidence in the correlations in this area (see Fig. 4). The correlations, however, have not been tested with samples from fields situated in deep waters (>1000 m), nor is any experience from other parts of the world available. One case of significant discrepancy has been uncovered.19 This was a zone of a few meters thickness offshore mid-Norway with low-density and high-porosity rock which initially was thought to represent a problem zone during drilling. Coring and testing revealed that this was a rock with a very high content of noncrystalline (amorphous) siliceous microfossils that possessed an unexpectedly high strength, a factor almost double that predicted by the correlation. It should also be realized that there are still uncertainties which have not been fully quantified with respect to shale core measurements, such as sample-size effects, core-unloading effects, etc. Some of these effects will be extremely difficult to quantify, because it is difficult to establish the reference point. In total, the uncertainty in applying the correlations in the source area is estimated to be up to 50% in the low-strength range (Co50 MPa). The correlations should be a useful tool for more continuous and more reliable predictions of mechanical properties than what has been available previously for shales. Potential Applications The most obvious application of the correlations is borehole-stability evaluation. With the sources available for P-wave velocity estimates, this can be done in all stages of drilling, (i.e., planning, follow-up during drilling, and post-analysis). Correlations can be implemented directly in log analysis software, for example, thus providing a shale mechanical-properties log. The time-dependent response of the shale during the openhole period may be monitored also by comparing one or more sources (MWD, wireline log, etc.) from different times after drilling. Mechanical properties are used also as a basis for other drilling parameters, selection of drill bits, etc.3,5 This is another potential application of the correlations. The correlations provide a possibility of mapping the mechanical properties of the shale in the overburden of a field. These are important input parameters in a subsidence analysis for a potentially compacting reservoir. Because the P-wave velocity in the shale is the primary input to the correlations, it is recommended to include P-wave velocity logging routinely in overburden sections, at least in the early stages of field development. The correlations are limited to shales; therefore, a lithology check should be performed. The clay mineral content should be larger than approximately 30% to ensure a clay-bearing structure. June 2001 SPE Drilling & Completion
The correlations are based on data from the North Sea and the Norwegian Continental Shelf, where they appear to apply with reasonable confidence for “normal” shales. However, extremities in shale types exist and may be encountered. Therefore, some standard types of characterization (mineralogy, porosity, etc.) are recommended for the specific zones of interest. When bringing the correlations to new geological and geographical areas, tests are recommended to check the correlations. Conclusions A dedicated testing program for North Sea shale cores has provided a valuable database for shale properties, especially for weaker shales that may cause borehole-stability problems. Using these data, empirical correlations for prediction of shale mechanical properties have been developed. From these correlations, static mechanical properties can be predicted from various sources such as sonic wireline log, MWD sonic, and acoustic measurements on cuttings and at various stages in the process of drilling a borehole. The P-wave velocity in the shale is a key parameter in several of the correlations. These correlations can be used as an engineering tool to provide more reliable and more continuous estimates of mechanical properties of shales, keeping in mind that the validity of the correlations should be checked when used in other geological and geographical areas. Other sources of uncertainty also exist (e.g., core-damage effects and temperature effects) that should have a focus in further work. The primary application of the correlations is within boreholestability evaluation (planning, while drilling, and post-analysis), but other potential applications are in drilling optimization (bit type, bit parameters, etc.) and evaluation of overburden compaction. Nomenclature Ccl = total clay content, m/m, % Cka = kaolinite content, m/m, % Co = uniaxial compressive strength, m/Lt2, MPa E = Young’s modulus, m/Lt2, GPa G = shear modulus, m/Lt2, GPa r 2 = correlation coefficient S = standard error of estimate (square root of the variance of the estimate) Dt P = P-wave interval transit time, t/L, ms/ft nP = P-wave velocity normal to bedding, L/t, km/s nPp2.5 = P-wave velocity measured at 2.5 MPa confining pressure, L/t, km/s n– Pp2.5 = average P-wave velocity at 2.5 MPa confining pressure, L/t, km/s nPs¢ = P-wave velocity measured at overburden stress, L/t, km/s n– Ps¢ = average P-wave velocity measured at overburden stress, L/t, km/s DnPcon = change in P-wave velocity during consolidation, L/t, km/s b = failure angle, degrees f = porosity, L3/L3, % s = stress, m/Lt2 Acknowledgments The author thanks the companies that have participated in the Shale Stability Project at SINTEF Petroleum Research, Amoco Norway Oil Co., Den norske stats oljeselskap a.s., Elf Petroleum Norge AS, Norsk Agip A/S, Norsk Hydro ASA, Norske Conoco AS, and Saga Petroleum ASA for their financial support and also for supplying the cores to this study. The persons who have performed the testing are acknowledged, together with coworkers in the project, Eyvind F. Sønstebø and Rune M. Holt, who have contributed with comments to this paper. References 1. Wong, S.-W. et al.: “Optimising Shale Drilling in the Northern North Sea: Borehole Stability Considerations,” paper SPE 26736 presented at
June 2001 SPE Drilling & Completion
the 1993 Offshore European Conference, Aberdeen, 7–10 September. 2. Steiger R.P. and Leung P.K.: “Quantitative Determination of the Mechanical Properties of Shales,” SPEDE (September 1992) 181; Trans., AIME, 293. 3. Mason, K.L.: “Three-Cone Bit Selection With Sonic Logs,” SPEDE, (June 1987), 135. 4. Lashkaripour, G.R. and Dusseault, M.B.: “A Statistical Study on Shale Properties: Relationships Among Principal Shale Properties,” Probabilistic Methods in Geotechnical Eng., Li and Lo (eds.), Balkema, Rotterdam, The Netherlands (1993). 5. Onyia, E.C.: “Relationships Between Formation Strength, Drilling Strength, And Electric Log Properties,” paper SPE 18166 presented at the 1988 SPE Annual Technical Conference and Exhibition, Houston, 2–5 October. 6. Horsrud, P., Sønstebø, E.F., and Bøe, R.: “Mechanical and Petrophysical Properties of North Sea Shales,” Intl. J. Rock Mech. Min. Sci. (1998) 35, No. 8, 1009. 7. Katsube, T.J., Mudford, B.S., and Best, M.E.: “Petrophysical Characteristics of Shales From the Scotian Shelf,” Geophysics, (1991) 56, No. 10, 1681. 8. Best, M.E. and Katsube, T.J.: “Shale Permeability and Its Significance in Hydrocarbon Exploration,” The Leading Edge (1995), 14, No. 3, 165. 9. Chenevert, M.E. and Sharma, A.K.: “Permeability and Effective Pore Pressure of Shales,” paper SPE/IADC 21918 presented at the 1991 SPE/IADC Drilling Conference, Amsterdam, 11–14 March. 10. Schmitt, L., Forsans, T., and Santarelli, F.J.: “Shale Testing and Capillary Phenomena,” Intl. J. Rock Mech. Min. Sci. (1994) 31, No. 5, 411. 11. Santarelli, F.J. and Carminati, S.: “Do Shales Swell? A Critical Review of Available Evidence,” paper SPE/IADC 29421 presented at the 1995 SPE/IADC Drilling Conference, Amsterdam, 28 February– 2 March. 12. Head, K.H.: Manual of Soil Laboratory Testing, Vols 1–3. Pentech Press, London (1992). 13. Nakken, S.J. et al.: “Mechanical Behaviour of Clays at High Stress Levels For Wellbore Stability Applications,” Proc., Rock at Great Depth, Balkema, Rotterdam, The Netherlands (1989). 14. Holt, R.M., Furre, A.-K., and Horsrud, P.: “Stress Dependent Wave Velocities In Sedimentary Rock Cores: Why and Why Not?” Intl. J. Rock Mech. Min. Sci. (1997) 34:3, paper No. 128. 15. Nes, O.-M. et al.: “Rig-site and Laboratory Use of CWT Acoustic Velocity Measurements on Cuttings,” SPEREE (August 1998) 282. 16. Marsala, A.F. et al.: “Sonic While Drilling: Have You Thought About Cuttings?” paper SPE 30545 presented at the 1995 SPE Annual Technical Conference and Exhibition, Dallas, 22–25 October. 17. Horsrud, P. et al.: “Time Dependent Borehole Stability: Laboratory Studies and Numerical Simulation of Different Mechanisms in Shale,” paper 28060 presented at the 1994 SPE Eurock Conference, Delft, The Netherlands, 29–31 August. 18. Liu, X., Vernik, L., and Nur, A.: “Effects of Saturating Fluids on Seismic Velocities in Shales,” Expanded Abstracts from the 1994 SEG Intl. Exposition and 64th Annual Meeting, Los Angeles, 23–28 October, 1121. 19. Stjern, G., Horsrud, P., and Agle, A.: “Improved Drilling Performance in Troublesome Clay Formations in the Heidrun Field,” paper SPE 59219 presented at the 2000 IADC/SPE Drilling Conference, New Orleans, 23–25 February.
SI Metric ft ´ °F ´ psi ´
Conversion Factors 3.048* E - 01 = m (°F - 32°)/1.8 = °C 6.894 757 E - 03 = MPa
*Conversion factor is exact.
SPEDC
Per Horsrud is a staff engineer for Statoil at the Research Center in Trondheim, Norway. e-mail:
[email protected]. He was a senior scientist at SINTEF Petroleum Research. His primary interest is petroleum-related rock mechanics. He served on the SPE 1998 Eurock Committee and the Trondheim section from 1992–94. Horsrud holds an MS degree in physics from the Technical U. of Norway.
73