THEMATIC PAPER ON MDG 7:
ENVIRONMENTAL SUSTAINABILITY*
* DRAFT pending UNDG endorsement on 4th May
United Nations Development Group March 2010
18 March 2010
Table of Contents Introduction ............................................................................................................................................ 3 I.
Overall Assessment of Progress on MDG 7..................................................................................... 4 Indicator 7.1: Proportion of land and area covered by forest ........................................................ 5 Indicator 7.2: CO2 emissions, total, per capita and per $ 1 GDP ..................................................... 9 Indicator 7.3: Consumption of ozone-depleting substances ......................................................... 12 Indicator 7.4: Proportion of fish stocks within safe biological limits ............................................ 14 Indicator 7.5: Proportion of total water resources used ............................................................... 17 Indicator 7.6: Proportion of terrestrial and marine protected areas ............................................ 19 Indicator 7.7: Proportion of species threatened with extinction .................................................. 23 Indicator 7.8: Proportion of the population using an improved drinking water source ............... 25 Indicator 7.9: Proportion of population using an improved sanitation facility ............................ 28 Indicator 7.10 - By 2020, to have achieved a significant improvement in the lives of at least 100 million slum dwellers ..................................................................................................................... 31
II. Cross-cutting issues ........................................................................................................................... 33 III. Conclusions and recommendations ................................................................................................. 37 REFERENCES .......................................................................................................................................... 39
2
18 March 2010
Introduction Environmental sustainability is a key pillar of sustainable development and an integral component for the achievement of all other Millennium Development Goals. While the term “environmental sustainability” that is at the heart of MDG 7 is not explicitly defined in the Millennium Declaration, countries concur that “we must spare no effort to free all humanity, and above all, our children and grandchildren from the threat of living on a planet irredeemably spoilt by human activities, and whose resources would no longer be sufficient for their needs“. World leaders identify “respect for nature” as a fundamental value required in the 21st century and call for a new ethic of conservation and stewardship. They also reaffirm support for the principles of sustainable development, including those articulated in Agenda 21. Under MDG 7, four global targets and ten global indicators (Table 1) provide a basis for monitoring progress towards environmental sustainability. Global progress towards MDG 7 rests essentially on making progress on the ground, at the country level with concerted action and support from the regional and global levels. The targets and indicators, however, do not prescribe a specific path to environmental sustainability. It is, therefore, important to adapt these targets and indicators to national circumstances and conditions, including by supplementing them with indicators for other elements of environmental sustainability that may be of particular importance to countries. There is growing acceptance that the fulfilment of human rights and the achievement of gender equality require environmental sustainability, and vice versa
Table 1 Goal 7: Ensure environmental sustainability Target 7.A: Integrate the principles of sustainable development into country policies and programmes and reverse the loss of environmental resources Target 7.B: Reduce biodiversity loss, achieving, by 2010, a significant reduction in the rate of loss Target 7.C: Halve, by 2015, the proportion of people without sustainable access to safe drinking water and basic sanitation
7.1 7.2 7.3 7.4 7.5 7.6 7.7
Proportion of land area covered by forest CO2 emissions, total, per capita and per $1 GDP (PPP) Consumption of ozone-depleting substances Proportion of fish stocks within safe biological limits Proportion of total water resources used Proportion of terrestrial and marine areas protected Proportion of species threatened with extinction
7.8 Proportion of population using an improved drinking water source
7.9 Proportion of population using an improved sanitation facility Target 7.D: By 2020, to have achieved a significant improvement 7.10 Proportion of urban population living in slumsi in the lives of at least 100 million slum dwellers
This report looks at MDG 7 targets holistically given that they are mutually interdependent and the achievement of one has a bearing on the success of the others. It is for this reason that the report does not differentiate the targets, but rather looks at the ten indicators in terms of an analysis of the current situation, factors underpinning success, critical gaps and lessons learned.
3
18 March 2010
I. Overall Assessment of Progress on MDG 7 The overall progress to meet MDG 7 targets and objectives is mixed, and overall, not on track.1 While progress in some of the indicators has been significant, others are critically lagging behind. We are still far from achieving environmental sustainability and considerable efforts will be needed to step-up the pace to achieve MDG 7 objectives by 2015. Nothing short of a paradigm shift will be needed: one that entails lower carbon intensity development paths, greener growth,2 and more sustainable consumption and production patterns. This report highlights case studies and factors underpinning success to provide insights and examples of how the paradigm shift can be brought about in practical ways. The conclusions point to factors contributing to success for the indicators that are on track that could be replicated for the others. Progress globally has been made towards the achievement of the MDG 7 targets with regard to certain issues covered by official MDG indicators, namely on the phasing out of ozone-depleting substances (ODS), on increasing the proportion of people with access to safe drinking water and on increasing the proportion of terrestrial and marine protected areas. The Montreal Protocol has resulted in the phasing out the production and consumption of over 98% of all controlled ozonedepleting substances (ODS). Current trends suggest that more than 90% of the global population will use improved drinking water resources by 20153. As of 2008, 73 countries have protected 10% or more of their national surface area, with 18 nations reaching protected area coverage of 25% or more. The goal of improving the lives of a least 100 million slum dwellers has been met in full. However, during the same period more than 200 million new slum dwellers have been added to the urban population. Indeed, the original target has proven to be less ambitious than necessary to reverse the trend of an increasing number of slum dwellers, driven by a number of factors including, and rising poverty rates as a result of the recent food, fuel and financial crises as well as disasters triggered by natural hazards. This shortcoming has been recognized by the world leaders and was reflected in the 2005 World Summit outcome document, which called for the prioritization of slum prevention and slum upgrading.4 The world is not on track to meet the MDG target for sanitation.5 Between 1990 and 2006 the proportion of people without improved sanitation decreased by only 7 percentage points.6 Without an immediate acceleration of progress, the world will not achieve even half of the sanitation target by 2015. Based on current trends, the total population without improved sanitation in 2015 will have increased from 2.4 to 2.6 billion. With respect to CO2 emissions, the rate of growth of CO2 – equivalent emissions was much higher during the period of 1995-2004 than during the pervious period of 1970-1994, and the global trend has not changed so far.7 The IPCC reported that eleven of the last twelve years (1995-2006) rank among the twelve warmest years of recorded global surface temperature (since 1850).8 1
It needs to be acknowledged that a constraint in assessing the state of environmental sustainability is lack of readily available statistical information for all indicators. 2 Green growth is growth in GDP that maintains or restores environmental quality and ecological integrity, meeting the needs of all people with the lowest possible environmental impact. The approach develops and capitalizes on synergies between economic growth, social development and environmental protection; and promotes business opportunities which lead to environmental protection and investing in natural capital to increase environmental carrying capacity. 3 Water in a Changing World, the UN World Water Development Report 3 4 General Assembly resolution A/RES/60/1 paragraph 56(m). 5 Idem 6 Idem 7 IPCC Climate Change Synthesis Report 2007 8 Idem
4
18 March 2010
Regarding the proportion of land area covered by forest, while the rate of net loss of forest area has fallen since the 1999-2000 period at the global level, some 13 million hectares of the world’s forests are still being deforested each year.9 Primary forests – forests with no visible signs of past or present human activities, and which include some of the most biologically diverse ecosystems on the planet – are being lost or modified at a rate of 6 million hectares a year.10 The target to reduce the rate of biodiversity loss by 2010 has not been met.11 In the latest reports submitted to the Convention on Biological Diversity (CBD), many governments admit that the target will be missed at the national level. Globally, a suite of indicators covering threats, status and response used by the CBD support this conclusion.12 The indicators included under MDG7, which are a subset of this wider indicator pool, reveal that, while efforts to increase levels of protection have achieved some success, overall biodiversity is still declining and species are increasingly threatened. Nearly 17,000 plant and animal species are known to be threatened with extinction.13 Major threats and drivers of biodiversity loss, such as including over-consumption, habitat loss, invasive species, pollution and climate change, are not yet being effectively tackled. Biodiversity is vitally important for human wellbeing because it underpins a wide range of ecosystem services on which human life relies. Loss of biodiversity and degrading ecosystems affect supplies of food, fuel and other materials, including traditional medicines and genetic resources that could be the basis for future drugs. It also reduces resilience and the regulating role that ecosystems play, leading to disease outbreaks and a loss of adaptability to climate change. Billions of people, including many of the poorest, rely directly on biodiversity for their livelihoods and wellbeing, and losing biodiversity will hamper efforts to meet other MDGs especially with regard to poverty, hunger and health, and will increase vulnerability and reduce the options for the poor. While there are some conservation successes, there is a long path towards reversing the trend and the proportion of species at risk is expected to rise as the planet warms. The effects of climate change as well as the consequences of the global economic and financial crisis are expected to have a negative impact on the achievement of many of the environmental sustainability indicators. Although there are some positive signs that the international community is willing to tackle these issues seriously, efforts so far fail to demonstrate the scale of political will that is necessary.
Indicator 7.1: Proportion of land and area covered by forest Analysis of Successful Strategies and Measures Progress towards a reduction of the current rate of forest loss has focused on the implementation of the concept of sustainable forest management - a dynamic and evolving concept that aims to maintain and enhance the economic, social and environmental value of all types of forests, for the benefit of present and future generations. 14
9
FAO, Global Forest Resources Assessment (FRA), 2005 Idem 11 Gilbert, 2009, Nature 462, 263. 12 Walpole et al., 2009, Science 325, 1503-4. 13 IUCN, Wildlife in a Changing World, 2009: A report based on the analysis of the 44, 838 species on the IUCN Red List. 14 UN Resolution 62/98, establishing the Non-Legally binding instrument on all types of forests: See: http://www.daff.gov.au/__data/assets/pdf_file/0018/1141092/non-legally-binding-instrument.pdf 10
5
18 March 2010
Successful strategies and measures include sound forest management practices for production, conservation, protection or other purposes; the designation of forests as protected areas; multipurpose management of forests – often involving local communities; improvements to the legal, policy and institutional framework for forests and forestry; forest law enforcement and governance; combating illegal logging; forest certification; tree planting; and, restoration of degraded forest landscapes. Since the main cause of deforestation is conversion of forests to agricultural use, the most successful strategies are those which take an integrated approach, involving all relevant sectors and stakeholders. Other factors contributing to success include: the establishment of a high-level coordination mechanism among the different ministries and public institutions involved; a freeze on public credit to companies charged with illegal deforestation practices; strengthening of monitoring capabilities by government authorities and local communities; the implementation of a new regime for the management of public forest areas; ; acting on perverse incentives (such as subsidies on water and fertilizers) that foster land clearing; and the confiscation of the products (including cattle) of activities undertaken in illegally deforested land.15 The private sector has also made an impact through voluntary bans on beef, soy beans and palm oil coming from recently deforested areas in Latin America and in Southeast Asia. In some Asian countries decentralisation and credit and alternative livelihood opportunities are credited with a decrease in forest loss. Joint Forest Management, Community-based Forest Management and Forest User Groups are examples of successful initiatives in South and Southeast Asia.
increasing clarity of tenure combined with access to Country Case Study on Payment of Ecosystem Services (PES) to reduce the deforestation rate: Costa Rica One of the most well-known schemes is the Costa Rican national PES scheme (Pagos por Servicios Ambientales or PSA). In this scheme, the implementing agency, FONAFIFO, bundles funding from various sources. While most funds are drawn from the Costa Rican public through a national fuel tax, other sources include international donors and some private firms, e.g. ones interested in improving or maintaining high water quality as an input to production. Payments are made by FONAFIFO to land owners in return for the latter adopting specific land-use practices. Forest conservation accounts for more than 90% of current payments: the scheme helps avoid deforestation and forest degradation. The remaining 10% of current payments are made for the establishment of timber plantations, renovation of natural forests through land retirement and agro-forestry. The programme explicitly recognizes four categories of environmental services: carbon mitigation, biodiversity conservation, hydrological services, and scenic beauty. Poverty alleviation is a further objective of the programme. By end-2004, 230,000 ha were under contract in the Costa Rican PSA programme. The number of applications far exceeded the available budget, with more than 800,000 ha of applications pending at the same time. Source: UNDP
Payment for the environmental services of an ecosystem can provide the economic incentives for populations whose livelihoods depend on forests, to protect them instead of harvesting them unsustainably. Costa Rica and other Latin American countries have been successful in reducing the rate of deforestation by paying local populations for conservation, per hectare, of forestcovered land. Examples of economic incentives of this kind include revenues from afforestation and reforestation projects, biological and genetic research, and from government subsidies. International support for use of such incentives-based methods to reduce deforestation, including through a global fund, was one of the rare points of agreement at the Copenhagen UN Framework Convention on Climate Change (UNFCCC) 15th Conference of the Parties (COP15) meeting in December 2009.
15
United Nations (2010/forthcoming), “Millennium Development Goals: Advances in the Sustainability of Development in Latin America and the Caribbean”
6
18 March 2010
From 1990 to 2005, the proportion of the global land area covered by forest fell from 31.3 to 30.3 percent – a drop of 3 percent over a 15 year period.16 The largest decreases took place in South-eastern Asia where the proportion of land area covered by forests fell by from 56.3% to 46.8% (a drop of 16.9%), in sub-Saharan Africa, down from 29.2% to 26.5% (a drop of 9.25) and in South America, where it fell from 49.9% to 46% (a drop of 7.8%). Oceania also suffered a diminution of its forest area. Thanks to afforestation efforts in China in particular, East Asia has recorded a significant increase in the proportion of the land area covered by forests. Smaller increases are noted in Northern Africa, Western Asia and Southern Asia, while it has remained fairly stable in the CIS. The Asia Pacific region as a whole lost around 10 million hectares of forest between 1990 and 2005 or 1.1% of its forest area over 15 years. Although, some of the region’s economic growth has been at the cost of rapid deforestation,17 extensive tree planting initiatives in China, India and Vietnam have contributed to reduction in net loss of forest area. Four African countries increased forest areas by more than 25%, while two have kept the percentage of total area covered by forest at a high 85 per cent.18 In this region there are also promising efforts of tree planting including the Green Wall initiative. In Europe, forests are spreading unto abandoned agricultural land, some of which has been set aside as marginal agricultural land under incentive schemes. A reduction in the price for certain agricultural products has led to a similar increase in forest area in some Caribbean countries. For example, Cuba started a national programme to boost the nation’s forest cover, and tourism has largely replaced agriculture as a main source of income in many Caribbean Countries.19 Forest plantations generate certain ecosystem services such as CO2 capture, but cannot replace ecological and biodiversity functions of natural forests. Despite afforestation initiatives and the natural expansion 16
The statistics in this section are based on FAO 2006 and follow the regional breakdowns of the MDG Reports. Report of the Secretary-General, Regional cooperation in the economic, social and related fields, 23 May 2008, E/2008/15 18 Pp. 17, ECA Report on Assessing Progress in Africa towards the Millennium Development Goals Report 2008, E/ECA/COE/27/10. 19 See ECLAC, MDG 7 report 2009 17
7
18 March 2010
of forests in some countries, natural forests have continued to suffer from the pressure resulting from the high prices of certain commodities on world markets that has led to the expansion of agriculture, mining and other activities to the detriment of forest cover. Factors underpinning successful strategies and measures Political will, good governance and adequate financial and human resources are key to maintain and extend the proportion of land area covered by forests. There is currently an unprecedented high level of awareness, political will, and funds to reduce the level of deforestation and forest degradation and to increase the area of forests. The recent focus on climate change has increased awareness of role forests can play in climate mitigation and adaptation. COP15 of the UNFCCC has led to an agreement on efforts towards a mechanism to reward developing countries for a reduction in emissions from deforestation and forest degradation (REDD). Countries have also recently agreed to a “non-legally binding instrument on all types of forests” with four Global Objectives on forests, the first of which focuses on reversing the loss of forest cover worldwide through sustainable forest management, including protection, restoration, afforestation and reforestation, and increase efforts to prevent forest degradation. Some countries have established specific national goals for increases in forest area or decreases in rates of deforestation including China (for an increase in forest area by 40 million ha between 2005 and 2020); India (for 33% forest cover by 2012); Vietnam (for 43% forest cover by 2010); and Brazil (for a reduction of the rate of deforestation in the Amazon by 80% by 2020). In Africa there are also promising efforts of tree planting including the Green Wall initiative. Critical Gaps Few countries have adequate systems in place to monitor their forest resources and threats to these. Developing countries lack both human and financial resources to manage their forests in a sustainable manner. Lack of cross-sectoral collaboration and integrated land use planning are critical gaps given that the main direct cause of deforestation is conversion to agriculture (more recently also for bio-fuels), often facilitated through better access (new roads, forest concessions). Underlying factors including poverty, food and fuel insecurity, lack of alternative livelihoods and gender inequality which further hinders economic alternatives for women who are often managers of household resources, further exacerbate the situation. Economic activities such as illegal logging, cultivation of agricultural crops, livestock grazing and mining that lead to deforestation are often more lucrative than preserving the forest. This applies both at the household scale, for people suffering from poverty and lack of alternatives for subsistence, and at large commercial scale. Summary of key lessons and future measures for accelerated progress A key lesson learned is that deforestation is a complex process. Its direct and underlying causes vary over time and space. In Latin America, the main cause is large-scale conversion to agriculture, as well as livestock rearing and forestry activities, resulting from growing global demand for food, fuels and wood products.20 In Africa it is primarily caused by intensified shifting cultivation and small-scale conversion to permanent agriculture. In Asia, the picture is more mixed with both small and largescale conversions. As a result, strategies to reduce the rate of deforestation need to take both macro-economic drivers and local circumstances into account. In addition, most causes originate outside the forestry sector and therefore this sector alone cannot solve the problem. An integrated cross-sectoral approach is needed.
20
Pp. 89, ECLAC, MDG 7 Report 2009
8
18 March 2010
Indicator 7.2: CO2 emissions, total, per capita and per $ 1 GDP Analysis of Successful Strategies and Measures Carbon dioxide emissions from human activities are a major contributor to climate change, the defining challenge of our time.21 Developed countries continue to emit by far the most on a per capita basis, and therefore should take the lead in combating climate change, in line with the UNFCCC and its principles. However, there are many policy areas in which developing countries can contribute significantly to combating The ESCAP Green Growth Initiative – towards a low-carbon climate change by pursuing national development path: sustainable development goals, ESCAP is launching an initiative on sustainable energy security particularly in the area of energy given which includes promotion of a low-carbon development path in that energy production and the region. The focus of this initiative is to facilitate developing consumption is responsible for 80% of countries to identify and adopt a set of development strategies for the energy sector that could enhance energy security, climate the global CO2 emissions. In this regard, change actions and poverty reduction. Such strategies should it is important that energy access, enable countries to decouple economic growth and environmental energy efficiency, and renewable energy degradation and pursue a path of sustainable and inclusive are integrated into the national energy development. Those strategies will include widening access to plans and sustainable development energy services for all, particularly the poor through renewable strategies to have an integrated policy energy or promoting energy efficiency at all levels of society. approach and to ensure the involvement and commitment of governmental and non-governmental stakeholders. The provision of reliable and affordable supply of energy and its efficient use is at the core of global environmental and developmental challenges. Efforts to decouple economic growth and environmental impact are of utmost relevance to addressing the challenges posed by climate change. Changing the paradigm of growth from one of “increasing the quantity of growth” to “improving the quality of growth” is critical to addressing both developmental and environmental dimensions. In these efforts a Promoting Energy Efficiency in the ECE region: Energy Efficiency 21: focus on enabling the vulnerable to overcome poverty through The ECE manages a project for Financing Energy Efficiency Investments decent employment, better for Climate Change Mitigation, with a budget of approximately US $7.5 million, financed by the UN Foundation, UNEP/GEF, Fonds Française housing and education among pour l’Environnemment Mondial (FFEM) and the European Business other measures will support a Congress. The project aims to assist Eastern European countries to green growth approach. enhance their energy efficiency and access to renewable sources of energy. It supports the creation of a dedicated investment fund and will
Promoting energy efficiency, provide a pipeline of new and existing projects to dedicated publicprivate investment funds that can provide up to $250 million of expanding access to modern mezzanine and/or equity financing to project sponsors. The fund, which energy services for the poor and will benefit from both public and private sources, will target energy switching to renewable sources of efficiency and renewable investment projects in 12 countries in Central energy are among the most Asia and Eastern and South-Eastern Europe. effective means of advancing the MDGs and addressing climate change challenges simultaneously. In line with this, the sustainable energy projects of the Economic Commission for Europe aim to facilitate the transition to a more sustainable and secure energy future by optimizing operating efficiencies and conservation, including through energy restructuring and legal regulatory or energy pricing reforms.
21
While CO2 is the main cause of climate change, other GHG gasses are also part of the equation, including methane (CH4) generated by agriculture, waste and industrial processes among others; and Nitrous Oxide (N2O) caused by agriculture as well as by industrial processes, deforestation, waste water and waste incineration.
9
18 March 2010
Climate change presents an opportunity to help create a new development paradigm that links policy setting with investments, and investments with sustainable development in its three pillars of society, economy and environment; as well as an opportunity for development practitioners, donors, stakeholders, communities and policy –makers in developed and developing countries to ‘do development differently’. While in certain situations stand-alone responses to climate change will be needed (for example, to partially drain a potentially dangerous glacial lake, or replace a coal-burning power station with a cleaner option),–in most other cases climate change response initiatives are best implemented as part of a broader suite of measures within existing development processes and decision cycles including policies in labour, education, health and gender, among others. This is known as mainstreaming climate change. For example, actions to address climate change can be integrated into the foundations of plans to reach the MDGs and other national and sectoral development goals. Active labour policies to promote the creation of green jobs are also a good example of such integration. While mainstreaming climate change considerations often occurs in the context of preparing national and sectoral development policies and plans, it can also take place locally, such as in development planning at community level and in infrastructure and other development projects. Encouraging the creation of enabling policy environments in all relevant institutions (ranging from employment to education, and from agriculture to construction)through capacity building and market transformation for energy-efficient appliances, and the widespread adoption of energyefficient technologies in industry (including low emission and sustainable forms of transportation and building sectors) have proven particularly effective. This transformation should pursue the engagement of micro, small and medium sized enterprises which often suffer from lack of information about new and existing technologies and access to finance and therefore are forced to not be part of the new development paradigm. Factors Underpinning successful strategies and measures In many developing countries, the contribution of CO2 emissions is derived mainly from emissions of land use, land use change, and forestry. Positive economic incentives, in the form of payments to forest dwellers to preserve the forests, such as government cash transfers, have proven to be effective in reducing deforestation rates. The Copenhagen Accord, which emerged from Copenhagen COP15 but was not adopted by all parties, refers to short- and long-term financing as well as economic incentives for avoided deforestation (REDD mechanism). REDD can contribute significantly to decreasing the rates of deforestation in developing countries. Further effort will be needed to bridge the financing gap in order for developing countries to lower their emissions as well as to ensure that socio-economic and gender inequality do not prevent equitable input to these mechanisms nor limit access to their benefits by the full spectrum of forest users. Of particular importance to reduce greenhouse gas emissions is the support to the development of local capacity for the reduction of CO2 emissions. Technology networks and centers which support interventions at regional and national levels provide a sound foundation for such efforts. Engagement of stakeholders at all levels has been proven to be essential: access to information and involvement in the decision-making and implementation process lead to better informed, more efficient and inclusive decision. An example includes the joint UNIDO - UNEP National Cleaner Production Centers which currently cover activities in over 40 developing and transition countries to assist businesses with the assessment and introduction of cleaner technologies. This programme is being extended to resource-efficient and cleaner production with a specific focus on the enhancement of national
10
18 March 2010
capacities to facilitate and manage the transfer, adaptation and replication of Environmentally Sound Technologies (ESTs) and sustainable product development. Other examples include Centers for South-South Cooperation to create and strengthen the technical and business capacities of developing countries or specific technology centers to promote the development, transfer and use of innovative low-carbon technologies. Another key aspect in ensuring successful climate change policy measures is to embed national projects into larger programmes and regional strategies. A good example is the GEF strategic programme on energy for the countries of West Africa, which has been developed by UNIDO in partnership with GEF and other UN agencies. Critical Gaps In order to assist developing countries to develop in a sustainable and climate resilient manner, it is essential to establish enabling environments conducive to a shift towards a low-carbon society and to support the development of green markets. A range of measures need to be combined, including policy support, capacity-building, innovative financing mechanisms, facilitation of technology transfer, and demonstration projects. . These measures will be beneficial for the country in environmental, social and economic terms A successful combination has proven to be the promotion of cleaner and more efficient use of energy with productive activities, particularly in rural areas. Renewable energy feed-in tariffs (FITs) have proven to be effective in accelerating the deployment of renewable energy technologies. Adopting measures and strategies to strengthen local capacity is of crucial importance to all technology related activities aiming at reducing emissions and increasing resource and energy efficiency. A number of initiatives to promote energy efficiency merely focus on specific technologies and components, and overlook the broader picture. Especially in industry, energy use is strongly affected by operational practices and needs trained personnel with knowledge of the environmental implications of energy use, therefore active labour policies are needed in this regard.22 The application of energy efficient technologies, while important, provides no assurance that energy savings will be attained, without a system-wide approach that is properly designed or implemented. It is therefore essential to find the right balance between technical support and local capacity building for sound management of energy resources to ensure the sustainability of energy programmes in developing countries. Furthermore, it is critical to link project activities with income generating activities to enable the stakeholders to pay for the provided services and the associated operating costs. Finally, better emissions projections systems are necessary for mitigation planning, covering each aspect of the emissions formula (a function of population, affluence and technology). Emissions projections need to take into account more disaggregated population composition and structure, and be conducted at more local levels, including provinces and cities. Summary of key lessons and future measures for accelerated progress Successful energy programmes have to go beyond the currently prevailing technology demonstration approach, and aim at an integrated and system wide strategy linking energy with productive uses and optimizing efficient use of energy. For instance, energy management standards help generate effective policy tools as well as market-based mechanisms to improve energy efficiency. They offer a suitable framework for governments, as well as workers and enterprises to develop energy efficiency goals, plan interventions, prioritize efficiency measures and investments, monitor and document results and ensure continuity and constant improvement of energy 22
The same is valid in other relevant areas such as agriculture, forestry, construction, transport, industry.
11
18 March 2010
performance. At the same time, they address issues of cost reduction, increased productivity, environmental compliance and global competitiveness. Enhancing local productive capacities and increasing competitiveness of micro, small and medium enterprises (SMEs) through rural mini-grids based on renewable energy is a successful approach to supporting the development of low-carbon growth, and tackling the climate change and development challenges simultaneously. Replacing diesel powered electricity generation with renewable energy sources in remote rural areas reduces the target community’s dependence on conventional fossil fuels. Combining sustainable energy services with productive activities enables the stakeholders to profit from access to these services while at the same time ensuring the project’s sustainability. This approach can also advance additional MDGs such as improved health, gender equality and education attendance via co-benefits. It is recognized that the implementation of strategies has to take place in an inclusive, participatory manner involving the local governments and population to strengthen the ownership and capacity to manage resulting projects, which consequently increases their sustainability and the possibility of replicating them. To strengthen the linkages between climate change and development, a future global energy roadmap will need to rely on the development and implementation of concrete measures based on: (i) universal access to clean, modern and affordable energy, and (ii) scaling up the implementation of energy efficiency measures in both the demand (i.e. end-use) and supply of energy services, and (iii) actions by governments and businesses focused on prioritizing cost-effective emission reduction opportunities. The world of 2050 will look very different. A new industrial revolution is required to end carbondependency and launch economies on a path to clean and stable development. Greater international cooperation supported by new and additional financial resources and based on public and private partnership is required to make sure that this transition is truly global and inclusive.
Indicator 7.3: Consumption of ozone-depleting substances Analysis of Successful Strategies and Measures On September 2009, the Montreal Protocol on Substances that Deplete the Ozone Layer became the first international treaty of any kind to obtain the ratification of all 196 States. This treaty is a prime example of the application of sustainable development principles to national policies and programmes to reverse the loss of environmental resources. The treaty has, through its 21 year history, enabled its Parties to achieve specified goals for the reduction of ozone depleting chemicals, often, well ahead of mandated schedules. To date, the Parties to the Protocol have achieved reductions amounting to over 98% of the historic usage of controlled ozone depleting substances, and as a consequence, have prevented tens of millions of cases of cataracts and cancers. In addition, because many ozone depleting substances are also global warming chemicals, the reductions achieved under the Protocol have contributed significantly to the global effort to address climate change. The Montreal Protocol has an unmatched record of mitigating climate change and protecting the ozone layer while supporting developing countries in meeting their obligations under the treaty. From 1990 to 2010, the Montreal Protocol will have reduced ODS emissions by a net of 135 Gt CO2-equivalent, delaying climate forcing by up to 12 years and setting the ozone layer on the road to recovery by mid-century.23 23
See Guus J.M. Velders, et al., The importance of the Montreal Protocol in protecting climate, 104 PROC. NAT’L. ACAD. SCI. 4814 (2007) [hereinafter Velders et al. 2007]. In 2007, the Parties to the Montreal Protocol accelerated the phase-out of HCFCs which has the potential to reduce ODS emissions by a further 12-15 Gt CO2-eq. by 2040. See Velders et al., The large
12
18 March 2010
When all reporting and reduction mandates are taken into account, Montreal Protocol parties have achieved a compliance rate of over 98%, and when non-compliance is reported, the Protocol has worked with parties to take the measures needed to bring about quick compliance. The Montreal Protocol established an initial framework which evolved over time to enable it to meet the needs of both its Parties and the global environment. Among the key strategies that allowed the Protocol to make quick progress included: •
• • • • • •
•
• •
Application of the precautionary approach24 and the principle of “common but differentiated responsibilities.”25 The latter calls on all States to cooperate in a spirit of global partnership towards a common goal, with developed countries having different responsibilities from developing countries; Trade provisions that prohibited the export of ozone depleting substances to non-parties to the Protocol provided a significant incentive for the universal participation in the Protocol; Flexibility in measures taken by countries to achieve their reduction goals (e.g. regulatory vs. economic instruments); Provision for review and amendment of the Protocol based on the availability of new technical and scientific information; Establishment of a Multilateral Fund to enable developing countries to comply with the reduction commitments of the Protocol;26 Partnership with the GEF to bring technical and financial assistance to countries with economies in transition to facilitate their compliance; The creation of national ozone units in over 135 developing countries to enable the development and implementation of effective regulations, policies and projects to reduce and eliminate the production and import of ozone depleting substances; Exemption of certain uses from the phase-out for a limited time if their use was critical for health, safety or the functioning of society, and there were not yet alternatives that were available to the users; Agreement for each government to establish a system for licensing the import and export of ozone depleting substances in order to better control trade in those substances; The requirement for each Party to take all practical steps to ensure best available, environmentally safe substitutes and related technologies are transferred to developing countries under fair and favourable conditions.
Factors Underpinning successful strategies and measures • Trade provisions in the Montreal Protocol made the agreement self-enforcing. The cost of noncompliance was certain to the participating countries, providing a credible threat. • Agreement to initial goals that were reachable, and the related early development of a culture of success – which has bred both the desire and expectation of achieving additional success contribution of projected HFC emissions to future climate forcing, PROC. NAT’L. ACAD. SCI. Early Edition (22 June 2009) [hereinafter Velders et al. 2009] at 2, http://www.pnas.org/content/early/2009/06/19/0902817106. 24 Principle 15 of Agenda 21: “In order to protect the environment, the precautionary approach shall be widely applied by States according to their capabilities. Where there are threats of serious or irreversible damage, lack of full scientific certainty shall not be used as a reason for postponing cost-effective measures to prevent environmental degradation.” 25 Principle 7 of Agenda 21: “States shall cooperate in a spirit of global partnership to conserve, protect and restore health and integrity of the Earth’s ecosystems. In view of the different contributions to global environmental degradation, States have common but differentiated responsibilities. The developed countries acknowledge the responsibility that they bear in the international pursuit of sustainable development in view of the pressures their societies place on the global environment and of the technologies and financial resources they command.” 26 The Multilateral Fund is run by an Executive Committee made up of an equal number of donor and recipient countries. It has funnelled over US$ 2 billion for implementation of over 3000 projects and activities in over 130 developing countries.
13
18 March 2010
• •
Agreement to bring industry, academia and government together as partners , an action that enabled the effective contribution of each toward a common goal A detailed analysis of and agreement on the level of funding necessary to enable compliance by developing countries and an agreement by donors to provide related funding through a body with equal developed and developing country representation and authority.
Critical Gaps Gaps in knowledge on the market availability, technical knowledge and capabilities of alternatives; cost and maturity of alternatives to ODS, as well as the exact scientific implications of action versus inaction have always been present in the Protocol. Experts in the Protocol's Assessment Panels have worked hard to reduce these gaps, and residual gaps have generally been overcome through the recognition that the likely environmental consequences would be dire if countries waited for scientific certainty instead of acting based on existing knowledge. In fact, the predicted environmental implications have been proven over time and the consequences for inaction could have been catastrophic for both human health and the global environment.27 Summary of key lessons and future measures for accelerated progress Early action, leadership and vision are critical success factors, especially in a new undertaking, and this was key to the success of the Montreal Protocol. Forging of partnerships and synergies; and, identification and involvement of all stakeholders to develop those partnerships were equally critical. Awareness-raising was also important to galvanize action by the relevant stakeholders. The importance of technology innovation and technology transfer cannot be overstated. Promoting the development and use of alternatives played a key role in allowing transition from harmful products to environmentally safer products. Capacity building was another key factor especially in enabling developing countries to manage their own programmes and transition process. Sufficient and sustainable funding through the Multilateral Fund- a compliance oriented modeldelivered to countries via its bilateral and implementing agencies, was important. And flexibility enabled adjustment of the Protocol (to accelerate the phase-out of HCFCs), bringing additional benefits to mitigate climate change, as ODS are potent green house gasses.
Indicator 7.4: Proportion of fish stocks within safe biological limits Analysis of Successful Strategies and Measures The world’s production of food fish reached about 110 million tonnes in 2006,28 providing an apparent per capita supply of 16.7 Kg (live weight equivalent). For more than 2.9 billion people, fish counts for at least 15% of their animal protein intake. In 2006, an estimated 44 million people worked directly as fishers and fish farmers, the vast majority in developing countries and most in Asia, with China alone accounting for 12 million. Over 200 million people in developing countries depend, directly or indirectly, on fisheries for their livelihoods and about 520 million people or 8% of the world’s population depend on fisheries for their well-being.29
27
Principle 15 of Agenda 21 states that: “In order to protect the environment, the precautionary approach shall be widely applied by States according to their capabilities. Where there are threats of serious or irreversible damage, lack of full scientific certainty shall not be used as a reason for postponing cost-effective measures to prevent environmental degradation.” 28 FAO, 2009 29 FAO, 2009
14
18 March 2010
Despite the important role fisheries play in the provision of food and the livelihoods of millions of people around the world, the state of world fisheries is not satisfactory with still a high proportion of fish stocks being overexploited or depleted. Reported landings from capture fisheries have been relatively stable, fluctuating between 90 and 95 million tonnes per year over the last decade with a slight decrease if China is excluded,30 and with very limited prospects of long term increases. Among the 584 fish stocks and species FAO has reviewed, 52% were fully exploited and, therefore, producing catches at or close to their maximum sustainable limits, with no room for further expansion. Another 28% were either overexploited or depleted or recovering from depletion and thus yielding less than their maximum potential owing to excess fishing pressure. Only about 20% were underexploited or moderately exploited with a probability of producing more.31 Fisheries are complex social-ecological systems, driven by food demand and social and economic incentives, but dependent on and limited by the productivity of marine ecosystems. A range of diverse strategies and measures have been developed for and applied to fisheries of different characteristics and management objectives. For example, successful examples of individually allocated transferable annual catch quotas (ITQs) can be found in Australia, New Zealand, Iceland, Canada and Namibia;32 community-based management has succeeded in some small scale fisheries;33 the West Coast fisheries of the United States, managed by quota controls with fishing rights assigned to fishing companies have had 4 of the 9 over-fished stocks recovered;34 and clear policy in Australia such as the 2005 Ministerial Direction and the Harvest Strategy Policy has helped to reduce the number of stocks classified as over-fished from 17 in 2005 to 13 in 2008 and increase the number of stocks that are not subject to over-fishing from 15 in 2005 to 57 in 2008.35 Because of the complexity of fisheries, the strategies and measures applied in these successful cases are not a universal solution. The most successful management approaches are likely to combine rights-based systems, creating incentives for fishers to operate efficiently and with long-term sustainability in mind, with participatory approaches and an effective legal structure that requires the development of pre-agreed harvest strategies and decision rules that are triggered and adhered to as reference points are passed.36 One example of a positive incentive is the application of ecolabelling schemes for marine capture fisheries which, through market measures could contribute to reduce adverse ecosystem effects of fishing and damage to habitat, while ensuring that such schemes do not become barriers to trade for developing countries.37 Factors underpinning successful strategies and measures Some determining factors underpinning successful strategies and measures on fish stocks within safe biological limits include: �
Good governance. Fisheries governance is the sum of the legal, social, economic and political arrangements used to manage fisheries. It has international, national and local dimensions and includes legally binding rules as well as customary social arrangements.38 Successful fisheries management systems enjoy governance that is effective and creates an enabling environment for management planning and implementation of regulatory measures.
30
Idem Idem 32 Beddington et al. 2007 33 Cunningham and Bostock, 2005 34 Rosenberg et al. 2006 35 Wilson et al. 2008. 36 Beddington et al. 2007 37 FAO, 2005. Guidelines for the Ecolabelling of Fish and Fishery Products from Marine Capture Fisheries. FAO, Rome: 90p. 38 FAO, 2001 31
15
18 March 2010
�
�
Appropriate incentives. Incentives reduce cost, increase product quality and allow better information to improve fishery management. The most important incentive is dedicated access.39 True territorial tenure has been re-established in the Pacific40 and quite successful in Chilean artisanal fisheries.41 Participation of stakeholders. Engaging all stakeholders in the process of policy formulation, management planning and implementation is widely recognised as a key to success in fisheries management. It brings to the fore stakeholders’ different perspectives, which represent diverse uses, values and concerns. Stakeholder participation, with the aim to ensure equitable opportunity for participation by women and men in communities, provides a fuller picture of a situation and its management options; and can lead to collaborative decision-making processes, producing management decisions which rely on the support and acceptance of many different actors who base their decisions on adequate information for decision-making.
Critical Gaps • There is no systematic collection of data and statistics as yet to reflect indicator 7.4 properly. Research on the level of exploitation of fisheries can only provide an approximate view of the situation. Adequate statistics are crucial for informed policymaking. • Poorly defined objectives in fisheries management leading to ad hoc decisions often based on immediate and/or local problems; • Inadequate capacity in many national management administrations, including inadequate knowledge of fisheries science and skills in stock assessment and design of harvest strategies and management planning; • Lack of understanding of the impact of fishing activities on target and non-target resources and the whole ecosystem; • Misuse of economic subsidies that foster overcapacity and overexploitation of fish stocks, which is estimated to be over tens of billion of US dollars per year.42 • Prevalence of illegal, unreported and unregulated fishing. A recent example is in the eastern Baltic cod fishery where illegal fishing contributes 35-40% more to the reported true catches.43
Summary of key lessons and future measures for accelerated progress Despite serious attempts to improve management and to facilitate recovery of depleted stocks, success has been limited. For successful management, a dual approach is required: one in which authorities provide incentives for conservation based on fishers’ rights and which is supported by strong management incorporating legally enforced and tested harvest strategies. Overcapacity is a global issue, caused by open access (or weak controlled access) to the resource and is often exacerbated by national subsidies to fishing fleets, and is widely recognized as a major problem affecting world fisheries. With its attendant social and economic problems, overcapacity can, via the political process, lead to the erosion of management control. Immediate effort should be made to reduce or remove overcapacity. Finally, integrated policy and management in accordance with an ecosystem approach should be advocated to address all dimensions of sustainability and the interactions among factors of un-sustainability holistically.
39
Hilborn 2007 Johannes 2002 41 Castilla et al. 1998 42 World Bank and FAO 2008 43 ICES 2006 40
16
18 March 2010
Indicator 7.5: Proportion of total water resources used Analysis of Successful Strategies and Measures While the Millennium Declaration called for “sustainable water management strategies at the regional, national and local levels which promote both equitable access and adequate supplies,” other inter-governmental decisions, such as the outcome of the World Summit on Sustainable Development (WSSD, Johannesburg 2002), recognized integrated water resources management (IWRM) as the approach to follow. The integrated water resource management approach has now been accepted internationally as the way forward for efficient, equitable and sustainable development and management of the world’s limited water resources and for coping with conflicting demands. UN-Water (2008a) conducted a survey covering 104 countries, providing the most objective and comprehensive overview of the current status of water resources management, including information gathered also by other institutions. This survey concluded that developing countries have made progress in the IWRM planning process at the national level but much more needs to be done to implement the plans. Africa usually lags behind Asia and the Americas on most key issues for IWRM plans, but is more advanced on stakeholder participation, subsidies and micro-credit programs. Asia appears to lag behind in institutional coordination but is more advanced on institutional reform. Developed countries have advanced on almost all major issues. However, there is still much room for further improvement. Plans are often only partially implemented, public awareness and gender mainstreaming needs to be strengthened. Successful Case Study on Integrated Water Resources Management in China – Provincial level: Liao River Basin Management The province of Liaoning with a 41 million population has seen a rapid development resulting in water shortages and severe water pollution. In the 1980s water use efficiency was very low both within urban/industrial areas and irrigation. Water pollution was rampant. No fish could be found in 70% of the streams and ecosystem productive functions had ceased in 60% of the streams. Citizens were ignorant of water conservation issues. Urban wastewater was discharged untreated into streams and in some cases infiltrated into the groundwater aquifers. Deforestation took place in the upper parts of the catchments. IWRM Actions: Establishment of an institutional framework comprising Liaoning Cleaner Water Project Office, Liao River Basin Coordination Commission, EU-Liaoning Water Resource Planning Project Office under which an IWRM Planning Project was developed. Under this project water resources assessment was carried out, a reform of the policy for water exploitation and utilization was made, water prices adjusted, a monitoring network established and capacity building within IWRM made. In addition, the cleaner water project was creating wastewater infrastructure, low production/high pollution production was discouraged, pollution prevention and control of Liao River Basin was planned and reforestation was implemented. Tangible impacts: Reduction of pollution loads by 60% and quality of river water considerably improved. Upstreamdownstream conflicts were reduced and deforestation practices halted. Drinking water within the basin was safeguarded and ecosystems in several river stretches were restored. Groundwater pollution was reduced and public awareness of demand management and pollution risks was raised. (Source: EU Liaoning Integrated Environmental Program – Chief of EU Party Alan Edwards – MWH Environmental Engineering)
There are many illustrations of the tangible benefits of implementing plans that have adopted the IWRM approach in particular at the community and provincial levels for it is at these levels that so many societal gains can be made. The UN Water survey shows that many countries consider that plans that follow an IWRM approach automatically also include water efficiency measures. It is recognised that taking actions that make water use more efficient is beneficial for economic and social development. It can be concluded that much more effort needs to be made to incorporate explicitly water efficiency measures within the framework of IWRM. 17
18 March 2010
Factors underpinning successful strategies and measures Successful strategies typically include decentralization of some aspects of water management and increased participation of local users or water user associations and other stakeholders. In many cases, this has resulted in improved water allocations, greater efficiency of use, and greater cost recovery. Integrating water resource management concerns into development planning frameworks and governance systems is a key requisite. Successful policy frameworks include not only the water sector, but also sectors such as agriculture, land use planning and energy. Strengthening institutions and legal frameworks are other key ingredients. Stakeholder engagement is important, including by direct participation in planning and for expanding public awareness. In Europe, the Protocol on Water and Health under the Convention on the Protection and Use of Trans-boundary Watercourses and International Lakes aims to protect human health and well being by better water management, including the protection of water ecosystems, and by preventing, controlling and reducing water-related diseases. The Protocol is the first international agreement of its kind adopted specifically to attain an adequate supply of safe drinking water and adequate sanitation for everyone, and effectively protect water used as a source of drinking water. To meet these goals, its Parties are required to establish national and local targets for the quality of drinking water and the quality of discharges, as well as for the performance of water supply and waste-water treatment. They are also required to reduce outbreaks and the incidence of water-related diseases. This Protocol introduces a social component into cooperation on water management. Water resources management should link social and economic development to the protection of natural ecosystems. Moreover, improving the water supply and sanitation is fundamental in breaking the vicious cycle of poverty
Critical Gaps The World Water Development Report44 points out that there is a large need for developing tools and interventions for improving water resources management. To be effective they should be developed and implemented simultaneously using both top-down and bottom-up approaches. Linking water supply and sanitation and water resources management • Specific attention needs to incorporate water supply in the advancement of water resources management. • Tools to facilitate stakeholder participation in water management and service delivery, recognizing socio-economic and gender-based dynamics in water access, needs, usage and capacity to engage in these processes. • Mainstreaming gender issues in water resources management, as water managers at the household and farm levels are often women, and the burden of lack of access to water and sanitation is much more on women and girls. Protecting water quality • Integrated water pollution prevention and control strategies need to be implemented to ensure the sustainability of water resources available for human and ecological needs. • To achieve better raw water quality, polluter pays/ pollution management systems should be improved. • Tools are needed for water quality management also at the community level. Such tools should empower communities to participate in decision making at higher levels and at the same time give them more control over their own environment. Improving water use efficiency 44
World Water Assessment Programme. 2009. The United Nations World Water Development Report 3: Water in a Changing World. Paris: UNESCO, and London: Earthscan
18
18 March 2010
• • •
To improve water use efficiency, technology and financial instruments need to be developed on water demand management. Operational indicators of water management performance need to be developed. Local capacities need to be strengthened, including at the community level, or new structures put in place to facilitate sectoral interaction in planning and development for the application of financial/economic decision-making.
Linking trans-boundary and national water resources management • Tools to spur regional dialogue and political will among decision makers to jointly address the challenges of shared waters. • Capacity building for the development of legal conventions and associated institutional structures. • Trans-boundary water management could be used as a tool to build transparency and common management systems across watersheds. • National roadmaps for advancing IWRM should be linked and fully integrated into regional ones. Adapting and improving resilience to climate change and natural hazards through improved water management Adapting to the impacts of climate change will be expensive and will require difficult and perhaps contentious policy shifts. Effective management of water resources has become more important owing to the likely effects of climate change on precipitation distribution and intensity, rising sea levels, changes in temperature patterns and their consequences for glaciers. • IWRM strategies and frameworks required. • Investment is also needed for infrastructure projects. • Particularly important is the development of tools for assessment of basin risks and vulnerabilities to climate change and related disaster risks. • Tools for the incorporation of adaptation measures in basin planning. • The need to mitigate climate change because its impacts are affecting water supply and demand in many ways. Summary of key lessons and future measures for accelerated progress • Countries, particularly those that are lagging behind, need to prioritise the development of IWRM and water efficiency measures, with the help of the international community; • Countries need to prioritise the implementation of policies and plans once they have been developed; • Experiences in implementing IWRM should be monitored, evaluated, reported and shared through a global knowledge management mechanism. This will require more work on indicators and follow-up processes that do not add an undue reporting burden on countries.
Indicator 7.6: Proportion of terrestrial and marine protected areas Analysis of Successful Strategies and Measures Protected areas (PAs) are internationally recognized as a major tool for conserving species and ecosystems. The ecosystems they protect provide a range of goods and services essential to human well-being, such as erosion reduction and water purification. MDG Indicator 7.6 has no agreed quantitative target, and instead is a directional measure. Consequently, the greater the proportion of a country’s terrestrial and marine protected areas, the closer a nation would be expected to approach the target of reducing the rate of biodiversity loss. Increasing the number of protected 19
18 March 2010
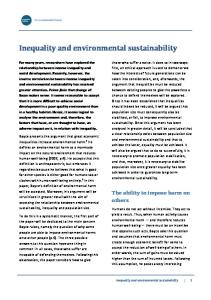
areas is not enough if they are not adequately protected in practical terms. Protection of these areas, including through increased law enforcement, is necessary to halt the loss of biodiversity. The figure below illustrates Increase in percentage of Protected Area Coverage by country, 2000 –2008. 45 As of 2008, 73 countries have protected 10% or more of their national surface area, with 18 nations reaching protected area coverage of 25% or more. Protected area coverage has increased where countries have invested in their establishment. The countries with the highest PA coverage are not necessarily the same as those with the greatest increase in coverage since 2000, when the Millennium Development Goals and their associated indicators where adopted. For example, China and Venezuela both report over 50% of their surface area protected, but this has increased by only 0.2% between 2000 and 2008 for China and by 0% for Venezuela. Sixteen countries have increased protected area coverage by over 2.5% since 2000 (see map above), the greatest improvements being in Gabon (+10.4%), Brazil (+9.9%) and Australia (+8.1%). However, discrepancies between countries in the timing and degree to which changes in PA coverage have been reported may introduce a reporting bias. In the post-Soviet countries, conversion of land from former military use also lead to gains in biodiversity, even if the areas were not under protection. The legal institution of protected areas is not sufficient. More resources are needed to monitor protected areas and enforce legislation against illegal uses of protected areas. Africa has over 2 million square km of protected areas, which are largely savannah habitats. Of the one hundred and nineteen eco-regions, eighty-nine have less than 10 per cent of total area protected. The coastal area on the continent is faced with conflicting priorities: oil and mineral extraction, coastal development, fishing communities that are confronted with the lack of capacity in ensuring biodiversity and fishing stocks for sustained development.46
Factors underpinning successful strategies and measures There are no obvious geographical or developmental patterns that are common to the 16 successful countries which have increased their protected area coverage by 2.5% or more since 2000. However these countries share a number of success strategies and measures:
45
The percentage change in terrestrial and marine area protected has been calculated based on the documented extent of nationally designated protected areas recorded in the World Database on Protected Areas (WDPA). There are known data and knowledge gaps that might result in overestimation or underestimation of protection and changes in protection for some countries. Overlaps of different nationally designated protected areas might for example inflate the protection figures in some countries. More information on the limitations of the data and methods can be found in the metadata sheet of the MDG indicator 7.6 at http://millenniumindicators.un.org/unsd/mdg/Metadata.aspx 46 UNEP, 2006
20
18 March 2010
� Incorporation of PA measures into National Legislation The majority have a strong legislative basis for PA establishment. For example in 2000 Brazil established by law its National Protected Area System (SNUC). � Ratification of International Agreements relating to PAs All are party to several major international treaties, including the Convention on Biological Diversity (CBD), the UNESCO World Heritage Convention and the Ramsar Convention. In an effort to meet the commitments associated with these conventions, many countries have made progress in expanding and strengthening their PAs. Case Study: Strengthening Protected Areas in Namibia For example, Gabon officially This UNDP-GEF supported initiative aimed to increase the bio-geographic ratified the Ramsar representation of the PA system in Namibia, and put in place the financing Convention in 1987, since then structures to effectively manage the expanded PA estate. The project has a number of national Ramsar increased PA coverage from 14% to 17% of the country’s territory, bringing critically under represented ecosystems, such as the Succulent Karoo sites have been designated, ecosystem into the PA system. Before the initiative commenced in 2004, including three new sites in the annual Government budget was around US$ 7 million, a fraction of 2007 covering a combined what was necessary to adequately manage the PA system. The initiative has area of 683,769 ha. assisted the Government to identify, combine and sequence funding from � Increased National Focus different sources to finance Protected Area management. One of the major financial barriers affecting PAs in many countries is under-valuation of the on PAs economic benefits of PAs, resulting in under-investment by the Countries have increased their Governments in the PA system. The project undertook a comprehensive focus on PAs by incorporating economic analysis of the PA system in 2004. The results indicated that the targets and indicators into PA system contributed up to 6% of Namibia’s GDP, counting park based tourism only, without including other ecosystem services values, and the their national strategies. For economic rate of return on the government investment over 20 years was example, Australia included as much as 23%. The study showed that further investment in PAs could the action to ‘undertake a 10lead to a contribution of 15% to the GDP in the medium term. These study year Commonwealth, State results were used by Namibia’s Ministry of Environment and Tourism to and Territory cooperative negotiate an increase in the State budget for park management and development by 310% in the last four years and in addition, to earmark program, which includes the 25% of park entrance revenue for reinvestment in the PA system through a provision of adequate trust fund, providing up to US$ 2 million additional financing per annum. resources, to ensure that the The study also led to successful mobilisation of a large amount of additional terrestrial and marine donor funding for PAs, including US$ 15 million from Germany and a US$ 67 million grant from the Millennium Challenge Account (MCA). Source: protected area systems are UNDP comprehensive, adequate and representative’ in its National Biodiversity Strategy and Action Plan (NBSAP). � Increased Involvement of Local Communities Many countries have put in place policies and programmes that increase involvement of local communities in the design and management of PAs. Co-management arrangements and communitybased eco-tourism initiatives that provide incentives to local communities help to increase acceptance of PAs and overcome conflict with traditional users of PAs. In Columbia, the creation of the Alto Fragua-Indiwasi National Park in 2002 represented a historic precedent, as for the first time an indigenous community; in this case the Ingano people are the principal actor in the design and management of an official protected area that is fully recognized by the state.47 � International Support For developing nations, international support has been a significant factor in increasing PA coverage. For example, Central American countries received technical assistance from at least 33 international organizations during the 1990s benefiting approximately 145 PAs. Such support has laid the foundation and encouraged national, bi-national and multinational PA projects throughout the region.
47
Chape et al., 2008, p. 115.
21
18 March 2010
� Regional Collaboration Many countries have been successful in increasing national PA coverage through regional collaboration, most notably by the establishment of trans-boundary PAs. This is particularly relevant for Central America where there have been specific efforts to increase collaboration between nations, for example the Convention for the Conservation of the Biodiversity and the Protection of Wilderness Areas in Central America. Several trans-boundary PAs have been established, including The Amistad Reserve between Costa Rica and Panama covering 6,000km2 and a Protected Areas System for Peace between Nicaragua and Costa Rica. � Establishment of private protected areas Countries have seen increases in the number of Private Protected Areas (PPAs). PPAs have the potential to supplement government initiatives to protect natural ecosystems, particularly in areas where remaining natural lands are already held in private ownership. State recognition of PPAs means that an increased number of stakeholders can become involved in the establishment of PAs, including local and indigenous peoples and non-governmental organizations (NGOs). The Nature Conservancy (TNC) has established more than 1,500 PPAs in the USA with protecting an area of 39,000km2. Critical Gaps Critical gaps have been identified for countries which have shown little success in increasing PA coverage since the MDGs were adopted: • Lack of national investment in PAs and a weak legislative basis; • Little or no involvement in major international protected area agreements and programmes; • Lack of international support both, financial and technical; • Complex land ownership issues, for example mobile peoples in Northern Africa; • War and civil unrest. Importantly, this indicator simply measures the percentage of terrestrial or marine area protected. It does not take account of how well PAs are targeted to cover the most important areas for biodiversity and hence contribute to reducing biodiversity loss. Many of the countries with the largest proportions of their land protected contain large tracts of desert or mountainous regions with few human inhabitants. Such areas may be less contentious to designate as PAs, but may not be the most critical sites for biodiversity. Preliminary results indicate that only about a third of the key biodiversity areas are protected, and only a quarter are completely protected. Similarly, to contribute significantly to reducing biodiversity loss, PAs need to be effectively managed, but preliminary data suggest that only a fifth of PAs are adequately managed.48 This is in part due to a lack of financing, which could be improved if the economic benefits of protected areas were better communicated and understood, thereby leveraging political support for investment in protected areas. Summary of key lessons and future measures for accelerated progress Some of the lessons learned and future measures for accelerated progress to increase the proportion of terrestrial and marine protected areas include the following: • Incorporating PA establishment into national legislation and biodiversity strategies improves the opportunities of increasing PA coverage; • Ratification of international agreements may result in more effective establishment of PAs; • Regional cooperation and international support and technical assistance can aid the establishment of Pas;
48
See www.twentyten.net
22
18 March 2010
• • •
PPAs can be important nationally for increasing PA coverage and protecting areas important for indigenous communities; PAs should be targeted to cover key biodiversity areas and need to be adequately managed in order to contribute to reducing the rate of biodiversity loss; Regular and timely reporting to the WDPA allows accurate tracking of progress.
Indicator 7.7: Proportion of species threatened with extinction Analysis of Successful Strategies and Measures Species are the building blocks of biodiversity, which provides us with essential ecosystem services such as food, medicine, water purification, nutrient cycling, crop pollination, pest control and climate regulation. Human well-being and livelihoods are interlinked with the overall condition of biodiversity, as indicated by the status of species. However, the 2009 IUCN Red List shows that the proportion of species threatened with extinction is substantial for all species groups for which adequate data are available: 9% of dragonflies, 12% of birds, 18% of reptiles, 21% of freshwater fish, 21% of mammals, 28% of conifers, 16% of freshwater crabs, 27% of corals, 30% of amphibians and 52% of cycads.49 The IUCN Red List Index (RLI) shows that the proportion of species threatened with extinction are increasing, and that this is happening at a global scale, and in all regions, ecosystems and habitats. Few countries to date have applied this indicator at the national scale, because it generally requires at least two national Red List assessments to have been carried out for a complete species group using comparable methodology. Information for this indicator is still preliminary and, hence, comparable and harmonized statistics are not available for identifying historic trends. 50 While 122 countries have published one or more national red lists, only 77 have done so using the recommended IUCN guidelines, and very few have done this twice.51 Examples of national RLIs or indices based on the RLI approach include these examples, and independent evidence from many different sources indicates that, overall, threatened species are slipping closer to extinction and previously safe species are becoming threatened in nearly all countries of the world. There are numerous examples to show that species can be brought back from the brink of extinction and their status improved, through focused conservation action involving species-specific interventions (e.g. captive breeding, supplementary feeding); site-based actions (site protection, habitat management); and, activities tackling key threats (e.g. eradication of invasive species, management of hunting). High profile examples of success stories include Golden Lion Tamarins (in Brazil),52 Majorcan Midwife Toad (in Spain),53 Black-footed Ferret (in the United States),54 White Rhino (in South Africa),55 Californian Condor (in the United States),56 and Black Robin (in New Zealand).57 One recent study estimated that across all the world’s birds, conservation action had prevented 16 bird species from going extinct between 1994 and 2004.58 More broadly, the RLI shows
49
Hilton-Taylor et al. 2009, www.iucnredlist.org ECLAC, MDG 7 Report, 2009, Pp. 193 51 Bubb et al, 2009 52 Russo, 2009 53 IUCN, 2008, 54 Roelle et al. 2006 55 Emslie and Brooks 1999 56 Nielsen 2006 57 Butler and Merton 1992 58 Butchart et al. 2006 50
23
18 March 2010
that the bird species protected by the EU Birds Directive have improved in status between1994-2004 while those not covered under the Directive have continued to decline in status.59 Factors underpinning successful strategies and measures The suite of successful cases where the status of species has been improved by interventions suggest that we have the skills and knowledge to reduce the proportion of species threatened with extinction, but to achieve this sufficient political will and resources need to be applied. The fact that the overall picture shows a worsening situation suggests that current efforts are inadequate. One key theme is that even when policy responses are in the right direction, they are often not yet adequately implemented. For example, political action in response to the threat from Invasive Alien Species (IAS), one of the top three threats to biodiversity, is superficially impressive. Ten relevant international treaties have been signed by 83% of countries. However, only 55% have national legislation to manage, control and/or limit the spread and impact of IAS, and far fewer have adequate management programmes to implement this legislation on the ground. As a consequence, the number of successful eradications or control programmes is swamped by the continued spread of IAS (with the number recorded in each country growing yearly), and species continue to be driven towards extinction by IAS.60 Similarly, 175 countries are signatories to the Convention on International Trade in Endangered Species (CITES), which has the power to restrict or even ban international trade that is considered to endanger a species. However, unsustainable levels of exploitation driven by international trade continues to threaten many species,61 and this is likely to be partly because of capacity limitations in many countries leading to inadequate enforcement, quotas underpinned by insufficient or inappropriate data, and illegal trade. Some of the key threats to species are particularly challenging to tackle. For example, habitat loss driven by unsustainable forest management or unsustainable agricultural expansion or intensification is the most important threat to biodiversity, but these pressures are not amenable to quick, easy or cheap solutions and require cross-sectoral shifts in policy. In particular, agricultural policies need to be reformed to remove perverse incentives. Threats to species that operate at the broad scale require biodiversity to be effectively incorporated into land-use planning. Good examples where this is happening are provided by Mongolia (where a comprehensive strategy for mining, infrastructure and tourism development explicitly takes account the country’s key sites for threatened birds and Namibia (where uranium mining development plans are taking account of the location of key biodiversity areas).62 Critical Gaps Critical gaps that have to be addressed in order to effectively increase the proportion of species threatened with extinction include: • National scale capacity-building in monitoring and indicator development, particularly in red listing, is needed; • Many key biodiversity areas remain unprotected, and many protected areas need better resources to be effectively managed;
59
BirdLife International unpublished data Butchart 2008, Genovesi et al. In press, McGeoch et al. in review. 61 Hilton-Taylor et al. 2009, 62 BirdLife Asia 2009 60
24
18 March 2010
•
Even where environment ministries are well funded and able to implement well-focused action, their efforts are commonly unsupported by other parts of government. Biodiversity, like climate change, needs to be mainstreamed, with policies across all sectors incorporating biodiversity considerations;
Summary of key lessons and future measures for accelerated progress • Special Protected Areas have to be designated for listed species, and listing has stimulated the development and implementation of Species Action Plans for many of these species. This suggests that EU legislation has had a positive effect on the species it specifically targets. • Key sites for threatened species need to be adequately protected. • Biodiversity needs to be mainstreamed across all policy sectors and explicitly integrated into land-use planning. • Existing policy and legislation needs to be strengthened, but most critically needs to be effectively implemented.
Indicator 7.8: Proportion of the population using an improved drinking water source Analysis of Successful Strategies and Measures63 Progress on the drinking water target of the MDG has been good, and the world is on track to achieve it, with 87% of the world’s population having access to a safe drinking water supply in 2008. However, much of the progress is in urban rather than rural areas, and eight out of ten people without improved water supply live in rural areas. There is also significant inequity between regions, with Africa lagging behind badly, within regions and within countries. Moreover, there are gender differentiated impacts of limited access to safe drinking water on education and economic opportunities, as girls and women are more often responsible for water management at the household level, especially in rural areas. Progress in the sector must therefore be viewed in this context, recognizing that equity concerns are serious. In 1990, 77% of the world’s population had access to an improved water source, and the goal for 2015 is to increase coverage to 89%. Current trends suggest that more than 90% of the global population will use improved drinking water sources by 2015. Estimates for 2008 show that the population reliant on unimproved drinking water sources is below one billion: currently at 884 million. Improved drinking water coverage in sub-Saharan Africa is still considerably lower than in other regions. Nevertheless, it has increased from 49% in 1990 to 60% in 2008, which means that an additional 238 million Africans are now using safe drinking water. Good progress has been made in the use of piped drinking water on premises, which represents the highest rung of the drinking water ladder where health gains are maximized. Use of piped drinking water has risen by seven percentage points since 1990, reaching 57% in 2008. While this may seem modest, it represents an increase of 1.2 billion people. This progress is impressive. However, piped drinking water remains largely an urban privilege: 2.7 billion urban inhabitants use a piped drinking water connection on premises, compared to only 1.2 billion people in rural areas. Urban coverage is struggling to keep pace with population growth. While the rural challenge remains significant, the urban challenge is growing fast. Since 1990, the world’s urban population has risen by 1.09 billion people. During that period, 1.05billion urban dwellers gained access to improved drinking water sources. At the same time, the urban population without improved drinking water 63
Figures to be updated with new data in March 2010.
25
18 March 2010
sources increased from 102 million to 141 million. Almost all of this increase took place in urban areas of the developing world. Maintaining the relative high urban drinking water coverage rate of 96% is quite a challenge, as the urban population in Africa and Asia is projected to grow by almost three billion by 2050. It is therefore likely that the urban population without an improved drinking water source will gradually increase as service provision cannot keep up with the pace of urbanization. Rural access to improved drinking water sources remains low at 78% in 2008. The world’s rural inhabitants represent 84% of the population using unimproved sources of drinking water. An estimated 746 million rural dwellers are without improved drinking water supplies, compared to 137 million urban residents. However, there is some positive news: 723 million rural inhabitants have gained access to safe drinking water since 1990. In most regions, some progress has been made to improve access to safe drinking water and basic sanitation (see figures below). The rural-urban gap is still wide, lowering national aggregate figures in countries of various regions. Despite the fact that 22 African countries have increased access to improved drinking water source in rural areas by 25% or more, the changes are still too low for Africa to reach the target of halving the number of people without access to an improved drinking water source by 2015.64 Progress towards the MDG drinking water target, 2008 (Source: WHO/UNICEF JMP, 2010)
Factors underpinning successful strategies and measures Water, particularly urban water, has always enjoyed a higher level of political will and financial support than sanitation. Involvement in the urban sector of relevant stakeholders and the private sector has also assisted in keeping the existing systems functioning and expanding to new users. There are numerous global initiatives and partnerships in the water sector. The creation of the Collaborative Council for Water Supply and Sanitation, the World Water Forums organised by the World Water Council, World Water Weeks held annually in Stockholm by the Stockholm International Water Institute, and Africa Water Weeks organised by the African Ministers Council on Water have all contributed to building political will and sharing best practices. However, the sector remains under-resourced.
64
Pp. 6, Secretary-General Report on Regional Cooperation in the Economic, Social and Related Fields, 2008, E/2008/15
26
18 March 2010
Water Operators Partnerships", also known as WOPs are an effective way to help public utilities acquire the much needed skills and know-how in an innovative and cost-effective way.65 Fostering collaboration between utilities to share knowledge and exchange experiences between them, in order to improve on effectiveness and efficiency of the non-performing ones, is a vital element in meeting the challenge and sustain the positive outcomes of the sector reforms. Regardless of what management Country example of best practice for water: model is adopted, specific In Chad’s Master Plan for Water Supply and Sanitation it was institutional and governance issues recognized that costly, mechanized drilling alone would not satisfy the require attention. Amongst these water demand in all areas of the country. Instead, manually drilled boreholes have been promoted in those areas where such technology are the inequitable distribution of is appropriate. This promotional work has, with the support of UNICEF network access; and the multiple and the Practica Foundation, been implemented through the Ministry disincentives (for the poor to choose of Fishing, Pastoral and Rural Hydraulics. A key part of this strategy has network connections, and for included development of the capacity of Small and Medium Enterprises (SMEs) to carry out such work and has further included a network managers, public or private, mechanism to monitor the quality of the works they do when drilling to connect the poor). This suggests in rural areas. The use of manual drilling enterprises is estimated to several policy implications with have been able to increase the number of wells drilled per year from respect to pro-poor water supply 750 to between 2000 and 2500 with significant benefits to the local economy. Chad’s experience during the last four years shows that delivery. First, governance failure effective use of manual drilling can be highly significant in helping to rather than the merits of public or attain the Millennium Development Goals in the Water Sector. private providers should be the focus of policy makers. Both Public and Private Utilities should have clear benchmarks for equity associated with noncompliance penalties, and, in some cases, these benchmarks could have a spatial component (e.g., numbers of connections within specific neighborhoods or supply zones). All water supply providers should be subject to robust regulatory frameworks with clear standards for good governance. Second is the need to reconsider realistically the ‘‘modern infrastructural ideal,’’ which envisioned the universal extension of uniformly regulated networks. Currently, networked water supply utilities tend to be subject to some form of regulation, whereas the non-networked water supply alternatives upon which a large proportion of urban poor households depend are often entirely unregulated. Critical gaps Critical gaps that need to be addressed to achieve this target include the following aspects: • Reaching the unserved population 84% of which reside in rural areas • Prioritizing water quality, continuous reliability and increased piped connections; • Decreasing coverage in urban areas; • Providing access to 884 million still without improved water; • Financing, especially in local currency. More funding is necessary from tariffs, taxes and external transfers. Key challenges include: defining the right mix between these funding sources; developing strategic national financial plans to adapt financial means to water policy targets and vice-versa; identifying and removing legal barriers that inhibit access to local currency debt markets for financing water and sanitation projects; and building capacity of the local water utilities. • At the international level, improving investment flows for off track countries is needed. In this regard, the Global Framework for Action on Sanitation and Water promises to play a key role; • Developing better knowledge of all water expenditures including public and private infrastructure investment, operation and maintenance, and household expenditures.
65
The WOP programme is administered by UN-Habitat.
27
18 March 2010
•
Linking water and sanitation with poverty, as access to water of good quality in adequate quantities and to sanitation significantly contributes to poverty reduction and livelihoods improvement.
Summary of key lessons and future measures for accelerated progress Future measures that are required to increase the proportion of population using an improved drinking water source include: • Upstream work – budget allocation from government and donors; • Reduced drilling costs and entrenched supply chains; • Technology options increased to include all sources; • Proactive planning for future urban population growth.
Indicator 7.9: Proportion of population using an improved sanitation facility The world is not on track to meet the MDG sanitation target. In 1990, 54% of the global population had access to improved sanitation, while the goal for 2015 is to increase coverage to 77%. Between 1990 and 2008, however, the proportion of people without improved sanitation decreased by only 7 percentage points. Without an immediate acceleration in progress, the world will not achieve even half the MDG sanitation target by 2015. Based on current trends, the total population without improved sanitation in 2015 will have increased only slightly since 1990, to 2.6 billion. At the current rate, the world will miss the MDG sanitation target by over almost 1 billion people. To meet the target, at least 218 million people on average per year will need to begin using improved sanitation facilities.66 Figure illustrating Progress towards the MDG sanitation target, 2008 (Source: WHO/UNICEF JMP, 2010)
Analysis of Successful Strategies and Measures With a decrease from 85% in 1990 to 66% in 2004, the Asia-Pacific region is currently off-track to achieve the target of reducing, by half, the proportion of people without access to basic sanitation in rural areas by 2015. In percentage terms, this puts the region far behind the ECLAC region (51% in 2004) and close to sub-Saharan Africa (72% in 2004). The water and sanitation sector in the Arab region is under intense pressure as a result of the continuously growing gap between supply and demand. Of all the countries in the Arab region only a few are well on track with their Water and 66
UNICEF, WHO, Progress on Drinking Water and Sanitation, Special Focus on Sanitation, 2008 –.
28
18 March 2010
Sanitation Sectors (WSS) and these are mostly the few countries with high gross domestic products and relatively high level of urbanization. The prevailing financial crisis and the resultant tight credit market and low growth prospects are expected to slow some types of investments including those related to WSS.67 Also, in recent years, a number of organizations have introduced various cost-effective communitybased approaches to achieving sanitation improvement. These include the Total Sanitation approach, School-Led Total Sanitation (SLTS) and Community-Led Total Sanitation (CLTS) in several countries. These approaches focus on the elimination of open defecation in the community, developing an understanding in the community that poor sanitation affects everyone, and that a collective approach is required. Through such initiatives, communities have been able to achieve remarkable progress with very limited external support, including the elimination of direct hardware subsidies to households.68 Worldwide application of these community approaches has the potential to transform the rate of progress in sanitation and bring the MDG sanitation target within reach. Many partners are now working closely with governments and other partners in many countries to mainstream the approach and make real impact at scale.69 Factors underpinning successful strategies and measures The International Year of Sanitation 2008 (IYS2008), declared by the UN General Assembly, provided the global community with a needed opportunity to raise awareness and accelerate actions for the achievement of the sanitation MDG.70 Unprecedented political commitment demonstrated during the International Year of Sanitation 2008 most immediately reflected in Regional Sanitation Declarations adopted at conferences held globally. In Africa, Asia, Latin America, the Caribbean, and in Black Sea Countries, leaders signed onto Sanitation Declarations, making commitments including to increase funding for sanitation, identify responsible government agencies and to promote hygiene education. Now the challenge is to ensure that these commitments are fulfilled. Critical gaps Critical gaps that need to be addressed in order to increase the proportion of population using an improved sanitation facility include: • Lack of resources and over-emphasis on conventional sewerage provided a pretext for relative inaction among un-served urban and rural populations. In many countries, of the resources allocated to domestic ‘water and sanitation’, less than five per cent is provided to sanitation with water supply absorbing the overwhelming share. Political leadership is also lacking: sanitation is a political and institutional orphan;71 • In many countries improved sanitation has yet to receive the support and recognition it deserves as a precondition for health and for success in the fight against poverty, hunger, child mortality and gender inequality; • Inadequate market access to low cost latrine components for rural and urban populations holds a bearing on the uptake of improved sanitation; • Collection of waste water must be enhanced to protect individuals against potential contamination by neighbours and also to ensure local wells are not contaminated. This health issue is often underestimated because of the difficulty to measure soil infiltrations;
67
A small group of water experts from the Regional Commissions and UNICEF will rework this paragraph by mid January UNICEF 2009. Fieldnote: UNICEF Policy and Programming in Practice. Community approaches to total sanitation. Based on case studies from India, Nepal, Sierra Leone, Zambia, New York, 2009. 69 UNICEF 2009. Soap, toilets and taps. A foundation for healthy children. How UNICEF supports water, sanitation and hygiene, New York, 2009 70 UN Water 2008 71 Idem 68
29
18 March 2010
• •
•
With local shortages of clean water multiplying, and ecosystems being under threat, it is critical that systems are put in place to treat wastewater and where appropriate, to reuse it; Lack of access to sanitation is one of the major causes of pollution of surface and ground water systems: the link between lack of sanitation and water pollution need to be addressed. In many parts of the world, sanitation facilities are desperately needed in schools. The lack of reliably safe and clean sanitation facilities is a proven deterrent for school attendance, particularly for adolescent girls. More effort is needed in this area to spur behaviour change which will also contribute to the education MDG targets.
Summary of key lessons and future measures for accelerated progress The safe drinking water and sanitation target of the Millennium Development Goals (MDGs) will only be achieved once there are meaningful successes in reducing the widening gap in both drinking water supply and the provision of adequate sanitation services particularly in peri-urban and rural communities. This will require not only the expansion of current utility services and the undertaking of new projects but also the harnessing of innovative technologies, which would allow countries to tap on both conventional and non-conventional means of meeting the ever-increasing demand. Thus greater attention will have to be paid on such issues as water desalination, treatment of wastewater and water harvesting just to name a few. In parallel, substantial efforts will have to be devoted to reduce waste and pollution. In terms of the approach taken to promote sanitation, the most fundamental lesson to be drawn from recent sanitation programs is that success or failure and rates of progress are determined by consumer demand. Where demand for sanitation is strong, sanitation programmes have a chance of succeeding if the quality and cost of services provided are linked to that demand. Where demand is not strong, the first priority of a sanitation program must be to develop it.72 However, communities have often been approached as passive ‘recipients’ of sanitation hardware, they played a small role, if any, in the selection and design of sanitation systems. This often led to facilities that were sourced externally, expensive and hard to maintain. As with any ‘free’ product, community members were willing recipients but unlikely to lead improvements, expansion or maintenance of systems. The benefits of sanitation improvements in such projects had little spillover effect into the wider community, both in terms of public health (particularly when other members were still practicing open defecation) and in terms of community mobilization around a common goal.73 Future measures for accelerated progress in increasing the proportion of population using an improved sanitation facility include the following: • Scaling up demand driven approaches; • Behavior interventions supported by improved access to sanitation hardware/technologies; • Create customer awareness, knowledge, experience and understanding of the product needed to increase uptake of latrine building and use; • Develop the capacity and profitability of the new sanitation industry; • Allow the private services sector to develop a customer base and develop a trusting relationship; • Develop meaningful public-private partnerships; • Develop effective mechanisms for cross-ministerial coordination; and, • Gain further political will. 72 73
Cairncross, 2004 CATS fieldnote
30
18 March 2010
Indicator 7.10 - By 2020, to have achieved a significant improvement in the lives of at least 100 million slum dwellers Analysis of Successful Strategies and Measures This target has been reached ten years ahead of the deadline. Over the past 10 years, the proportion of the urban population living in slums in the developing world has declined from 39.3% in 2000 to an estimated 32.7% in 2010, with more than 200 million urban dwellers who have gained access to either improved water, sanitation or durable and less crowded housing. However, during the same period the number of additional slum dwellers surpassed the number of those who gained access to basic shelter services. in absolute terms the number of slum dwellers has grown considerably, and will continue to rise in the near future. The slum target was not linked well with the growth rate of informal settlements in the developing world. At present 50.6% of the world’s population—or 3.49 Case-Study to improve the lives of slum dwellers: The Philippines In the Philippines, MDG localization brings the MDGs down to the billion—is living in urban areas and community. The Family-based Actions for Children and their Environs in those living in slum conditions is the Slums (FACES) project, implemented in 2008, set targets, initiated estimated at some 828 million. actions and provided solutions at the family, community and city levels for 607 children living in 15 slum communities in the Philippines. It put a face on the MDGs-- the face of its most vulnerable person: the child in the slums. From 15 cities which participated in the FACES project, 607 children achieved as much as 20%-80% improvement in the quality of life in all the MDG family targets as monitored by the families themselves. This was attributed to 56 quick response mechanisms and 31 demonstration projects and child-focused MDG models identified and implemented by the families themselves with the support of the local government, national government agencies, non-government organizations and the private sector. The success of the project has inspired its replication to 86 villages of the participating cities in 2009.
Particularly in the least developed countries and conflict-affected countries, the slum prevalence is expected to remain at 70 per cent. In 2010, it is estimated that the highest slum prevalence will be in sub-Saharan Africa (62%), followed by Southern Asia (35%) compared to less than a third in all other regions of the developing world. In the Sub-Saharan African region, The project has been replicated in 16 new cities during 2009. despite the efforts of some countries and cities to expand basic services and improve housing conditions in slum areas, inaction by others has prevented overall progress from keeping pace with a rapidly increasing urban population. Localizing the MDGs, that is making them city-specific, has been an important element of success. The approach institutionalizes the engagement and ownership by all levels of stakeholders (city, village, neighbourhood and family) in program development, implementation and monitoring; making the MDGs meaningful to the families especially the vulnerable sector recasting them as “development partners” rather than recipients of assistance; harnesses information as key in poverty profiling and establishing development baselines using accurate household level data.
Factors underpinning successful strategies and measures Localized projections of urban growth, as well as accurate national projections of urban growth, form the basis of successful long term policies to ensure that urban growth is not synonymous with slum growth. These projections will be based on census data. In 2010, over 55 countries will conduct censuses; quick release of data at the smallest geographic extent and capacity building for effective analysis are essential for making census data work for urban policy. Further, policy makers and 31
18 March 2010
urban planners should integrate urban growth projections into their existing planning structures. This integration means understanding that urban growth is inevitable, even in the face of antiurbanization policies, and that only by securing the land, housing and service needs of the urban poor can massive slum expansion in the future be avoided. Many countries have managed to improve living conditions through economic reforms and modernization policies that have used urbanization as a propelling force of national growth. Progrowth policies, with targeted pro-poor dimensions, have generally resulted in a reduction in the number of slum dwellings. A particularly successful strategy has been facilitating access of slum dwellers to new and affordable housing units through the use of equity grants (as a mortgage instrument) to procure leases on cheap housing built by property developers, who are given preferential tax rates as an incentive for the development of cheap housing. Countries have also taken up urban poverty alleviation and slum improvement as important components of their urban development policies through four specific strategies: (i) enhancing the productivity of the urban poor by building skills and providing access to micro-credit; (ii) improving living conditions of the poor through provision of basic services and in-situ development of slum settlements; (iii) providing security of tenure to poor families living in unauthorized settlements and improving their access to serviced low-cost housing and subsidized housing finance; and (iv) empowering the urban poor through community development and encouraging their participation in decision-making. Other factors behind countries’ success include also economic and social policies that have improved the income of poor urban households;; the development of low-income housing policies that subsidize construction material costs, sites and services, and provide for slum upgrading and land tenure regularization; new social housing and urban infrastructure projects; the creation of a Ministry of Cities; and the adoption of a constitutional amendment safeguarding citizens’ right to housing. Critical gaps The fact that the world as a whole has reached the Millennium slum target 10 years in advance does not mean that efforts to improve the lives of slum dwellers should slow down or altogether stop. At the time the slum target was set, the figure of “100 million slum dwellers” was considered a significant number and a realistic target to achieve within 20 years. However, by 2003, it became clear that the target represented only 10% of the global slum population ands was therefore not ambitious enough. Unlike other MDGs, the slum target was not set as a proportion, such as halving the proportion of people living on less than one U.S. dollar a day, or reducing by two-thirds the under-5 mortality rates with reference to a specific baseline (in this case, the year 1990). Instead, the slum target was set as an absolute number for the world as a whole. This made it difficult to set country-specific targets and therefore diluted national level responsibilities. Summary of key lessons and future measures for accelerated progress There is no question that the world has proved that it can collectively achieve a slum target and make a real difference to the lives of slum dwellers. Even though the target was low and easily achievable, progress has been made in various countries. This first achievement conveys a clear message that positive results are within reach when collective action takes place. Taking this achievement as the starting point, a reasonable target can be defined, 32
18 March 2010
with appropriate policies, strategies and procedures that are clear, concise and easy to follow, and to dedicate significant financial and human resources to effective results. Improving the lives of slum dwellers is essential to achieve all the Millennium Development Goals. Improving housing conditions and providing for water and sanitation will not only save lives among the very poor, but will also support progress in education, employment and health. Countries and cities that take the slum target seriously are increasing the prospects for millions to escape poverty, disease and illiteracy, and simply to lead better lives.
II. Cross-cutting issues The need for policy coherence The interdependence of all of the MDGs is a determining factor to the achievement of the goals as a whole and of each goal individually. For example, environmental sustainability policies have on the one hand a bearing on health and on poverty eradication and, on the other hand, conservation of ecosystems will not be possible if populations are ridden by poverty, hunger and malnutrition. The majority of the undernourished people world wide, which grew by 100 million in 2009,74 lives in marginal areas with serious soil and land degradation, and the associated loss of ecosystem services. Because land degradation is a crosscutting issue relevant to not only MDG 7 but also other MDG targets and indicators, addressing it as such will generate coherent policy responses. In order to ensure that all targets and objectives of the Millennium Development Goals are addressed, governments must adopt coherent policies that reflect countries’ particular circumstances and conditions. A means of achieving this is through the adoption comprehensive development planning frameworks, including national sustainable development strategies (NSDS) which encompass the economic, social and environmental pillars in an integrated manner. In a 2006, a review of over 150 MDG experiences documented several examples of developing countries which have successfully adapted the global MDG targets and indicators to their particular circumstances and conditions, to allow them to move towards national environmental sustainability goals while also contributing to the global goals.75 Many countries have come to recognize that comprehensive development planning frameworks, including NSDS can be an important tool, as evidenced for example by the voluntary presentations at the Annual Ministerial Review segment of the Economic and Social Council in 2008. Comprehensive development planning helps countries to achieve their economic, social and environmental objectives in an integrated manner. Specifically, NSDSs enable countries to identify and harness cobenefits of policies that contribute to different objectives, to find solutions for trade-offs among conflicting objectives, to address simultaneously intra-and inter-generational equity concerns, to address gender equality concerns, to target the most vulnerable populations, and to ensure broad participation and ownership across all major stakeholders. As of 2009, a total of 106 countries have reported to the United Nations, through the Division for Sustainable Development of UNDESA, that they are implementing an NSDS. However, in many countries and regions, there are still many institutional and knowledge barriers to effectively integrating environmental issues in sector policies (e.g. infrastructure development). In addition to 74
FAO, 2009 UNDP, 2006. Making Progress on Environmental Sustainability: Lessons and recommendations from a review of over 150 MDG country experiences.
75
33
18 March 2010
this, governments still have difficulties in terms of dedicating sufficient resources to environmental issues due to budgetary restrictions and the need to meet urgent demands related to extreme poverty, basic healthcare, education etc. Experience has shown that policy changes are needed to strengthen achievement of MDG 7. In particular, policy changes that establish national targets and indicators related to the global MDG 7 targets. While country conditions and experiences vary, there are a number of important factors that helped countries to develop and implement comprehensive development planning frameworks, including NSDS. The global commitment to NSDS expressed in the outcome of the World Summit on Sustainable Development,76 has helped many countries to advance their NSDS processes. Regional commitments, such as in the European Union and in the Pacific Forum have created additional impetus, as evidenced by the high rate of countries in these regions having an sustainable development strategies in place. Broad based multi-stakeholder processes in the development of national sustainable strategies are critical. Strong and effective monitoring systems and coordination of national sustainable strategies through central Ministries such as Ministry of Finance or Planning or through Offices of the Prime Minister or President are additional success factors. Involvement of all relevant ministries and stakeholders to the three pillars of sustainable development should be pursued. Many countries, especially those with extensive development planning experience, base their sustainable development strategies on existing planning processes, rather than embarking on completely new processes. Consequently, in many countries poverty reduction strategies (PRSs) or other development plans have integrated sustainable development principles. In addition, the United Nations Development Assistance Framework (UNDAF) process has been instrumental in advancing integrated development planning and policy coherence at the national level. Countries continue to face challenges in designing and, in particular, effectively implementing NSDS. These challenges include lack of coordination at the national level, lack of capacity to integrate policy areas that are traditionally treated in isolation and an overall lack of financial, technical and human capacities to implement integrated policies. Various factors underpinning successful strategies are summarized in the 2006 review of MDG 7 country experiences by UNDP. This study identifies eight major steps for successful tailoring of MDG 7 targets and indicators. These steps are: 1. Assess country environmental issues and their impact on socio-economic issues; 2. Identify and review existing environmental priorities and targets in national policies and programmes; 3. Use analytical frameworks to determine additional critical parameters to progress; 4. Set verifiable, time-bound, country-specific environmental sustainability targets; 5. Select indicators and establish a baseline to track progress towards environmental sustainability; 6. Implement monitoring implementation and data gathering systems; 7. Analyse and interpret monitoring results; 8. Communicate the results of monitoring progress towards MDG 7 to policy makers and the public to inform decisions and adjust responses accordingly.77 To further the integration of sustainable development in country policies and programmes, there is a need for improved data at the country level and opportunities to benefit from one another’s 76
The Johannesburg Plan of Implementation, WSSD, Johannesburg, South Africa, 2002. UNDP, 2006. Making Progress on Environmental Sustainability: Lessons and recommendations from a review of over 150 MDG country experiences, p. 55. 77
34
18 March 2010
experiences. The establishment of national systems and integrated databases for reporting on environmental sustainability is needed to strengthen abilities to track progress on MDG 7. Additionally, as many developing countries share similar challenges, opportunities to exchange information and best practices would improve capacities for national target setting.78 The participation in and support of civil society and other stakeholders is also important. Renewed political commitment to NSDS and avoidance of duplicative comprehensive strategy processes are other recommendations. It is important to recognize that achieving the MDGs requires that the men and women living in poverty are empowered. Therefore, building capacities at the community level to enable local organization, decision-making, partnerships and innovation will be critical to ensure environmental sustainability as well as the other MDGs. The Poverty Environment Initiative (PEI)79 specifically aims to contribute to poverty reduction and improved well-being of poor and vulnerable groups through mainstreaming environment into national development processes. And the Green Jobs Initiative80 aims to promote opportunity, equity and just transitions and to mobilize governments, employers and workers to engage in dialogue on coherent policies and effective programmes leading to a green economy with green jobs and decent work for all. The PEI experience, in the context of scaling-up the MDG achievements, suggests that it takes time and sustained effort to move poverty-environment concerns to the centre of development planning and action. But there are stories of achievement and how progress has been made along the way. Environment agencies typically operating on the periphery of development have found entry points into national policy making processes; the contribution of environment has been systematically integrated into PRSPs; economic arguments have been used to convince decision-makers to increase investment; key sector agencies have factored poverty-environment linkages into their programmes at the sub-national level. However, these efforts alone will not in themselves deliver on MDG 7 or other key MDGs. Rather they are steps in the right direction, signalling that the case of environmental sustainability can be made, that decisions can be influenced, and that sustained effort to mainstream poverty-environment into planning decisions can result in increased investment. The greatest challenge is going to scale. If MDGs are to be achieved, questions arise on how to replicate efforts; how to leverage more impact and how to engage other actors, such as the private sector, to amplify the potential result. Emerging issues Certain emerging issues including the recent fuel, food, economic and financial crises have increased the challenges for the achievement of the MDGs by 2015. While the prices of food and fuel have decreased since the peak that they reached in July 2008, the commodities markets remain highly volatile and uncertain. According to World Bank figures, higher food prices are estimated to have increased global poverty by some 130 to 155 million people. Fuel prices have experienced sharp swings in 2008 with oil prices peaking in July and declining by 70 per cent at the end of the year. According to the International Energy Agency, current global trends in energy supply and consumption are patently unsustainable – economically, environmentally and socially and “[P]reventing catastrophic and irreversible damage to the global climate ultimately requires a major decarbonisation of the world energy sources; on current trends, energy-related emissions of carbon 78
Ibid, p. 68. This is a joint initiative of UNDP and UNEP. 80 Green Jobs Initiative: is joint partnership between UNEP, ILO, International Trade Union Confederation (ITUC) established in 2007. The International Employers Organization (IEO) joined the Initiative in 2008. 79
35
18 March 2010
dioxide (CO2) and other greenhouse gases will rise inexorably, pushing up average global temperatures by as much as 6 degrees centigrade in the long-term.”81 Since the global economic and financial crisis became full-blown, it was uncertain to what extent and in what ways the different countries and regions of the world would be affected by it. Once the financial crisis began affecting the real economy with a decline in global aggregate demand, and increasing levels of unemployment, it became evident that most countries would experience enormous challenges emanating from the crisis, and a serious concern arose as to how this would affect efforts towards poverty eradication, environmental sustainability and the attainment of the MDGs. In this regard, green jobs strategies have demonstrated to be among the most efficient approaches to overcome this multidimensional challenge. The adverse effects of climate change will compound the difficulties further. The challenge of managing climate change and the likely impact of failure in this area on progress towards the MDGs are increasingly being appreciated. Derived from the challenge of climate change is a looming water crisis requiring urgent attention. Water is a fundamental input into the achievement of all the other MDGs. Lack of access to safe water affects sanitation and hygiene and is an important contributor to high mortality among children and the elderly. The continuing biodiversity crisis and consequent reduction in ecosystem functioning, goods and services, threatens to undermine efforts to reduce poverty, hunger and poor health, as well as undermining resilience to climate change, disasters caused by vulnerability to natural hazards,82 and other shocks. Greater attention can and must be paid to tackling the drivers of biodiversity decline, in order to improve environmental sustainability that underpins human wellbeing. In addition to the target on slum dwellers, other MDG 7 targets and their indicators (such as those on CO2 emissions, access to safe drinking water, and improved sanitation) have a distinctive urban relevance. The rapid growth of many cities in the developing countries highlights the urban sustainability challenge and needs a firm commitment for sustainable urbanization, as well as strategies that recognize the importance of urban-rural linkages. Need for stronger global partnerships and concerted efforts Effective responses to the multiple crisis and emerging issues have pointed to the need for enhanced cooperation, coordination and coherence at the regional and international levels and for stronger partnerships between developed and developing nations and between the private and public sectors. While policies must be centered at the national level, greater international and regional cooperation and support is needed to avoid cross-border strains and to strengthen combined and respective country capabilities. There are some positive signs that the international community is willing to tackle the emerging issues through negotiations towards a post-2012 climate change regime and by brining long-time neglected topics like sustainable agriculture, rural development and deforestation to the fore in the international agenda. The responses to the financial and economic crisis involved massive fiscal stimuli packages, with sizeable portions of these packages focused on support to health, education, agriculture, improved energy efficiency and the development of renewable sources of energy, resulting in job creation and therefore growth. This is a welcomed development. It is now clear that the multiple crises have provided a valuable opportunity for unprecedented investments in areas that are critical to human development and also a unique opportunity for world leaders to realize 81 82
Idem Including also geological hazards, such as tsunamis, earthquakes, landslides and volcanic eruptions
36
18 March 2010
that the only way to confront these worrisome global issues is through stronger global and regional partnerships and concerted efforts.
III. Conclusions and recommendations This report was drafted to provide analysis on and insight into those interventions and strategies that have been successful in facilitating progress toward achieving MDG 7 hoping that such strategies can guide and focus future efforts. However, the overall assessment is that the achievement of MDG 7 by 2015 is currently off track. One of the difficulties in making progress towards the overall MDG 7 objective is its fragmented nature, lacking an overarching framework or means of integrating different components of environmental sustainability. While MDG 7 contains elements that contribute to environmental sustainability, when added together, they do not provide a full picture. This weakness can be exacerbated at the national level if countries mechanically adopt the global set of targets and indicators without explicitly linking or tailoring them to national priorities and conditions. Comprehensive and coherent development planning frameworks, including national sustainable development strategies, are a useful means of integrating all of the aspects related to environmental sustainability that are relevant to any given country in a balanced manner. This is one of the conclusions drawn from the indicators that are making good progress. Other factors that have contributed to their success and that could provide useful elements for promoting success with regard to the indicators that are lagging behind include the following: • • • •
• • •
• • • • •
The adoption of national sustainable development plans and strategies that specifically include MDG 7 related targets and indicators; The inclusion of environmental sustainability in all development policies (including health, education, and employment) The inclusion of programmes related to these objectives in national budgets; The involvement of local and municipal authorities as well as all active engagement of all relevant stakeholders in the planning, programming and budgeting cycle to implement the national plans; Efforts to ensure that rural-urban linkages are adequately recognized and applied in national development strategies; The adoption of strong national legislation with mandatory targets and commitments towards the attainment of the objectives; The existence of strong international and/or regional frameworks that promote global partnerships, concerted and coordinated action and cooperation, fostering policy coherence with related and relevant frameworks including those on disaster risk reduction83 Strong international and/or regional (i.e. trans-boundary) regulatory frameworks; Fiscal investments for the attainment of the goals; Multilateral funding to supplement national resources; Economic incentives through public-private partnerships; and, National monitoring systems to track progress.
As well as being a goal in its own right, improving environmental sustainability also makes a critical contribution to the achievement of the other goals. To the degree that the MDG indicators illustrate the interaction between environment and development, the measurement of progress against indicators does not explicitly show that the poor suffer most from environmental degradation. Indicators on forestry and protected areas do not reflect critical changes affecting the poor such as 83
Such as the Hyogo Framework for Action 2005-2015: Building the Resilience of Nations and Communities to Disasters.
37
18 March 2010
land degradation and desertification, although improvements in protection and management of forests and other systems does address these issues and is of particular relevance to the rural poor who rely more directly on biodiversity and natural resources. Based on current trends the world will fall dramatically short of achieving the sanitation target. A concerted global effort will be required to make significant progress and drastic action will be required to meet this target. Climate change is perhaps the most urgent sustainable development challenge today as the environmental, social and economic impacts of global warming threaten to undo many of the development efforts being made while working to reach the targets set for the Millennium Development Goals. The intended message of this report is that targeted interventions and investments in environmental sustainability can have strong positive impacts. However, the record to date on progress indicates that countries and the international community have not committed the necessary investments to achieve MDG 7. All indicators with a few exceptions are off track, biodiversity and natural resources continue to be depleted at an alarming rate and overall the global environment’s capacity to sustain human development is increasingly compromised.
38
18 March 2010
REFERENCES Introduction Gilbert, N. (2009) Efforts to sustain biodiversity fall short. Nature 462, 263. Walpole, M et al. (2009) Tracking progress towards the 2010 biodiversity target and beyond. Science 325, 1503-4. 7.1 Proportion of Land Area covered by forest FAO 2006. Global forest resources assessment 2010 – Progress towards sustainable forest management. FAO Forestry Paper 147. FAO, Rome. UN Resolution 62/98, establishing the Non-Legally binding instrument on all types of forests: See: http://www.daff.gov.au/__data/assets/pdf_file/0018/1141092/non-legally-binding-instrument.pdf United Nations (2010), “Millennium Development Goals: Advances in the Sustainability of Development in Latin America and the Caribbean” Report of the Secretary-General, Regional cooperation in the economic, social and related fields, 23 May 2008, E/2008/15 Pp. 17, ECA Report on Assessing Progress in Africa towards the Millennium Development Goals Report 2008, E/ECA/COE/27/10. 7.3 Consumption of Ozone Depleting Substances Guus J.M. Velders, et al., The importance of the Montreal Protocol in protecting climate, 104 PROC. NAT’L. ACAD. SCI. 4814 (2007) Guus J. M. Velders et al., The large contribution of projected HFC emissions to future climate forcing, PROC. NAT’L. ACAD. SCI. Early Edition (22 June 2009) at http://www.pnas.org/content/early/2009/06/19/0902817106. 7.4 Proportion of fish stocks within safe biological limits Beddington, JR, DJ Agnew, and CW Clark. 2007. Current problems in the management of marine fisheries. Science volume 316:1713-1716. Canadian Special Publication of Fisheries and Aquatic Sciences 125, Guelph, Ontario, Canada, pp. 407–413. Castilla, JC, Manriquez, P., Alvarado, J., Rosson, A., Pino, C., Espoz, C., Soto, R., and Oliva, D. 1998. Artisanal ‘‘caletas’’ as units of production and comanagers of benthic invertebrates in Chile. In: Proceedings of the North Pacific Symposium on Invertebrate Stock Assessment and Management. Jamieson, G.S. and Campbell, A. (eds). Cunningham, S. and T. Bostock (eds). 2005. Successful fisheries management: issues, case studies and perspectives. Eburon, Delf, Netherlands. FAO (Food and Agriculture Organization). 2009. The State of world fisheries and aquaculture 2008. FAO, Rome. FAO (Food and Agriculture Organization). 2001. FIGIS Topics and Issues Fact Sheet: Fisheries Governance. Fishery Policy and Planning Division. FAO, Rome. Hilborn, R. 2007. Moving to sustainability by learning from successful fisheries. Ambio 36(4): 296-303. ICES. 2006. Report of the Baltic Fisheries Assessment Working Group). CM2006/ACFM:24, Copenhagen. Johannes, RE 2002. The renaissance of community-based marine resource management in Oceania. Ann. Rev. Ecol. System. 33, 317–340. Rosenberg, AA, JH Swasey, and M Bowman. 2006. Rebuilding US fisheries: progress and problems. Front Ecol Environ, 4(6):303–308. Wilson, D, R Curtotti, G Begg and K Phillips. Fishery Status Reports 2008 – Status of fish stocks and fisheries managed by the Australian government. World Bank and FAO (Food and Agriculture Organization). 2008. The Sunken Billions - The Economic Justification for Fisheries Reform. 7.5 Proportion of total water resources used ADB, CIDA, DANIDA, EC, GTZ, Irish Aid, IUCN, SEI, Sida, SIWI, SDC, UNDP, UNEP and WHO (2006). Linking Poverty Reduction and Water management. Poverty-Environment Partnership. GWP (2006), Setting the Stage for Change World Water Assessment Programme. 2009. The United Nations World Water Development Report 3: Water in a Changing World. Paris: UNESCO, and London: Earthscan UN-Water (2008a), Status Report on Integrated Water Resources Management and Water Efficiency Plans, Prepared for the 16th session of the Commission on Sustainable Development; available at: http://www.unwater.org/downloads/UNW_Status_Report_IWRM.pdf UN-Water (2008b) Road mapping for Advancing Integrated Water Management (IWRM) Processes; available at: http://www.unwater.org/downloads/UNW_ROADMAPPING_IWRM.pdf 7.6 Proportion of terrestrial and marine areas protected WDPA (www.wdpa.org)
39
18 March 2010
CBD National Report Analyzer (http://www.cbd.int/reports/analyzer.shtml) Chape S.,Spalding M., Jenkins M.D. (2008) The Worlds Protected Areas. Prepared by the UNEP World Conservation Monitoring Centre. University of California Press, Berkeley, USA. UNEP World Conservation Monitoring Centre. (2007) Millennium Development Goals. Indicator 26: Protected Areas Report. The Lavenham Press, UK. 7.7 Proportion of species threatened with extinction BirdLife Asia (2009) Safeguarding Important Bird Areas of natural heritage alongside economic development. Mongolia discussion papers. Washington DC: World Bank East Asia and Pacific Region Sustainable Development Department. Bubb, P. J., Butchart, S. H. M., Collen, B., Dublin, H., Kapos, V., Pollock, C., Stuart, S. N., Vié, J-C. (2009) IUCN Red List Index Guidance for National and Regional Use. IUCN, Gland, Switzerland. Butchart, S. H. M. (2008) Red List Indices to measure the sustainability of species use and impacts of invasive alien species. Bird Conserv. Internat. 18 (suppl.) 245-262. Butchart, S. H. M., Stattersfield, A. J. and Collar, N. J. (2006) How many bird extinctions have we prevented? Oryx 40: 266– 278. Butler, D, and Merton, D. (1992). The Black Robin. Oxford: Oxford University Press Emslie, R. and Brooks, M. 1999. African Rhino: Status Survey and Action Plan. IUCN, Gland, Switzerland. Genovesi, P., Butchart, S. H. M., McGeoch, M. A. and Roy, D. B. (in press) Indices of invasion: how to monitor invasive species. Pp. X-X in B. Collen, N. Pettorelli, S. Durant and J. E. M. Baillie, Eds. Biodiversity monitoring and conservation: bridging the gaps between global commitment and local action. Wiley-Blackwell, Cambridge. Haigen Xu, Xiaoping Tang, Jiyuan Liu, Hui Ding, Jun Wu, Ming Zhang, Qingwen Yang, Lei Cai, Haijun Zhao and Yan Liu (2009) China's progress toward the significant reduction of the rate of biodiversity loss. BioScience 59: 843-852. Hilton-Taylor, C., Pollock, C., Chanson, J., Butchart, S. H. M., Oldfield, T. and Katariya, V. (2008) Status of the world’s species. Pp 15–42 in: J.-C. Vié, C. Hilton-Taylor and S. N. Stuart (eds). The 2008 review of the IUCN Red List of Threatened Species. Gland, Switzerland: IUCN. IUCN (2008) Alytes muletensis. IUCN Red List of Threatened Species. Available at www.iucnredlist.org. McGeoch, M. A., Butchart, S. H. M., Spear, D., Marais, E., Kleynhans, E. J., Symes, A., Chanson, J. and Hoffmann, M. (submitted) Global indicators of biological invasion: species numbers, biodiversity impact and policy responses. Diversity and Distributions. Nielsen, John (2006). Condor: To the Brink and Back—The Life and Times of One Giant Bird. New York: Harper Perennial Quayle, J. F., Ramsay, L. R. and Fraser, D. F. (2007) Trend in the Status of Breeding Bird Fauna in British Columbia, Canada, Based on the IUCN Red List Index Method. Conserv Biol. 21(5): 1241-1247. Randrianasolo, H. H., Andriamaro, L., Brooks, T. M., Butchart, S. H. M., Crosse, W., Hawkins, A. F. A., Langhammer, P. F., Kennedy, E. T., Knox, D. H., Miller, L., Musinsky, J., Rabarison, H., Rakotobe, Z. L. and Steininger, M. (submitted) Monitoring indicators detect changes in the status of Madagascar’s terrestrial biodiversity over two decades. Conservation Biology. Roelle, J. E., Miller, B. J., Godbey, J. L. and Biggins, D. E. 2006. Recovery of the Black-footed Ferret--Progress and Continuing Challenges: U.S. Geological Survey Scientific Investigations. Russo, G. (2009) Biodiversity’s bright spot. Nature 462: 266-269. 7.9 Proportion of population using improved sanitation World Health Organization and United Nations Children’s Fund Joint Monitoring Programme for Water Supply and Sanitation (2010), Progress on Drinking Water and Sanitation, 2010 Update, WHO/UNICEF JMP. UN Water (2008) Tackling a global crisis: International Year of Sanitation. Cairncross (2004), The Case for Marketing Sanitation. Water & Sanitation Programme. World Bank, Nairobi UNICEF (2009), Soap, toilets and taps. A foundation for healthy children. How UNICEF supports water, sanitation and hygiene. New York. Marion W. Jenkins and Steven Sugden 2008. Rethinking Sanitation: Lessons and Innovation for Sustainability and Success in the New Millennium. UNDP Human Development Report 2006. Occassional Paper. Human Development Report Office.
40