Juha Saranen ENHANCING THE EFFICIENCY OF FREIGHT TRANSPORT BY USING SIMULATION
Thesis for the degree of Doctor of Science (Technology) to be presented with due permission for public examination and criticism in the Kouvola-talo, Varuskuntakatu 11, Kouvola, Finland, on the 17th of June, 2009, at noon.
Acta Universitatis Lappeenrantaensis 342
11
Supervisor
Professor Olli-Pekka Hilmola, Lappeenranta University of Technology, Kouvola Unit, Finland
Reviewers
Professor Petri Helo, University of Vaasa, Logistics Systems Research Group, Finland Professor Timo Lainema, Turku School of Economics, Department of Management, Information Systems Science, Finland
Opponent
Professor Angappa Gunasekaran, University of Massachusetts – Dartmouth, Department of Decision and Information Sciences, Charlton College of Business, United States of America
ISBN 978-952-214-748-6 ISBN 978-952-214-749-3 (PDF) ISSN 1456-4491 Lappeenrannan teknillinen yliopisto Digipaino 2009
2
2
Abstract Saranen Juha ENHANCING THE EFFICIENCY OF FREIGHT TRANSPORT BY USING SIMULATION
Lappeenranta 2009 89 pages, 22 figures, 6 tables Acta Universitatis Lappeenrantaensis 342 Dissertation, Lappeenranta University of Technology ISBN 978-952-214-748-6, 978-952-214-749-3 (PDF), ISSN 1456-4491 The role of transport in the economy is twofold. As a sector of economic activity it contributes to a share of national income. On the other hand, improvements in transport infrastructure create room for accelerated economic growth. As a means to support railways as a safe and environmentally friendly transportation mode, the EU legislation has required the opening of domestic railway freight for competition from beginning of year 2007. The importance of railways as a mode of transport has been great in Finland, as a larger share of freight has been carried on rails than in Europe on average. In this thesis it is claimed that the efficiency of goods transport can be enhanced by service specific investments. Furthermore, it is stressed that simulation can and should be used to evaluate the cost-efficiency of transport systems on operational level, as well as to assess transportation infrastructure investments. In all the studied cases notable efficiency improvements were found. For example in distribution, home delivery of groceries can be almost twice as cost efficient as the current practice of visiting the store. The majority of the cases concentrated on railway freight. In timber transportation, the item with the largest annual transport volume in domestic railway freight in Finland, the transportation cost could be reduced most substantially. Also in international timber procurement, the utilization of railway wagons could be improved by combining complementary flows. The efficiency improvements also have positive environmental effects; a large part of road transit could be moved to rails annually. If impacts of freight transport are included in cost-benefit analysis of railway investments, up to 50 % increase in the net benefits of the evaluated alternatives can be experienced, avoiding a possible inbuilt bias in the assessment framework, and thus increasing the efficiency of national investments in transportation infrastructure. Transportation systems are a typical example of complex real world systems that cannot be analysed realistically by analytical methods, whereas simulation allows inclusion of dynamics and the level of detail required. Regarding simulation as a viable tool for assessing the efficiency of transportation systems finds support also in the international survey conducted for railway freight operators; operators use operations research methods widely for planning purposes, while simulation is applied only by the larger operators. Keywords: simulation, transportation, distribution, efficiency, mathematical modeling, CBA UDC 656: 65.011.4: 516.866
3
3
Articles The thesis consists of an introductory part and the following articles: (1)
Artto, K. A., Lehtonen, J-M. and Saranen, J. (2001). Managing projects front-end: incorporating a strategic early view to project management with simulation. International Journal of Project Management. 19 (5) 255-264.
(2)
Punakivi, M. and Saranen, J. (2001). Identifying the success factors in e-grocery home delivery. International Journal of Retail & Distribution Management.29 (4) 156 –163.
(3)
Saranen, J. and Hilmola, O-P. (2007). Evaluating the competitiveness of railways in timber transports with discrete event simulation. World Review of Intermodal Transportation Research, 1 (4) 445-458.
(4)
Saranen, J., Hilmola, O-P. and Toikka, T. (2008). Evaluating Different Railway Wagon Alternatives for Timber Transportation by Discrete Event Simulation ASME 2008 int. conference, Wilmington U.S.A., 22-23.4.2008.
(5)
Saranen, J. and Hilmola, O-P. (2009). The role of freight transport in railway network investment evaluation. International Journal of Industrial and Systems Engineering, forthcoming 4 (4) 455-570.
(6)
Saranen, J. (2008/2009). Enhancing the efficiency of railways by multi-use of wagons. International Journal of Management and Enterprise Development (article accepted, forthcoming).
4
4
Contribution of the author Article I deals with project management by introducing discrete event simulation as a tool to support major decisions associated with early management of project product content. The present author had sole responsibility for designing and conducting the research in two of the four cases included in the article. Additional contribution of the author concentrated mainly on the literature review of discrete event simulation, while the main contributors of the article are Dr Artto and Dr Lehtonen. Article II on identifying the cost structures of different e-grocery home delivery concepts is a result of the research work carried out in the Ecomlog project at Helsinki University of Technology. Both authors contributed equally to constructing the conceptual home delivery framework presented in the article. The present author had main responsibility for the simulation methodology and analyses, which were utilized to evaluate different home delivery concepts. The responsibility for coordinating the article is credited to the first author, Dr Mikko Punakivi. Article III is based on an earlier research project concentrating on timber transportation cost on rails, in which the author was responsible for the overall design of the simulation framework, as well as for conducting the specific analyses. In writing the article, the simulation study belonged predominantly in his expertise, while Dr Hilmola was the main contributor providing the research background and managing the writing process. Article IV was initiated by Dr Hilmola and was conducted in connection with a research project concentrating on finding optimal rail wagon types for serving different freight flows. The present author was responsible for the methodological part of the research, including planning, designing, conducting and reporting about the simulation analyses, while the research background and the initial identification of the alternative wagon types to be evaluated was based on earlier work of the other authors. In Article V, the present author was the main contributor. The article is related with an earlier cost-benefit analysis project, where a modified version of the simulation framework developed by the author in Article III was used. The present author had responsibility for
5
5
specifying the modifications in the framework with subject matter experts from the Finnish Rail Administration, as well as conducting the analyses. In writing the article, the present author was mainly responsible for the simulation study and conclusions, and partly for the research background. Both authors contributed equally to the writing process. In Article VI, which elaborates on the analysis of Article IV, the present author was the only contributor.
6
6
Acknowledgements First and foremost, I would like to thank my supervisor professor, Olli-Pekka Hilmola for his invaluable support during this process. Without his encouragement this research process would not have been completed. Additionally, I would like to thank the pre-examiners, professors Petri Helo and Timo Lainema. Their comments have helped me in focusing on the essence of an academic thesis and seeing my simulation studies in a broader context. As it has been a long journey, many people have contributed to the research related to this study. I owe a special thanks to all my co-authors: Karlos Artto, Juha-Matti Lehtonen, Mikko Punakivi, Olli-Pekka Hilmola and Tero Toikka. Especially, I want to thank Juha-Matti for recruiting me in the ELITE project at Helsinki University of Technology back in 1997. From HUT I should also mention Jan Holmström and Kari Tanskanen. I collectively also thank my former colleagues at Delfoi and Rautatielogistiikan Kehittämiskeskus. I also wish to thank the Finnish Doctoral Program in Industrial Engineering and Management for providing me the financial means to finish this thesis. I would especially like to express my gratitude to our dean, professor Markku Tuominen, whose support for my research work at Lappeenranta University of Technology has been essential. Without the example set by my parents, Jukka and Marjatta, I would probably not be writing these acknowledgements. I would also like to thank my wife Mia for supporting me during the process. To our sons Aarni and Eino, I hope that you will never loose your enthusiasm and curiosity in life. Otaniemi, May 2009 Juha Saranen
7
7
List of tables: Table 1: Finnish-Russian trade and transit flows (1000 ton) ............................................... 24 Table 2: Eastbound transit containers handled by the Finnish ports (TEU) ......................... 24 Table 3: Comparison of different techniques (Guedes, 1995 ; Seppälä, 1995)..................... 28 Table 4: Use of different development methods (n=14)...................................................... 68 Table 5: Cross table of the use of different development methods (n=12)........................... 69 Table 6: Managerial implications from the articles............................................................. 75 List of figures: Figure 1: Evolution of freight volumes in the EU-25, 1995-2005 (European Union, 2006) . 18 Figure 2: Modal split of inland freight tonne-km within EU25 (Eurostat, 2008).................. 20 Figure 3: Modal split of inland freight tonne-km in Finland (Eurostat, 2008)...................... 22 Figure 4: Baltic Sea region rail network (Finnish Rail Administration, 2006) ..................... 23 Figure 5: Ways to study a system (Law, 2006, 4)............................................................... 25 Figure 6: Problem solving tool selection process (Stevenson, 2007, 861) ........................... 26 Figure 7: Elements of a simulation analysis (Hoover & Perry, 1989).................................. 31 Figure 8: Model validity as a function of modelling time (Law, 1998)................................ 34 Figure 9: Time line of the study......................................................................................... 43 Figure 10: Classification of the research articles in the Neilimo&Näsi framework (1980)... 45 Figure 11: Histogram of the employees ............................................................................. 65 Figure 12: Histogram of the wagons.................................................................................. 65 Figure 13: Histogram of the locomotives ........................................................................... 65 Figure 14: Services supplied by the operators .................................................................... 66 Figure 15: Outsourced activities ........................................................................................ 67 Figure 16: Collaboration with other operators.................................................................... 67 Figure 17: Development tools used.................................................................................... 69 Figure 18: Descriptive statistics of the companies, based on the use of simulation.............. 69 Figure 19: Output of the Wilcoxon rank sum test based on the use of simulation ................ 71 Figure 20: Share of rail freight .......................................................................................... 72 Figure 21: Future threats for the operators ......................................................................... 73 Figure 22: Planning and development goals....................................................................... 73
8
8
TABLE OF CONTENTS: PART I: 1
2
3
INTRODUCTION................................................................................................... 13 1.1
MOTIVATION FOR THE RESEARCH ........................................................................ 13
1.2
RESEARCH OBJECTIVE AND RESEARCH QUESTIONS ............................................... 14
THE ROLE OF TRANSPORT IN ECONOMIC ACTIVITY ............................... 17 2.1
TRANSPORT IN THE ECONOMY ............................................................................. 17
2.2
THE ROLE OF TRANSPORT IN SUPPLY CHAIN MANAGEMENT .................................. 18
2.3
THE ROLE OF TRANSPORT AND RAILWAYS IN EUROPE .......................................... 19
2.4
RAIL INFRASTRUCTURE OWNERSHIP AND INVESTMENT EVALUATION .................... 20
2.5
RAIL TRANSPORT MARKET IN FINLAND................................................................ 21
2.6
FREIGHT TRAFFIC ON THE FINNISH-RUSSIAN BORDER .......................................... 23
SIMULATION AS PROBLEM SOLVING TOOL ................................................ 25 3.1 3.1.1
Optimization .............................................................................................. 27
3.1.2
Heuristics .................................................................................................. 27
3.1.3
Spreadsheet models.................................................................................... 28
3.1.4
The characteristics of different techniques .................................................. 28
3.2
4
9
MATHEMATICAL TECHNIQUES............................................................................. 26
DISCRETE-EVENT SIMULATION ............................................................................ 29
3.2.1
Different kinds of simulation models........................................................... 29
3.2.2
Overview of simulation projects.................................................................. 31
3.2.3
Stochastic behaviour in simulation modelling ............................................. 36
3.2.4
Limitations of simulation............................................................................ 40
3.2.5
Recent applications of simulation in transport system analysis.................... 41
METHODOLOGY.................................................................................................. 43 4.1
TIME LINE OF THE STUDY .................................................................................... 43
4.2
METHODOLOGICAL APPROACH OF THE STUDY ..................................................... 45
9
5
SUMMARY OF THE ORIGINAL PAPERS.......................................................... 49 5.1
ARTICLE I: MANAGING PROJECTS FRONT-END: INCORPORATING A STRATEGIC EARLY
VIEW TO PROJECT MANAGEMENT WITH SIMULATION ........................................................ 49
5.1.1
Literature review........................................................................................ 49
5.1.2
Empirical study.......................................................................................... 50
5.1.3
Conclusion and contribution ...................................................................... 50
5.2
ARTICLE II: IDENTIFYING THE SUCCESS FACTORS IN E-GROCERY HOME DELIVERY . 51
5.2.1
Literature review........................................................................................ 51
5.2.2
Empirical study.......................................................................................... 51
5.2.3
Conclusion and contribution ...................................................................... 52
5.3
ARTICLE III: EVALUATING THE COMPETITIVENESS OF RAILWAYS IN TIMBER
TRANSPORTS WITH DISCRETE-EVENT SIMULATION ........................................................... 53
5.3.1
Literature review........................................................................................ 53
5.3.2
Empirical study.......................................................................................... 53
5.3.3
Conclusion and contribution ...................................................................... 55
5.4
ARTICLE IV: EVALUATING DIFFERENT RAILWAY WAGON ALTERNATIVES FOR
TIMBER TRANSPORTATION BY DISCRETE EVENT SIMULATION ........................................... 55
5.4.1
Literature review........................................................................................ 55
5.4.2
Empirical study.......................................................................................... 56
5.4.3
Conclusion and contribution ...................................................................... 57
5.5
ARTICLE V: THE ROLE OF FREIGHT TRANSPORT IN RAILWAY NETWORK INVESTMENT
EVALUATION ................................................................................................................. 57
5.5.1
Literature review........................................................................................ 58
5.5.2
Empirical study.......................................................................................... 58
5.5.3
Conclusion and contribution ...................................................................... 60
5.6
ARTICLE VI: ENHANCING THE EFFICIENCY OF RAILWAYS BY MULTI-USE OF WAGONS .......................................................................................................................... 60
6
5.6.1
Literature review........................................................................................ 61
5.6.2
Empirical study.......................................................................................... 61
5.6.3
Conclusion and contribution ...................................................................... 61
VERIFICATION OF THE RESULTS THROUGH AN INTERNATIONAL
SURVEY FOR RAILWAY FREIGHT OPERATORS.................................................. 63
10
10
6.1
BACKGROUND DATA .......................................................................................... 64
6.2
SERVICES SUPPLIED, OUTSOURCING AND COLLABORATION ................................... 66
6.3
PLANNING AND DEVELOPMENT TOOLS ................................................................. 68
6.4
OUTLOOK AND GOALS OF PLANNING AND DEVELOPMENT ..................................... 72
6.5
CONCLUSION OF THE SURVEY: RELEVANCE OF THE STUDY ................................... 74
7
MANAGERIAL IMPLICATIONS......................................................................... 75
8
CONCLUSIONS ..................................................................................................... 80 8.1
LIMITATIONS OF THE STUDY ............................................................................... 82
8.2
FURTHER RESEARCH ........................................................................................... 83
REFERENCES
11
11
PART II: PUBLICATIONS APPENDIX 1: INTERNATIONAL SURVEY FOR RAILWAY FREIGHT OPERATORS
12
12
1 1.1
INTRODUCTION Motivation for the research
The role of transport in the economy is twofold. As a sector of economic activity, it contributes to a share of national income. Furthermore, it provides means to realizing that output; improvements in transport infrastructure create room for accelerated economic growth (Quinet and Vickermann, 2004). Within the EU, transport accounts for 6.9 percent of national output. Although differences exist nationally, the general trend has been a declining share of railway freight (Eurostat, 2008). According to Hilmola and Szekely (2006), one reason for the decline has been the lacking support for international trade. As EU regards railways as a safe and environmentally friendly mode of transport, one target of EU transport policy is to shift more long-distance road journeys and short-distance air journeys onto railways. Furthermore, railways could ease the congestion on roads and air transportation (European Union, 2006). To support this policy, EU legislation has required allowing competition on railway freight from the beginning of 2007. According to Hilmola (2007), railways are globally subject to tremendous change due to privatization and deregulation. According to Cantos and Campos (2005), the monopolistic rail company is progressively disappearing as the dominant model around the world. Although domestic railway freight has been under free competition also in Finland from the beginning of the year 2007 (Mäkitalo, 2007), the governmentally owned VR has remained the only operator (situation in December 2008). According to Mäkitalo (2007), the greatest barriers to entry have been railway stock acquisition and the difficulty of accessing the services. The relative share of rail freight in Finland has been higher than in Europe on average; in 2007, 25.9 percent of the ton kilometers were transported by rail, while the European (EU25) average was 17.4 percent (Eurostat, 2008).
1313 13
The efficiency of the transportation systems does not depend only of the services provided, but also of the infrastructure enabling the services. According to Hilmola, Ujvari and Szekely (2007), in the USA the rail tracks are owned by the leading railway freight operators (see also: Vassallo, 2005), while in Japan the ownership is in the hands of passenger transportation companies (Obermauer, 2001). In Europe, the railway infrastructure is still typically owned by the national authorities (Hilmola et al., 2007). According to GrantMuller, MacKie, Nellthorp and Pearman (2001), the most widely used framework for railway investment evaluations is cost-benefit analysis. There are national differences in terms of what effects are included in the cost-benefit analysis framework, how they are measured and valued. Weisbrod (2008) distinguishes between travel efficiency benefits, full user benefits, social benefits and economic development benefits of transportation projects. A private company evaluates projects based on full user benefits, while national authorities focus on wider social benefits when evaluating transportation projects. If the framework used includes a systematic bias, there is a danger that the decision making will lead to socio-economically inefficient investments.
1.2
Research objective and research questions
The objective of this thesis is to contribute to the efficiency of freight transportation concerning both rail and road. The overall research problem can be stated as: How does service specifity of investments affect the efficiency of freight transport systems? The study consists of six publications, where simulation is applied in examining different aspects of goods transport. The overall research problem is addressed through the following six specific research questions: 1.
Can discrete-event simulation be used in early project definition in transportation system analysis?
2.
What is the cost level of different grocery home delivery concepts?
3.
Could the ‘unit train’concept be economically feasible in timber transportation?
4.
What is the role of freight transport in railway investment analysis?
5.
Can the efficiency of railway freight on the Finnish-Russian border be enhanced by multi-use of wagons?
1414
6.
To what extent can the eastbound container transit traffic on roads be reduced by shifting transport to rails by combining multi-use of wagons on rails?
In addition to the specific research questions addressed in the articles, an international survey for railway operators was conducted in order to explore the current status of using simulation as a decision-making tool in the railway context. The results have been used for triangulation purposes to verify the relevance of using simulation in transportation system analysis and the specific research questions of the articles. The interest in surveying the current status of the planning operations of railway operators is threefold. In comparison to road transport railways produce less green house gas emissions and thus offer a more environmentally friendly transportation alternative. Secondly, competition in rail freight has been opened in Europe and Finland recently. Due to this liberalization, railway freight in Europe will probably undergo a similar evolution as experienced earlier in road and air transportation. In air transport, the evolution has resulted in a wider service portfolio, initiated new kinds of operators specializing in different kinds of services (e.g. low cost operators), and caused changes in the networks used for carrying out the services (from point-to-point connections to hub-and-spoke networks) (Quinet and Vickermann, 2004). In the United States, where railway competition and liberalization started already in the early 1980’s, this evolution has led to improvements in the efficiency of railway carriers (Hilmola et al., 2007). Thirdly, the majority of the articles included in the thesis are connected to railway transportation. Focusing the research effort mainly on railways was induced by two factors mentioned above: the recent liberalization of the sector in European context, which enables the further evolution of the railway sector, and the ecofriendliness of the transportation mode in relative terms. Because of its complexity, simulation is sometimes referred to as the last resort when selecting problem solving tools (Law 2006; Stevenson 2007). Therefore, the use of the method needs to be justified. According to Banks et al. (2005), the applications of simulation in transportation systems are vast (recent examples can be found e.g. in: Tervonen et al., 2008; Rijsenbrij & Ottjes, 2007; Coleno, 2008; de Jong & Ben-Akiva, 2007; Godwin et al. 2008; Kidokoro, 2006). Transportation systems are a typical example of complex real-world
1515
systems, which cannot be described accurately by analytic methods. Ujvari and Hilmola (2006) show explicitly in Automated Guided Vehicle context that minor system details, which can be incorporated in to a simulation model, but typically cannot be dealt with by other tools, can have a major impact on system performance. According to Ujvari and Hilmola (2006), such features include e.g. the control and loading logic applied as well as physical properties of the transportation system. The six publications included in this thesis demonstrate the wide applicability of simulation in examining a variety of aspects of transport systems, from a feasibility study of a single service provider to evaluation of national transportation infrastructure investments.
1616
2
THE
ROLE
OF
TRANSPORT
IN
ECONOMIC
ACTIVITY
2.1
Transport in the economy
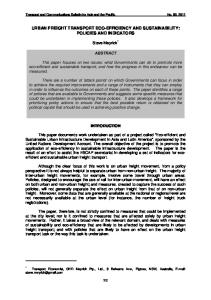
The role of transport in the economy is twofold. As a sector of economic activity, it contributes to a share of national income. Furthermore, it provides means to realising that output. As derived demand, the growth of transport follows the trend of general economic activity. On the other hand, improvements in transport infrastructure create room for accelerated economic growth. (Quinet and Vickermann, 2004) According to Rodrigue (2006), improvements in transport and distribution have contributed to significant changes in the geographies of production. Furthermore, Gulyani (2001) argues that a poor transportation system might lead to geographical clustering of manufacturing industries. The state of the transport system has also affected population growth in different geographical areas; highways have typically been advantageous for population growth. Railroad has even been identified as the most significant contributor to the settlement of the western parts of the United States (White, 2008). Within the EU, transport accounts for 6.9 percent of national output (Eurostat, 2008). The share was diminished at one point, but recently the growth in transport has exceeded the growth of national output (Quinet and Vickermann, 2004). Although differences at national level exist, the general trend has been a diminishing modal share of rail as can be seen in Figure 1, which presents the evolution of freight transport within the EU-25 between the years 1995 and 2005 (European Union, 2006).
1717
40 35
Increase (%)
30 25 20 15 10 5 0 Road
Rail
Inland waterways
Oil pipelines
Sea
Air
Figure 1: Evolution of freight volumes in the EU-25, 1995-2005 (European Union, 2006) The net effect of transport on the national budget is hard to determine. On one hand governments subsidise different transport modes, on the other hand they receive income from transport. (Quinet and Vickermann, 2004)
2.2
The role of transport in supply chain management
According to Naim et al. (2006), transport is a key function in the supply chain, as it acts as a physical link between customers and suppliers, enabling the flow of materials and resources. According to Bowersox et al. (2007), transport systems should be designed based on minimizing the total cost. Gulyani (2001) suggests that a poor transportation system affects total logistics cost in a supply chain, not only directly through higher transportation cost, but more importantly via high inventory levels, which are needed to overcome the unreliability and inefficiency in supply.
According to Vieillescazes (2007), the degree of flexibility of carriers is partly dependent on the degree of uncertainty of the transport infrastructure. The bullwhip effect, also known as the Forrester effect, describes a phenomenon where orders to the supplier tend to have larger variance than sales to the buyer (Bayraktar et al., 2008), i.e. the variance of demand is
1818
amplified when one moves up a supply chain (Chen et al., 2000). According to Towill (2005), bullwhip affects the need of transportation capacity even more than the actual demand amplification is. Potter and Lalwani (2008) have also found that demand amplification leads to reduction in transport performance. However, they also claim that transportation management might have an impact on demand amplification. According to Baker (2007), inventory is a common risk mitigation strategy against the possibility of random demand variability and transportation delays. When the transportation distances are longer, the typical transportation batch is increased. The state of the transportation system can also limit the choice of alternative production strategies, as some production strategies rely on reliable transport (Wu, 2003). Transportation systems have traditionally offered a fruitful application area for operations research. Mason et al. (2007) identify transport management techniques that can be used to reduce
transport
cost,
including
consolidation,
rational
routing
and
combining
complementary flows. Reported synergies reduce transportation cost from 23 to 30 percent (Cruissen et al., 2007). 2.3
The role of transport and railways in Europe
The demand for more reliable transport was initiated by the industrial revolution in the latter part of the 18th century. In the beginning, this growing demand was satisfied by building canals. However, the industrial revolution provided also means to improve transportation: rail transport began in Europe in the 1820’s. The importance of railways as a land transport mode was reduced only after trucks with internal combustion engine gained dominance in the 1930’s. (Quinet and Vickermann, 2004)
The share of railway transport has been in decline; since 1970, its market share has fallen from 10 to 6 % for passenger traffic and from 21 to 8 % for total freight (European Union, 2006). Figure 2 presents the evolution of the modal split of inland freight within the EU25 during the period 1996-2007 (Eurostat, 2008). During the last decade, the railways have lost one fourth of their share, while road transport has gained more ground.
1919
90 80 70
Share (%)
60 Road
50
Rail 40
Inland w aterw ays
30 20 10 0 1996
1997
1998
1999
2000
2001
2002
2003
2004
2005
2006
2007
Figure 2: Modal split of inland freight tonne-km within EU25 (Eurostat, 2008)
Railways have unique advantages as a safe and environmentally friendly mode of transport. One target of the EU transport policy is to shift more long-distance road journeys and shortdistance air journeys onto railways. If rail transport can be revitalised, it will offer a real alternative to the congested road and air transport. (European Union, 2006) 2.4
Rail infrastructure ownership and investment evaluation
According to Gorman (2007), the nature of infrastructure ownership is significant when evaluating new investment plans. Weisbrod (2008) distinguishes between travel efficiency benefits, full user benefits, social benefits, and economic development benefits of transportation projects. A private company evaluates projects based on full user benefits, while national authorities focus on wider social benefits when evaluating transportation projects.
2020
In the US rail tracks are owned by the leading railway freight operators (Hilmola et al., 2007; Vassallo, 2005), while in Japan and China the ownership is in the hands of passenger transportation companies (Obermauer, 2001). In Europe, railway infrastructure is still typically owned the national authorities (Hilmola et al., 2007), and the most widely used framework for railway investment evaluation is cost-benefit analysis (CBA), which is also applied in New Zealand. There are national differences in terms of what effects are included in the cost-benefit analysis framework, and how they are measured and valued (Grant-Muller et al., 2001). 2.5
Rail transport market in Finland
Figure 3 presents the evolution of the modal split of inland freight in Finland during the period 1990-2007 (Eurostat, 2008). The relative share of rail freight in Finland has been higher than in Europe on average; in 2007 25.9 percent of the tonne kilometers were transported by rail, while the European average was 17.4 percent (EU25). Finland is one of the most important pulp producing countries in Europe (CEPI, 2006). Being bulk, forest industry raw materials and end products are ideal items to be transported on rails. In total, the forest industry counts for approx. 60 % of railway freight consumption in Finland (e.g. Iikkanen & Varjola, 2002). Although timber takes 2/3 of this share, it should be noted that railways are currently competitive only on longer transportation distances; while the average transportation distance of round wood on roads is 106 kilometers, it is 264 kilometers on railways. As a consequence, only 21 percent of the domestic round wood volumes transported to the mills involve transportation by rail (Kariniemi, 2008).
2121
90 80 70
Share (%)
60 Road
50
Rail Inland waterways
40 30 20 10 0 1990199119921993199419951996199719981999200020012002 20032004200520062007
Figure 3: Modal split of inland freight tonne-km in Finland (Eurostat, 2008) Figure 4 presents the rail network and gauge used around the Baltic Sea (Finnish Rail Administration, 2006). As can be noted, Finland shares the same gauge with the former Soviet Union countries. This enables using same railway cars in eastern traffic. However, because of different electrical systems, locomotives need to be changed while crossing the border.
2222
Figure 4: Baltic Sea region rail network (Finnish Rail Administration, 2006) Although domestic railway freight has been under free competition in Finland from the beginning of the year 2007 (Mäkitalo, 2007), the governmentally owned VR has remained the only operator (situation in December 2008). According to Mäkitalo (2007), the greatest barriers to entry have been railway stock acquisition and the difficulty of accessing the services. Because of the differences in gauge and electrical specification in the national rail networks, a market for used equipment that would comply with the Finnish system does not exist. Furthermore, there is a national contract that gives monopoly to VR and Russian Railways (RZD) in the traffic across the Russian border (see e.g. Kirjavainen et al., 2002).
2.6
Freight traffic on the Finnish-Russian border
Finland and Sweden are the two most important pulp producing countries in Europe (CEPI, 2001; CEPI, 2003; CEPI, 2006), accounting for nearly 60 % of the total production. In 2005, Finnish wood gathering recorded 52.1 million m3. In the same year, the total amount of wood
2323
imported to Finland was 21.5 million m3, with an increase of 23 percent compared to the previous year. The amount of wood imported from Russia has risen steadily, and it is a source for 79 percent of wood imported to Finland (Finnish Forrest Research Institute, 2006). Rails favour wood transports, and 59 percent of Russian wood is transported by rail. Table 1 (Finnish National Board of Customs, 2007a; 2007b) shows that a disparity between the modes of transportation between Russia and Finland exists. Especially rail transport has idle capacity in the eastbound direction. The transit flow is due to the insufficient capacity of the Russian ports to handle the ever-increasing demand for imports. Finnish ports are used for unloading the cargo and the goods are transported to Russia by road. Table 2 shows the eastbound transit container volumes handled by the Finnish ports (Finnish Port Association, 2008). Table 1: Finnish-Russian trade and transit flows (1000 ton) 2004 Import Export Transit 2005 Import Export Transit 2006 Import Export Transit
Water 15866 160
Rail 10054 408
Water 14372 115
Rail 10685 372
Water 14223 146
Rail 10725 521
Road 3941 1363 2336 Road 4274 1554 2640 Road 4096 1649 2946
Air 0 0
Other 3365 0
Air 0 1
Other 3068 2
Air 0 1
Other 3313 6
Total 33226 1932 2336 Total 32399 2045 2640 Total 32358 2324 2946
Table 2: Eastbound transit containers handled by the Finnish ports (TEU) Year TEU
2003 223 652
2004 264 846
2005 276 364
2006 275 956
2007 345 809
According to Ruutikainen and Hunt (2007), the share of Finland in Russian transit transport is likely to decrease, but the absolute volume is expected to grow.
2424
3
SIMULATION AS PROBLEM SOLVING TOOL
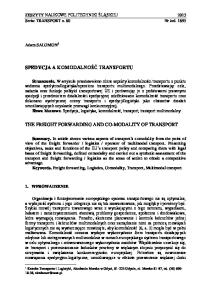
A system is a collection of entities that act and interact together toward the accomplishment of some logical end. How the boundaries of a system are defined, depends on the objectives of the particular study (Banks et al., 2005). According to Law (2006), the ways to study a system can be classified as presented in Figure 5.
System
Experiment with the actual system
Experiment with a model of the system
Mathematical model
Physical model
Analytical solution
Simulation
Figure 5: Ways to study a system (Law, 2006, 4)
If it is feasible and cost effective to experiment with the actual system, this is the desirable way to go. This is recommended for reasons of relevance. Sometimes the system under study cannot be disturbed or does not even exist. An example of physical (also iconic) models are the clay cars used in wind tunnels. Mathematical models represent a system in logical or quantitative relationships, which can be altered to see how the system reacts under different conditions. Guedes (1995) mentions also analog models that use other physical properties to model a system.
2525
If the mathematical model is simple enough to be solved exactly, this solution is called an analytic solution. If an analytical solution to the mathematical model is available and it is computationally efficient, it is usually preferred over simulation because it is optimal. Law (2006) refers to simulation as the last resort. The same idea can be found behind the problem solving tool selection process presented by Stevenson (2007), which is presented in Figure 6.
Define the problem
Is an intuitive solution acceptable?
Yes
Use the intuitive solution
No
Is an analytical model available?
Yes
Use the model
No Can an analytical model be developed?
Yes Use the model
No Is simulation economically justified?
Yes Use simulation
No Rely on judgment and experience
Figure 6: Problem solving tool selection process (Stevenson, 2007, 861)
According to Stevenson (2007), simulation should be applied only if analytical solutions are not available.
3.1
Mathematical techniques
The main Operations Research techniques are optimization, heuristics, and simulation. There are also simple symbolic replications (Bowersox et al., 1986), which can be presented on
2626
spreadsheets in computerized form. Guedes (1995) defines hybrid models, which combine simulation and optimizing algorithms in one model.
3.1.1
Optimization
Following the notation presented in Figure 5, optimization techniques are mathematical techniques that arrive at an analytical solution. (Law, 2006) One class of optimization techniques are Linear Programming (LP) models. In LP, a linear objective function subject to linear constraints is to be optimized. LP models can handle only linear costs and linear decision variables. In Integer Programming all decision variables are of the discrete integer type. If some of the decision variables are continuous, the technique to be used is called Mixed Integer Programming (MIP) (Guedes, 1995). According to Bowersox et al. (2007), MIP-models are the most commonly used optimization models in the field of logistics. Such models typically deal with aggregate material flows (continuous) and potential intermediate warehouse locations (integer). 3.1.2
Heuristics
A heuristic solution comprises a rule, which restricts the number of alternative solutions to a problem. The heuristic approach to problem solving attempts to maintain the level of detail of simulations, while offering the best solution search capability of optimization approaches (Ballou, 1989). Heuristic models can be used to solve more complex and less well-structured problems than optimization (Guedes, 1995). The heuristic approach can be used when the problem solving method has to provide search capability, ruling out simulation, and when no optimization method exists or the problem cannot be solved within given time limits. According to Bowersox et al. (2007), routing problems have historically been computationally too complex to be solved analytically.
2727
3.1.3
Spreadsheet models
Spreadsheet refers to the way the techniques are presented in computerized form. According to Bowersox et al. (1986), these techniques include comparative analysis, break-even analysis and flow charting. In comparative analysis, the alternative courses of action are evaluated by their comparative cost, which are computed by identifying different cost types and summing them up. Comparative analysis is limited to alternatives explicitly chosen to be evaluated. It is static by nature and has limited capability to deal with different volume levels efficiently. The main difference between break-even analysis and comparative analysis is that in the former, some of the cost types are functions of the decision variable(s). The cost functions of different alternatives are constructed and solved for possible break-point volumes. As a result of the analysis, the least cost alternative for each range of decision variables is known. (Bowersox et al., 1986)
3.1.4
The characteristics of different techniques
Guedes (1995) has compared the use of optimization, heuristics and simulation in problem solving. A summary is presented in Table 3. The evaluation of the spreadsheet models presented in the table has been originally given by Seppälä (1995).
Table 3: Comparison of different techniques (Guedes, 1995 ; Seppälä, 1995) Spreadsheet
Optimization
Simulation
Heuristics
Models Easy to use
Yes
No
Yes
No
Flexible modelling
Yes
No
Yes
No
Computer time needed
Low
High
Low
Low
Realistic modelling
Yes
No
Yes
Yes
Guaranteed improvement
No
Yes
No
Yes
As optimization and heuristics offer a solution search algorithm, an improvement in the solution is guaranteed. Although the computer time needed for a simulation study might be
2828
high, in very complex problems it is lower than finding an optimal solution. As the computer time needed for optimization increases with model detail, realistic modelling is not supported when using this technique. On the other hand, the computer time needed in heuristics is not so sensitive to model detail, so more realistic models can be built. Furthermore, the suggested relative ease of use of simulation, in comparison to heuristics and optimization, provided by commercial simulation software packages, is partly dependent on application area. Currently, for routing and supply chain planning problems, there are software packages available, with a graphical use-interface and built-in optimization and heuristic algorithms. Although simulation software might be easy to use, the technique itself requires special training. (Banks et al., 2005; Chung, 2004; Ljung & Glad, 1994) 3.2
Discrete-event simulation
Simulation is imitation of the operation of a real-world process or system over time. (Banks et al., 2005) Naylor et al. (1966) define simulation as the process of designing a mathematical or logical model of a real system, and then conducting computer-based experiments with the model to describe, explain, and predict the behavior of the real system.
3.2.1
Different kinds of simulation models
In discrete-event simulation, the state variables can change only at a countable number of points in time. Continuous simulation concerns the modeling of a system by a presentation in which the state variables change continuously over time (Law, 2006). If a high degree of precision is not required, continuous flows can be converted into discrete units of measure. Vice versa, discrete state changes that occur at small intervals can be modeled using continuous change logic (Harrel & Tumay, 1997). Some systems include both discretely and continuously changing variables, resulting in combined, discrete-continuous simulation (Law, 2006). For example, a continuous state variable may achieve a threshold value and cause a discrete event to occur.
2929
Hoover & Perry (1989) classify models as: ·
prescriptive or descriptive
·
discrete or continuous
·
probabilistic or determined
·
static or dynamic
·
open loop or closed loop.
Prescriptive models are used to formulate and optimize a given problem. Descriptive models describe the behavior of the system under study. Probabilistic models include at least one variable that is random. The output of a probabilistic model is also stochastic, and has to be treated as an estimate of the characteristics of the model. If the values of all the variables in the model are known exactly, the output of the model is determined and the model is deterministic. In static simulation, the model presents the system at one point of time. In dynamic simulation the model evolves over time. Monte Carlo simulation is an example of static simulation. (Law, 2006) Closed loop models use their output as feedback and modify their behavior according to it. An example of a closed loop model is a heating system with a thermostat. The majority of models are of the open loop type, i.e. systems without a feedback loop. (Hoover & Perry, 1989) An additional classification criteria, suggested by Chung (2004), is whether the model is terminating or nonterminating. Terminating systems do not keep entities in the system from one time period to the next. For example, stores and banks are closed during the night and always open empty in the morning. An example of a nonterminating system would be a 24/7 taxi service.
3030
3.2.2
Overview of simulation projects
Simulation analysis is a descriptive modeling technique. It does not provide explicit problem formulation and solution steps, like linear programming. Descriptions of the structure of simulation analysis can be found for example in Banks et al. (2005) and Law (2006). Persson (2003) provides a comparison of different simulation project methodologies found in the literature, concluding that they are all similar in structure. The particular procedure described here can be found in Hoover & Perry (1989). The procedure is illustrated in Figure 7.
Problem Formulation
Data Collection and Analysis
Model Development
Model Verification and Validation
Model Experimentation and Optimization
Implementation of Simulation Results
Figure 7: Elements of a simulation analysis (Hoover & Perry, 1989) As the pointed arrays show, the analysis is an iterative process. The results and knowledge gained during the latter phases can, for example, influence the problem formulation.
3.2.2.1
Problem formulation
Problem formulation can be seen as the most important step in simulation analysis. Before a problem can be formulated, it must be identified. This requires some prior knowledge of the system in question. According to Hoover & Perry (1989), problem formulation can be divided into the following tasks: ·
identifying the decision and uncontrollable variables
·
specifying constraints on the decision variables
·
defining measures of system performance and objective function
3131
·
developing a preliminary model structure to interrelate the system variables and measures of performance
The classification of the variables and constraints depends on the decision maker involved. The system performance measures are selected from the endogenous variables, i.e. variables defined by the system. If there are several separate evaluation criteria for system performance, a compound objective function can be constructed, if the criteria can be measured using a common dimension, like cost. Another way to seek a feasible solution is to constrain some of the criteria to an acceptable minimum level. (Hoover & Perry, 1989) Project goals should be set in an initial meeting with managers (decision makers), subject matter experts and analysts present. The project goals should be stated as overall objectives of the study and specific questions to be answered. The boundaries of the system to be modeled should be decided. The performance measures to be used in the evaluation of alternative configurations define the lower limit for the model detail. Because simulation as a method does not include any solution searching algorithm the, configurations to be studied should be limited. (Law, 1998)
3.2.2.2
Data collection and analysis
According to Law (1998), data is collected to serve two purposes: ·
to specify model parameters and input probability distributions, and
·
to be able to validate the built model later by comparing its performance to the existing real system.
3232
The information collection on system layout and operating procedures should not be based solely on one source. Some data sources may be inaccurate, and the operating procedures may differ. (Law, 1998) In some literature, the collection and analysis of data is seen merely as a step to define attributes of the system. Lehtonen & Seppälä (1997) stress the backward link to problem formulation. They use the Controllability Engineering methodology developed by Eloranta & Räsänen (1986) to focus the research. The focus and the problem formulation depend on the data collected and analyzed. The data collection itself is focused during the process on subsystems having most potential for improvement. 3.2.2.3
Model development
Persson (2003) suggests that the conceptual model can be described for example in written format, flow charts or input/output models. According to Law (1998), the assumptions of the conceptual model should be examined in a structured walk-through prior to any programming. In the end, the model assumptions stated in the assumptions document are modified so that they are agreed upon by the key project personnel. This promotes credibility and ensures that the assumptions are correct. In order to be able to build an appropriate model one has to understand the system. A logic flow chart of the system can be constructed and then coded on the simulation software. Furthermore, the choice of the modeling approach may be dictated by the simulation software selected. (Chung, 2004; Hoover & Perry, 1989) 3.2.2.4
Model verification and validation
According to Law (1998), conceptually, a valid model can be used to forecast the performance of the real system performance. The ease of validation depends on the existence of the real system. There is no absolute model validity, i.e. model validity can only be defined within the context of the problem formulation. The measures of validity include at least those used by the decision maker for the evaluation of different system designs. Furthermore, the most valid model that can be built will not be the most cost-effective in general, as can be seen in Figure 8.
3333
Cost of model
Model validity
Time Figure 8: Model validity as a function of modelling time (Law, 1998)
Model verification means the checking of the internal appropriateness of the simulation model vis-à-vis the conceptual model, i.e. debugging the model (Ross, 2006). Correspondence to the measures of the real system is not required (Hoover & Perry, 1989). The preliminary results obtained from the pilot runs should be reviewed by subject matter experts. The results are also compared to the real system if it exists. The comparison is done in an informal manner, because the system output data is not independent of the model. Sensitivity analyses are used to determine which of the model factors, i.e. parameter values and level of detail of subsystems, have significant impact on the performance measures. It is critical to estimate these parameters precisely. (Law, 1998)
3434
3.2.2.5
Model experimentation and optimization
The research problem at hand will be answered in the model experimentation phase. The best configuration of the different alternatives studied is selected according to the resulting performance measures. The structure of the analysis carried out depends on the type of system studied (Hoover & Perry, 1989). The simulation run design involves decisions about the length of each run, the length of a possible warm-up period, and the number of runs (Law, 1998). 3.2.2.6
Implementation of simulation results
According to Hoover & Perry (1989), the implementation of the simulation results can be difficult for many reasons: ·
communication gap: the decision maker cannot understand the analyst
·
the implementation comes too late
·
resistance to change.
A simulation model is said to have credibility, when it is accepted as “correct“ by the manager and other key project personnel. The credibility of a model can be enhanced by the involvement of the subject matter experts with the project. Regular interaction with the client also ensures that the model solves the right problems. (Law, 1998) Kasanen, Lukka and Siitonen (1993) argue that managerial constructs are products competing in the market of solution ideas, and suggest market-based validation for new concepts. For validation of the constructs, they identify three levels of market tests: Weak market test: Has any manager been willing to apply the construction? Semi-strong market test: Has the construction become widely adopted by companies? Strong market test: Has the use of the construction systematically led to better financial results?
3535
3.2.3
Stochastic behaviour in simulation modelling
One of the strengths of discrete-event system simulation is the ability to include stochastic behaviour in the analysis. Simulating a probabilistic model involves generating the stochastic mechanisms of the model and then observing the resultant flow of the model over time (Ross, 2006). So, stochastic phenomena are present both in input modelling and output analysis.
3.2.3.1
Input Modelling
The randomness of real life systems stems from many sources: processing times, occurrence of a downtime, repair times, arrivals, and product yields are rarely deterministic. The way to model randomness depends on the availability of data. According to Law (1998), there are two principal ways to model stochastic behaviour when data is available. The data collected can be used to present an empirical distribution. The preferred method is to fit a theoretical distribution to the data. Using historical data: 1.
Sort the data in categories and build a histogram
2.
Form a probability density function F(t)
3.
Generate a random number r from the uniform [0,1] distribution
4.
Use r as the value of the probability density function of the event type , i.e. F(t) = r
5.
Solve t from the previous
The steps from 3 to 5 are called the inverse transfer method (Ross, 2006). It is used also in sampling from theoretical distributions. The problem in using empirical solutions is that the minimum and maximum times are defined by the sample. On the other hand, the empirical data may include irregularities. According to Law (1998), there should be a physical or mathematical foundation for the distribution types included in the selection process. According to Banks et al. (2005), the collected data can also be used directly as input for the model. This is called the trace-driven
3636
method. When a distribution is replaced by its mean, the behavior of the model may change dramatically (Law et al., 1994). In modeling downtimes, catastrophic occurrences can be ignored. Downtimes should not, however, be modeled by adjusting task times. Such a deterministic adjustment would ignore local queue behaviour, which may also affect the overall performance of the system. (Banks et al., 2005) 3.2.3.2
Output analysis
Random variables Discrete random variables can have, at most, a countable number of values (Law, 2006). The probability of a given value of X is given by the probability mass function p(x). The distribution function F(x) is related to the probability mass function by:
F ( x) = P( X £ x) =
å p( x ) , for all x xi £ x
i
(1)
If a random variable is continuous, it has a probability density function f(x) associated with the probability of a given value of X and a cumulative probability function F(x). The relation of the PDF and CPF is given by:
x
F ( x) = P( X £ x) =
ò f ( y )dy
(2)
-¥
The dispersion of the probability can be described by the variance s2 given by:
[
]
s 2 = E ( X - m) = E ( X 2 ) - m 2 2
The square root of the variance is called the standard deviation.
3737
(3)
Two random variables are said to be independent if the value of one does not say anything about the distribution of the other. The covariance of X and Y is given by:
Cov ( X , Y ) = E {[ X - E ( X ) ][Y - E (Y )]}
(4)
Covariance divided by the standard deviation of the variables gives a correlation. It can range from -1 to 1. Covariance is a measure of linear dependence. Independent variables have zero correlation, but zero correlation does not imply independence in general. Estimation A stochastic process is a collection of random variables ordered over time, which are all defined on a common sample space (Law, 2006). Let X1, X2, … , Xn be independently, identically distributed (IID) random variables with population mean and variance m and s2, respectively. The formulas for estimating these from sample data are: n
mˆ= X ( n) =
åX i =1
i
(5)
n
å [X n
sˆ = S (n) = 2
2
i =1
i
- X ( n)
]
2
(6)
n -1
Note that the latter formula requires IID conditions from the data to be used. Based on these formulas, a 100 (1-a) percent confidence interval for m can be constructed:
3838
X (n) ± t n-1,1-a / 2 S 2 (n) / n
(7)
where the T-value is the upper 1-a/2 critical point with n-1 degrees of freedom. The use of this formula requires independent data. The interpretation of the confidence interval is that the proportion of independent 100 (1-a) percent confidence intervals containing the true value of m is (1-a). 3.2.3.3
Simulation run design and analysis
The statistics gathered from one simulation run are generally not independent, e.g. the time in system for consecutive customers might be positively correlated. Therefore, the formulas for variance and confidence interval cannot be used directly. (Banks et al., 2005; Law, 2006) A way to obtain conditions where the observations are identically and independently distributed, is the replication/deletion method. The method consists of replicating the simulation run with the following conditions: ·
each replication reaches steady-state
·
statistical counters are reset at the beginning of each replication
·
different random numbers are used for each replication
At the beginning of a run, the behavior of the system (transient behavior) depends on the initial conditions. If the system is well defined, the system state approaches a distribution that is independent of the initial conditions, called steady state. In estimating system performance, the effect of the initial conditions has to be eliminated, i.e., the data from the warm up period would not be collected. One method to determine the length of the warm-up period is Welch’s procedure. The method is based on the convergence of the moving average of a mean statistic calculated from several runs.
3939
3.2.4 3.2.4.1
Limitations of simulation Disadvantages of the technique
Because a stochastic model produces estimates of the true characteristics of the system, several observations for each set of input parameter values is needed. In order to be able to construct confidence intervals based on these observations, the observations have to be obtained from different runs. Simulation is therefore better suited for comparing a limited number of alternatives than optimizing a system. (Law, 2006) Simulation models are often expensive and time-consuming to develop. Model building requires special training, and even when constructed by competent individuals, the models will hardly be the same. (Banks et al., 2005)
3.2.4.2
When not to simulate
Simulation is not a universal problem solving tool. Banks & Gibson (1997) list 10 rules to determine whether simulation is an appropriate tool for problem solving. Simulation is seen to be inappropriate when: ·
the problem can be solved by using common sense analysis
·
the problem can be solved analytically
·
it is easier to perform experiments with the real system
·
the cost of simulation exceeds possible savings
·
there are no proper resources, i.e. people with OR or statistical expertise
·
there is not enough time for the results to be useful
·
there is no data
·
the model cannot be verified or validated
·
project expectations cannot be met
·
the system cannot be defined.
The first three criteria can be found in the problem solving tool selection process by Stevenson (2007) presented in Figure 6 above.
4040
3.2.4.3
How to fail in simulation projects
If simulation is chosen to be the tool to be used, there are still several ways to fail (Law, (2006): ·
lack of well-defined set of objectives
·
inappropriate level of model detail
·
failure to communicate with management
·
when using commercial software, failure to implement the modeling logic desired
·
failure to account for sources of randomness
·
use of arbitrary distributions
·
assuming independence within a single run
·
making single replications and treating output values as ‘true answers’.
According to Chung (2004), the need for a formal problem statement and project objectives cannot be overemphasized. As model validity is defined only within the context of problem formulation (Law, 1998), i.e. a model is built to find answers to specific questions, redefinition of objectives during the project might require building a new simulation model or even call for re-evaluation of alternative problem solving, as suggested by Stevenson (2007). 3.2.5
Recent applications of simulation in transport system analysis
Simulation has been widely used in transport system analysis. Applications range from elevator planning and airport baggage handling system design (Tervonen et al., 2008; Rijsenbrij & Ottjes, 2007) to evaluating segregation strategies of genetically manipulated grain (Coleno, 2008) and modeling of national freight systems (de Jong & Ben-Akiva, 2007). Godwin et al. (2008) have used simulation for tactical locomotive fleet sizing for freight trains. Simulation has also been used for assessing different regulatory methods in congested transport systems (Kidokoro, 2006).
4141
Although simulation is often seen as an alternative to other tools of analysis, it can also be used in combination with them. The Canadian Pacific Railway has used an optimal blocksequencing algorithm, a heuristic algorithm for block design, simulation, and time-space network algorithms for planning locomotive use and distributing empty cars when changing their service concept (Ireland et al., 2004). Cheng and Duran (2004) report of a decision support system for managing transportation and inventory in a world-wide crude oil supply chain. The tool is based on a discrete-event simulation model and dynamic programming.
4242
4
4.1
METHODOLOGY
Time line of the study
The thesis consists of 6 different articles, originating mainly from separate research projects. The articles were completed between the years 1999 and 2008. Figure 9 shows the time line of the writing of the articles.
Article VI Article V
Article II Article III
Article I
2000
2001
Article IV
2007
Final synthesis
2008
Figure 9: Time line of the study
When writing the first two articles, the author of this thesis worked in the TAI Research Centre at Helsinki University of Technology (HUT). Article I was not connected to any particular research project; it was based on ideas developed when completing individual research projects for the industry. The data used in the article came from separate project case studies. Each case presents a discrete event simulation analysis. All of them were completed with Automod (www.automod.com), a standard simulation software used at HUT at the time. Also Article II was completed in the TAI Research Centre at the HUT. It originates from work done in a research project called Intertrade, which concentrated on finding logistics solutions for electronic grocery shopping. The main partners in the project were the S-Group, Norpe, Valio, Panimoliitto and Hansel. The 3-year Intertrade project began in 1999 and was a subproject of a larger e-commerce project funded partly by the Finnish Technology Agency Tekes. The simulations presented in the article were made using RoutePro (www.infor.com),
4343
a commercial routing software. The digital maps of the Helsinki region were acquired from Genimap (www.genimap.com). Other data for the simulations was gathered from the participating companies. Articles III and V are based on research projects completed in the Development Centre for Railway Logistics in Pieksämäki, between 2005 and 2007. The writing of Article III was completed in 2007. Article V was completed during the fall 2007 and spring 2008. The Development Centre was initiated by the opening of railway freight for competition in 2007, and was funded partly by the Regional Council of Etelä-Savo. The aim of the subproject which resulted in Article III was to evaluate a new service concept for timber transportation on rails. The evaluation was based on a discrete event simulation model, which was built during the project. The software used for the simulations was Quest (www.3ds.com), a standard simulation software package. The main project partner was Metsäteho, from which the data concerning timber transport was acquired. The data concerning the Finnish railway network was acquired from the Finnish Rail Administration. Other data resources included e.g. the Raili data base collected by VTT. For the subproject utilized in Article V, the main project partner was the Finnish Rail Administration, which provided most of the data concerning the investment alternatives to be evaluated directly. Estimates of future freight volumes were based on an earlier national forecast provided by the Rail Administration. The simulations were completed with a modified version of the Quest model used in Article 3. The modifications were made to comply with the assumptions of the national railway assessment framework. Articles IV and VI are results of the Nora project of Lappeenranta University of Technology, completed in 2007. The object of the project was to study a new railcar model, which could be used in transporting e.g. raw materials to factories and products to customers, in order to reduce the total costs of transport. The 2-year project was partly funded by EU and Tekes. The main company partners in the project included John Nurminen Oy, RP-Hitsaus Oy, StoraEnso Wood Supply Europe and VR Cargo, which provided data for the simulation analysis. Also research reports from Metsäteho and publicly available information from the RZD website (www.rzd.ru) was used for input in the model. The model was built using Quest. The original simulation analyses reported in Article IV were completed in the latter
4444
part of the year 2007. The writing process and additional analyses reported in Article VI were conducted during the first half of the year 2008. 4.2
Methodological approach of the study
According to March and Smith (1995), natural science tries to understand reality, whereas design science attempts to create things that serve human purposes. While natural science produces general theoretical knowledge, design scientists aim at producing effective artifacts serving human purposes. According to Järvinen (2001), design science consists of two basic activities: construction of artifacts and evaluation of the artifacts constructed. The evaluation is based on the utility provided by the artifacts. The present research, evaluating transportation systems on the basis of efficiency can be regarded as belonging the evaluation phase of design science. A detailed categorization of the methodological approach of the papers is presented below by using the two-dimensional framework developed by Neilimo and Näsi (1980). The dimensions in this framework are theoretical-empirical and descriptive-normative. The original model includes four methodological approaches: conceptual, nomothetical, decisionoriented and action-oriented. Lukka (1991) has added constructive research methodology to the framework. The positioning of the different research methodologies and this research is presented in Figure 10. Theoretical
Empirical
Nomothetical approach Descriptive
Conceptual approach
Action-oriented approach
Normative
Decision-oriented approach PI
PV
PVI PIV
Constructive approach
PII PIII
Figure 10: Classification of the research articles in the Neilimo&Näsi framework (1980)
4545
According to Vafidis (2007), the main difference between the two normative research approaches is that the decision-oriented approach is more interested in building a model that is expected to work, than solving a practical problem, while the constructive approach aims at demonstrating the practical usability of the constructed solution (Kasanen et al., 1993). According to Kasanen et al. (1993), the constructive approach can be divided into the following six phases: 1.
Finding a practically relevant problem
2.
Obtaining a general and comprehensive understanding of the topic
3.
Constructing a solution
4.
Demonstrating that the solution works
5.
Showing the theoretical connections and the research contribution of the solution concept
6.
Examining the scope of applicability of the solution.
As the research presented in each of the papers aims at finding a solution for a specific problem the approach is normative. Article I (PI) suggests simulation as a project product management tool. The aim is to contribute to the theory of project management by generalizing the findings of the cases presented. This manuscript can be described as employing a decision-oriented research approach. The objective of Article II (PII) is to identify the cost structure of different home delivery concepts by means of simulation. The aim is to provide information for home delivery concept selection, and thus the research can be categorised as constructive. Article III (P III) aims at evaluating one tentative service concept, which is specialised solely on timber transportation on rails. The service concept is evaluated in the specific context of the Finnish railway market. The purpose of the research is highly normative and focuses on a specified context, thus representing constructive research.
4646
Articles IV (PIV) and VI (PVI) evaluate the possibility to increase the efficiency of rail transportation on the Finnish-Russian border. Paper VI extends the analysis by examining several networks and approximating the total capacity of the combined concept. Although the scale of the system is large, the research objective is to provide a solution for a particular case. In the discussion, an attempt to generalize the evaluation of combined transports in the form of general requirements for network geometry is made. However, the main contribution can be described as following the constructive research approach. In Article V (PV), the objective is to estimate the role of freight transport impacts when conducting cost-benefit analyses in the railway context. The simulation analysis has been conducted in connection with one specific investment case, so there is a constructive component to the study. However, as the study also aims at generalizing the results to railway cost-benefit analysis (CBA) as a whole, elements of the decision-oriented approach can be found.
According to Yin (2003), the research question largely defines the research strategy. In all the articles, a quantitative research method, simulation is used, which provides an exact evaluation criterion for assessing different constructs proposed. Because of its complexity, simulation is sometimes referred to as the last resort when selecting problem solving tools (Law 2006; Stevenson 2007). Therefore, it is necessary to justify its use over other quantitative methods. However, according to Banks et al. (2005), the applications of simulation in transportation systems are vast (recent examples can be found e.g. in: Tervonen et al., 2008; Rijsenbrij & Ottjes, 2007; Coleno, 2008; de Jong & Ben-Akiva, 2007; Godwin et al. 2008; Kidokoro, 2006). Transportation systems are a typical example of complex realworld systems, which cannot be described accurately by analytic methods. Ujvari and Hilmola (2006) show in the Automated Guided Vehicle context explicitly that minor system details, which can be incorporated in to a simulation model but typically cannot be dealt with by other tools, can have a major impact on system performance. According to Ujvari and Hilmola (2006), such features include e.g. the control and loading logic applied, as well as the physical properties of the transportation system. A more detailed description of discrete-
4747
event simulation as a method is presented in Chapter 3. Statistical methods have been applied in analysing the survey.
4848
5
5.1
SUMMARY OF THE ORIGINAL PAPERS
Article I: Managing projects front-end: incorporating a strategic early view to project management with simulation
The objective of the paper is to highlight the importance of managing the end result or scope of a project in project management, instead of managing the project implementation process. The article suggests discrete event simulation as a tool for gaining new strategic insight into project management in terms of managing the functionality and operability of the project product.
5.1.1
Literature review
According to the literate review, project management is traditionally dedicated to the project implementation
phase
consisting
of
feasibility,
engineering,
manufacturing
and
commissioning phases. Managing the project concentrates on fulfilling the boundary conditions to deliver on time, in budget and to specification. It does not focus sufficiently on optimizing the potential benefits of project delivery, i.e. the project product.
However, defining and managing the final project product is essential in the actual operations phase. For example, reducing the effort in the design phase may reduce the cost of the project at the expense of an increase in the customer’s operations. Managing the end product’s life cycle costs, profitability and risks incorporates a strategic view into project management.
Simulation is widely applied e.g. in system engineering design. According to the article, simulation can be used in project management in analysing the project product.
4949
5.1.2
Empirical study
The paper introduces four empirical cases to illustrate the use of discrete-event simulation in managing the project scope during project implementation, and to provide more detailed understanding of the practical application of the discrete event simulation approach. The cases include a feasibility-phase investment planning situation of a confectionary manufacturer, an engineering and commissioning-phase materials handling system study for a new production facility of a beverage manufacturer, a feasibility and manufacturing phase study for a new logistics configuration at a paper mill, and a manufacturing phase study for a new logistics system development at a global electronics manufacturer. In the case of the confectionary manufacturer, an unnecessary roller investment of 500 000 euros could be avoided because of the simulation study. In the case of the beverage manufacturer, the refined analysis of the materials handling system resulted in a decrease of 300 000 euros in the investment in comparison to the suggestion of the supplier. The results from the feasibility study of the new logistics configuration at the paper mill showed that the delivery target times could not be met with the current sheeting lot size. In the case of the electronics manufacturer, the new logistics configuration could be evaluated on the basis of the resulting inventory reductions.
5.1.3
Conclusion and contribution
The article discusses the management of a project product rather than the traditional focus on the implementation of the project. The article introduces discrete event simulation as a tool to support major decisions associated with early management of the project product content. The four case examples demonstrate that discrete event simulation can be applied throughout the project life cycle as a continuous management and decision making procedure. This way, a strategic view is adopted that enables considerations of the project product in its operation environment.
5050
Modelling the technical and operational functionality of the final project deliverable in its production environment creates a dynamic test environment, where the functionality of the project deliverable can be analysed and managed iteratively throughout the project. 5.2
Article II: Identifying the success factors in e-grocery home delivery
At the turn of the millennium, grocery shopping with the Internet was seen as a growing business. One additional service included in a majority of the e-grocery shops was home delivery. The objective of the paper is to solve the last mile issue, i.e. to identify the cost structures of different home delivery operation concepts by means of simulation. 5.2.1
Literature review
According to the paper, one of the most significant obstacles for the growth of e-commerce is the lack of suitable logistical home delivery infrastructure. The home delivery service providers use several different service concepts and service levels, in terms of the delivery lead time and the length of the delivery time window.
The logistical services created for e-grocery have been developed by means of trial and error. Most of the e-grocery shops operate next to a traditional supermarket, where the picking is both costly and inefficient. The actual home delivery is usually an additional service provided by third party service providers. Instead of manned reception, some e-grocers deliver to a delivery box. Quantitative knowledge of the cost structure and efficiency of the different service concepts has been insufficient for development decisions.
5.2.2
Empirical study
The simulation model was made with RoutePro, a commercial routing software, which uses digital route maps. The characteristics of the model included a maximum number of orders and volume per route, maximum working time of a van and a route, the hourly cost of a van and driver, and loading and drop-off times. The size of test region used for simulations was 135 km2, with approximately 202 000 inhabitants living in 89 000 households. The orders were developed on the basis of traditional point of sales data of a grocery retailing company.
5151
Anonymous regular customer data included quantities, prices, shopping time and postal codes of the shopping baskets. For the simulation, only purchases over 25 € were included, leaving 1 639 orders inside the boundaries of the selected region. The orders were modified to reflect four service concepts evaluated. The service concept affects the pickup and delivery time windows for each order to be routed. Furthermore, a scenario, where the shopping trips were made by own car was constructed. According to the simulation results, e-grocery home delivery can be cheaper in comparison to the cost of a customer visiting a supermarket, given that the price for the time and vehicle usage required for the shopping trip is taken into account in the analysis. From the home delivery concepts evaluated, the concept applying next-day delivery with 1-hour delivery slots decided by the customer was twice as costly as the next-day deliveries using unmanned box reception. The cost level of the former concept was confirmed by a Finnish e-grocery shopkeeper. Furthermore, simulation experiments combining manned and unmanned reception were conducted. The results show that the number of vehicles needed rises heavily already when the share of manned reception is 10 percent of the total. 5.2.3
Conclusion and contribution
Home delivery transportation service is one of the critical issues in the success of e-grocery business. However, quantitative knowledge of the cost structure and the efficiency of the different service concepts has been insufficient for development decisions. The article helps the e-grocer to position himself on a wanted service and cost level, when developing operating concepts for home delivery. In the analyses, significant differences in the cost level of the different home delivery service concepts could be found. According to the simulations, applying the most inefficient concept implies an increase in the transport cost by 170 percent in comparison to the most efficient concept. In case of the most cost efficient service concept, unmanned box-delivery, e-grocery
5252
home delivery could be as much as 43 percent cheaper than the current practice of visiting the store, which is seen as a strong argument favouring e-grocery business. 5.3
Article III: Evaluating the competitiveness of railways in timber transports with discrete-event simulation
The paper deals with the transportation cost of timber on rails. The objective of the paper is to evaluate one tentative service concept, which is specialised solely on timber transportation. The evaluation is based on estimating the cost by experimenting with a simulation model describing the operation of the system. 5.3.1
Literature review
Railway liberalisation in Europe, in terms of privatisation and deregulation, is at least one decade behind early adopters, such as the USA (1980) and Japan (1987). In Finland freight operations have operated under free competition from the beginning of 2007. Forest industry is accountable for approximately 60 percent of the freight on rails in Finland. As two thirds of this percentage is due to raw material transports, this is identified as one of the most potential product categories where competition might be realized. 5.3.2
Empirical study
The simulation study aims at evaluating a new business concept for the rail transportation of timber. The current practice of the national railway operator is based on a large network of hubs, where railcars are stored and combined. For a new entrant, the investments involved in the traditional concept are too high. The new concept to be evaluated is a so-called ‘unit train’, where the locomotive is always present, i.e. the cars are not detached at any time. On routes where electricity is not available, the engine runs on diesel power. Furthermore, the train is equipped with a timber loader, relaxing the requirement of having additional loading capacity at the loading station. The simulation results presented in this paper have been prepared with Quest, a manufacturing-oriented simulation package. The simulation model of the rail network includes stations and connecting rails with length, intermediate speed and electrification. The station logic manages the traffic in the model. As the traffic does not run according to a
5353
predefined schedule, if a train pass is not possible on the other end of the reserved track, further reservations are made to avoid collision. In the beginning of each planning cycle, new timber loads to be picked up arrive at the loading stations. As the result of the route planning process, we get planned routes from the loading stations to the mills. The algorithm combines only loads with the same destination. The route-planning algorithm aims at maximising fully loaded travel. The cost model includes energy cost, which depends on the energy source and load carried, labour cost, including working hour regulations, and extra charges for night-time and weekends. The capital cost of the locomotive and other equipment includes interest cost and maintenance. There are also tariffs for using the network. In the case model, rail transport of timber to two mills is analyzed. The mills have a direct connection to the railway network. The supply of timber comes from 28 loading stations. The average distance of the loading stations to the mills is 290 km. Routes for new loads arriving at a pick-up station are planned on a weekly basis, resembling the current planning cycle of the Finnish forest industry. In the simulation, each load equals the capacity of half a train. The length of the simulation run is two weeks with total commissions of 28,000 m3 of timber. The system with two unit trains was able to complete the commissions with a service ratio of 100%, i.e. each route was completed during the same period it was planned. The utilisation of the trains was 80%. According to the annual survey of Finnish harvesting and longdistance transportation, the average rail transport distance in a domestic rail transportation sequence was 245 km with a transportation cost of 3.0 snt per cubic meter per km during the year 2005. The results of the simulated concept yield an equivalent transportation cost of 1.7 snt for the same distance. The costs are mainly due to the locomotive and energy costs. The time usage is divided almost evenly between driving empty, loading, driving loaded and unloading. In alternative scenarios, where the number of available commissions was reduced, achieving 60–70% usage ratios, the transportation cost rose by 6–11%, respectively.
5454
According to Kariniemi (2006), direct road transport accounted for 80.1% of the timber transport to the mill in Finland in 2005, whereas the share of rail transport was 16.5% of timber volume. The average distance of a direct road transport was 105 km and the transportation cost 5.4 snt per cubic meter per km. The results of the simulated concept would yield a transportation cost of 2.5 snt per cubic meter per km for the same distance. Although the proposed concept thus seems a viable option also at these smaller distances, the competitiveness is dependent on the road distance to the nearest railway, as the supplying road leg needs to be included in the comparison. 5.3.3
Conclusion and contribution
Our research results regarding the feasibility of using the unit train concept in timber transportation suggests that it could be competitive in the Finnish long-distance transportation market of timber. At the current average train transport distance, the concept would cut the costs to 57% of the current levels. If applied, the proposed concept would have positive environmental effects. If it gains market share against the current railway transport models for timber, double trips to loading stations would be reduced. If road transports are substituted, the environmental effects would be even more far reaching. 5.4
Article IV: Evaluating different railway wagon alternatives for timber transportation by discrete event simulation
The objective of this paper is to evaluate the use of two different wagon types for timber transport from Russia to Finland. In the base scenario, the wagons are used only for transporting timber, while in the alternative scenario the wagons are utilized in transporting containers to Russia. The evaluation is based on estimating the total cost and cost structure of the operations. For estimating the cost we have used a discrete event simulation model describing the operation of the system. 5.4.1
Literature review
Finland and Sweden are the two most important pulp producing countries in Europe. In 2005, Finnish wood gathering recorded 52.1 million m3. The same year the total amount of
5555
wood imported to Finland was 21.5 million m3. Around 79 percent of the wood imported to Finland is transported from Russia, and 59 percent of Russian wood is transported on rails. Until now, Russian timber has had a cost advantage in comparison to Finnish raw material. Russia has announced a schedule to increase tariffs for timber exports. As a consequence, the exporters of Russian timber need to examine and fine-tune their cost structure of timber procurement. A disparity between the modes of transportation between Russia and Finland exists. Especially rail transports have idle capacity in the eastbound direction. On the other hand, there is an eastbound transit flow on the roads, which is due to the insufficient capacity of the Russian ports to handle the ever increasing demand for imports, as Finnish ports are used for unloading the cargo. 5.4.2
Empirical study
The simulation study aims at examining the transportation cost of forest industry raw material with two different types of railway wagons (14 and 19 meters by length). For the simulations, Quest, a manufacturing oriented simulation package has been used. The simulation model of the rail network includes stations and connecting rails with length and intermediate speed. Each connection between two locations in the network is modeled separately, i.e. the model does not resemble the actual rail network structure in physical terms. In the case model, rail transport of timber to two mills located in Eastern Finland is analyzed. The supply of timber comes from 4 terminals located in Russia. The average distance of the terminal to the mills is 458 km. There is a train leaving from each terminal to both mills each day. The amount to be transported has an annual pattern, where the quantity of each month is different. The trains travel to the destination mill, where they are unloaded. Empty wagons are returned to the terminal where they were originally located. The alternative scenario combines container traffic with wood transportation. In this scenario the wagons are, after unloading at the mill, directed to a container terminal located in Kouvola, Finland. In Kouvola the wagons are loaded with containers, which are transported to St. Petersburg.
5656
From St. Petersburg, the empty wagons are returned to the terminal where they were originally located, as in the first scenario. The transportation cost in the model consists of two components, cost of the wagons and traction cost. The cost of the wagons includes interest cost and maintenance, while the traction cost charged by the operator is assumed to depend on the gross ton kilometers to be transported. As the 14 meter wagon has a better timber - dead weight ratio, the traction cost is lower. As it also has a lower capital cost, the 14 meter wagon is the more efficient and economic choice of the two wagons in the base scenario. However, in the combined scenario, the 19 meter wagon becomes more attractive, because of the larger TEU capacity of the 19 meter wagons, 3 TEU instead of 2 per wagon, as the price charged for transporting a TEU will increase. 5.4.3
Conclusion and contribution
Our research results regarding the feasibility of combining wood industry raw material transport with container transportation suggests that it could be economically sound and increase the efficiency of rail transport in terms of wagon turn and full loaded ratio. Our finding that the combined system would reduce transportation cost is remarkable, because of the potential transportation volumes involved. If applied, the proposed concept would have positive environmental effects. As the current use of railways as a mode of transportation of Finnish exports to Russia is negligible, mainly road transport would be substituted. 5.5
Article V: The role of freight transport in railway network investment evaluation
The objective of this paper is to estimate the role of freight transport impacts, when conducting cost-benefit analyses in the railway context. The analysis is carried out as a part of the total cost-benefit analysis of an investment case. For estimating the freight transport impacts, we use a discrete event simulation model describing the operation of the system. We evaluate altogether four different investment alternatives for one specific route, and
5757
complete sensitivity analysis regarding the freight benefit realization percentage. The initial research problem in this work is including freight benefits in the railway network investment evaluations, and how they affect the results. Specific research questions were following: ‘How could discrete event simulation be used in investment evaluation build-up?’, and ‘What is the possible effect of freight transport on the cost-benefit analysis?’
5.5.1
Literature review
The decision making process involves identification of the objectives and decision alternatives of the decision maker. To make a rational choice, the decision-maker needs to have a statement of his objectives formulated in a way specific enough to allow it to be used as the basis of analysis. In the case of a public agency as the decision maker, the objective is to serve the public interest (Sugden & Williams, 1978). Two widely used frameworks are cost-benefit analysis (CBA) and multicriteria analysis (MCA). CBA is based on the welfare theory – the objective is to evaluate the welfare benefits of the project alternatives for the society. In Europe considerable differences exist at the national level as to what impacts are included and which approaches are used in the appraisal framework exist. The benefits found in CBA analyses seem to be dominated by passenger travel impacts. According to the results of a review about 146 CBA road projects in Sweden, travel time reductions and improved safety accounted for 90 percent of the total benefits, whereas only 1.3 percent of the benefit was due to decreased cost of freight transport. In Finland freight transportation impacts have been excluded from project appraisal for railway investments until now. 5.5.2
Empirical study
The aim of the simulation study is to examine the role of freight transport in a given railway network investment cost-benefit analysis. The constructed simulation model is used for valuating the annual freight transport cost of the system. Changes in freight transport cost are assumed to affect operator surplus, which results in different values for the CBA cost-benefit ratio. Scenarios are constructed for five investment alternatives.
5858
The track under study is mainly single track and it is 334 kilometres long. It runs between Seinäjoki and Oulu, serving as the western key route between northern and southern Finland. The track is used daily by 30 freight trains and 32 person traffic trains. The model assumptions were specified in a project group consisting of subject matter experts from the Finnish Rail Administration (RHK) and the actual simulation model builders. RHK is responsible for planning, construction, maintenance and traffic control on the Finnish rail network. The evaluation period of Finnish railway investments is 30 years. Future freight traffic timetables have been constructed by modifying the weekly timetable of the year 2004. The future freight volume has been assumed to equal the national rail freight forecast, which was available for the year 2025. The cost model for freight transportation includes energy cost, which depends on the energy source and the load carried. Wages have been calculated including extra charges for night time and weekends. The cost of the locomotive and other equipment includes interest cost and maintenance. The total freight cost of each alternative has been calculated based on the output of a simulation run of one year and unit price of each cost component. The model presenting the current base case network has been modified to represent four predefined investment alternatives by modifying the number of stations, and connecting rails with respective attribute values. The operating cost in the basic scenario is 53.5 million Euros per annum. The cost decrease in the alternative which concentrates on benefits in passenger traffic, is smaller than that experienced in other investment alternatives. The results of the freight transport analysis are included in the overall cost-benefit analysis of the track investment. Reductions in freight transport cost are assumed to increase operator surplus, which results in higher values for the CBA cost-benefit ratio. The overall CBA of the track investment can be found in Rinta-Piirto and Pesonen (2006).
5959
The relative rank of the investment alternatives is affected by the inclusion of the impacts of goods transport. Furthermore, the net benefit of each investment alternative is positively affected by the inclusion; up to one third of the net benefits are due to decreased goods transport costs. Theoretically, every investment having a cost-benefit ratio above 1.0 is socially beneficial. As an effect of the inclusion all four investment alternatives rise above the critical 1.5 cost-benefit ratio value stated by the Ministry of Transport and Communications (2004). 5.5.3
Conclusion and contribution
According to the findings of our study, freight transport should be included in the analysis when appraising railway network investments. The argument is twofold. Firstly, among the evaluated investment alternatives, freight transport counted for up to 33 percent of the net benefits, i.e. a 50 percent increase in net benefits was experienced. This amount might be pivotal when determining the profitability of an investment. Furthermore, the relative rank of two profitable investment alternatives might change, depending on whether the effects on freight transport are analysed or not. If the effects of railway network investments on rail freight traffic surplus are excluded from cost-benefit analyses, a systematic bias is formed. This bias leads to socio-economically inefficient investments favouring passenger traffic. In the presented case, exclusion of freight traffic from the framework led to undermining the social desirability of all investment alternatives. If this applies to the majority of railway investments, the effect will be too few realized railway investments which counteracts the EU transport policy of improving Europe’s railways as a safe and clean mode of transport. 5.6
Article VI: Enhancing the efficiency of railways by multi-use of wagons
The objective of this paper is to elaborate the ideas of paper IV. The possibility to improve the efficiency of railway freight on Finnish-Russian border by multi-use of wagons is evaluated in several networks. An estimate of the total container carrying capacity for the system with the possibility to use idle wagons is given. As earlier, the evaluation is based on a discrete event simulation model. As specific research questions we have: (1) ‘Could the efficiency of railway transport on the Finnish-Russian border be enhanced by multi-use of
6060
wagons’, (2) ‘Which wagon type is optimal for combined transports’, (3) ‘Do network characteristics affect the optimal wagon choice’and finally (4) ‘What is the potential of the suggested concept to moving road transit to rails’. 5.6.1
Literature review
The research environment of this study is the same as for Article IV which is presented in Section 5.4.1. 5.6.2
Empirical study
The simulation model of the timber rail transportation network built for Article IV is used also in this study. The analysis is extended to cover several networks, i.e. the containers are transported either to St. Petersburg, Moscow or Yekaterinburg. With this generalization, we are able to evaluate the applicability of combining westbound timber transportation flows with eastbound container transportation flows more widely. Furthermore, the value for the traction cost used in the model is updated based on international statistics. The generalization does not affect the basic finding that the 14 meter wagon is the more efficient and economic choice of the two wagons in the base scenario. However, the costefficiency of the 19-metre wagon is improved by longer container transportation legs. Because of this, the break even price for combining container flows with timber transportation flows is lower for the 19-metre system in case of Moscow and Yekaterinburg. The container carrying capacity estimate for the case network is calculated including capacity achieved by employing wagons that are idle due to the seasonality in wood transport. The generalization of the container capacity estimate to the total rail import volume finds support in the fact that the vast majority wood is imported using the same border crossing points as in the case network. 5.6.3
Conclusion and contribution
The research results suggest that efficiency improvement in railway transportation can be achieved by combining container transportation flows with timber transportation more widely than presented in article IV.
6161
The main determinants of the optimal wagon system are: (1) the market price of container transport and (2) traction charge of the railway operator. However, the optimal wagon choice depends also on network characteristics. From capacity perspective, current eastbound transit container flow could be transported totally using railways.
6262
6
VERIFICATION OF THE RESULTS THROUGH AN INTERNATIONAL
SURVEY
FOR
RAILWAY
FREIGHT OPERATORS In the articles, different aspect determining the efficiency of transportation systems have been investigated by simulation. The interest in surveying the current status of the planning operations of railway operators is threefold. In comparison to road transport railways produce less green house gas emissions and thus offer a more environmentally friendly transportation alternative. Secondly, competition in rail freight has been opened in Europe and Finland recently. Due to this liberalization, railway freight in Europe will probably undergo similar evolution as experienced earlier in road and air transportation. In air transport, the evolution has resulted in a wider service portfolio, initiated new kinds of operators specializing in different kinds of services (e.g. low cost operators), and changes in the networks used for carrying out the services (from point-to-point connections to hub-andspoke networks). In the United States, where railway competition and liberalization started already in the early 1980’s, this evolution has led to improvements in the efficiency of railway carriers. Thirdly, the majority of the research articles included in the thesis are connected to railway transportation. Support for the relevance of research concentrating on the efficiency of transportation has been sought for by conducting an international survey for railway freight operators. Furthermore, the current penetration of the method used in the dissertation, simulation, is investigated.
The survey was conducted during spring and summer 2008. The survey included European Union countries across the Baltic Sea region, as well as Hungary. As pioneering countries in opening railway competition also the United Kingdom and the United States were included in the study. The target countries in the survey were: Estonia, Finland, Germany, Hungary, Latvia, Lithuania, Poland, Sweden, the United Kingdom and the United States.
Identification of the target companies was country-specific. For some countries, lists of companies with a license for railway freight were provided in the Internet by the authorities.
6363
In the case of other countries, the companies were identified on the basis of previous research or through the membership of railroad associations. The survey was performed by sending an email to each of the identified companies. The email included a link to a webpage, where the actual survey form could be filled in. The email was sent to 252 companies, with two reminders. Primary target persons were people responsible for transportation planning and customer contacts. The English version of the survey can be found in Appendix 1. The survey was conducted in order to explore the current status of using simulation as a decision making tool in the railway context. The results were used for triangulation purposes to verify the relevance of using simulation in transportation system analysis and the specific research questions of the articles. From the 252 companies surveyed, 15 answers were received. There were national differences in the tendency to respond to the survey. Four answers each were received from Germany and Sweden. From the United States and Hungary, 3 answers were received. One answer was also received from Poland. The quality of the answers was fairly good, e.g. 13 of the total fifteen respondents indentified the used planning methods.
The answers were analysed with Statistix 8.1. 6.1
Background data
Figures 11, 12 and 13 present the histograms of the number of employees, wagons and locomotives of the companies.
6464
Figure 11: Histogram of the employees
Figure 12: Histogram of the wagons
Locomotives
Figure 13: Histogram of the locomotives
6565
Based on the histograms, the distribution of the size of the companies is right-skewed, two companies seem to be larger than the rest. This skewness and the small number of responses limits the statistical tests available. 6.2
Services supplied, outsourcing and collaboration
Figures 14, 15 and 16 present the services supplied, activities outsourced, and possible collaboration of the operators.
12
10
8
6
4
2
0 Transports for your Transports for other own company companies
Regular scheduled transports
Figure 14: Services supplied by the operators
6666
Order based transports
Locomotive rental
Wagon rental
7 6 5 4 3 2
Operations planning
Maintenance
Management
Wagons
Traction
Loading/unloading
Order booking
Accounting
0
Drivers/train staff
1
Figure 15: Outsourced activities
8 7 6 5 4 3 2 1 0 No collaboration
1
2-3
4 or more
Figure 16: Collaboration with other operators
According to the answers, the operators provide transportation services both for their own company, but even more often to other customers. Transports are operated both on the basis of timetables and specific orders. The majority of companies do not rent out locomotives or wagons. Collaboration between the operators seems to be the norm.
6767
On the basis of the outsourced activities, management and operations planning can be seen as core functions of the operators. Only one of the respondents outsourced both activities. 6.3
Planning and development tools
When identifying the planning and development methods in the survey, the categorization was the same as the one used by Seppälä (1995). Table 4 presents the development methods indicated by the operators, while in Table 5 the answers are gathered in a cross table format. The answers to the planning methods were almost identical, with two exceptions: Operator3 responded that he uses spreadsheet modelling and left the question of simulation unanswered. Because the answers were quite similar, the answers concerning the development methods are reported here. The choice is based on the greater total number of answers. Figure 17 presents the total number of companies using the different techniques for development purposes. Figure 18 contains descriptive statistics of the companies. The division into two groups has been made based on the use of simulation. According to the descriptive statistics, simulation is used by bigger operators. Table 4: Use of different development methods (n=14) Spreadsheet Operator1 Operator2 Operator3 Operator4 Operator5 Operator6 Operator7 Operator8 Operator9 Operator10 Operator11 Operator12 Operator13 Operator14
Linear Programming 1 1 0 1 1 0 1 1 1 1 1 1 1 0
Heuristics 0 0 0 0 0 0
0 0 0 0 0 0
0 0 1 1 0 1 0
0 0 1 1 1 1 0
6868
Simulation 0 0 0 0 0 0 1 0 0 1 1 1 0
Other (manual) 0 0 0 0 0 0 0 0 0 0 0 0 0 1
12 10 8 6 4 2 0 Static spread sheet models. (e.g. Microsoft Excel)
Linear programming
Heuristics
Simulation
Other, specify (manual)
Figure 17: Development tools used
Table 5: Cross table of the use of different development methods (n=12) Spreadsheet 11 3 4 3
Spreadsheet Linear programming Heuristics Simulation
Linear Programming 3 3 3 2
Statistix 8.1
Heuristics 4 3 4 3
Simulation
stattest, 20.11.2008, 16:50:14
Descriptive Statistics for dev_sim = 0 Variable emp loc wag
N 8 8 8
Mean 119.13 15.250 199.13
SD 151.48 13.382 331.27
Minimum 14.000 0.0000 3.0000
Maximum 425.00 40.000 1000.0
Minimum 240.00 29.000 920.00
Maximum 40000 6400.0 85095
Descriptive Statistics for dev_sim = 1 Variable emp loc wag
3 2 3 4
N 4 4 4
Mean 12248 1830.0 29304
SD 18697 3070.8 39617
Figure 18: Descriptive statistics of the companies, based on the use of simulation
6969
The actual statistical test is presented in Figure 19. The applied statistical test is called the Mann-Whitney or the Wilcoxon rank sum test. It is used for testing if two samples come from different populations. The test is based on ordering the two samples into a single ordered sample and assigning ranks for each observation. The test statistics is based on the sum of ranks of one of the samples (Conover, 1999). The assumptions of the test are: ·
both samples are random samples from their respective populations
·
in addition to independence within each sample, there is mutual independence between the two samples
·
the measurement scale is at least ordinal.
7070
Statistix 8.1
stattest, 20.11.2008, 14:48:01
Wilcoxon Rank Sum Test for emp by dev_sim dev_sim 0 1 Total
Rank Sum 38.000 40.000 78.000
N 8 4 12
U Stat 2.0000 30.000
Mean Rank 4,8 10,0
Exact Permutation Test Two-tailed P-value
0,1495
Normal Approximation with Corrections for Continuity and Ties Two-tailed P-value for Normal Approximation
2,293 0,0219
Total number of values that were tied 0 Maximum difference allowed between ties 0,00001 Cases Included 12
Missing Cases 1
Wilcoxon Rank Sum Test for loc by dev_sim dev_sim 0 1 Total
Rank Sum 37.000 41.000 78.000
N 8 4 12
U Stat 1.0000 31.000
Mean Rank 4,6 10,3
Exact Permutation Test Two-tailed P-value
0,1111
Normal Approximation with Corrections for Continuity and Ties Two-tailed P-value for Normal Approximation
2,463 0,0138
Total number of values that were tied 0 Maximum difference allowed between ties 0,00001 Cases Included 12
Missing Cases 1
Wilcoxon Rank Sum Test for wag by dev_sim dev_sim 0 1 Total
Rank Sum 37.000 41.000 78.000
N 8 4 12
U Stat 1.0000 31.000
Mean Rank 4,6 10,3
Exact Permutation Test Two-tailed P-value
0,1111
Normal Approximation with Corrections for Continuity and Ties Two-tailed P-value for Normal Approximation
2,463 0,0138
Total number of values that were tied 0 Maximum difference allowed between ties 0,00001 Cases Included 12
Missing Cases 1
Figure 19: Output of the Wilcoxon rank sum test based on the use of simulation
7171
The operators tend to use the same tools for both planning and development purposes. According to the answers, the most common planning and development tool is spreadsheet modelling. However, companies applying other, more sophisticated techniques (linear programming, heuristics and simulation) seem to use several techniques rather than apply just one of them (see Table 5). Furthermorecompanies having more employees and a larger fleet seem to have the tendency to apply sophisticated techniques. 6.4
Outlook and goals of planning and development
Figures 20 to 22 present the views of the respondents on the future development of railway freight and possible threats concerning it, as well as the goals of planning and development operations.
9 8 7 6 5 4 3 2 1 0 Decreaces
Stays on current level
Figure 20: Share of rail freight
7272
Increases
14 12 10 8 6 4 2 0 Competitors
Other modes of transportation
Fuel costs
Availability of resources
Investments
Lead time requirements
Unit size requirements
Figure 21: Future threats for the operators
14 12 10 8 6 4 2 0 Investment efficiency
Fuel efficiency
Network charges
Administration efficiency
Time savings
Service level
Figure 22: Planning and development goals
The majority of the respondents forecast that the share of railway freight in comparison to other modes of transportation will increase in the future. The operators see fuel cost and availability of resources as their biggest threats, while other modes of transportation and requirements concerning lead time and unit size are seen as threats by a minority of the
7373
respondents. The goals of the planning and development process are manifold. The most common goals identified were overall investment efficiency, time savings, fuel efficiency and improvements in service level.
6.5
Conclusion of the survey: relevance of the study
According to the survey, most railway freight operators use their own fleet to provide transportation services for their customers. In this respect the fact that operators choose not to outsource management and operations planning is very logical. Operations planning can be seen as a core function of a railway freight operator. According to the survey results, the most common planning and development tool is spreadsheet modelling. Companies applying other, more sophisticated techniques such as linear programming, heuristics and simulation, seem to use several techniques rather than apply just one of them. Among other sophisticated techniques, simulation is used more commonly in companies with large scale operations. This finding is logical, as the possible benefits of employing more detailed techniques are more likely to outweigh the extra cost incurred in the case of larger networks. Because of the small number of respondents, differences in the development goals of the companies using different analysis techniques could not be found. However, the most common goals were related to finding improvements in overall investment efficiency and fuel efficiency, as well as improving the service level and finding time savings. It can be concluded that operations planning can be regarded as a core function of a railway freight operator. Larger operators use simulation in their operations planning and development. Furthermore, the most common goals of planning and development are related to finding improvements in efficiency and the service level. Thus, research concentrating on enhancing the efficiency of transportation can be argued to have practical relevance. Furthermore, simulation as a method has already passed the weak market test (Kasanen et al., 1993), as it is applied by some operators.
7474
7
MANAGERIAL IMPLICATIONS
Because the articles originate from different contexts, the managerial implications of the findings involve several decision makers in a large variety of decision making contexts. Table 6 summarises the main managerial implications in the articles. As a summary of the findings of the specific research questions we argue that service specifity of investments can be a major factor affecting the efficiency of goods transportation systems. In all cases studied efficiency improvements exceeding 10 percent could be found
Table 6: Managerial implications from the articles Article
Implications
PI
Simulation should be used as a tool for managing the functionality and operability of the project product throughout the project life time. The analysed cases include avoiding an unnecessary investment of 500 000 Euros, a 10 percent reduction of utilization of a material handling system by a layout decision, indentifying means to improve delivery lead time of paper by 20 percent, and inventory reductions exceeding 10 percent in electronics manufacturing.
PII
The cost of grocery home delivery can be lower than the cost of visiting a supermarket. Even if the time used for visiting the store is not taken into account in the analysis, home delivery of groceries can be up to 43 percent more cost efficient than visiting the store. The most inefficient concept implies an increase in the transport cost by 170 percent in comparison to the most efficient concept.
PIII
The unit train concept in timber transportation could cut costs to 57% at the current average train transport distance. Positive environmental effects can be gained through substitution of road transport and avoiding double trips.
PIV
Optimal wagon system choice in timber and container transportation depends on traction charge and market price of TEU-transport. By combining transports, a 16 percent reduction in fleet can be reached. In dedicated timber transportation the 14 meter wagon is the more efficient. When combining container transports with
7575
timber transports, the 19 meter wagon becomes more attractive, as the price charged for transporting a TEU increases. Positive environmental effects can be gained through substitution of current container transport by road. PV
The effects of railway network investments on rail freight traffic surplus should be included in cost-benefit analysis to avoid a systematic bias. In the analyzed case, the cost-benefit ratio for one of the investment alternatives increased by 50 percent by including freight traffic effects in the analysis. This bias might lead to socio-economically inefficient investments favouring passenger traffic, as well as too few realized railway investments, which counteracts EU transport policy to improve Europe’s railways as a safe and clean mode of transport.
PVI
The efficiency of railway transport on the Finnish-Russian border could be enhanced by multi-use of wagons. Longer container transport legs favour the 19 metre wagon. Capacity-wise all road transit of containers could be moved to rails, approximately 350 000 TEUs could be transported using by rail per annum.
According to the first article project management concentrates on fulfilling the boundary conditions to deliver on time, in budget and to specification. It does not focus sufficiently on optimizing the potential benefits of project delivery, i.e. the project product. The objective of the paper is to highlight the importance of managing the end result or scope of a project in project management, instead of managing the project implementation process. The article suggests discrete event simulation as a tool for gaining new strategic insight into project management in terms of managing the functionality and operability of the project product. In addition to the four cases included in the first article, the following five articles present an example each of using simulation especially in transportation system analysis.
The home delivery concept is a key factor determining the cost structure and efficiency of the different service concepts in e-grocery business. Of the evaluated home delivery concepts, the concept applying next day delivery with 1-hour delivery slots decided by the customer was twice as costly as next day deliveries using unmanned box reception. According to the simulation results, e-grocery home delivery can be cheaper when compared to the cost of the household customer visiting a supermarket, given that the price for the time and vehicle use required for the shopping trip is taken into account in the analysis.
7676
Furthermore, simulation experiments combining manned and unmanned reception were conducted. The results show that the number of needed vehicles rises heavily already when the share of manned reception is 10 percent of the total.
Although e-grocery business has not gained market share as expected at the turn of the century, the results still have practical relevance as new e-grocers have emerged during the last years, at least in Sweden. The second e-grocery wave might have been initiated by the increased penetration of high speed Internet connections and fluctuating fuel prices.
In the third paper one tentative service concept specialised solely on timber transportation on rails is evaluated. In Finland freight operations have been operating under free competition from the beginning of 2007. Forest industry is accountable for approximately 60 percent of the freight on rails in Finland. As two thirds of this percentage is due to raw material transports, this is identified as one of the most potential product categories where competition might be realized. While the current practice is based on a large network of rail cars, in the new concept the cars are not detached at any time from the locomotive. Furthermore, the train is equipped with a timber loader, relaxing the requirement of having additional loading capacity at the loading station. The research results regarding the feasibility of using the unit train concept in timber transportation suggests that it could be competitive in the Finnish long-distance timber transportation market. At the current average train transport distance, the concept would cut the costs to 57% of the current levels. If applied, the proposed concept would have positive environmental effects. If it gains market share against the current railway transport models for timber, double trips to loading stations will be reduced. If road transports are substituted, the environmental effects will be even more far reaching.
In the fourth paper two different wagon types for timber transport from Russia to Finland are evaluated. In the base scenario, the wagons are used only for transporting timber, while in the alternative scenario the wagons are utilized in transporting containers to Russia. The research results regarding the feasibility of combining wood industry raw material transport
7777
with container transportation suggests that it could be economically sound and increase the efficiency of rail transports in terms of wagon turn and full loaded ratio. The finding that the combined system would reduce transportation costs is remarkable, because of the potential transportation volumes involved. If applied, the proposed concept would have positive environmental effects. As the current use of railway as the mode of transportation of Finnish exports to Russia is negligible, mainly road transports would be substituted.
The objective of the fifth paper was to estimate the impact of freight transport, when conducting cost-benefit analysis in the railway context. In Finland the impacts of freight transportation have been excluded from project appraisal for railway investments. Based on the findings of our study, we argue that freight transport should be included in the analysis when appraising railway network investments. The argument is twofold. Firstly, among the evaluated investment alternatives, freight transport counted for up to 33 percent of the net benefits, i.e. a 50 percent increase in net benefits was experienced. This amount might be pivotal, when determining the profitability of an investment. Furthermore, the relative rank of two profitable investment alternatives might change, depending on whether the effects on freight transport are analysed or not. If the effects of railway network investments on rail freight traffic surplus are excluded from cost-benefit analyses, a systematic bias is formed. This bias would lead to socioeconomically inefficient investments favouring passenger traffic. In the presented case, exclusion of freight traffic from the framework led to undermining the social desirability of all investment alternatives. If this applies to the majority of railway investments, the effect will be too few railway investments realized, which counteracts EU transport policy of improving Europe’s railways as a safe and clean mode of transport. In paper six, the ideas of paper four are elaborated. Based on the results, the optimal wagon system choice depends on the market price of container transport, traction charge of the railway operator, and also on the characteristics of the network. To be prepared for sudden changes in the cost structure, it would be safer to implement a system using 14-metre wagons, which are always the preferred option, if the combined transportation concept needs to be abandoned. On the other hand, if the better container carrying capacity of the 19-metre
7878
wagon system can be fully realised, higher container transport prices favour its use. Furthermore, the cost-efficiency of the 19-metre wagon is improved by longer container transports, as it has a better TEU-dead weight ratio. From the capacity perspective, the current eastbound transit container flow could be transported totally on railways - which would support the European Union policy of shifting road transport to rails.
7979
8
CONCLUSIONS
In recent years we have experienced an increase in the environmental awareness of the public and companies. At the same time, we have faced more volatile fuel prices and harder competition through globalization. This overall development increases the importance of efficient transportation systems. Based on an international rail freight survey, it can be concluded that operations planning and development are core functions of railway freight operators. Bigger operators use simulation in their operations planning and development. Furthermore, the most common goals of planning and development are related to finding improvements in efficiency and the service level. Thus, research concentrating on enhancing the efficiency of transportation can be argued to have practical relevance – at least in the context of railways. Furthermore, the method used, simulation, has already passed the market test as it is applied by some operators. As a summary of the findings of the specific research questions, it can be argued that service specifity of investments can be a major factor affecting the efficiency of goods transportation systems. In all the studied cases, efficiency improvements exceeding 10 percent could be found. In the home-delivery case, the investment required for efficiency improvement is the home delivery box relaxing delivery time requirements. In domestic timber procurement, the efficiency improvement is based on a dual-powered unit train equipped with a timber loader to avoid additional trips and locomotives. In combining timber transportation flows with the container flows currently served by road, the investment required is a specific rail wagon. In examining the structure of the cost-benefit analysis it was demonstrated that omitting one service provided by the system (i.e. freight transport) from the framework, the decision making might lead to inefficient investments. Furthermore, the findings demonstrate that simulation is a viable tool for evaluating a large variety of aspects of transportation systems: both on the operational level as well as in infrastructure investments. In the papers, simulation was used in analyzing customer deliveries as well as raw material transports. The
8080
analyses included evaluation of combining current flows and new business concepts in home delivery and timber transportation. In addition to examining the functionality of the specific systems, conclusions of a more aggregate level could be drawn: the environmental effects of the proposed concepts of combining flows and timber procurement by unit trains could be substantial. Also the finding that freight transport should be included in rail cost-benefit analyses should increase the efficiency of decision making in infrastructure investments. As stated above, all the cases included efficiency improvements exceeding 10 percent. For example in distribution, the home delivery of groceries can be up to 43 percent more cost efficient than the current practice of visiting the store. A majority of the cases concentrated on railway freight. However, it must be stated that transportation sequences using rails typically involve road transport legs as well. Furthermore, some of the cases involved a combination of flows currently served by rail and road. Thus, the implications of the thesis are by no means limited to the context of rail freight. In timber transportation, the item with the largest annual transport volume in domestic railway freight in Finland, transportation cost, could be reduced to 57% of the current level. Also in international timber procurement, the utilization of the railway wagons could be improved by 16 percent by combining complementary flows. The efficiency improvements also involve positive environmental effects; e.g. the road transit of 350 000 TEUs could be moved to rails annually. If the impacts of freight transport are included in the cost-benefit analysis of railway investments, an up to 50 % increase in the net benefits of the evaluated alternatives can be experienced, avoiding a possible inbuilt bias in the assessment framework and thus increasing the efficiency of national investments in the transportation infrastructure. Although e-grocery business has not gained a market share as expected at the turn of the century, the results still have practical relevance as new e-grocers have emerged during the last years, at least in Sweden. The second e-grocery wave might have been initiated by the increased penetration of high speed internet connections and volatile fuel prices. The efficiency of the transportation systems affects the profitability of the manufacturing networks they support. However, the efficiency of the transportation systems is not only dependent of the services provided but also of the infrastructure enabling the services. If the
8181
effects of railway network investments on rail freight traffic surplus are excluded from costbenefit analyses, a systematic bias is formed. This bias will lead to socio-economically inefficient investments favouring passenger traffic on rails and road investments. This in turn counteracts the EU transport policy of improving Europe’s railways as a safe and clean mode of transport.
8.1
Limitations of the study
Each one of the simulation studies concerned a specific case. As the problem owners in the cases have been willing to apply the proposed concepts, the cases have passed the weak market test (Kasanen et al., 1993). Furthermore, in each case, technical validation and verification procedures were adopted. However, when making an assumption that the findings are relevant in a broader context –as in addressing the overall research problem, the problem of induction rises. We live in a turbulent environment, where foresight with a perspective of several decades is hard to acquire. This problem is relevant especially in the context of railway investments. For example, the typical technical life time of a rail wagon in Russia is 32 years, and in practice wagons can be used even longer. In the analyses, this uncertainty was taken into account identifying the optimal wagon for the base case, were flows are not combined, for one reason or another. In the CBA-evaluation, the uncertainty was taken into account conducting sensitivity analyses. The downside of making service specific investments is the usability of the dedicated equipment in a chancing environment. The reliability of the survey is limited because of the low response rate. Because of the low number of answers, only a few statistical tests were available. Although the dependence of the use of simulation with the size of the company seems clear, the independence cannot be abandoned at p-level of 5 %. Furthermore, because of the small number of responses no comparisons between countries could be made.
8282
8.2
Further research
In this dissertation simulation was applied merely to evaluate constructs proposed for improving the efficiency of transportation systems. Thus, the research can be regarded as belonging the evaluation phase of design science (Järvinen, 2001). Although simulation as a method does not include any solution search algorithm (Law, 1998) it can be argued that completing a simulation study increases the understanding of the project team on the functionality of the system examined, and thereby can be also used as a vehicle improving the constructs or artifacts proposed. Law (2006) states that even gathering system information to one place is often valuable in its own right. The dynamic role of simulation as a tool for improving the initial systems could be measured on the basis of the recursive improvements found after the first configurations have been evaluated. This topic, however, is left for future studies. In Article I we suggested that simulation should be used as a tool for managing the functionality and operability of the project product. In the following articles, we followed that practice in the transportation system context. According to Banks et al. (2005), the applications of simulation in transportation systems are vast. Transportation networks with dynamic behaviour are a typical example of complex real-world systems, which cannot be described accurately by a mathematical model that can be evaluated analytically. Furthermore, the functionality of a transportation system is highly dependent on the applied control scheme; a feature which can be incorporated into a simulation model. However, according to the survey, in the railway context simulation is applied only by bigger operators. Although this might be partly due to the fact that the smallest companies can arrive at near optimal solutions with simpler techniques, to enhance the efficiency of railway freight, it would be beneficial to decrease the cost of simulation modeling. Moreover, the efficiency of concepts evaluated in articles III, IV and VI are not highly dependent on the scale of the operations. The reduction in the cost of simulation might be achieved e.g. by constructing specific, literature review-based guidelines for building simulation models of transportation systems, or government-led efforts to ensure the availability of simulation expertise.
8383
Simulation services could be used also in road transport to enhance efficiency. This is even more important, because the majority freight transport is completed on roads. Furthermore, the size of a typical road transport company is small. To investigate the current status of the use of different techniques, a similar survey could be conducted in the road context. To get a broader view on the planning operations, also customers, such as breweries, wholesalers and e.g. forest industry companies should be included in the sample.
Article II investigated the cost level and structure of different home delivery concepts. As the current demographics in the Nordic countries lead to a situation were an increasing part of the population consists of elderly people living on their own and served by the community, the efficient management of grocery home delivery is of great public interest. With the same methodology, also other services can be analysed. The research in article V on the role of freight transport in railway cost-benefit analysis was based solely on one case. The analysis showed a potential bias included in the current method. However, we would like to expand the analysis to cover more cases to see if the bias systematically reduces the fulfilment of the investment criteria. Furthermore, we would like to use the methodology in a large scale freight transport railway environment –currently the Baltic countries of Estonia, Latvia and Lithuania have high volumes of transit freight on rails (e.g. Ojala et al. 2005), but relatively low amount of passenger transport. It would be interesting to complete CBA evaluation of one of these east-west routes. In articles IV and VI combining the flows on the Finnish-Russian border was seen as a way to increase the efficiency of transport. A similar structure of trade flows can be found on the Russian-Chinese border. Also China imports a large quantity of Russian wood by rail. This offers an interesting topic for further study.
8484
REFERENCES Baker, P. (2007). An Exploratory Framework of the Role of Inventory and Warehousing in International Supply Chains. International Journal of Logistics Management, Vol. 18, No. 1, pp. 64-80 Ballou, R. H. (1989). Heuristics: Rules of Thumb for Logistics Decision Making, Journal of Business Logistics, Volume 10, Number 1 Banks, J. Carson, J.S., Nelson, B.L. and Nicol, D.M. (2005). Discrete-Event System Simulation. Prentice-Hall, New Jersey 4th edition Banks, J. and Gibson, R. (1997). 10 Rules for Determining when Simulation is Not Appropriate. IIE Solutions, Vol. 29, No. 9, pg. 30. Bayraktar, E. Koh, S. C. L. Gunasekaran, A. Sari, K. and Tatoglu, E. (2008). The role of forecasting on bullwhip effect for E-SCM applications. International Journal of Production Economics 111(1), 193-204. Bowersox, D.J., Closs D.J. and Cooper, M. B. (2007). Supply Chain Logistics Management, McGrowHill, New York Bowersox, D.J., Closs D.J. and Helferich, O. K. (1986). Logistical Management: A Systems Integration of Physical Distribution, Manufacturing Support and Materials Procurement, Macmillian Publishing, New York Cantos, P. and Campos, J. (2005). Recent changes in the global rail industry: facing the challenge of increased flexibility. European Transport - Trasporti Europei, No 29, pp. 1-21. CEPI (2001). European Pulp and Paper Industry: Annual Statistics 2001. Confederation of European Paper Industries. CEPI (2003). European Pulp and Paper Industry: Annual Statistics 2003. Confederation of European Paper Industries. CEPI (2006). Key Statistics 2006 – European Pulp and Paper Industry. Confederation of European Paper Industries. Chen, F. Drezner, Z. Ryan, J.K. and Simchi-Levi, D (2000). Quantifying the Bullwhip Effect in a Simple Supply Chain: The Impact of Forecasting, Lead Times, and Information. Management Science 46(3), 436-443. Cheng, L. and Duran, M. A. (2004). Logistics for world-wide crude oil transportation using discrete event simulation and optimal control, Computers & Chemical Engineering , Vol. 28, No. 6-7, pp. 897 - 911. Chung, C. A. (2004). Simulation Modeling Handbook – A Practical Approach. CRC Press, Boca Raton, USA Coleno. F. C. (2008). Simulation and evaluation of GM and non-GM segregation management strategies among European grain merchants. Journal of Food Engineering, Vol. 88, No. 3, pp. 306314 Conover, W. J.(1999). Practical Nonparametric Statistics. John Wiley and Sons, New York 3rd edition Cruijssen, F. Bräysy, O. Dullaert, W. Fleuren, H. and Salomon, M. (2007). Joint route planning under varying market conditions. International Journal of Production Development and Logistics Management 37(4), 287-304. De Jong, G. and Ben-Akiwa, M. (2007). A micro-simulation model of shipment size and transport chain choice, Transportation Research Part B, Vol. 41, No. 9, pp. 950 - 965.
8585
Eloranta, E. and Räsänen, J. (1986). Ohjattavuusanalyysi – Tutkimus tuonannon ja sen ohjauksen kehittämisestä Suomessa (in Finnish, free translation of title is as follows: ‘Controllability engineering – A study of production and production control development in Finland’). SITRA. Finland: Helsinki. European Union (2006). Keep Europe moving - Sustainable mobility for our continent, Mid-term review of the European Commission’s 2001 Transport White Paper. European Commission Eurostat (2008). Modal split of freight transport. Available at URL: http://epp.eurostat.ec.europa.eu/ Finnish Forest Research Institute (2006). Finnish Statistical Yearbook of Forestry 2006. Available at URL: http://www.metla.fi/metinfo/tilasto/index.htm Finnish National Board of Customs (2007a). Itään suuntautuva maantietransito (in Finnish, free translation of title is as follows:”Eastbound road transit”) Available at URL: http://www.tulli.fi/ Finnish National Board of Customs (2007b). Ulkomaankaupan kuljetukset (in Finnish, free translation of title is as follows:”Transports of foreign trade”) Available at URL: http://www.tulli.fi/ Finnish Port Association (2008). Transit Container Flows, Available at URL: http://www.finnports.com/statistics.php Finnish Rail Administration (2006). Railway Network of Finnish Rail Administration. Accessed from http://www.rhk.fi/. Godwin, T. Gopalan, R. & Narendran, T.T. (2008). Tactical locomotive fleet sizing for freight train operations. Transportation Research Part E 44(3), 440-454. Gorman, M.F. (2007). Evaluating the public investment mix in US freight transportation infrastructure. Transportation Research Part A: Policy and Practice, Vol. 41, doi:10.1016/j.tra.2007.06.012 Grant-Muller, S. M. MacKie, P. Nellthorp, J. & Pearman, A. (2001). Economic appraisal of European transport projects: The state-of-the-art revisited. Transport Reviews, 21:2, pp. 237-261 Guedes, A. P. (1995). An Integrated Approach to Logistics Strategy Planning Using Visual Interactive Modelling and Decision Support, Doctoral Dissertation, School of Management, Centre for Logistics and Transportation, Cranfield University, UK Gulyani,. S. (2001). Responsive Effects of Poor Transportation on Lean Production and Industrial Clustering: Evidence from the Indian Auto Industry. World Development, Vol. 29, No. 7, pp. 1157-1177 Harrel, C. and Tumay, K. (1997). Simulation Made Easy, IIE Solutions, July 1997 Hilmola, O-P. (2007). European railway freight transportation and adaptation to demand decline Efficiency and partial productivity analysis from period of 1980-2003. International Journal of Productivity and Performance Management 56(3), 205-225. Hilmola, O-P and Szekely B. (2006). Deregulation of Railroads and Future Development scenarios in Europe – Literature Analysis of Privatization Process Taken Place in US, UK and Sweden. Lappeenranta University of Technology, Department of Industrial Engineering and Management. Research Report 169. Hilmola, O-P., Ujvari, S. and Szekely, B. (2007). Deregulation of railroads and future development scenarios in Europe – Analysis of the privatization process taken place in US, UK and Sweden. World Review of Intermodal Transportation Research, Vol. 1, No. 2, pp. 146 - 169. Hoover, S. and Perry, R. (1989). Simulation - A problem solving approach, Addison-Wesley, USA Iikkanen, Pekka and Mika Varjola (2002). Rataverkon tavaraliikenne-ennuste 2025 (in Finnish, free translation of title is as follows:”Railway network freight volume forecast up to 2025”). Ratahallintokeskuksen julkaisuja, A7. Finland: Helsinki Ireland, P. Case, R. Fallis, J Van Dyke, C Kuehn, J. and Meketon, M.(2004). The Canadian Pacific Railway transforms operations by using models to develop its operating plans. Interfaces 34(1), 514. Järvinen, P. (2001). On Research Methods, Opinpajan kirja, Tampere , Finland
8686
Kariniemi, Arto (2006). Puunkorjuu ja kaukokuljetus vuonna 2005 (in Finnish, free translation of title is as follows: ”Harvesting and long-distance transportation in 2005”). Metsätehon katsaus, 19. Finland: Helsinki. Kariniemi, Arto (2008). Puunkorjuu ja kaukokuljetus vuonna 2007 (in Finnish, free translation of title is as follows: ”Harvesting and long-distance transportation in 2008”). Metsätehon katsaus, 34. Finland: Helsinki. Kasanen, E., Lukka, K. and Siitonen, A. (1993). The constructive approach in management accounting research. Journal of Management Accounting Research, Vol.5, pp 243-264. Kidokoro, Y (2006). Regulatory reform and the congestion of urban railways. Transportation Research Part A 40 (1), 52-73. Kirjavainen, E.; Frank, T. and Varila, T. (2002). Tavaraliikenteen vapauttaminen kilpailulle Suomen rautateillä. Selvitys vaikutuksista. (in Finnish, free translation of title is as follows: ”Deregulation of Cargo Traffic on the Finnish Railways. Survey of Implications”). Publications of the Ministry of Transport and Communications 21/2002. Finland: Helsinki. Kuo C-C., R. and Nicholls, G.M. (2007). A mathematical modelling approach to improving locomotive utilization at a freight railroad. Omega 35(5), 472-485. Law, A. M. (1998). Simulation of Manufacturing Systems. Simulation Seminar 8-11th September 1998, Espoo, Finland Law, A. M. (2006). Simulation Modeling and Analysis, McGraw-Hill, USA. 4th edition Law, A. M., McComas, M. G.and Vincent, S. G. (1994). The Crucial Role of Input Modeling in Successful Simulation Studies, Industrial Engineering, July 1994 Lehtonen, J-M and Seppälä U. (1997). A methodology for data gathering and analysis in a logistics simulation project, Integrated manufacturing systems, Vol. 8, No. 5-6, pp. 351-358. Ljung, L. and Glad, T (1994). Modeling of Dynamic Systems, Prentice Halll, Englewood Cliffs, NJ, USA. Lukka, K. (1991). Laskentatoimen tutkimuksen epistemologiset perusteet [in Finnish: Epistemological foundations in management accounting research]. Liiketaloudellinen Aikakauskirja No:2, 160-16. Malavasi, G. (2000). Simulation of stochastic elements in railway systems using self-learning processes. European Journal of Operational Research, Vol. 131, No. 2, pp. 262 - 272. March, S. T. and Smith, G. F. (1995). Design and natural science research on information technology, Decision Support Systems, Vol. 15, No. 4, pp. 251 - 266. Mason, R. Lalwani, C. and Boughton, R. (2007) Combining vertical and horizontal collaboration for transport optimisation. Supply Chain Management: An International Journal 12(3), 187-199. Ministry of Transport and Communications Finland (2003). Guidelines for the Assessment of Transport Infrastructure Projects. Publications of the Ministry of Transport and Communications 34/2003 Ministry of Transport and Communications Finland (2004). Liikenneväyläpolitiikan linjauksia vuosille 2004 - 2014. (in Finnish, free translation of title is as follows:”Definition of corridor policy for years 2004 - 2014”), Publications of the Ministry of Transport and Communications 7/2004 Mäkitalo, M. (2007). Market Entry and the Change in Rail Transport Market when Domestic Freight Transport Opens to Competition in Finland, Doctoral Dissertation, Department of Industrial Engineering and Management, Institute of Transportation Engineering, Tampere University of Technology, Finland Naim, Mohamed, Andrew T. Potter, Robert J. Mason and Nicola Bateman (2006). The Role of Transport Flexibility in Logistics Provision. International Journal of Logistics Management. Vol. 17, No. 3, pp. 297-311 Naylor, T., Balintfy, J., Burdick, D. and Kong, C. (1966). Computer Simulation Techniques. John Wiley, U.S.A.
8787
Neilimo, K.and Näsi, J. (1980). Nomoteettinen tutkimusote ja suomalainen yrityksen taloustiede, tutkimus positivismin soveltamisesta [in Finnish: Nomothetical approach and Finnish business science, a research in application of posistivism]. University of Tampere. Yrityksen taloustieteen ja yksityisoikeuden laitoksen julkaisuja, Series A2: tutkielmia ha raportteja 12. Tampere Obermauer, Andrea (2001). National Railways Reform in Japan and the EU: evaluation of institutional changes. The Institute of Transport Policy Studies, Tokyo, Accessed from http://www.jrtr.net/jrtr29/pdf/f24_obe.pdf. Persson, F. (2003). Discrete Event Simulation of Supply Chains –Modeling, Validation and Analysis, Doctoral Dissertation, Lindköping Institute of Technology, Lindköping , Sweden Potter, A. and Lalwani, C. (2008). Investigating the impact of demand amplification on freight transport, Transportation Research Part E, Vol. 44, No. 5, pp. 835 - 846. Quinet, E. and Vickerman, R. (2004). Principles of Transport Economics. Edward Elgar Publishing Limited, UK. Rijsenbrij, Joan C., Ottjes, Jaap A. (2007). New Developments in Airport Baggage Handling Systems, Transportation Planning and Technology, 30:4, 417 –430. Rinta-Piirto, J. and Pesonen, H. (2006). Seinäjoki-Oulu-radan palvelutason parantaminen: yhteiskuntataloudelliset tarkastelut (in Finnish, free translation of title is as follows: ”Improving the service level of Seinäjoki-Oulu railroad: Macro-Economic Investigation”). Ratahallintokeskus (The Finnish Rail Administration). Rodrigue,. J-P (2006). Transportation and the Geographical and Functional Integration of Global Production Networks. Growth and Change, Vol. 37, No. 4, pp. 510-525 Ross, M.R. (2006). Simulation. Elsevier Academic Press, London, 4th edition Ruutikainen, P. and Hunt T. (2007). Container Transit Traffic in Finnish and Estonian Ports. In: Hilmola, O-P., Tapaninen, U., Terk, E. and Savolainen, V-V. (Eds.): Container Transit in Finland and Estonia-Current Status, Future Demand ans Implications on Infrastructure Investments in Transportation Chain. Centre for Maritime Studies, Research Report A 44, University of Turku, pp.23–49. Seppälä, U. (1995). Developing Logistics in the Outer Circle of the European Union, Licensiate Thesis, Helsinki University of Technology, Faculty of Mechanical Engineering Stevenson, W. J. (2007). Operations Management. McGrow-Hill/Irvin, Boston, Mass. 9 th edition Sugden, R. and A. Williams (1978). The principles of practical cost-benefit analysis. Oxford University Press. Tervonen, T., Hakonen, H. and Lahdelma, R. (2008). Elevator planning with stochastic multicriteria acceptability analysis. Omega, 36, pp. 352-362 Towill, D.R.. (2005) The Impact of Business Policy on Bullwhip Induced Risk in Supply Chain Management International Journal of Physical Distribution & Logistics Management, Vol. 35, No. 8, pp. 555-575 Ujvari, S. and Hilmola, O-P. (2006). Advanced manufacturing simulation – Minor system details can be major issues in the real world. Industrial Management & Data Systems, Vol. 106, No. 8, pp. 1166 - 1186. Vafidis, D. (2007). Approaches for knowledge and application creation in logistics, Doctoral Dissertation, School of Management, Centre for Logistics and Transportation, Turku School of Economics, Finland Vassallo, J. M. (2005). Nature or nurture: Why do railroads carry greater freight share in the United States than in Europe? Research Working Paper Series, WP05-15, Harvard University, USA. Vieillescazes, T. (2007). The French PPP Experience in the Rail Sector. Regional Dutch Infrastructure Fund (DIF). PPP Workshop Riga, March 6-8, 2007. Available at: http://www.tsi.lv/Research/Conference/RegWorkshop/6%20%20March%20-
8888
04/PPP%20WB%20Seminar%20Riga%20-%20rail%20sector%20TV%20final.pdf, Retrieved 20.Mar.2008 Weisbrod,. G. (2008). Models to predict the economic development impact of transportation projects: historical experience and new applications. The Annals of Regional Science, Vol. 42, No. 3, pp. 519-543 White,. K. J. C. (2008). Sending or Receiving Stations? The Dual Influence of Railroads in Early 20thCentury Great Plains Settlement. Population Research and Policy Review, Vol. 27, No. 1, pp. 89115 Wu, Y.C. (2003) Lean manufacturing: a Perspective of Lean Suppliers International Journal of Operations &Production Management , Vol. 23, No. 11, pp. 1349-137 Yin, R. K. (2003) Case study Research Design and Methods, Sage Publications, Beverly Hills. 3rd edition
8989