Chapter 6
Energy Conversion Technologies
Photo credit: Appropriate Ttinologies, International
Contents Page
INTRODUCTION AND SUMMARY . . . . . . . . . . . . . . . . . . . . . . . . . . . . . . . . . . . . . . . . . . . . . . . . . . . 179 Introduction to the Energy Supply Sector . . . . . . . . . . . . . . . . . . . . . . . . . . . . . . . . . . . . . . . . . . . . . . 179 Energy Conversion Technologies . . . . . . . . . . . . . . . . . . . . . . . . . . . . . . . . . . . . . . . . . . . . . . . . . . . . . 180 THE POWER SECTOR IN THE DEVELOPING WORLD: IMPROVEMENTS COEXISTING SYSTEMS . . . . . . . . . . . . . . . . . . . . . . . . . . . . . . . . . . . . . . . 183 Generating System Rehabilitation . . . . . . . . . . . . . . . . . . . . . . . . . . . . . . . . . . . . . . . . . . . . . . . . . . . . . 183 Transmission and Distribution Systems .,...... . . . . . . . . . . . . . . . . . . . . . . . . . . . . . . . . . . . . . . . . 185 System Interconnections . . . . . . . . . . . . . . . . . . . . . . . . . . . . . . . . . . . . . . . . . . . . . . . . . . . . . . . . . . . . 187 . Improved System Planning Procedures . . . . . . . . . . . . . . . . . . . . . . . . . . . . . . . . . . . . . . . . . . . . . . . . 188 Improved Management . . . . . . . . . . . . . . . . . . . . . . . . . . . . . . . . . . . . . . . . . . . . . . . . . . . . . . . . . . . . . . 188 Environmental Considerations . . . . . . . . . . . . . . . . . . . . . . . . . . . . . . . . . . . . . . . . . . . . . . . . . . . . . . . . 189 TECHNICAL OPTIONS FOR NEW ON-GRID GENERATION . . . . . . . . . . . . . . . . . . . . . . . . . . . 190 Clean Coal . . . . . . . . . . . . . . . . . . . . . . . . . . . . . . . . . . . . . . . . . . . . . . . . . . . . . . . . . . . . . . . . . . . . . . . . . 190 Fluidized Bed Combustion (FBC) . . . . . . . . . . . . . . . . . . . . . . . . . . . . . . . . . . . . . . . . . . . . . . . . . . . . . 191 Integrated Gasification Combined Cycle (IGCC) . . . . . . . . . . . . . . . . . . . . . . . . . . . . . . . . . . . . . . . . 192 Applications to the Developing World. . . . . . . . . . . . . . . . . . . . . . . . . . . . . . . . . . . . , . . . . . . . . . . . . 193 Large Hydra . . . . . . . . . . . . . . . . . . . . . . . . . . . . . . . . . . . . . . . . . . . . . . . . . . . . . . . . . . . . . . . . . . . . . . . . 193 Nuclear Power. . . . . . . . . . . . . . . . . . . . . . . . . . . . . . . . . . . .. . . . . . . . . . . . . . . . . . . . . . . . . . . . . . . . . . 194 Gas Turbines . . . . . . . . . . . . . . . . . . . . . . . . . . . . . . . . . . . . . . . . . . . . . . . . . . . . . . . . . . . . . . . . . . . . . . . 196 Cogeneration . . . . . . . . . . . . . . . . . . . . . . . . . . . . . . . . . . . . . . . . . . . . . . . . . . . . . . . . . . . . . . . . . . . . . . . 197 Geothermal . . . . . . . . . . . . . . . . . . . . . . . . . . . . . . . . . . . . . . . . . . . . . . . . . . . . . . . . . . . . . . . . . . . . . . . . . 198 Solar Thermal . . . . . . . . . . . . . . . . . . . . . . . . . . . . . . . . . . . . . . . . . . . . . . . . . . . . . . . . . . . . . . . . . . . . . . 200 Fuel Cells . . . . . . . . . . . . . . . . . . . . . . . . .. . . . . . . . . . . . . . . . . . . . . . . . . . . . . . . . . . . . . . . . . . . . . . . . . 200 Comparing the Technologies . . . . . . . . . . . . . . . . . . . . . . . . . . . . . . . . . . . . . . . . . . . . . . . . . . . . . . . . . 200 OPTIONS FOR RURAL ELECTRICITY SERVICE . . . . . . . . . . . . . . . . . . . . . . . . . . . . . . . . . . . . . . 201 Wind Turbines. . . . . . . . . . . . . . . . . . . . . . . . . . . . . . . . . . . . . . . . . . . . . . . . . . . . . . . . . . . . . . . . . . . . . . 202 Photovoltaics (PVs) . . . . . . . . . . . . . . . . . . . . . . . . . . . . . . . . . . . . . . . . . . . . . . . . . . . . . . . . . . . . . . . . . 204 MicroHydropower . . . . . . . . . . . . . . . . . . . . . . . . . . . . . . . . . . . . . . . . . . . . . . . . . . . . . . . . . . . . . . . . . . 206 Engine Generators . . . . . . . . . . . . . . . . . . . . . . . . . . . . . . . . . . . . . . . . . . . . . . . . . . . . . . . . . . . . . . . . . . 209 Comparing the Technologies . . . . . . . . . . . . . . . . . . . . . . . . . . . . . . . . . . . . . . . . . . . . . . . . . . . . . . . . . 209 Grid Extension. . . . . . . . . . . . . . . . . . . . . . . . . ,... . . . . . . . . . . . . . . . . . . . . . . . . . . . . . . . . . . . . . . . . . 211 OIL REFINING . . . . . . . . . . . . . . . . . . . . . . . . . . . . . . . . . . . . . . . . . . . . . . . . . . . . . . . . . . . . . . . . . . . . . . . 212 BIOMASS . . . . . . . . . . . . . . . . . . . . . . . . . . . . . . . . . . . . . . . . . . . . . . . . . . . . . . . . . . . . . . . . . . . . . . . . . . . . 214 Gases and Electricity From Biomass . . . . . . . . . . . . . . . . . . . . . . . . . . . . . . . . . . . . . . . . . . . . . . . . . . 215 Gas Cost Comparisons . . . . . . . . . . . . . . . . . . . . . . . . . . . . . . . . . . . . . . . . . . . . . . . . . . . . . . . . . . . . . . . 222 Liquid Fuels From Biomass . . . . . . . . . . . . . . . . . . . . . . . . . . . . . . . . . . . . . . . . . . . . . . . . . . . . . . . . . . 222
Boxes Box
Page
6-A. Thermal Plant Rehabilitation in Kenya . . . . . . . . . . . . . . . . . . . . . . . . . . . . . . . . . . . . . . . . . . . . . . 186 6-B. Opportunities for Interconnection, Regional Integration, and Joint Development of Electricity Systems in the Developing World . . . . . . . . . . . . . . . . . . . . . . . . . . . . . . . . . . . . . . 189 6-C. Training Programs for Utility Planning . . . . . . . . . . . . . . . . . . . . . . . . . . . . . . . . . . . . . . . . . . . . . . 190 6-D. Nuclear Power in China . . . . . . . . . . . . . . . . . . . . . . . . . . . . . . . . . . . . . . . . . . . . . . . . . . . . . . . . . . . 196 6-E. Wind Turbines for Water Pumping . . . . . . . . . . . . . . . . . . . . . . . . . . . . . . . . . . . . . . . . . . . . . . . . . . 202 6-F. Photovoltaic Powered Vaccine Refrigerators . . . . . . . . . . . . . . . . . . . . . . . . . . . . . . . . . . . . . . . . . . 206 6-G. Residential Photovoltaic Systems in the Dominican Republic . . . . . . . . . . . . . . . . . . . . . . . . . . 207 6-H. Micro-Hydropower in Pakistan . . . . . . . . . . . . . . . . . . . . . . . . . . . . . . . . . . . . . . . . . . . . . . . . . . . . . 208 6-I Gasifier-Engine Implementation in the Phillippines and India.. . . . . . . . . . . . . . . . . . . . . . . . . 219 . 6-J. Current Gas Turbine Research . . . . . . . . . . . . . . . . . . . . . . . . . . . . . . . . . . . . . . . . . . . . . . . . . . . . . . . 220
.—. .—
Chapter 6
Energy Conversion Technologies also been discussed in other recent OTA reports,2 so the discussion here will be primarily limited to issues of particular relevance to developing countries.
INTRODUCTION AND SUMMARY Introduction to the Energy Supply Sector The previous chapters analyzed the services that energy provides to consumers in the major end-use sectors. The analysis identified many cost-effective and often capital-saving technical opportunities for improving the efficiency of energy use in all sectors. Despite these benefits, institutional problems, a variety of market failures, and many other factors frequently discourage the adoption of these energy efficient technologies even when they are mature and well known. Even under the most optimistic assumptions about improvements in energy efficiency, however, energy supplies will need to increase, Rapid population growth, economic growth, and structural change are creating a demand for energy services (see ch. 2) that cannot be met by efficiency gains alone. According to the U.S. Agency for International Development, for example, approximately 1,500 gigawatts (GW) of new electricity generating capacity could be needed in the developing world by 2008. Under an aggressive program of efficiency improvements in both the supply and demand sectors, this growth in demand could be reduced to about 700 GW, which would still require more than a doubling of present day capacity.l Chapters 6 and 7 therefore turn to the ways in which energy is supplied in developing countries— the processes and technologies by which energy is produced, converted from one form into another, and delivered to users. Parallel to the analysis of end-use sectors in chapters 3 to 5, a range of energy supply technologies are examined, particularly in relation to their suitability for the special circumstances and opportunities of developing countries, the problems that could impede their adoption, and the policy issues involved. Many of these technologies have
Chapter 6-the conversion sector--covers that part of the energy sector devoted to turning primary or raw energy, such as coal, crude oil, gas, biomass, and other resources, into high quality forms for end users. Currently, the major conversion processes include electricity generation, oil refining, and, for biomass fuels, the production of charcoal from wood and ethanol from sugar cane (largely confined in the developing world to Brazil). In the future, the biomass conversion sector could expand to include a wider range of liquid fuels, gases, and electricity.3 Chapter 7—primary energy supplies-completes the exploration of the energy system back upstream to its sources: the exploration and mining of fossil fuels and the growth and collection of biomass. The energy resources available to a country invariably determin e the composition of its fuel supply. Table 6-1 and figure 6-1 illustrate the current structure of primary energy supplies in developing countries. According to these data, biomass is the most important fuel, closely followed by oil and coal. There is considerable variation between countries. For example, coal accounts for 70 percent of energy use in China and almost 40 percent in India but is little used elsewhere. For the rest of the developing countries, oil is the major source of commercial primary energy. Natural gas accounts for a relatively small share in all countries. Primary electricity (e.g., hydroelectricity) is an important component of the energy supply mix. A large quantity of electricity is also generated from fossil fuels. Developing countries meet a much higher share of their needs with biomass and much less with natural gas than the industrial nations. The share of biomass in the total energy supply mix of developing
IUS. Agency for ~termtio~ Developmen~ Office of Energy, PoKer Shortages in Developing coun~les: Magnifude, ImPacts, solutions, ad the Role of the Private Sector (Washington DC: U.S. Agency for International Development, March 1988).Foreeasts quoted here are for the medium economic growth rate scenario. ‘See, for example: U.S. Congress, Office of Technology Assessment, Energy Technology Choices: Shaping Our Future, OTA-E-493 (Washington, DC: U.S. Government Printing Office, July 1991), 3See ~so, us. ConWess, Office of TW~oloH Assessment, Renewable EnergJr . Technology: Research, Deve[opmen(, and Commercia[ prospects (forthcoming).
–179–
180 . Fueling Development: Energy Technologies for Developing Countries
Table 6-1—1985 Primary Energy Supplies (exajoules)
Coal World . . . . . . . . . . . . . . . . . . . . . . . . . . . . 88.7 Industrial countries . . . . . . . . . . . . . . . . . 63.5 Developing countries . . . . . . . . . . . . . . . 25.2 Share of industrial countries ....,. . . . . 72% Share of developing countries . . . . . . . . 28%
Oil
Gas
Primary electricity
Total commercial
Biomass
Total energy
104.6 77,0 27.7 74% 26%
58.2 51.7 6,5 89% 11%
33.0 26.6 6.4 81% 19%
284.5 218.7 65.7 77% 23%
36.9 5.5 31.3 15% 85%
321.3 224.2 97.1 70% 30%
NOTE: As in table 2-1, the values reported for developing country biomass are too low. Field surveys indicate that biomass accounts for roughly one-third of the energy used in developing countries. SOURCE: World Energy Conference, G/oba/Energy Perspectives 2000-2020, 14th Congress, Montreal 1989 (Paris: 1989).
countries generally declines as the standards of living and the extent of urbanization rises. The developing world as a whole produces more energy than it consumes, and significant amounts of both oil and gas are exported. Again, there are large disparities among countries. Only a few developing countries, primarily the OPEC nations, export energy; most are heavily import dependent. Reliable and affordable supplies of energy are critical for economic and social development. Conversely, inadequate or unreliable energy supplies frustrate the development process. Electricity supplies in many developing countries are characterized by disruptions, including blackouts, brownouts, and sharp power surges. Lost industrial output caused by shortages of electricity have had noticeable detrimental effects on Gross Domestic Product (GDP) in India and Pakistan. Supplies of household fuels are notoriously intermittent, leading households to install a wide range of cooking systems in order to ensure against the shortage of any one fuel. Transportation services are similarly subject to disruption because of unreliable fuel supplies. Unreliable supplies of high quality fuels and electricity also impede the diffusion of improved technologies that are sensitive to fuel or power quality. On the other hand, energy supply systems are expensive to build and maintain. Capital intensive electricity generating stations and petroleum refineries already account for a large part of all public investment budgets in developing countries, with electric utilities taking as much as 40 percent of public investment in some .4 Overall, annual power sector investments would have to double to meet 4u,s. ConweSS, Office of Te~~~lo~ Assessment Energy in Office, March 1991), p. 93.
rapidly growing demands. This would take up virtually the entire projected annual increase in the combined Gross National Product (GNP) of the developing countries, leaving little for other pressing development needs. Further, a large part of the investment in capital equipment for energy facilities and in fuel to operate them must be paid for in scarce foreign exchange, which is already under pressure in many countries to service foreign debt. Similarly, there is often a shortage of local currency to pay for energy development due to inadequate revenues from existing operations. The energy supply sector also relies heavily on other scarce resources, such as skilled labor and management, and can cause environmental damage.
Energy Conversion Technologies The conversion sector covers the processing of primary-or raw-energy such as coal and crude oil into forms (e.g., electricity, gasoline, and diesel) required by end users. Historically, most fuels passed from the production phase to final consumers with minimum processing or conversion; this remains the case today in many developing countries. As development takes place, however, an increasing amount of processing takes place in order to make these fuels cleaner and more effective, notably in the share of fossil fuels converted into electricity. If biomass based fuels are to provide an increasing share of developing country energy supplies, they too will have to undergo further processing into convenient forms, such as liquids, gases, and electricity with properties that can enable them to compete with energy products based on fossil fuels.
D~e/oping Counm’es, om-&$gG (Washington ~:
U.S. Government ~thlg
Chapter 6--Energy Conversion Technologies . 181
country utilities is deteriorating. Management attention must often focus on short term remedial measures, to the detriment of sound long term planning. Industry is frequently forced into self generation on a large scale, often with diesel generators dependent on high-cost imported oil.
Figure 6-l—1 985 Energy Consumption in Developing Countries
Although the electricity systems of the developing world are as diverse as the countries themselves, several common issues underlie their frequently poor technical and financial performance: ●
●
Primary electricity 7%
fuels 32%
● ●
Developing nations Total ■ 97 exajoules ●
SOURCE: World Energy Conference, Global Energy Perspectives 20002020, 14th Congress, Montreal 1989 (Paris: 1989). ●
The following survey of the three major conversion sectors--electricity; oil refining; and liquids, gases, and electricity from biomass—indicates that there are many technologies presently available or under development to meet the rapidly growing needs of this sector. There are problems, however, in financing the expansion of these sectors on the scale projected, and in improving the poor technical performance that dogs the electricity and refining sectors in many developing countries. These problems also could impede the timely adoption of energy efficient equipment. Electricity Electric utilities in developing countries face a rapidly growing demand for electricity, stimulated in many cases by low, subsidized prices. With large segments of the population typically still without electricity, the political and social pressures for system expansion are strong. Many utilities, however, have difficulty meeting even present day demand. Electricity systems in many developing countries are poorly maintained, resulting in unreliable service and frequent system breakdowns. The operating efficiency of electricity generating equipment in developing countries-with some notable exceptions—is often substantially below that of industrialized countries with similar technology, and the financial performance of many developing
overstaffing, but shortages of trained manpower; lack of standardization of equipment; limited system integration and planning; political and social obligations to provide parts of the population with electricity at less than cost; shortages of foreign exchange to buy spare parts; and a regulatory framework that discourages competition,
Poor current performance raises doubts about the ability of the system to meet the projected rapid rise in demand even if the financial resources were available for capacity expansion. The effective deployment of technology will therefore depend on addressing these related financial, policy, and institutional issues. Given low operational efficiencies, technologies relating to plant rehabilitation, life extension, system interconnections, and improvements in transmission and distribution (T&D) systems often offer higher returns to capital investment than new generating technologies. Plans for system expansion, reflecting indigenous energy resources, center on coal and hydro, followed by gas, nuclear, oil, and geothermal. Developing counties could benefit from several technologies in this expansion. Fluidized bed combustion (FBC) with its greater tolerance for low quality coal could improve plant availability--offsetting its higher initial capital cost—as well as reduce SOx and NOX emissions. Combined cycle coal plants, specifically integrated gasification combined cycle (IGCC) plants, have much higher efficiencies than conventional coal plants, but uncertainties remain over IGCC’s performance with lower quality coals. Gas turbines operated in a steam injection mode also promise to be attractive for electricity generation in the devel-
182 ● Fueling Development: Energy Technologies for Developing Countries
oping world. Gas turbines are small and modular with short construction lead times and high operating efficiencies.5 These characteristics make gas turbines particularly attractive to private power producers with limited capital. Natural gas or gasified biomass also have environmental benefits relative to coal and oil. Although hydropower is a viable option for many developing countries, concerns about environmental and social impacts are coming to the fore. Growing knowledge of the environmental impacts of large scale hydro projects can, however, contribute to better project design with lesser environmental impacts and a longer productive life for the plant. Much of the planned expansion in nuclear power (in countries with large systems such as South Korea, China, and Taiwan) is based on existing nuclear technology. Smaller, modular, and safer nuclear power technologies under development in the industrialized countries might extend the market for nuclear power in developing countries depending on their ultimate cost and performance characteristics. The technical skill requirements of nuclear power may continue to limit its use in the developing world, as may the larger problems of nuclear proliferation and waste disposal.
encourage the use of integrated resource management approaches, giving equal weight to conservation and renewable as alternatives to conventional supply expansion; and . stimulate, through institutional and other reform, greater participation by the private sector. ●
Lack of training and familiarity with modern concepts of utility management could be addressed in part through training programs and “twinning” arrangements with U.S. and other utilities. Oil Refining Although there is a wide variation among countries, refinery operations in many developing nations are substantially below international norms in terms of efficiency and cost. Average refinery operating costs in Africa, for example, are $2 per barrel compared with $0.75 in the rest of the world. A variety of technologies are available today that can improve refinery performance. Examples of cost-effective retrofits include heat recovery from stack gas and recuperation of flared relief valve and other gas. By the end of the decade, new catalysts are expected to improve product yields. These technology improvements would increase operational efficiencies and somewhat reduce the adverse environmental impacts of oil refining.
Rural electrification is an important component of economic and social development in the developing world. While costs are variable, site specific, and poorly documented, the costs of stand alone renewables--notably microhydro, wind turbines, and photovoltaics--are competitive in many cases with diesel generators and grid extension, and in addition have significant environmental benefits compared to conventional systems.
Problems hindering investment in the rationalization of refinery operation in the developing world include: lack of foreign exchange for parts; distorted pricing structures and earmarked government subsidies that hide the inefficiency of the plant; global overcapacity; and, in some countries, local markets that are too small to support efficient equipment.
Thus, there are many opportunities for technical improvement-in improving the existing system, in system expansion, and in rural electrification-but there are serious financial and institutional impediments. There are several ways in which the United States might help. The United States could work with the multilateral development agencies, which are major providers of finance to the electricity sector, to:
Biomass Fuels
. improve the operational and financial efficiency of the sector;
An alternative to refineries for those countries with natural gas is methanol conversion. New technologies permit the direct conversion of methane to methanol near the well head cheaply enough to be used for such energy services as transport.
Increases in energy consumption in developing countries are spurring efforts to use domestic resources, including biomass. If biomass fuels are to gain consumer acceptability, however, they must be converted into clean and convenient fuels. Biogas is, after a rocky start, becoming an established technol-
5Note tit tie Opaafig efficiencies of convention~ combustion turbines are lower than many other options; in contrast, the steam-injection mode, particularly with intercocding, provides higher efficiencies.
Chapter 6-Energy Conversion Technologies
ogy, although there are significant doubts about its financial viability in small scale (household) applications. Small scale producer gas made from biomass is relatively low in capital cost and can produce a moderate quality gaseous fuel at competitive prices under a range of conditions. These gases can be used directly for process heat or to generate electricity. Electricity from internal combustion engine systems fueled with biogas or larger sized producer gas systems may now be marginally competitive with central station power at remote sites—if the avoided costs of transmission and distribution are taken into account. Larger scale biomass based gas turbine electricity generation is nearing commercial readiness and is expected to be competitive with many central station power plants if adequate biomass feedstocks are available at reasonable prices. While liquid fuels from biomass are not competitive at the oil prices of today, current or near commercial technologies could be competitive at oil prices of perhaps $30 a barrel-a price that is widely projected to be attained by the end of the century. Technologies now under development, particularly ethanol by enzymatic hydrolysis, may provide liquid fuels at competitive prices in the future. Biomass technologies offer the prospect of using domestic resources at competitive costs. There are other benefits as well. Together with other renewable energy technologies such as wind energy, photovoltaics, and microhydro, these small scale systems can bring high quality energy to rural areas--creating jobs and providing important environmental benefits. On the other hand, there area variety of obstacles to the introduction of renewable. In some cases, further RD&D are needed; subsidies to other forms of energy may discourage their development; credit may not be as readily available for renewable as for other more traditional energy supply systems; and there may be a lack of information on these alternatives, their costs, and their benefits at the local level. For biomass, in particular, land costs may become too high-due to competition between producing fuels and electricity for the wealthy versus producing food for the poor; environmental impacts on land and water could be excessive if biomass is grown too intensively or poorly man-
297-929
-
92
-
13
-
QL
:
3
●
183
aged; and infrastructure needs (notably roads) for large scale bioenergy plants could be high. The United States could help in overcoming these obstacles in a number of ways—through supporting RD&D, encouraging financial institutions to lend to such projects, and encouraging the transfer of these and related technologies through the private sector or by other means.
THE POWER SECTOR IN THE DEVELOPING WORLD: IMPROVEMENTS TO EXISTING SYSTEMS Electric utilities inmost developing countries face a rapidly growing demand for electricity; many, however, have difficulty even meeting present demands due to poor technical, operational, and institutional performance. Improvements in existing electricity systems should therefore be considered before or in conjunction with system expansion. Options for system improvement discussed here include: . Rehabilitation of existing generating plants, ● Transmission and distribution systems, ● System interconnections, . System planning, and . Management.
Generating System Rehabilitation The operating efficiency of the electricity generating equipment in developing countries-with some notable exceptions—is often substantially below that achieved in the industrialized countries, despite the fact that the basic technology is the same. An excellent example is the use of low speed diesels for power generation. This technology is widely reputed to be highly reliable, yet in developing countries many such units are out of service for much of the time. Thermal efficiency is an accepted indicator of the ability of a utility to maintain its thermal power stations in good working order. As can be seen from table 6-2, thermal efficiencies in some Asian countries are comparable to those achieved in the United States. Performance in India and Pakistan, however, is quite poor.
184 . Fueling Development: Energy Technologies for Developing Countries
Table 6-2—Thermal Efficiency of Selected Electric Power Plants
Country
Fuel type
Korea . . . . . . . . . . . . . . . . . . . . . . . . . . . . . . . . . . . . . . . . . . . . . . . Indonesia . . . . . . . . . . . . . . . . . . . . . . . . . . . . . . . . . . . . . . . . . . . . . Hong Kong..... . . . . . . . . . . . . . . . . . . . . . . . . . . . . . . . . . . . . . . . Malaysia .,.... . . . . . . . . . . . . . . . . . . . . . . . . . . . . . . . . . . . . . . . . Pakistan . . . . . . . . . . . . . . . . . . . . . . . . . . . . . . . . . . . . . . . . . . . . . . India . . . . . . . . . . . . . . . . . . . . . . . . . . . . . . . . . . . . . . . . . . . . . . . . Thailand . . . . . . . . . . . . . . . . . . . . . . . . . . . . . . . . . . . . . . . . . . . . . . Typical American Plants (with initial year of operation) Canal, Massachusetts (1,072MW, 1968) . . . . . . . . . . . . . . . . . Ghent,Kentucky (2,226MW, 1973) . . . . . . . . . . . . . . . . . . . . . Pleasants, W. Virginia (1,368MW, 1979) . . . . . . . . . . . . . . . . . Chesterfield, Virginia (1,353MW, 1952) . . . . . . . . . . . . . . . . . . Tradinghouse, Texas (1,380MW, 1970) . . . . . . . . . . . . . . . . . Northport, NewYork (1,548MW, 1963) . . . . . . . . . . . . . . . . . . .
Thermal efficiency
oil coal oil oil oil gas oil coal brown coal oil
35.4 30.6 35.3 34.5 30.0 26.0 28.8 25.9 23.8 33.8
oil
36.4 33.5 33.0 34.8 33.0 33.8
coal coal coal gas oil
SOURCE: international Development and Energy Associates (lDEA), lnc.’’lmproving Power Sector Efficiency in Developing Countries:’ November 1990, OTAcxmtractor report, p. 22; based on Tbcdmo/ogyPo/ky Inthe EnergySectoclssues, Scopeand@iorrsforDeve/oping Countries, United Nations Conference onTrade and Development, UNCTADTIT/90, 1990. AmericanDatafrom E/attiPhnttistandPowaPrtiwtion Expenses, 1988, Energy Information Administration, Department of Energy, DOE/EIA 0455/8.8, Washington, DC, 19S9.
A second important measure of maintenance efficiency is the forced outage rate (FOR). 7 Over the past 10 years, there has been considerable progress in reducing forced outage rates in those developing countries that have had unusually high rates in the past. In India, for example, the average FOR for coal fired units in the 1983 to 1984 time period was 24 percent; in 1988, the average had improved to 16 percent.8 Over the past decade, the cost effectiveness of generation system rehabilitation has become recognized in the United States and Europe, where a great deal of attention has been placed on what has become known as “life extension” or “life optimization.” The average cost of utility refurbishment projects in the United States has been reported to be considerably below the cost of new generating
units. 9 Improved procedures for predictive and preventative maintenance have also contributed to the extended life of many industrialized-country power plants. A number of major generation rehabilitation projects are now underway in developing countries. For example, a rehabilitation project in Pakistan, funded in part by the World Bank,10 will refurbish 15 steam and combustion turbine units at Sukkur, Guddu, Faisalabad, Quetta, and Multan. 11 This project will provide additional capacity of 120 megawatts (MW) by restoring original ratings, in addition to improved heat rates and forced outage rates (see table 6-3). The cost for this rehabilitation is about $110 million. The potential for rehabilitating generation plants in the smaller systems of Africa is illustrated in box 6-A for Kenya.
bIt might be no~d tit tie use of tie plant load factor (PLF), which is often used as a yardstickfor COIIIptKkOXI of the relatively poor wrfo~nce of developing country generating units, is not a very useful measure for this purpose, since there may be sound economic dispatch reasons for a plant not to be used for all of the hours in which it is available. WOR is defined as (forced outage hours)/(sewice hours + forced outage hours). 80p, D~J% operation, Maintenance ~nd Re~bi/itufion Of ‘fhe~l Power plants in India
(In&a: IJt@ Pradesh State Electricity Bored, 1988),
9A. Armor et al., ‘‘Utility Implementation of Life Optimization Programs,’ paper presented at theGEN-UPGRADE Conference, Washington, DC, March 1990, table 2. l% fact tie f’wnc~g plan, ~ is ~cremfigly me cue, involves cof~c~g by o~er entities, incIud@ the overseas Development Admllll “ “sfration of the U.K. (ODA), USAID (from its Energy Commodities Equipment Program), and the Government of Pakistan. I IIDEA, $ ‘Clean Coal Technologies for Developing Countries, ” contractor report prepared for the Office of Technology Assessmen4 May 1990, p. 72.
Chapter 6-Energy Conversion Technologies . 185
Table 6-3—impact of Generating Plant Rehabilitation in Pakistan Heat rate before rehabilitation Btu/kWh
Plant
Multan, steam/fuel oil . . . . . . . . . . . . . . . . . . . . . 12,808 Faisalabad, steam/fuel oil . . . . . . . . . . . . . . . . . 12,850 Guddu Steam/fuel oil . . . . . . . . . . . . . . . . . . . . . 13,250 Quetta Steam/coal. . . . . . . . . . . . . . . . . . . . . . . 20,850 Faisalabad gas turbines . . . . . . . . . . . . . . . . . . . 16,700
Heat rate after rehabilitation Btu/kWh
FOR a before rehabilitation percent
FOR after rehabilitation percent
11,280 11,290 11,113 20,850 15,113
13 13 10 13 10
6 6 6 8 5
Bank, April 1990.”
Transmission and Distribution Systems System losses are perhaps the most common indicator used to describe the overall efficiency of the transmission and distribution system. T&D losses in the 6 to 9 percent range are regarded as good. In a recent compilation of system losses by the World Bank,12 however, few developing countries experienced total system losses of below 10 percent. Several other developing countries had considerably higher losses (see table 6-4). ’3 The most common way of measuring system losses is to compare generation at the busbar with sales (usually obtainable from billing records). This method measures both technical losses and nontechnical losses— which reflect the failure of many developing country utilities to meter and/or bill consumers and their failure to control illegal connections.
;
*
Over the next 20 years there will likely be a substantial effort in developing countries to reduce T&D system technical losses. A number of power system efficiency studies have been conducted by the World Bank and others, and T&D system rehabilitation has been recommended in almost all cases. Often, the recommendations are not just for hardware, but for technical assistance to strengthen T&D departments. Losses are particularly high at the end of the distribution system, especially in low tension feeders and distribution transformers (see table 6-5). Technical improvements to reduce T&D losses include: providing adequate capacity in overloaded T&D system; adding power factor correction capacitors or overexcited synchronous motors to correct
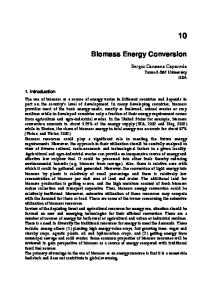
Photo credit: U.S. Agency for international Development In some cases, it may be more cost effective to improve
transmission and distribution lines than to add new generating capacity.
12J EScay Sumnlary Data Shee[$ of ]9&’ ~oHer and Commercial Energ~~Staristics for ZOO Developing Countrie$t Indusw ~d ‘ner~ ‘eP~ment Working Pap&, Energy Series Paper 23 (Washington, DC: World Bank, 1990). l~one might ~xpec[ slighdy higher losses in developing counties ~ in Western Emope, due [o tie lower vOl@geS and ~eater MIMber Of llld networks in the developing world; but the loss levels shown in table 6-5 are much larger than would be considered desirable.
186 . Fueling Development: Energy Technologies for Developing Countries
Box 6-A—Thermal Plant Rehabilitation in Kenya The Kenya Power and Lighting Co. operates a generally well run and efficient power system, serving about 170,000 customers in Nairobi and other urban centers. The Kenya Power System Efficiency Assessment found that its main hydro plant (335 MW on the Tana River) operates with a high degree of reliability, and is relatively trouble-free. The 2 X 15 MW Geothermal plants at Olkaria, commissioned in 1981-1982, were found to be in ‘‘exceptionally good condition, ” and operate as base-load units at their fully rated capacity. The Kipevu thermal power station in Mombasa, however, was in need of immediate rehabilitation. The 12 MW combustion turbine has been derated to 6 MW due to basic design shortcomings. Installation of a forced-air-finned cooler system and forced ventilation systems would permit uprating. The condensers and sea-watercooling systems are in severe disrepair due to corrosion and lack of proper maintenance: the cathodic protection system has not functioned for many years. The lack of a chlorination system has resulted in extensive fouling of lines and condensers with clams, worms, and other marine life. The 7 steam turbine units are in various stages of disrepair; 1 is no longer functional, 2 of the 12 MW units are derated to 8 and 10 MW, respectively, and even the 2 most recent units, aged 11 and 7 years, require rehabilitation because critical monitoring and metering equipment is nonfunctional. The costs of rehabilitating the power station are estimated at about $2.8 million, with a resulting benefit valued at about $1.8 million per year. This is a payback of about 1.5 years. SOURCE: IDm “Improving Power Seetor IMciency in Developing Countries,” contractor report prepared for the Ofllce of Teebnology Assessment October 1990, p. 73.
the power factor; using low loss distribution transformers;14 and changing distribution system design. A number of distribution configurations are used in developing countries. The traditional European system was designed to serve high density urban areas of Europe: the entire system is three phase, and is not the most appropriate for low density rural areas. The modified European system, however, provides good flexibility for single phase extensions to serve lightly loaded areas. The North American system carries a neutral wire along with the three phase wires. Single phase lines consist of a phase wire and an uninsulated neutral conductor, and can be cheaper than the European systems. The single wire earth return system uses a single conductor with the earth as return path; it is especially suitable for very lightly loaded systems involving long distances. The frost reported use of such a system in a developing country is in a project in the Ivory Coast, partly funded by the World Bank. High — Voltage — Direct Current (HVDC) Capital investment in developing country transmission systems will need to increase over the next decade. An important innovation likely to come into more widespread use in developing countries is HVDC. HVDC has proven economic for moving large blocks of power over long distances (500
kilometers (km) or more), and increasingly has been used in the United States. Major HVDC projects in developing countries are +500 kilovolts (kV) links in China and India. The Indian project is a 900 km link between the Singrauli minemouth generating complex and Delhi that will provide a transfer capability of about 1,500 MW, The Chinese HVDC project links the central and East China Regional Grids. A more immediate use for HVDC in many situations is as asynchronous links between neighboring systems that use different frequencies and voltages. Again in India, such an HVDC link has been made to connect the Northern and Western
Table 6-4—Technical and Nontechnical Losses (in percent of net generation) Total Sri Lanka . . . . . . . . . . . . . . 18 Panama . . . . . . . . . . . . . . 22 Sudan . . . . . . . . . . . . . . . . 31 Bangladesh . . . . . . . . . . . . 31 Liberia ... , . . . . . . . . . . . . 35 Malaysia . . . . . . . . . . . . . . 28 Ivory Coast . . . . . . . . . . . . 12
Technical
Nontechnical
14 17 17 14 13 11 8
4 5 14 17 22 17 4
SOURCE: M. Munasinghe et al., A Review of World Bank Lending for Electric Power, World Bank, Washington, DC, Energy Series Paper No. 2, p. 60.
Idswuel F. B~dw~ ‘ ‘Energy-Efficient Electric Motor Drive Systems, ” Thomas B. JohanssoQ Birgit Bodlund, and Robert H. Williams (eds.), Electricity: Eficient End-Use and New Generation Technologies, and Their Planning Implications (Lund, Sweden: Lund University Press, 1989).
Chapter 6--Energy Conversion Technologies “ 187
Table 6-5-Distribution of Technical Energy Losses (percent)
Power plant transformers . . . . . . . . . . . . . . . . . . . . . . . . . . . . . . . . . . Transmission lines . . . . . . . . . . . . . . . . . . . . . . . . . . . . . . . . . . . . . . . . Substations . . . . . . . . . . . . . . . . . . . . . . . . . . . . . . . . . . . . . . . . . . . . . . Primary lines . . . . . . . . . . . . . . . . . . . . . . . . . . . . . . . . . . . . . . . . . . . . . Distribution transformers and low tension network . . . . . . . . . . . . . . Total . . . . . . . . . . . . . . . . . . . . . . . . . . . . . . . . . . . . . . . . . . . . . . . . .
Madagascar
Kenya
Bangladesh
Targeta
2.2 2.7 0.8 2.1 4.2 12.0
0.5 5.2 0.9 2.1 6.3 15.0
0.5 2.2 1.1 4.2 6.0 14.0
0.3 3.8 0.3 2.5 1.5 8.3
p.26
regions as the initial step in the establishment of a national grid. This link provides for the exchange of up to 500 MW of power between the two regional
for example, consists of six regional grids--of which four exceed 10 GW in size-plus seven provincial grids. In this respect, these countries are
grids.
similar to the United States, where individual power
Compact Design
pools are the basic dispatch entities. 15 While interconnections do exist for power transfers to exploit
has indicated substantial potential for reducing
interregional diversity, or for emergency assistance, a national power grid for large scale transfers of
transmission line cost, lessening visual impact, and
power does not yet exist.
Transmission line research over the past decade
maximizing use of existing rights of way by compact construction involving much lower line spacings than has been traditional practice. The most dramatic reductions have been at the 115 to 138 kV level where traditional clearance specifications were established long before technical requirements were clearly
understood.
regional operation of interconnected systems are w e l l i l l u s t r a t e d i n I n d i a .16 R e g i o n a l
electricity
boards were established in India as the primary mechanism for integrated regional operation. Each regional board consists of several State Electricity
In the United States, a number of 138 kV lines have been uprated to 230 kV without any change in either conductor or insulation system, a practice that has been made possible because of better understanding of insulation and clearance requirements, and the need for large design margins correspondingly diminished. Particularly in the 50 to 230 kV range, attractive opportunities for uprating will often exist. Voltage uprating of a line greatly increases its load carrying capacity.
System Interconnections The systems of India,
The effects of capacity shortages and skewed financial incentives on economic dispatch and
Brazil, and China, in
particular, are not single integrated systems, but consist of a set of regional systems, each no more than about 10 to 15 GW in size. The Chinese system,
Boards, which are, in theory, subordinate to the regional dispatch centers but, in practice, often resist 17 dispatch instructions. The practice of allocating
shares in large central sector plants to individual States creates particular difficulties, because during peak periods States tend to overdraw power from the central stations, which results in the frequency of the system falling from the nominal 50 Hz to as little as 48 Hz. During off-peak hours power is dumped into the system, resulting in frequency increases to 51 Hz or higher. Grid management problems arise when frequency falls outside the normal range of 50 ± 0.2 Hz, including the potential of grid collapse and damage to large thermal and nuclear generating sets. The difficulties of backing down local plants during off-peak periods, even though these are less
15A de~l]cd study of ~y~tem in[ercomection issues can be found in US. Congess, Office of Technology Assessmen~ Ekcm’c pOWt?r Wheeling and DeuZing: Techrroiogical Considerationsfor Increasing Compe~ition, OTA-E-409 (Washington DC: U.S. Government Printing OffIce, May 1989). l% Swarup, K., ‘‘Inter-state Power Exchanges and Integrated Grid Operations Proceedings, ’ Planning for the Power Sector (Agra, India: September 1989). 17~other reason for the reluc~ce of Sta[e El~~c Bo~ds to back do~ uni~ is tie in~easing UK of the PLF as a yardstick of plant pelfOITlliUICe in IndiA the higher the Plant Imad Factor (PLF), the “better’ the performance of the plant. As noted in footnote 6, however, use of the PLF for such purposes is questionable.
188 . Fueling Development: Energy Technologies for Developing Countries
efficient than the large central sector plants, is largely a matter of tariffs that provide few incentives for efficient operation. Moreover, because of financial difficulties, States are reluctant to permit net transfers of energy for fear of not getting paid by the recipient. Trade in electricity among developing countries is very small compared to that in Europe and North America and far less than the technical and economic potential. The largest import dependency among African countries appears to be that of Zimbabwe on Zambia, reaching 25 percent of supply in the early 1980’s. One major reason for the low level of intercountry trade in electricity is the question of payment. Exporting countries expect to get paid in a timely way, and in foreign exchange— not in inconvertible national currency. National security concerns also play a role. Box 6-B describes opportunities for interconnection, regional integration, and joint development of electricity systems in the developing world.
Improved System Planning Procedures In the past, power system planning in the developing world has meant finding the least expensive generating mix to meet forecasted demand. 18 Although such least-cost analysis is essential, these methods conventionally have not incorporated demand side options and environmental impacts. There are three basic improvements that could enhance system planning in developing countries. First, the analysis itself could account for uncertainty, particularly in availability of foreign exchange and in demand growth. This could help avoid the sort of overbuilding characteristic of some Central American hydropower facilities in the last decade. Second, demand reduction and load management could be considered as investment opportunities and even as alternatives to new generation. Finally, the analysis could incorporate the social and environmental costs of power supply, which often are not reflected in cost estimates and regulations. In the United States, many utility- and State-level regulators are paying considerable attention to the need for improved system planning. Although a single integrated approach to system plannin g has not been agreed on, many of the utilities and State
regulators have adopted the concept of “integrated resource planning" (IRP) (see box 3-G on IRP in ch. 3). IRP allows for consideration of both demand and supply side investments and externalities. These planning methods could help promote energy efficient technologies in the developing world as well. Integrated resource planning may be particularly appropriate for developing countries, where there are often severe capital constraints and an untapped potential for demand reduction. The United States (particularly utilities and State regulatory agencies) could help the developing countries by providing policy advice, training, and technical assistance.
Improved Management The issue of effective management of electric utilities is not just one of public versus private sector ownership, since there are many public sector utilities throughout the world that are well run, and private sector utilities whose technical and financial management has been consistently poor. In the case of government-owned entities, which applies to most developing countries, top management of utilities is sometimes appointed primarily for political reasons. In other cases, appointments are made on the basis of technical competence, and managers are held accountable in exchange for a certain degree of autonomy. The Volta River Authority (VRA) of Ghana is a good example of a well run facility. The VRA was established primarily to own and operate the 1,000 MW hydro facility at the Akosombo Dam. The 1961 Volta River Development Act requires VRA to operate its plants according to sound public utility practices, a requirement that has in fact been met. In addition, the international institutions that financed the project insisted from the beginnin g on high standards of technical management. The tradition of technical competence in management has endured, coupled with a degree of autonomy from government interference. Although competent management at the head of a utility is a key condition for good performance, it alone is not sufficient. A utility must also buildup and maintain a competent technical staff (see box 6-C). Training is required at all levels--college level
NID. ~~, “power Sector hovation in Developing Countries: Implementing Multifaceted SOIUtiO~, “ Annual Review of Energy, vol. 15, 1990, p. 377.
Chapter 6--Energy Conversion Technologies . 189
Box 6-B--Opportunities for Interconnection, Regional Integration, and Joint Development of Electricity Systems in the Developing World A 330 kV interconnection between the Ivory Coast, Ghana, Togo, Benin, and Nigeria has long been discussed. 1 The Nigerian system, with a strong potential for low cost gas fired generation, would complement the hydro-based system in Ghana. Even with the large storage capacity at Akosombo in Ghana, 2 or 3 wet years in a row necessitates spilling, which could instead be used to produce power for export to Nigeria. On the other hand, dry years cause serious problems for Ghana, since the 1,072 MW Akosombo project accounts for all but 50 MW of the installed capacity of Ghana. Shortfalls could be filled in with thermal power from Nigeria. The possibility of linking Burkino Faso with Ghana has also been examined as part of extending the Ghanaian grid to its northern regions. For Ghana, electricity sales would generate sufficient export revenues to justify the investment, and enable its northernmost loads to be served more economically by increasing the capacity utilization of the grid extension. Economic analyses of this proposal indicate rates of return of about 15 percent on the cost of the grid extension. Although cooperation among the East African countries has been impeded for many years by political factors, the potential for joint development of hydroelectric resources remains. Tanzania plans to develop significant hydro capacity on the Rufiji river, and could export expected surpluses in the late 1990s. This would require construction of a 220 kV intertie between Mombasa in Kenya and Tanga in Tanzania, and would enhance reliability in both systems as well. In Uganda, there is a potential for 500 MW of hydro at Ayago, which could be developed jointly with Kenya. Two separate systems serve Pakistan: the smaller Karachi Electric Supply Corp. (KESC) and the larger Water and Power Development Authority (WAPDA). The former is a 100 MW all thermal system serving the Karachi area (93 percent of whose shares are owned by government) and the latter is an autonomous government body with an installed capacity of 2,900 MW of hydro and 2,000 MW of thermal, serving the rest of Pakistan. At present two single circuit 132 kV lines and one double circuit 220 kV line interconnect these two systems. While exchanges between the two systems do occur, the interconnected system is still operated on the basis of avoiding load shedding, rather than on economic dispatch of an integrated system. A recent study found that integrated system operation could provide savings in:2 ● capital costs on new generating capacity-because a larger system needs less total capacity to meet an identical reliability criterion than the sum of two separate systems; . fuel costs-achieved through least cost dispatch of available plants; and ● energy—achieved through more effective use of plants to reduce load shedding. The economic analysis indicated overall benefits of about $1 billion (expressed as a present worth at lo-percent discount rate) over the 20-year planning period, equal to about 5.7 percent of total system costs of separate KESC and WAPDA systems. About 90 percent of the benefits are in fuel cost savings. IS=, for ~mple, world B@ Ghana: Issues and options in the Energy Sector, Re~rt 6234-GH ~-to~ ~: Nov-r 1986)” 2CooWr~ ~d Ly~~d, Jn~egra~ed Operatiom S~y~or WAPDA andKESC, Repofl to tie Asim Development B& (April 1990).
training 19 for electrical engineers and in-country, on-the-job training programs, perhaps in conjunction with utilities from the industrial countries.
Environmental Considerations The degree to which electricity generating equipment in the developing world currently incorporates pollution control equipment varies. Modern electro-
static precipitators (ESP) for particulate control are now routinely fitted to new coal-fired power plants in developing countries: a recent survey of World Bank financed projects indicates that over the past decade, all such plants were so equipped. The extent to which such equipment is properly maintained, however, is not clear. If the plant as a whole is in poor condition, ESPs may be among the first items
19co~ege level ~~g is ~f(en done at ~ti~tiom ~ &e United states or E~ope. ~ an attempt to ensue tit foreign trained IliltiOIlilk ~turn home, some developing country institutions now require the posting of bonds prior to departure on overseas University courses to ensure returw sometimes in amounts of as much as 3 months salary. Yet with a degree in hand, graduates discover that industrial country salaries are so attractive in comparison that such bonds can easily be forfeited.
190 ● Fueling Development: Energy Technologies for Developing Countries
of equipment not to be properly maintained as their failure does not require the plant to shut down. Moreover, where ash contents are far in excess of design norms (as is the case at many Indian plants, for example), failure rates of ESPs will be high. Environmental considerations are now playing a larger role in system expansion decisions. For example, concerns over the environmental impacts of large hydropower development have influenced system planning in India, China, and Brazil. Environmental issues are likely to be even more important in the future as concerns over the regional and global environment grow.
TECHNICAL OPTIONS FOR NEW ON-GRID GENERATION The improvements to the existing system described above could lead to substantial increases in supplies from existing capacity. Sooner or later, however, additional capacity will be required. The selection of a technology for electricity generation is based on many factors, but a principal factor is and will continue to be availability of the fuel needed to power the technology. Several Asian countries have access to coal and therefore can be expected to continue to build new coal-fired generation. Hydropower resources in many areas, notably Latin America, are abundant and will probably continue to be exploited for electricity generation. Oil is a less popular fuel for new on-grid electricity generation due to its volatile price. Even those developing countries with domestic oil reserves may prefer to export their oil rather than consume it domestically. Natural gas is still unavailable in many areas, although the gas resource base is considerable (see ch. 7). Much of the planned expansion in electricity generating capacity in the developing world reflects these resource considerations (see table 6-6). Coal and hydro will supply much of the expected expansion, followed by gas, nuclear, oil, and geothermal. In this section, the technologies for expanding the supply of on-grid electricity generation in the developing world are reviewed. Many technologies could potentially play a role, but the analysis here will be limited by two principal criteria: those likely to play a large role in near term expansion (coal, hydro, etc.); and those playing a smaller role in current plans but with significant environmental or
Box 6-C—Training Programs for Utility Planning There are several examples of successful training programs in utility planning procedures. The training program at Argonne National Laboratory, financed for more than a decade by the International Atomic Energy Agency (IAEA) in Vienna, covers many aspects of power sector planning, and has played a significant role in raising the level of power sector planning in developing countries. A second example is the Brookhaven/Stony Brook Energy Management Training Program, sponsored for many years by Agency for International Development in Washington, whose objective was to train energy sector planners. Some 40 percent of the more than 350 senior individuals who attended the course were from electric utilities. In some countries almost the entire cadre of senior energy sector planners attended the course. The energy planning program at the University of Pennsylvania as well as activities of the National Rural Electric Cooperative Association (NRECA), are two more successful and well-regarded training programs. Developing effective programs requires an institutional commitment over substantial time periods, sufficient for adequate curriculum development and for the planning philosophy to become established. For demand-side management and integrated resource planning to gain widespread acceptance, a long-term training effort must be launched. A major training effort will similarly be necessary if new agencies with environmental planning and regulatory functions are to be adequately staffed. other benefits (gas turbines, renewable) and substantial long term potential. The focus is on those technologies that are currently commercially available or expected to become so in the near future. Due to the diversity of the developing world, it is not appropriate to identify a specific technology as the best for all situations; nevertheless, the analysis identifies issues influencing the choice of technologies for electricity supply expansion in the developing world.
Clean Coal The conventional technology for utilizing coal to produce electricity-the pulverized coal boiler-is reliable and technically straightforward, but results in relatively high emissions of NOX, SOX, particulate, and solid wastes. These pollutants can have adverse impacts on human health, ecosystems, and
.—.—.——... .—
Chapter 6--Energy Conversion Technologies
Table 6-6-Planned Expansion in Electric Power Facilities of the Developing World, 1989-99 Planned new capacity Plant type
(Gw)
(percent)
Coal thermal . . . . . . . . . . . . . . . . . 172 Hydro . . . . . . . . . . . . . . . . . . . . . . 137 Gas thermal . . . . . . . . . . . . . . . . . 34 Nuclear . . . . . . . . . . . . . . . . . . . . . 24 Oil thermal . . . . . . . . . . . . . . . . . . 14 Geothermal . . . . . . . . . . . . . . . . . 3 Total . . . . . . . . . . . . . . . . . . . . . 384
45 36 9 6 4 1 100
NOTE: Dataref Iect official country plans, and do not reflect capital or other constraints. SOURCE: Worid Bank, Capita/ Expenditures for E/ectric Power in the Developing Countries in the 1990s, Industry and Energy Department Mrking Paper, Energy Series Paper No. 21, February 1990, p. i.
such as bridges and buildings. Coal burning also releases significant amounts of the greenhouse gas CO : about 11 percent more than oil combustion; and 67 percent more than natural gas
structures
●
191
system would increase costs per kWh output by 22 about 15 percent. Although common in the United States, 23 FGD is almost unknown in India and China 24 as their coals are, on average, relatively low sulfur. The high cost of FGD in the United States led to a search for other methods to burn coal with reduced emissions. The resulting technologies are often called ‘‘clean coal’ technologies. They include improved coal processing before combustion (see ch. 7), improved ways to burn coal, and improved ways to treat waste gases. Some ‘‘clean coal’ technologies offer important benefits in addition to reduced emissions, such as greater tolerance for low quality coal, but their major benefit is reduced emissions and this usually comes at a cost in comparison to conventional pulverized coal technologies.
2
combustion per unit of energy output.
Fluidized Bed Combustion (FBC)
25
20
As a result of the Clean Air Act Amendments of 1977, coal burning power plants in the United States were fit with flue gas desulfurization (FGD) or ‘‘scrubbers, ’ a technology for removing SO X f r o m t h e p o s t - c o m b u s t i o n g a s s t r e a m . S Ox , s c r u b b i n g techniques currently in use include lime/limestone and double alkali scrubbing in which SO X is captured from the gas stream and consolidated as sludge. Disposal of the sludge remains an environmental problem, though in some cases the sludge can be regenerated. There are also wet scrubbers and fabric filters for removing particulate from the flue gas. 2 1 FGD is effective at removing SO X, but is expensive, reduces overall plant efficiency, and does little to reduce NOX, C02, and other emissions. A recent Indian study concluded that the addition of a FGD
Fluidized bed combustion combines pulverized coal with limestone particles in a hot bed fluidized by upflowing air. Calcium in the limestone combines with sulfur in the coal to reduce SOX emissions, and the relatively low combustion temperatures also reduce NO X formation. FBC systems can be either pressurized (PFBC--operating at about 10 atmospheres air pressure) or atmospheric (AFBC— operating at ambient air pressure). PFBC is still in the development stage, although there are demonstration projects running in Stockholm and in Ohio. 26 AFBC technology can be retrofit onto an existing power plant, and appears to be quite tolerant of low quality coals. Many AFBC units are in operation worldwide, including about 280 in the industrialized countries (some for industrial use).27 India and China both
20Ufited Natio~ De~~ment of Tec~c~ Cooperation for Developmen~ Energy and Environment:~mpucts and Controh (New York, NY: October 1990), p. 10. Zlunited Natio~ Deptiment of Technical Cooperation for Development, Ibid., pp. 24-26. ZZIDEA, { ‘C]ean COal Technologies for Developing CO~rnes, ’ contractor report prepared for the Office of Technology Assessment May 1990, p. 25. ~A~ of 1988, about 22% of ~o~-fu~power p~n~ in tie United S@tes us~ FGD system. U.S. Department of Energy, Assistant Secretary fOr FOSSfl Energy, Clean Coal Technology, DOE/FE-0149 (Washington DC: U.S. Department of Energy, November 1989), p. 10. UIDEA, ‘ ‘Clean COa.1 Technologies for Developing COUnrneS,’ contractor report prepared for the Office of Technology Assessment, May 1990, p. 25. ~For more ~omatlon on ~C tec~olo@es, see U.S. Congess, Office of Tec~ology Assessment, New Electric Power Technologies, OTA-E-246 (Wasbingtoq DC: U.S. Government PrintingO&ice, July 1985). 26p~c ~dus~ Newsletter, ‘‘Clean Coal Technology, ’ No. 1, 1991. Z?’wlorld Ba@ The Cument State ofAt~~ph~~”c F[uidi~ed-BedCo&ustion Technology, WJorld Bank Technical Papa Number 107, September 1989, p. 13.
192 . Fueling Development: Energy Technologies for Developing Countries
Table 6-7-Costs of AFBC and PC Coal-Burning Power Plants
Cost component
Conventional PC
AFBC
PC with FGD
PC with 15 percent lower availability
Technology Assessment, May 1990, p. 32.
have hundreds of small AFBC bubbling bed 28 plants. Most of the small Indian and Chinese plants are used for steam heat rather than for electrical generation. A few, such as the 30 MW plant in Trichy, India, do generate electricity. The advantages of AFBC over traditional pulverized coal (PC) technology are reduced emissions and increased tolerance to a wide range of low quality fuels. PC plants tend to break down when the ash in low quality fuels melts and clogs the boiler machinery. AFBC plants have reported successful burning of fuels with ash contents of from 4 to 40 percent, 29 and AFBC can also burn rice husks and other agricultural wastes. The costs of AFBC are thought to be “competitive’ with PC plants, depending on the local situation.30 A cost analysis for AFBC plants in U.S. applications found that AFBC had lower capital requirements and a similar cost of electricity when burning high quality fuels, when compared to pulverized coal with flue gas desulfurization.31 Few plants in India or China presently use FGD, however, so this comparison may be misleading.32 The benefits associated with the greater flexibility of AFBC can be evaluated by comparing the costs of AFBC to those of a conventional plant burning low quality coals. AFBC is more expensive than a conventional (PC) plant, but less expensive than a PC plant with FGD (see table 6-7). If the reduced
availability of a PC plant due to low quality fuel is taken into account, AFBC becomes less expensive. This analysis assigns no value to the reduced air emissions of AFBC in comparison to PC. Despite increasing use of FBC plants, they are a relatively new, still evolving technology. There is, therefore, a certain amount of uncertainty about the future costs of FBC technologies.
Integrated Gasification Combined Cycle 33 (IGCC) Integrated Gasification Combined Cycle (IGCC) combines several advanced technologies: a gasifier that reacts coal with oxygen to produce a mixture of combustible gases, a gas cleaning process to remove sulfur and other pollutants from the gas prior to combustion, a turbine that burns the gas to produce electricity, a waste heat recovery boiler that produces steam, and a steam turbine to generate additional electricity. Several demonstration projects in the 100 to 200 megawatts electric (MWe) size are being designed or operated. IGCC systems have several advantages. IGCC plants have somewhat higher efficiencies than conventional pulverized coal plants. Unlike most coal-fired electricity technologies, relatively small (100 MW) IGCC plants can be built that are similar in cost per kW to large (500 MW) IGCC plants; and
2sS@ato~ ~vo~a, Setior Ener~ co~~tit, U.S. Agency for International Development, unpublished memor~dum+ Apr. 26! 1991” ~orldBa~ The Current State ofAtmosphencFluidzzed-Bed Combustion Technology, World Bank TeehnicalPaperNumber 107, September 1989, .,. p. Xvlll. %bid., p. xviii. slIbid., p. 52. %?Differen~es in p~t sim ~so cornpficate tie cornp~son. -c p~@ ~Ve been built Up to 200 we in SiZe, w~e traditional pulverized COd plants are often 300 MWe or larger. 33For mo~ ~o-tion on 1~C tec~ologies, we U,S. Congress, office of Tec~ology Assessment, New E/ecm”c Power Technologies, O’IA-E-246 (Washington DC: U.S. Government Printing Office, July 1985). MIDEA, “clean COal Technologies for DevelopingCountrk%” contractor report prepared for the Ofilce of Technology Assessment May 1990, p. 54. The efficiency gain of the IGCC process comes from the use of a combined (2-stage) cycle-a concept that can also be applied to oil and natural gas plants.
Chapter 6--Energy Conversion Technologies
●
193
Table 6-8-incremental Effects of Improved Coal Technologies Relative to a Conventional (PC) Plant Without FGD
IGCC plants have low SO2 emissions. 34 The tolerance of IGCC plants to lower quality coals is not yet clear. IGCC plants have been operated with coals with up to 28 percent ash content,35 but not at the ash levels of 40 percent typical of Indian coals.
Applications to the Developing World AFBC and IGCC technologies have higher first costs than conventional coal plants—but they offer several advantages, including reduced emissions, increased efficiency for IGCC, and increased fuel quality tolerance for AFBC (see table 6-8). Both AFBC and IGCC are promising technologies for those developing countries with domestic coal reserves, though improved coal washing alone would do much to improve plant availability and efficiency in conventional PC plants in India and China (see ch, 7). AFBC would allow use of lower grade, relatively dirty coals and would result in reduced SO2 and NOX emissions. Coal burning technologies allow use of a vast, inexpensive resource but have environmental impacts and costs. The use of AFBC and/or IGCC technologies reduces both SO2 and NOX emissions, but CO2 and the remaining NOX emissions will still be considerable. The costs of these technologies (see app. B, at the end of this report) are relatively high as well, depending on plant availability and other factors.
Large Hydro Hydroelectric power plants currently supply a significant fraction of the developing world’s electricity (see table 6-9). By one estimate, an additional 137 GW of hydroelectric power maybe added in the developing world by 2000.36 Although hydropower has many advantages, notably use of an indigenous renewable resource, it often has relatively high capital costs (see app. B). A number of specific sites, such as the Narmada River project in India and the Three Gorges project in China, are also controversial due to adverse environmental and social impacts. Although regions differ in their hydropower resources, according to one estimate, less than 10 percent of the technically usable hydropower potential in developing countries has been developed.37 There are many valid reasons why this huge technical potential is not being fully utilized. In some cases, existing markets are too small. Zaire, for example, has 120 GW of technical hydro potential— about 50 times their current system capacity .38 The estimates for technical hydro potential do not account for costs,39 and many of the potential sites are located in remote areas, making construction costs unaffordably high and markets for the power distant. Construction times can be long. Large projects in China, for example, can require up to 7 to
sSGoverment of ~dia, ~~~ of EnerW, Dep~~t of cod, IGCC Power Generation ~f)O.120 me De~nstrafion Plant Based on High Ash lndian Cod, January 1988, p. VIII. 36E. Moore and C. Sfiti World Ba~ ~dus~ and Ener~ DWartment, Capital Expenditures for E[ec~”c power in the Developing countrieS in the 1990s, Industry and Energy Department Working Paper, Energy Series Paper No. 21, February 1990, p. i, 3TJ, Be~ant-J~ne~, World Ba~ The ~ufure Ro/e of ~y~ropower in D~e/oping Coun~”eS, Energy Series paper No. 15, Apfl 1989, p. 15,
38 Wor]d Ba~ A $Umq of r& Future Role Of HY&Oeleem”C Power in 100 Developing COunttieS, Energy Department papr No. 17, ‘u~st 19849 Annex Il. World Bank, Summary Data Sheets of 1987 Power and Commercial Energy Statistics for 100 Developing Countries, Industry and Energy Department Working Paper No. 23, March 1990, 3gA~ much of tie costs of hy&opowercon~~ction ~ site. spifjc and for Io@y avaj~ble ]abor ad matetis, construction COStS VW widely. The average is typically $1,500-$ 2,000/kW. See World Bank, ibid., p. 19
194 ● Fueling Development: Energy Technologies for Developing Countries
Table 6-9-Hydroelectric Power Generation in Developing World Countries Hydroelectric power generation Country
(percent of (terawatthours) total generation)
Africa . . . . . . . . . . . . . . . . . 18 50 Asia . . . . . . . . . . . . . . . . . . 241 22 Latin America . . . . . . . . . . 330 63 250 10 U.S . . . . . . . . . . . . . . . . . . . SOURCE: International Energy Agency, Wor/d Energy Structure and Ba/ancx?s 1971 -1987 (Paris: OCED, 1989); Energy Information Administration, Annua/ Energy Review 1989 DOE/EIA0384(89), p. 203. 40
10 years for construction. In many cases, t h e s e factors constitute a major drain on developing country economies. Other problems include seasonal fluctuations in precipitation, which may limit plant output, and accommodating competing uses for water. Large hydropower can also have significant environmental costs. Large land areas are cleared for access, construction materials, or for the reservoirs themselves and are then flooded. This can affect the watershed, displace people and flood fertile agricultural land, and destroy forests and wildlife habitats.41 If the area to be flooded is not adequately cleared, the resulting rotting vegetation can release large quantities of methane, a greenhouse gas. Environmental problems also arise when a dam is operational. Dams may cause detrimental downstream effects due to changes in the level of sedimentation and flood patterns. New reservoirs can also mean an increase in diseases, such as schistosomiasis, which flourish in still water.
Nuclear Power Nuclear power currently supplies a relatively small amount of electricity in the developing world— less than 5 percent of total generation.42 Both South Korea and Taiwan make heavy use of nuclear power,
and are expected to continue to do so. Several developing countries are currently building nuclear power plants (see table 6-10). Other countries with nuclear power programs, including Argentina, India, and the Philippines, have had problems similar to those of the United States43--high capital costs, construction delays, cost overruns, low reliability, and concerns over waste disposal. Several countries, including Argentina, Brazil, Mexico, Pakistan, and the Philippines have scaled back or canceled their nuclear power plant construction plans.% Most existing nuclear power plants are of two main types: boiling water reactors (BWRs) and pressurized water reactors (PWRs). BWRs use the heat of fission to cause water to boil, and the resulting steam is then used to drive the turbine. PWRs keep the primary cooling water at high pressure to prevent boiling, and have a secondary water system that absorbs heat from the cooling water and generates steam, which then drives a turbine. Both systems are in widespread use. Heavy water reactors, which use water in which hydrogen contains an additional neutron to moderate the fission rate, are used in Canada, Argentina, and India. Gas-cooled reactors, which use a gas as a coolant, are used in the United Kingdom. Advanced technologies, including breeder reactors and fusion, are not currently in commercial use. Recent R&D efforts have focused on making reactors safer, simpler, and of a more standardized design. These designs vary, but common features include smaller unit size, use of so called “passive” safety features (which do not require external power, signals, or forces to operate), and overall simplified design, potentially45 reducing costs and opportunities for operator error. Data on costs and performance however, are not yet available. The proponents of these new technologies argue that they will offer high performance and safety at a reasonable cost, while others suggest that costs will be high and
‘H. Yicheng, “Relying on Reform to Speed up Hydropower Development” JPRS Reporf, Science and Technology-China: Energy, JPRS-~N-9(P014, Nov. 13, 1990, p. 11. 416 ‘~pacts of Hy&Wlec@ic Development on the Environmen~’ Energy Policy, vol. 10, No. 6, 1982, p. 351, 42U4S. ConW~~, of fIce of T~~~logy Assessment Energy in Developing Countries, OTA-E-486 (wmgto~ m: U.S. Government PIiUthlg Office, Januaxy 1991). 43u.s. con=e~~, Office of Te~~olo~ Assessment, Nuc/ear Power in an Age of unce~ain~, OTA-E-216 (wdlitlgk)~ DC: U.S. GOV ernment Printing Office, February 1984). ~J. Pemra, “PowerGenemtio~” South, No. 102, Apd 1989, p. 65; Jo~ Swey, ‘‘Nuclear Power: An Option for the Third World?,’ Energy Policy, vol. 16, No. 5, October 1988, pp. 461479. 45c.w, Forsberg and A. Weinberg, ‘‘Advanced Reactors, Passive Safety, and Acceptance of Nuclear Energy, ”Annual Review of Energy, vol. 15, 1990, p. 140.
Chapter 6--Energy Conversion Technologies
●
195
Table 6-10-Status of Nuclear Power Plants in the Developing World (as of December 1988) Electricity y supplied by nuclear power plants Country
Nuclear power plants under construction (MWe)
(GWh)
(percent of total)
Argentina . . . . . . . . . . . . . . . . . . . Brazil . . . . . . . . . . . . . . . . . . . . . . . China. . . . . . . . . . . . . . . . . . . . . . . Cuba . . . . . . . . . . . . . . . . . . . . . . . India . . . . . . . . . . . . . . . . . . . . . . . Mexico . . . . . . . . . . . . . . . . . . . . . Pakistan . . . . . . . . . . . . . . . . . . . . S. Africa . . . . . . . . . . . . . . . . . . . . S. Korea . . . . . . . . . . . . . . . . . . . . Taiwan . . . . . . . . . . . . . . . . . . . . .
5,100 600 0 0 5,400 0 200 10,500 38,000 29,300
11.2
0.3 0.0 0.0 3.0 0.0 0.6 7.3 46.9 41,0
692 0 2,148 816 1,760 1,308 0 0 900 0
Us. . . . . . . . . . . . . . . . . . . . . . . . .
526,900
19.5
7,689
SOURCE: B. Semenov etal.. ’’Growth Projections and Development TrendsforNuclear Power.’’ lAEABulletin, vol. , 31, No.3,1989, p.7.
reliability low. Historically, nuclear power systems have cost more and operated at lower capacity factors than anticipated, suggesting that it maybe appropriate for risk-averse potential users of nuclear power with limited capital to wait for these systems to operate commercially, thereby demonstrating their cost and performance characteristics.
●
There are several issues related to nuclear power in the developing countries that differ from those in the industrialized countries. These include scale, technical skill requirements, environmental constraints, and proliferation. . Scale: it is sometimes argued that nuclear power is too large for developing countries, If the rule-of-thumb that no single facility should supply more than 10 percent of total system electricity is used, then a 600 MW nuclear power plant would be appropriate only for systems 6,000 MW or larger, According to official capacity expansion plans,% over 20 developing countries will have systems this size or larger by 1999. Although the World Bank projections are essentially a ‘‘business-asusual’ scenario, excluding aggressive efficiency improvements, it appears that 600 MW power plants, nuclear or otherwise, are not oversized for at least the larger developing countries. Moreover, the new nuclear plants
●
●
currently under development are expected to be about 150 MWe in size, making them a feasible size for some smaller countries as well. Technical Skill Requirements: Nuclear technology is complex, requiring a high level of skilled personnel. Few developing countries currently have sufficient domestic training facilities to produce these personnel, and would therefore be dependent on other countries for both the equipment and the operation of nuclear power plants. This could further aggravate foreign debt problems. This is not true for those countries, like China, that have considerable experience with and infrastructure for nuclear technologies (see box 6-D). Environmental Aspects: Nuclear power releases little of the air pollution associated with fossil fuel combustion. Every stage of the nuclear fuel cycle, however, poses the risk of releasing radioactive pollutants. Wastes vary from mining dust with a low level of radiation to the highly radioactive spent fuel rods, requiring careful47 handling and long term disposal strategies. The probability of a large scale nuclear accident—such as Chernobyl— may be small, but poses serious implications for the environment and human health. Proliferation: Concern over nuclear weapons proliferation limits the attractiveness of export-
46E. Moore and G. s~~ World B* ~du~~ and Ener~ D~artmen4 Capital E~e~i~res for Elecrn’c power in the Developing COUnfiieS in the 1990s, Industry and Energy Department Working Paper No. 21, February 1990, p. 49. 47Ufit~ Natiom Dep~ment of Te~~~ Cwpaation for Development, Energy and Environment:~~pacfs ad Conmols (New York, ~: october, 1990), p. 33.
196 ● Fueling Development: Energy Technologies for Developing Countries
ing nuclear power technologies. The links between nuclear power and nuclear weapons are subject to some dispute, but the basic issue is straightforward. Nuclear power requires nuclear fuels, facilities to process them, and trained personnel, and these facilities hypothetically could be used to produce nuclear weapons.48 India’s first demonstration of a nuclear weapon, detonated in 1974, was believed to be derived from research facilities. 49 More recently, the discovery of Iraq’s nuclear weapons program has cast serious doubts on the ability of the existing nonproliferation regime or even much more stringent criteria50 to control the spread of nuclear weapons.51
Box 6-D—Nuclear Power in China
A basic gas turbine is a conceptually straightforward device. Air is compressed and then mixed with natural gas. The mixture is ignited, and the expanding hot gas turns a turbine. The turbine drives both the air compressor and an electric generator.
China suffers from severe power shortages, and coal and hydropower reserves, although plentiful, are expensive to use, aggravate environmental problems, and are located far from population centers. China, unlike other developing countries, also has a relatively large and experienced nuclear industry. These factors have led to ambitious plans for nuclear power generation. As with other technologies, China has shown a clear preference for domestic production over imports. In the case of nuclear power, China is both importing selected technologies where necessary while also working to develop indigenous production capabilities. China’s first nuclear power plant was a 300 MW PWR reactor using mostly indigenous technology located near Shanghai. Two 900 MW units, using imported technology, are under construction in Daya Bay. It is expected that much of the electricity from these units will be sold to Hong Kong. Also planned are two 600 MW units using domestic technology and two 1,000 MW units using Soviet technology. SOURCES: Foreign Broadcast Information Service, JPRS Re-
Gas turbines have long served as peaking power plants for electric utilities in the United States. A number of innovative technologies have increased the efficiency of gas turbines from about 25 percent for a standard gas turbine52 to up to 47 percent for the most advanced turbine systems using steam injection and other improvements.53 These efficiency improvements are lowering costs to the point that gas turbines are no longer necessarily limited to peaking. Gas turbine costs are also relatively insensitive to scale,54 and therefore can be sized to meet relatively small loads with only a modest cost penalty.
One effective modification to the basic gas turbine is to use its hot waste gas to heat water and power a separate steam turbine. This combined cycle
Gas Turbines
po~ Science and Technology+-China: Energy, JPRS-CEN-89-005, My 17, 1989. Y. Lu, “The Prospects and Economic Costs of the Reduction of the C02 Emissions in the PRC,” presented at the Global Climate Change: The Economic Costs of Mitigation and Adaptation Conference, Dec. 4-5, 1990, Washington DC. U.S. Congress, Office of Technology Assessmen6Energy Technology Transferto China, ATechnical Memorandum, O’IA-TMISC-30 (Washington DC: U.S. Government Printing Office, September 1985).
As~oMeration conce~ me discussed in more detail in U.S. Congress, Office of Technology Assessmen~ Energy Technology Trumfer to China, OTA-TM-ISC-30 (TVashington, DC: U.S. Government Printing Office, September 1985); U.S. Congress, Office of Technology Assessmen4 Nuclear Power in an Age of Uncertainty, OTA-E-216 (Washington DC: U.S. Government Printing Oftlce, Febrwq 1984), pp. 200-203; U.S. Congress, Office of Technology Assessment, Nuclear Proliferation and Safeguards (New York: Praeger Publishing Co., June 1977). 49u.s, Consess, Office of Technology Assessment, Nuclear Power in an Age of Uncertainty, Ibid., p. 2~. 50R,H. Wlllims and H*A Felveso~ “Diversion-R esist~ce Cfitel-ia for Future Nuclem Power, ” Center for Energy and Environmental Studies, Princeton University, May 26, 1989. SIR. Jeffrey Smiti ‘‘~q’s Secret A-Arms Effort: Grim Lessons fOr the World,’ The Washington Post, Aug. 11, 1991, p. Cl; see also, George W. Rathjens and Marvin M. Miller, “Nuclear Proliferation after the Cold W~,” Technology Review, August/September 1991, pp. 25-32. 52Elm~c power Rese~ch Imtitu[e (Ep~), TAG-T~Chnica/ ASseS$~enf Gu~&, E/ectrici~ SUpp/y 1989, Epw P-6587-L (pdo ~to, CA: EIwtric Power Research Institute, September 1989), p. 7-56, average annual heat rates. All heat mtes given here Me m~sured at ~gher heat~g value (HHW, that is they include the latent heat of condensation of the water produced. 5qNa~al gm f~ed IS~G. See R wilfi~s ad E, ~so~ ‘‘Expan~g Roles for Gas ~bines ti power Generatio~’ ‘rhOIMS B. Johansson, Birgit Bodlund, and Robert H. Williams (eds.), Electricity: Eficient End-Use and New Generation Technologies, and Their Planning Implications (Lund, Sweden: Lund University Press, 1989), p. 524. ‘Ibid., p. 515.
Chapter 6---Energy Conversion Technologies ● 197
process increases overall efficiency but at an increased capital cost (see app. B). 55 Construction can be phased, whereby the gas turbine can be built and operated, and the steam turbine added when needed. Alternatively, the hot waste gas from the gas turbine can be used to heat water and the resulting steam injected directly back into the turbine. Again, this increases efficiency, but at some increase in capital cost (see app. B),56 Several steam injected gas turbines, or STIGs, are already in use for industrial cogeneration.57 Further modifications, such as intercooling, increase the efficiency even more,58 but costs are uncertain. Gas turbines are a promising technology for the developing world. As discussed in chapter 7, many developing countries have untapped natural gas reserves that could be a supply for future electricity needs. Gas turbines have a relatively low initial cost, and when combined with low cost domestically produced natural gas could produce electricity at a low total cost. Gas turbines can be sized to fit a wide range of needs, and there is little cost penalty for installing smaller units. Construction times can be quite short-less than 1 year.59 The technological sophistication of advanced gas turbines poses potential difficulties in maintenance for developing countries, but these could be overcome if modular aircraft derivative turbine designs are used. In this case, spares could be kept at a central regional facility and quickly transported to the site and swapped for a turbine needing maintenance. Concerns over air quality and global warming also favor gas turbines, as they give off little SO X and up to 60 percent less CO2 per kWh produced than
coal-fired plants.60 NO X emissions, however, are a continuing concern: technologies for reducing NO= emissions, such as water or steam injection, are being explored.
Cogeneration Cogeneration is the combined production of electric or mechanical power plus thermal energy in a single process and from the same primary energy resource. A typical cogeneration system will produce electricity for running factory motors or for sale to the electric utility grid, and at the same time use the waste heat from electricity production to provide process heat for the plant or, in some cases, to be sold to neighboring industry, commerce, government buildings, or residential housing for heating. The passage of the Public Utility Regulatory Policies Act (PURPA) in 1978 has led to a substantial increase in cogeneration in the United States with large sales of privately cogenerated or otherwise produced electricity to the utility grid.61 Cogeneration is also heavily used in some developing countries. In China, for example, 4.6 GW of steam extraction turbines for cogeneration were on line in 1980, representing 11 percent of all steam turbine units. The thermal output from central station power plants used for cogeneration totaled about 11 percent of total national heating demand; 85 percent of this was used for process heat, 15 percent for space heat. For example, roughly 7 percent of building space heating in Beijing is supplied by cogeneration facilities. 62 Yet cogeneration faces substantial obstacles in 63 many countries. In India, for example, many state
55El=~c power Re~~Mch ~ti~te ~p~), TAG.Te~hni~~/ A~~e~~~e~~ Gui&, E/ecfn”cjty .$upp/y 1989, I?PRI P-6587-L Power Research Institute, September 1989), p. 7-61.
(Pdo ~to,
CA: El~tric
‘Ibid.,, pp. 7-57. 57R wfl~~ and E, ~sou C’Expand&g Roles for Gas ~rbines ~ power Generatio~” Thomas B. JOlUUMSO~ B@it Bodlund, and Robert H. Williams (eds.), Electricity: Eficient En&Use and New Generation Technologies, and Their Planning Implications (Lund, Sweden: Lund University Press, 1989), p. 529. Sgfbid., p. 531. 5~lW~c power Resemch ~ti~te @p~), TAG-Technica/ As~essmenr Guide, E/ecrn”city supply 1989, EPRI P-6587-L (pdo Alto, CA: E1ectic Power Research Institute, September 1989), p. 7-58. -or ISTIG. R. Williams and E. Larson, ‘‘Expanding Roles for Gas Thrbines in Power Generation” Thomas B. JohanssorL Birgit Bodhmd, and Robert H. Williams (MIs.), Electn’city: Eficient End-Use and New Generation Technologies, and Their Planning Implications (Lund, Sweden: Lund University Press, 1989), p. 539. 61u,s. Conwess, Offlw of Te~hnolo~ A~SeSS~ent, ]ndustn”al ad co~ercial Cogeneration, oTA-E-lqJ (Washingto~ DC: U.S. Government Printing Office, February 1983). 62Qu Yu, “Cogeneration in the People’s Republic of China,” The Energy Journal, vol. 5, No. 2, 1984, pp. 133-137. 63* OTA rew~ ~ ex~ed ~my of tie issues surround~g cogeneratio~ U.S. Congress, OffIce of Technology Assessment, Industrial and Commercial Cogeneration, OTA-E-192 (Washington, DC: U.S. Government PrintingOftlce, February 1983).
198 ● Fueling Development: Energy Technologies for Developing Countries
Table 6-1 l-Geothermal Electricity y Generation in Developing Countries (1990) Geothermal capacity (MW)
Country Philippines . . . . . . . . . . . . . . . Mexico . . . . . . . . . . . . . . . . . . . Indonesia . . . . . . . . . . . . . . , . El Salvador . . . . . . . . . . . . . . . Nicaragua . . . . . . . . . . . . . . . . Kenya . . . . . . . . . . . . . . . . . . . Argentina . . . . . . . . . . . . . . . . Zambia . . . . . . . . . . . . . . . . . . Us. . . . . . . . . . . . . . . . . . . . . .
894 725 142 95 70 45