DRAFT—DO NOT CIRCULATE Prince George’s County Public Schools 14201 School Lane · Upper Marlboro · MD 20772 www.pgcps.org
August 2010
PLANNING Report
Elementary-to-Middle School Transition Planning Report, SY2011 PRINCIPAL INVESTIGATORS Erika D. Taylor, Ph.D.
DIVISION OF PERFORMANCE MANAGEMENT DEPARTMENT OF RESEARCH AND EVALUATION Phone: 301-780-6807 Fax: 301-952-5931
William R. Hite, Jr., Ed.D., Superintendent of Schools Lisa D. Price, PMP, Performance Officer Kola K. Sunmonu, Ph.D., Director of Research and Evaluation BOARD OF EDUCATION: Verjeana M. Jacobs, Chair · Ron L. Watson, Jr., Ph.D., Vice Chair Donna Hathaway Beck · Pat J. Fletcher · Heather Iliff · R. Owen Johnson, · Rosalind A. Johnson Amber P. Waller · Jonathan Harris II, Student Member William R. Hite, Jr., Ed.D., Superintendent of Schools and Secretary/Treasurer
DRAFT—DO NOT CIRCULATE
Table of Contents
List of Tables .................................................................................................................................. ii List of Figures ................................................................................................................................ iii Introduction......................................................................................................................................1 Who Are the Incoming SY11 Middle School Students? .................................................................2 Race/Ethnicity and Gender ................................................................................................. 2 School-Based Programs and Support Services ................................................................... 3 Summary ............................................................................................................................. 7 How Did Incoming Middle School Students Fare Academically in SY10?....................................9 Summary ........................................................................................................................... 16 What are the Behavioral Attributes of Incoming Middle School Students?..................................17 Frequent Absences and Habitual Truancy ........................................................................ 17 Suspensions....................................................................................................................... 18 Summary ........................................................................................................................... 20 Conclusions....................................................................................................................................21 References ......................................................................................................................................24
Elementary-to-Middle School Planning Report, SY2011
Page i
DRAFT—DO NOT CIRCULATE List of Tables Table 1—Incoming Middle School Students’ Race, Ethnicity and Gender by Area ..................... 2 Table 2—Incoming Middle School Students’ ESOL Status by School and Area.......................... 4 Table 3—Entering Middle School Students’ FARMS Status by School and Area........................ 5 Table 4—Entering Middle School Students’ Special Education Status by School and Area ........ 6 Table 5—Number and Percent of Entering Middle School Students Retained in SY10 by School and Area ......................................................................................................................... 7 Table 6 –Incoming Middle School Students by SY10 MSA Reading Proficiency Level and School........................................................................................................................... 14 Table 7 – Incoming Middle School Students by SY10 MSA Math Proficiency Level and School ....................................................................................................................................................... 15 Table 8 – Incoming Middle School Student Absences by Area and School, SY10 ..................... 18 Table 9—Incoming Middle School Students Ever Suspended in SY10 by School and Area...... 19 Appendix A – Middle School Rankings by Percent of ESOL Participation, SY10 ......................25 Appendix B – Middle School Rankings by Percent Participation in FARMS, SY10 .................. 26 Appendix C – Middle School Rankings by Percent Participation in SPED, SY10...................... 27 Appendix D—Middle School Rankings by Percent Proficient and Advanced in MSA Reading, SY10 ..................................................................................................................... 28 Appendix E – Middle School Rankings by Percent Proficient and Advanced in MSA Math, SY10 ..................................................................................................................... 29 Appendix F –Middle School Rankings by Percent Frequently Absent and Habitually Truant, SY10 ..................................................................................................................... 30 Appendix G – Middle School Rankings by Percent Suspended, SY10........................................ 31
Elementary-to-Middle School Planning Report, SY2011
Page ii
DRAFT—DO NOT CIRCULATE List of Figures Figure 1—Entering Middle School Students by ESOL, Special Education and ............................ 3 Figure 2—Percent of Incoming Students by Performance Level, .................................................. 9 Figure 3 – Percent of Incoming Middle School Students by MSA Reading Performance Level and Gender, SY10 ........................................................................................................ 10 Figure 4 – Percent of Incoming Middle School Students by MSA Math Performance Level and Gender, SY10............................................................................................................... 11 Figure 5 – Incoming Middle School Students SY10 MSA Reading Performance Levels ........... 12 Figure 6 – Incoming Middle School Students by SY10 MSA Math Proficiency Level............... 13
Elementary-to-Middle School Transition Planning Report, SY2011
Page iii
DRAFT—DO NOT CIRCULATE Introduction The transition from elementary to middle school can pose significant academic challenges for some students. One way that school personnel can help to alleviate some of the difficulties that incoming middle school students may face is to understand the academic strengths and challenges associated with these students.
Providing the
information necessary to adequately allocate resources to assist with any challenges and to provide supports around students’ strengths is vital to this process. This report presents descriptive information designed to assist principals and Assistant Superintendents with learning more about incoming middle school students in terms of their demographic makeup, special program participation (i.e., FARMS, ESOL, SPED), prior academic achievement, and behavioral patterns as they relate to school attendance. The students included in this report are all transitioning to a PGCPS middle school in SY11 for the first time.
With these students in mind, we address three
questions:
1. Who are the incoming middle school students in SY11? 2. How did the SY11 incoming middle school students fare academically in SY10? 3. What are the attendance patterns of the incoming middle school students?
All of the student characteristics presented in this report correspond to key foci in academic achievement at local, state and federal levels, and are important to understanding, at a glance, students’ potential for future academic success. The report is divided into three sections, with each section providing information relevant to the aforementioned questions. Within each section, we present data for incoming middle school students as a whole, and then disaggregate by school and area as appropriate.
The information is also
summarized to emphasize the areas of challenge and strength among student groups and schools. It is our hope that this information will affirm what school officials already know about these students, and provide additional opportunities for data-driven decision making among school principals and Assistant Superintendents. Elementary-to-Middle School Transition Planning Report, SY2011
Page 1
DRAFT—DO NOT CIRCULATE Who Are the Incoming SY11 Middle School Students? In this section of the report, we present general demographic characteristics and participation in special programs for incoming middle school students. Research studies consistently suggest that participation in certain programs and school-based supports (e.g., FARMS, special education, ESOL) are indicators of specific demographic factors (e.g., socioeconomic status, learning challenges, level of English proficiency) that may have substantial effects on students’ academic success without proper intervention (e.g., Entwisle & Alexander, 1992; Lee, 2006). Other factors, such as race, ethnicity and gender, have also been identified as characteristics related to academic success, but in a different manner. For example, members of certain ethnic groups have been identified by the US Department of Education as underserved by public school systems prior to the implementation of the No Child Left Behind Act of 2001 (e.g., Black/African-American, Hispanic/Latino, American Indian/Alaskan Native). Gender has been recognized as an important factor in the underrepresentation of students in specific areas of study and career focus (e.g., fewer female students in science, technology, engineering and mathematics (STEM) careers). Race/Ethnicity and Gender • As of July 12, 2010, approximately 5427 students were identified as entering 6th or 7th grade middle school students. • As Table 1 indicates, race and ethnic composition of the district varies by area. Within most areas, African American students comprise the majority of students with the exception of Area 1, where they are slightly outnumbered by students of Hispanic origin. • The proportion of male students to female students entering middle school is about equal, regardless of PGCPS area (see Table 1). Table 1—Incoming Middle School Students’ Race, Ethnicity and Gender by Area All Incoming Students
Area 1 N
%
4 38 301 317 20 1 0 55
0.5 5.2 40.9 43.1 2.7 0.1 0.0 7.5
Area 2 N
%
Area 3 N
%
Area 4 N
%
Race/Ethnicity American Indian/Alaskan Native Asian Black or African American Hispanic Multiple Races
12 27 1672 89 54 4 0 71
0.6 1.4 86.7 4.6 2.8 0.2 0.0 3.7
0 38 689 93 28 1 0 10
0.0 4.4 80.2 10.8 3.3 0.1 0.0 1.2
2729 371 50.4 961 50.5 963 2698 365 49.6 942 49.5 966 5427 736 100.0 1903 100.0 1929 Total Note: Numbers presented here are based on SY11 middle school enrollment as of July 12, 2010
49.9 50.1 100.0
434 425 859
50.5 49.5 100.0
Native Hawaiian/Other Pacific Islander
No Race Code White
20 169 3796 1036 150 8 1 247
4 66 1134 537 48 2 1 111
0.2 3.5 59.6 28.2 2.5 0.1 0.1 5.8
Gender Female Male
Elementary-to-Middle School Transition Planning Report, SY2011
Page 2
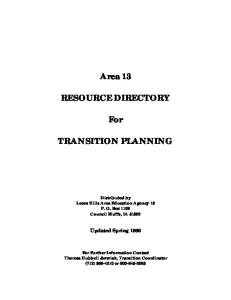
DRAFT—DO NOT CIRCULATE School-Based Programs and Support Services • As Figure 1 indicates, less than one-tenth (8.9%) of all Grade 6 and 7 students entering middle schools in SY11 were recipients of ESOL services in SY10; nearly 6 in 10 students participated in FARMS, and nearly 12% of incoming students received SPED services in SY10 by area and school. • This participation in school-based support services in SY10, including English for Speakers of Other Languages (ESOL), Special Education (SPED) and Free and Reduced Meals (FARMS), varies by area as well. • For example, as Figure 1 indicates, SY10 ESOL participation among entering middle school students was highest in Area 1 (18.3%), and lowest in Area 3 (1.8%). • Entering middle schools student participation in FARMS in SY10 is highest among students in Area 2 (66.9%), and lowest in Area 3 (45.0%), while SY10 SPED participation is highest among students in Area 4 (15.3%) and lowest in Area 1 (10.9%). Figure 1—Entering Middle School Students by ESOL, Special Education and FARMS Status by Area 80.0%
70.0%
Percent of Students
60.0%
50.0%
40.0%
66.9% 66.2% 58.0%
30.0%
60.4%
45.0% 20.0%
10.0%
8.9%
18.3% 4.9% 14.2% 1.8%
15.3% 11.8%10.9%12.2%11.8%
0.0% ESOL
FARMS All Incoming Students
•
Area 1
SPED Area 2
Area 3
Area 4
An examination of ESOL participation by school reveals variation among schools, even within areas. For example, 43.1% of students matriculating to Nicholas Orem (Area 1) are currently designated as participating in ESOL, while less than ten percent of students entering Martin Luther King, Jr. have participated in ESOL services (see Table 2).
Elementary-to-Middle School Transition Planning Report, SY2011
Page 3
DRAFT—DO NOT CIRCULATE •
•
•
As Table 2 indicates, similar variations exist in Area 2, such that more than 45 percent of students entering William Wirt participated in ESOL, as compared to 2.9% of students attending Kenmoor. Areas 3 and 4 have appreciably smaller numbers of ESOL students, and less variation in the number and percent of students among schools as a result. Less than 1% of students entering James Madison (Area 3) had an ESOL designation in SY10, while nearly six percent of entering Kettering Middle School students received ESOL services. (see Table 2) Similarly, Benjamin Stoddert (Area 4) has no matriculating ESOL students, and 13.2% of students matriculating to Isaac Gourdine have been identified as ESOL (see Table 2). Table 2—Incoming Middle School Students’ ESOL Status by School and Area ESOL
All Incoming Students
Number
%
133 87 320 211 72 823
48 23 37 19 31 158
36.1% 26.4% 11.6% 9.0% 43.1% 19.2%
394 401 339 237 312 133 1816
100 25 10 14 38 60 247
25.4% 6.2% 2.9% 5.9% 12.2% 45.1% 13.6%
276 360 349 458 154 332 1929
3 7 7 3 9 5 34
1.1% 1.9% 2.0% 0.7% 5.8% 1.5% 1.8%
215 113 68 319 55 89 859
0 3 9 25 1 4 42
0.0% 2.7% 13.2% 7.8% 1.8% 4.5% 4.9%
Area 1 Charles Carroll Middle Greenbelt Middle Hyattsville Middle Martin Luther King Jr Middle Nicholas Orem Middle
Total Area 2 Buck Lodge Middle G James Gholson Middle Kenmoor Middle Samuel Ogle Middle Thomas Johnson Middle William Wirt Middle
Total Area 3 Benjamin Tasker Middle Drew-Freeman Middle Ernest Everett Just Middle James Madison Middle Kettering Middle Walker Mill Middle
Total Area 4 Benjamin Stoddert Middle Gwynn Park Middle Isaac J Gourdine Middle Oxon Hill Middle Stephen Decatur Middle Thurgood Marshall Middle
Total
Elementary-to-Middle School Transition Planning Report, SY2011
Page 4
DRAFT—DO NOT CIRCULATE • •
•
•
As Table 3 suggests, FARMS participation in SY10 differs both between and within areas for incoming middle school students. In Area 1, the percentage of students who received FARMS during SY10 ranges from 45.5% (Martin Luther King, Jr.) to 84.7% (Nicholas Orem). However, in Area 2, the range is much wider—from 27.4% (Samuel Ogle)—to 91.0% in William Wirt (see Table 3). The variance in FARMS participation in Areas 3 and 4 is smaller than in Areas 1 and 2. In Area 3, there is a 40-percentage point difference between the school with the smallest proportion of students receiving FARMS (Benjamin Tasker; 27.2%) and the largest (Drew-Freeman; 67.5%). Area 4 has even less variation among schools, as Gwynn Park has the lowest percentage of students receiving FARMS (42.5%) and Benjamin Stoddert has the highest (68.4%). Table 3—Entering Middle School Students’ FARMS Status by School and Area All Incoming Students
Number
%
133 87 320 211 72 736
110 69 220 96 61 487
82.7% 79.3% 68.8% 45.5% 84.7% 66.2%
394 401 339 237 312 133 1816
318 295 215 65 191 121 1205
80.7% 73.6% 63.4% 27.4% 61.2% 91.0% 66.4%
276 360 349 458 154 332 1929
75 243 136 174 63 177 868
27.2% 67.5% 39.0% 38.0% 40.9% 53.3% 45.0%
215 113 68 319 55 89 859
147 48 39 203 29 53 519
68.4% 42.5% 57.4% 63.6% 52.7% 59.6% 60.4%
FARMS
Area 1 Charles Carroll Middle Greenbelt Middle Hyattsville Middle Martin Luther King Jr. Middle Nicholas Orem Middle Total
Area 2 Buck Lodge Middle G James Gholson Middle Kenmoor Middle Samuel Ogle Middle Thomas Johnson Middle William Wirt Middle Total
Area 3 Benjamin Tasker Middle Drew-Freeman Middle Ernest Everett Just Middle James Madison Middle Kettering Middle Walker Mill Middle Total Area 4 Benjamin Stoddert Middle Gwynn Park Middle Isaac J Gourdine Middle Oxon Hill Middle Stephen Decatur Middle Thurgood Marshall Middle Total
Elementary-to-Middle School Transition Planning Report, SY2011
Page 5
DRAFT—DO NOT CIRCULATE • •
As Table 4 indicates, the percentage of students classified as SPED in SY10 varies across middle schools, with the smallest proportion of students enrolled in Gwynn Park (3.5%), and the largest in G. James Gholson (16.0%). The variation within areas differs as well. For example, the proportions of students identified as SPED in SY10 ranges from 6.1% to 14.3% in Area 1, and from 3.5% to 15.0% in Area 4 (see Table 4).
Table 4—Entering Middle School Students’ Special Education Status by School and Area All Incoming Students
Number
%
132 76 317 210 69 804
8 8 34 30 7 87
6.1% 10.5% 10.7% 14.3% 10.1% 10.8%
378 394 337 235 305 133 1858
45 63 44 23 21 22 218
11.9% 16.0% 13.1% 9.8% 6.9% 16.5% 12.2%
272 355 340 456 150 328 1901
22 53 47 46 19 38 225
8.1% 14.9% 13.8% 10.1% 12.7% 11.6% 11.8%
214 113 68 300 52 89 836
24 4 7 45 4 12 96
11.2% 3.5% 10.3% 15.0% 7.7% 13.5% 11.5%
SPED
Area 1 Charles Carroll Middle Greenbelt Middle Hyattsville Middle Martin Luther King Jr. Middle Nicholas Orem Middle
Total Area 2 Buck Lodge Middle G James Gholson Middle Kenmoor Middle Samuel Ogle Middle Thomas Johnson Middle William Wirt Middle
Total Area 3 Benjamin Tasker Middle Drew-Freeman Middle Ernest Everett Just Middle James Madison Middle Kettering Middle Walker Mill Middle
Total Area 4 Benjamin Stoddert Middle Gwynn Park Middle Isaac J Gourdine Middle Oxon Hill Middle Stephen Decatur Middle Thurgood Marshall Middle
Total
• •
As Table 5 indicates, less than 1% (51) of entering middle school students were retained in SY2010, and are concentrated in eight PGCPS middle schools. The majority of these students (34) will attend schools in Area 2, with more than half of the retained students (18) enrolled in G. James Gholson (see Table 5).
Elementary-to-Middle School Transition Planning Report, SY2011
Page 6
DRAFT—DO NOT CIRCULATE •
As Table 5 also indicates, the second largest group of retained students will attend Kenmoor.
Table 5—Number and Percent of Entering Middle School Students Retained in SY10 by School and Area All Incoming Students
Number
%
132 85 318 211 70 816
0 0 1 0 0 1
0.0% 0.0% 0.3% 0.0% 0.0% 0.1%
391 402 337 234 308 133 1805
0 18 9 0 7 0 34
0.0% 4.5% 2.7% 0.0% 2.3% 0.0% 1.8%
275 357 341 458 152 332 1915
0 5 1 0 0 2 8
0.0% 1.4% 0.3% 0.0% 0.0% 0.6% 0.4%
215 113 68 316 54 89 855
8 0 0 0 0 0 8
3.7% 0.0% 0.0% 0.0% 0.0% 0.0% 0.9%
Retained
Area 1 Charles Carroll Middle Greenbelt Middle Hyattsville Middle Martin Luther King Jr. Middle Nicholas Orem Middle
Total Area 2 Buck Lodge Middle G James Gholson Middle Kenmoor Middle Samuel Ogle Middle Thomas Johnson Middle William Wirt Middle
Total Area 3 Benjamin Tasker Middle Drew-Freeman Middle Ernest Everett Just Middle James Madison Middle Kettering Middle Walker Mill Middle
Total Area 4 Benjamin Stoddert Middle Gwynn Park Middle Isaac J Gourdine Middle Oxon Hill Middle Stephen Decatur Middle Thurgood Marshall Middle
Total
Summary The data presented in this section suggest that there are differences between and within school areas in terms of race, ethnicity, and the level of incoming students’ participation in school-based programs and support services. In particular, this information indicates:
Elementary-to-Middle School Transition Planning Report, SY2011
Page 7
DRAFT—DO NOT CIRCULATE Race/Ethnicity and Gender • Although more than two-thirds of the incoming middle school students are Black or African-American and approximately one-fifth are Hispanic, the race/ethnic composition of each area differs, increasing the potential for differences in student needs around school supports and special programs. • Approximately equal numbers of male and female students will attend middle schools during SY11. School-Based Programs and Support Services • As expected, student participation in special programs and school supports differs by school as well. For example, the three schools expecting students with the highest ESOL and FARMS participation are William Wirt, Nicholas Orem, and Charles Carroll, respectively. The schools with the lowest percentages of incoming students receiving ESOL services in SY10 are Benjamin Stoddert, James Madison, and Benjamin Tasker. • Schools expecting the smallest proportions of students who participated in FARMS last academic year are Benjamin Tasker, Thomas Johnson, and James Madison. • The largest proportions of incoming middle school students who received SPED services in SY10 are William Wirt, G. James Gholson, and Oxon Hill, and DrewFreeman, respectively. Conversely, the schools with the lowest percentages of incoming students who participated in SPED during SY10 are Gwynn Park, Charles Carroll, and Thomas Johnson (see Appendix C). Retention • Less than one percent of students transitioning to middle schools in SY11 were retained in SY10. All of these students are concentrated in eight middle schools: Hyattsville, G. James Gholson, Kenmoor, Thomas Johnson, Drew-Freeman, Ernest Everett Just, Walker Mill, and Benjamin Stoddert. • The majority of these students attend schools in Area 2, with more than half of them attending G. James Gholson. The second and third largest groups of retained students attend Kenmoor and Benjamin Stoddert, respectively.
Elementary-to-Middle School Transition Planning Report, SY2011
Page 8
DRAFT—DO NOT CIRCULATE How Did Incoming Middle School Students Fare Academically in SY10? A number of studies have found that the largest predictor of future academic achievement is past academic performance (e.g., Garavalia & Gredler, 2002). For this reason, this section describes incoming middle school student performance in SY10, as measured by the Maryland School Assessment (MSA). Specifically, the percentage of students scoring in each performance level is presented for all incoming middle school students as a whole, by gender, grade, area, and school. • •
Of the 5227 entering middle school students with available SY10 MSA reading scores, 17.2% scored in the Basic performance level range, 47.5% were proficient, and 35.3% scored in the Advanced range (see Figure 2) The proportion of entering students in each SY10 MSA mathematics performance level is also found in Figure 2. Approximately one-quarter of students (25.5%) scored in the Basic range, 55.6% scored in the Proficient range, and 19.0% scored in the Advanced range.
Figure 2—Percent of Incoming Students by Performance Level, SY10 MSA Reading and Mathematics 60%
50%
Percent of Students
40%
Basic 30%
Proficient
55.6%
Advanced
47.5% 20%
35.3% 25.5% 10%
19.0%
17.2%
0%
Reading
Math SY10 MSA Performance Level
Note: MSA Reading scores were available for 5227 students; MSA Mathematics scores were available for 5218 students.
Elementary-to-Middle School Transition Planning Report, SY2011
Page 9
DRAFT—DO NOT CIRCULATE • • •
The SY10 MSA Reading performance of incoming middle school students is displayed by gender in Figure 3. Overall, female students outperformed male students. Specifically, larger percentages of male students scored in the Basic and Proficient ranges (20.4% and 49.4%, respectively), as compared to female students (14.0% and 45.6%, respectively). Additionally, a smaller percentage of incoming male students (30.2%) scored in the Advanced range of the reading MSA, as compared to female students (40.0%).
Figure 3 – Percent of Incoming Middle School Students by MSA Reading Performance Level and Gender, SY10 60%
50%
Percent of Students
40%
Female
30%
Male 49.4% 45.6% 20%
40.0% 30.2% 20.4%
10%
14.0%
0% Basic
Proficient
Advanced
SY10 MSA Reading Performance Level
Note: MSA Reading scores were available for 5227 students.
• • •
A comparison of SY10 MSA Math performance levels by gender can be found in Figure 4. Again, female students outperformed male students. As Figure 4 indicates, a larger percentage of males (28.8%) scored within the Basic range in comparison to female students (22.2%). In addition, larger percentages of female students scored within the Proficient and Advanced ranges (58.4% and 19.4%, respectively) as compared to incoming male students (52.6% and 18.5%, respectively).
Elementary-to-Middle School Transition Planning Report, SY2011
Page 10
DRAFT—DO NOT CIRCULATE Figure 4 – Percent of Incoming Middle School Students by MSA Math Performance Level and Gender, SY10 70%
60%
Percent of Students
50%
40%
Female Male 30%
58.4% 52.6% 20%
28.8% 10%
22.2%
19.4%
18.5%
0% Basic
Proficient
Advanced
SY10 MSA Math Performance Level
Note: MSA Mathematics scores were available for 5218 students.
• •
•
A comparison of students entering Grade 6, as compared to students entering Grade 7 yields group differences in performance on the SY10 MSA Reading as well (see Figure 5). As Figure 5 indicates, the majority of students entering middle school in Grade 6 scored in either the Proficient or Advanced ranges of the reading portion of the MSA (43.9% and 40.4%, respectively), with 15.7% of these students scoring within the Basic range. While the majority of incoming Grade 7 students also scored within the Proficient or Advanced ranges of the MSA in reading, the percentages were smaller (49.8% and 32.0%, respectively). Therefore, a larger percentage of entering Grade 7 students scored within the Basic range (18.2%) as compared to incoming Grade 6 students (15.7%)
Elementary-to-Middle School Transition Planning Report, SY2011
Page 11
DRAFT—DO NOT CIRCULATE Figure 5 – Incoming Middle School Students SY10 MSA Reading Performance Levels by Grade 60%
50%
Percent of Students
40%
Grade 6 30%
Grade 7
49.8% 43.9% 20%
40.4% 32.0%
10%
15.7%
18.2%
0% Basic
Proficient
Advanced
MSA Reading Performance Level
• • •
However, as Figure 6 indicates, students entering middle school in Grade 7 outperformed Grade 6 students on the math portion of the SY10 MSA. Specifically, 24.5% of incoming Grade 7 students scored within the Basic range, as compared to 27.0% of Grade 6 students. In addition, more than half (53.5%) of incoming Grade 7 students scored in the Proficient range, and 22.0% scored within the Advanced range. In contrast, 58.6% of entering Grade 6 students scored within the Proficient range and 14.4% scored in the Advanced range.
Elementary-to-Middle School Transition Planning Report, SY2011
Page 12
DRAFT—DO NOT CIRCULATE Figure 6 – Incoming Middle School Students by SY10 MSA Math Proficiency Level and Grade 70%
60%
Percent of Students
50%
40% Grade 6 Grade 7 30%
58.6%
53.5%
20%
27.0% 24.5% 10%
22.0% 14.4%
0% Basic
Proficient
Advanced
MSA Math Performance Level
• •
Table 6 displays the proportion of students in each performance level for MSA Reading by area. The percentages of students scoring within each performance level are similar among Areas 1, 2 and 3. However, in Area 4 there are lower percentages of students scoring in the Advanced (28.0%) range, and higher proportions of students scoring in the Basic range (23.9%). Therefore, in comparison to other areas, it appears that students who will attend middle schools in Area 4 did not fare as well on the Reading MSA in SY10 (see Table 6).
Elementary-to-Middle School Transition Planning Report, SY2011
Page 13
DRAFT—DO NOT CIRCULATE Table 6 –Incoming Middle School Students by SY10 MSA Reading Proficiency Level and School All Incoming Students
N
Basic %
Proficient N %
Advanced N %
Area 1 Charles Carroll Middle Greenbelt Middle Hyattsville Middle Martin Luther King Jr Middle Nicholas Orem Middle
Total Area 2 Buck Lodge Middle G James Gholson Middle Kenmoor Middle Samuel Ogle Middle Thomas Johnson Middle William Wirt Middle
Total Area 3 Benjamin Tasker Middle Drew-Freeman Middle Ernest Everett Just Middle James Madison Middle Kettering Middle Walker Mill Middle
Total Area 4
126 76 310 201 67 780
25 9 61 19 7 121
19.8% 11.8% 19.7% 9.5% 10.4% 15.5%
60 52 132 86 34 364
47.6% 68.4% 42.6% 42.8% 50.7% 46.7%
41 15 117 96 26 295
32.5% 19.7% 37.7% 47.8% 38.8% 37.8%
366 387 330 234 300 123 1740
68 99 41 11 36 38 293
18.6% 25.6% 12.4% 4.7% 12.0% 30.9% 16.8%
205 208 134 83 128 62 820
56.0% 53.7% 40.6% 35.5% 42.7% 50.4% 47.1%
93 80 155 140 136 23 627
25.4% 20.7% 47.0% 59.8% 45.3% 18.7% 36.0%
272 350 340 452 149 324 1887
29 88 35 71 26 39 288
10.7% 25.1% 10.3% 15.7% 17.4% 12.0% 15.3%
92 190 161 246 73 142 904
33.8% 54.3% 47.4% 54.4% 49.0% 43.8% 47.9%
151 72 144 135 50 143 695
55.5% 20.6% 42.4% 29.9% 33.6% 44.1% 36.8%
Benjamin Stoddert Middle
211
68
32.2%
91
43.1%
52
24.6%
Gwynn Park Middle Isaac J Gourdine Middle Oxon Hill Middle Stephen Decatur Middle
112 64 294 51
18 13 71 10
16.1% 20.3% 24.1% 19.6%
54 25 153 24
48.2% 39.1% 52.0% 47.1%
40 26 70 17
35.7% 40.6% 23.8% 33.3%
88
16
18.2%
47
53.4%
25
28.4%
820 196 23.9% Note: SY10 MSA Reading data were available for 5227 students.
394
48.0%
230
28.0%
Thurgood Marshall Middle
Total
•
•
As Table 7 indicates, there is little variance between areas in the overall performance of incoming middle school students on the mathematics portion of the MSA. The largest proportion (78.9%) of students scoring Proficient or Advanced on the math MSA in SY10 plan to attend schools in Area 1. The smallest proportion (62.6%) of incoming students scoring Proficient or higher are slated to attend middle schools in Area 4.
Elementary-to-Middle School Transition Planning Report, SY2011
Page 14
DRAFT—DO NOT CIRCULATE Table 7 – Incoming Middle School Students by SY10 MSA Math Proficiency Level and School All Incoming Students
Basic N
Proficient %
N
%
Advanced N
%
Area 1 Charles Carroll Middle Greenbelt Middle Hyattsville Middle Martin Luther King Jr Middle Nicholas Orem Middle
Total Area 2 Buck Lodge Middle G James Gholson Middle Kenmoor Middle Samuel Ogle Middle Thomas Johnson Middle William Wirt Middle
Total Area 3 Benjamin Tasker Middle Drew-Freeman Middle Ernest Everett Just Middle James Madison Middle Kettering Middle Walker Mill Middle
Total Area 4 Benjamin Stoddert Middle Gwynn Park Middle Isaac J Gourdine Middle Oxon Hill Middle Stephen Decatur Middle Thurgood Marshall Middle
Total
124 75 311 204 63 777
30 32 58 36 7 163
24.2% 42.7% 18.6% 17.6% 11.1% 21.0%
74 43 176 128 46 467
59.7% 57.3% 56.6% 62.7% 73.0% 60.1%
20 0 77 40 10 147
16.1% 0.0% 24.8% 19.6% 15.9% 18.9%
364 387 329 232 300 124 1736
78 132 47 27 68 45 397
21.4% 34.1% 14.3% 11.6% 22.7% 36.3% 22.9%
202 203 137 125 189 71 927
55.5% 52.5% 41.6% 53.9% 63.0% 57.3% 53.4%
84 52 145 80 43 8 412
23.1% 13.4% 44.1% 34.5% 14.3% 6.5% 23.7%
271 349 335 456 148 323 1882
54 125 64 123 42 53 461
19.9% 35.8% 19.1% 27.0% 28.4% 16.4% 24.5%
166 186 167 263 96 185 1063
61.3% 53.3% 49.9% 57.7% 64.9% 57.3% 56.5%
51 38 104 70 10 85 358
18.8% 10.9% 31.0% 15.4% 6.8% 26.3% 19.0%
211 113 65 294 52 88 823
100 36 28 91 26 27 308
47.4% 31.9% 43.1% 31.0% 50.0% 30.7% 37.4%
105 71 34 166 24 42 442
49.8% 62.8% 52.3% 56.5% 46.2% 47.7% 53.7%
6 6 3 37 2 19 73
2.8% 5.3% 4.6% 12.6% 3.8% 21.6% 8.9%
Elementary-to-Middle School Transition Planning Report, SY2011
Page 15
DRAFT—DO NOT CIRCULATE Summary An analysis of the SY10 MSA data revealed differences in the performance of incoming middle school students by gender, grade, area, and school. Overall, most incoming middle school students scored in the Proficient or Advanced on the MSA in SY10, with less than one-fifth (17.2%) and just over one-quarter (25.5%) of students scoring within the Basic range in reading and math, respectively. In terms of gender, girls outperformed boys on both MSA Reading and Math. Additional findings are as follows: •
•
•
•
In addition to differences in gender, MSA performance in SY10 varied by grade. Incoming Grade 6 students outperformed entering Grade 7 students on the reading portion of the MSA, while incoming Grade 7 students performed better than Grade 6 students on MSA math. Performance on the MSA was equivalent across three of four areas, but incoming students in Area 4 did not fare as well as their counterparts. A larger proportion of these students scored in the Basic range, and fewer students scored in the Advanced range, as compared to the other three areas. In terms of variation in performance across schools, Gwynn Park, Charles Carroll, and Thomas Johnson are to receive the largest proportions of students scoring proficient or better on the reading portion of the MSA. The lowest proportions of students scoring Proficient or better on the reading portion of the MSA are slated to attend William Wirt, G. James Gholson, Oxon Hill, and Drew-Freeman (see Appendix D for rankings of all schools) The math portion of MSA math varied by school as well. The schools with the largest proportions of incoming students who scored in the Proficient or Advanced range will attend: Nicholas Orem, Samuel Ogle, and Kenmoor. The lowest percentages of students scoring in the Proficient range or better are to attend Stephen Decatur, Benjamin Stoddert, Isaac Gourdine, and Greenbelt (see Appendix E for rankings of all schools).
Elementary-to-Middle School Transition Planning Report, SY2011
Page 16
DRAFT—DO NOT CIRCULATE What are the Behavioral Attributes of Incoming Middle School Students? A key ingredient to academic success is consistent school attendance (e.g., Roby, 2004). In this section, we present information for incoming middle school students who were frequently absent (i.e., absent from school for 10% to 20% of the days they were attached during SY10), and those that were habitually truant (i.e., absent for more than 20% of the days they were attached to PGCPS during SY10)1. This section also describes suspensions for incoming middle school students, as removal from school for behavioral reasons also poses challenges for students to succeed in school. In particular, we examine performance on the reading and math MSA for students who were frequently absent, habitually truant, and suspended during SY10. Frequent Absences and Habitual Truancy • Although the majority of incoming students attended school on a regular basis in SY10, the number and percentage of incoming students’ attendance varied by area. • Schools in Area 1 had the lowest percentage of incoming students who were frequently absent and habitually truant in SY10 (7.3% and 0.7%, respectively), while Area 4 had the highest (13.6% and 2.6%, respectively) percentage of students in these categories (see Table 8). • The proportion of students who were frequently absent or habitually truant in SY10 varied within area by school as well. For example, in Area 1, nearly onequarter (24.1%) students scheduled to attend Greenbelt Middle School in SY11 were frequently absent or habitually truant, as compared to Nicholas Orem, where only 1.4% of prospective students missed at least 10% of school days in SY10 (see Table 8). The variation within area is smallest in Area 4, where Stephen Decatur is expected to receive the smallest proportion of incoming students (7.3%), and Isaac J. Gourdine can expect the largest percentage of students who were either frequently absent or habitually truant in SY10.
1
The definition for “habitually truant” used here is based on the criterion set forth by the Maryland State Department of Education (MSDE).
Elementary-to-Middle School Transition Planning Report, SY2011
Page 17
DRAFT—DO NOT CIRCULATE Table 8 – Incoming Middle School Student Absences by Area and School, SY10 All Incoming Students
Habitually truant-Absent 20% or more of Days Attached
Frequently Absent-Absent 10% - 19% of Days Attached
Area 1 Charles Carroll Middle Greenbelt Middle Hyattsville Middle Martin Luther King Jr Middle Nicholas Orem Middle
Total Area 2 Buck Lodge Middle G James Gholson Middle Kenmoor Middle Samuel Ogle Middle Thomas Johnson Middle William Wirt Middle
Total Area 3 Benjamin Tasker Middle Drew-Freeman Middle Ernest Everett Just Middle James Madison Middle Kettering Middle Walker Mill Middle
Total Area 4 Benjamin Stoddert Middle Gwynn Park Middle Isaac J Gourdine Middle Oxon Hill Middle Stephen Decatur Middle Thurgood Marshall Middle
Total
133 87 319 211 72 822
0 4 2 0 0 6
0.0% 4.6% 0.6% 0.0% 0.0% 0.7%
8 17 25 9 1 60
6.0% 19.5% 7.8% 4.3% 1.4% 7.3%
394 401 339 237 308 133 1812
5 14 9 0 1 1 30
1.3% 3.5% 2.7% 0.0% 0.3% 0.8% 1.7%
28 60 26 14 23 8 159
7.1% 15.0% 7.7% 5.9% 7.5% 6.0% 8.8%
275 358 342 458 153 332 1918
3 21 1 6 0 4 35
1.1% 5.9% 0.3% 1.3% 0.0% 1.2% 1.8%
20 60 21 32 11 40 184
7.3% 16.8% 6.1% 7.0% 7.2% 12.0% 9.6%
215 113 68 319 55 89 859
10 1 0 9 1 1 22
4.7% 0.9% 0.0% 2.8% 1.8% 1.1% 2.6%
29 14 13 48 4 9 117
13.5% 12.4% 19.1% 15.0% 7.3% 10.1% 13.6%
Suspensions • The number and percent of students suspended during SY10 are displayed in Table 9. It is important to note that most students were never suspended during the year. • However, larger proportions of incoming students in Areas 3 and 4 were suspended in SY10 (6.2% and 7.1%, respectively), as compared to Areas 1 and 2 (2.4% and 5.4%, respectively).
Elementary-to-Middle School Transition Planning Report, SY2011
Page 18
DRAFT—DO NOT CIRCULATE Table 9—Incoming Middle School Students Ever Suspended in SY10 by School and Area All Incoming Students
Ever Suspended in SY10 % N
Area 1 Charles Carroll Middle Greenbelt Middle Hyattsville Middle Martin Luther King Jr Middle Nicholas Orem Middle
Total Area 2 Buck Lodge Middle G James Gholson Middle Kenmoor Middle Samuel Ogle Middle Thomas Johnson Middle William Wirt Middle
Total Area 3 Benjamin Tasker Middle Drew-Freeman Middle Ernest Everett Just Middle James Madison Middle Kettering Middle Walker Mill Middle
Total Area 4 Benjamin Stoddert Middle Gwynn Park Middle Isaac J Gourdine Middle Oxon Hill Middle Stephen Decatur Middle Thurgood Marshall Middle
Total
133 87 320 211 72 823
0 4 4 10 2 20
0.0% 4.6% 1.3% 4.7% 2.8% 2.4%
394 401 339 237 312 133 1816
20 41 22 5 8 2 98
5.1% 10.2% 6.5% 2.1% 2.6% 1.5% 5.4%
276 360 349 458 154 332 1929
5 41 24 26 5 19 120
1.8% 11.4% 6.9% 5.7% 3.2% 5.7% 6.2%
215 113 68 319 55 89 859
19 7 1 26 1 7 61
8.8% 6.2% 1.5% 8.2% 1.8% 7.9% 7.1%
Elementary-to-Middle School Transition Planning Report, SY2011
Page 19
DRAFT—DO NOT CIRCULATE Summary The data presented in this section suggest that incoming student behaviors, such as attendance and suspensions, vary by both area and school. It is important to note that most students attended school on a regular basis, and were not suspended in SY10. However, for those students who had difficulty in this area, a summary of the findings is included below: Frequent Absences and Habitual Truancy • Nearly nine in ten students attended school on a regular basis in SY10. Of those who did not attend regularly, approximately eight percent of students were frequently absent, and nearly two percent were deemed habitually truant. • The proportions of students who were either frequently absent or habitually truant varied by both area and school. • The schools expecting the largest proportions of incoming students who were frequently absent or habitually truant in SY10 are: Greenbelt, Drew-Freeman, Isaac Gourdine, and G. James Gholson. • Samuel Ogle, Martin Luther King, and Nicholas Orem are expecting incoming students with the smallest proportion of frequent absences and habitual truancy (see Appendix F for rankings of all middle schools). Suspensions • Again, it is important to note that more than 90 percent of incoming middle school students were never suspended during SY10. Of those students who were suspended, a significant portion of them experienced this punishment only once. • It is also important to note that the proportion of incoming students who were suspended during SY10 differs by area and by school. For example, more than 7% of Area 4 students were suspended last year. The second largest percentage of students who were suspended in SY10 was in Area 3. • The schools with the largest proportions of incoming middle school students that were suspended in SY10 are: Drew-Freeman, G. James Gholson, and Benjamin Stoddert, respectively (see Appendix G for rankings of all schools).
Elementary-to-Middle School Transition Planning Report, SY2011
Page 20
DRAFT—DO NOT CIRCULATE Conclusions The purpose of this report is to provide information that may be used by principals and Assistant Superintendents to make data-driven decisions around the allocation of available student resources.
We sought to capture specific areas of challenge and
strength among the students entering PGCPS middle schools in SY11, to supplement existing information about these students as a whole, and to ensure that school personnel are better equipped to address their needs. The descriptive information presented in this report revealed that there are group differences in terms of demographics, academic performance, and attendance patterns at the school and area levels. As a result, some areas and the schools within them may require additional resources in specific areas to alleviate some of the challenges they potentially face in terms of meeting the needs of incoming middle school students. Conversely, some schools and areas may require additional planning to provide challenging and engaging educational experiences for their students who are performing at or above the standards for their respective grade level. Specifically, each area has a different make up in terms of race, ethnicity and schoolbased support participation. These differences may have implications for the extent to which each area and the schools within them utilize resources to address the needs of their students and surrounding communities.
For example, schools with large
concentrations of students receiving ESOL services may need additional staff (either paid or volunteer) to assist students and parents with understanding the services in which their children participate. Some of these parents might have difficulties with English, and would benefit from the support of personnel who can effectively bridge any mutual gaps in language comprehension. Additionally, areas and schools with large concentrations of students receiving SPED services may require more personnel qualified to prepare specialized plans (e.g., Individualized Education Plans), and should be adept at communicating with parents and other family members around the implications of these plans for their child’s success in school. In either instance, schools might also require more personnel qualified to address the needs of these students, in addition to supports for students and families. In terms of academic achievement, SY10 MSA performance varied both by gender and grade. Girls consistently outperformed boys in both reading and math. Incoming Elementary-to-Middle School Transition Planning Report, SY2011
Page 21
DRAFT—DO NOT CIRCULATE Grade 6 students fared better than Grade 7 students on the reading MSA, while Grade 7 students outperformed Grade 6 students on the MSA math. Therefore, middle schools with Grade 6 students might consider providing additional supports for their incoming students in math, while middle schools that begin with Grade 7 students may find some benefit to providing additional emphasis on reading with their incoming students. The majority of incoming middle school students attended school on a regular basis and were never suspended in SY10. However, the extent to which students were absent and/or were suspended at least once differed by area and prospective school. Although most students are meeting PGCPS’ expectations in terms of academic performance, attendance and behavior, an examination of the findings of relevant data indicated that some schools are in a position to receive disproportionate numbers of students with increased levels of need across all areas of focus. In an effort to identify schools who might encounter larger proportions of students with elevated levels of need, and schools who will encounter students with fewer challenges, we rank-ordered all middle schools based on the percentage of students in each of the following domains: ESOL, FARMS, and SPED participation; MSA Reading and Math proficiency; frequent absence and habitual truancy; and whether or not the student was suspended in SY10. These rankings were compiled across domain to determine which schools were in position to receive larger proportions of students experiencing challenges, and those who stood to obtain incoming students with relatively fewer difficulties. Based on these rankings, it was determined that the five schools receiving students with elevated levels of challenge are: G. James Gholson, Drew-Freeman, Oxon Hill, William Wirt, and Greenbelt. In comparison to all other PGCPS middle schools, these schools tend to have higher concentrations of incoming students participating in ESOL, FARMS and/or SPED; lower proportions of students scoring Proficient or Advanced on the SY10 MSA; and/or higher proportions of students who were frequently absent, habitually truant, and suspended in the previous school year. The five schools expecting incoming students with fewer challenges in this regard are: Benjamin Tasker, Samuel Ogle, James Madison, Thomas Johnson, and Charles Carroll. It is important to note that these schools are not without their challenges – they simply have fewer students who are struggling in these areas as compared to their
Elementary-to-Middle School Transition Planning Report, SY2011
Page 22
DRAFT—DO NOT CIRCULATE counterparts.
Instead, these schools may need to place additional emphasis on
maintaining, and perhaps improving upon, the level of performance demonstrated by their incoming students through relatively better prior academic achievement and regular school attendance. The remaining fourteen schools stand to receive students of varying challenges and strengths. As a result, these schools possess similar challenges and strengths as the aforementioned schools, but do not consistently fall on the higher or lower end of the ranking pool. For example, Martin Luther King, Jr. is in the center of the ranking pool, and stands among the schools with the highest levels of student attendance, relatively lower proportions of incoming students participating in FARMS, and high percentages of students who scored in the Proficient or Advance ranges of the math portion of the MSA. However, this school also stands to receive a group of students with high concentrations of SPED participation, moderate percentages of students who received ESOL services in SY10, and low proportions of students who scored Proficient or Advanced on MSA Reading. Therefore, incoming students at Martin Luther King, Jr. are entering with a mixture of strengths and challenges that will require specialized approaches to address. Taken together, these findings add to existing evidence about students attending schools that continue to face challenges in terms of academic achievement. However, these results also provide evidence that the majority of students are entering middle school with an academic and behavioral foundation that has the potential to foster academic success. Building upon this foundation, while establishing firmer footing for struggling students and schools, will likely improve students’ preparation for high school, and increase the number of students prepared for college and the workforce.
Elementary-to-Middle School Transition Planning Report, SY2011
Page 23
DRAFT—DO NOT CIRCULATE References Entwisle, D.R., & Alexander, K.L. (1992). Summer setback: Race, poverty, school composition, and mathematics achievement in the first two years of school. American Sociological Review, 57, 72-84. Garavalia, L. & Gredler M. (2002). Prior achievement, aptitude, and use of learning strategies as predictors of college student achievement. College Student Journal, 22, 1-8. Lee, J. (2006). Tracking achievement gaps and assessing the impact of NCLB on the gaps: An in-depth look into national and state reading and math outcome trends. Cambridge, MA: Harvard University Civil Rights Project. Roby, D. E. (2004). Research on school attendance and student achievement: A study of Ohio schools. Education Research Quarterly, 28, 1, 3-14.
Elementary-to-Middle School Transition Planning Report, SY2011
Page 24
DRAFT—DO NOT CIRCULATE Appendix A – Middle School Rankings by Percent of ESOL Participation, SY10
Number
%
% Participation Rank
Area 1 Charles Carroll Middle Greenbelt Middle Hyattsville Middle Martin Luther King Jr. Middle Nicholas Orem Middle
48 23 37 19 31
36.1% 26.4% 11.6% 9.0% 43.1%
3 4 8 9 2
100 25 10 14 38 60
25.4% 6.2% 2.9% 5.9% 12.2% 45.1%
5 11 15 12 7 1
3 7 7 3 9 5
1.1% 1.9% 2.0% 0.7% 5.8% 1.5%
21 18 17 22 13 20
0 3 9 25 1 4
0.0% 2.7% 13.2% 7.8% 1.8% 4.5%
23 16 6 10 14 9
Area 2 Buck Lodge Middle G James Gholson Middle Kenmoor Middle Samuel Ogle Middle Thomas Johnson Middle William Wirt Middle
Area 3 Benjamin Tasker Middle Drew-Freeman Middle Ernest Everett Just Middle James Madison Middle Kettering Middle Walker Mill Middle
Area 4 Benjamin Stoddert Middle Gwynn Park Middle Isaac J Gourdine Middle Oxon Hill Middle Stephen Decatur Middle Thurgood Marshall Middle
Elementary-to-Middle School Transition Planning Report, SY2011
Page 25
DRAFT—DO NOT CIRCULATE Appendix B – Middle School Rankings by Percent Participation in FARMS, SY10
Number Area 1 Charles Carroll Middle Greenbelt Middle Hyattsville Middle Martin Luther King Jr. Middle Nicholas Orem Middle Area 2
%
% Participation Rank
110 69 220 96 61
83% 79% 69% 45% 85%
3 5 7 17 2
Buck Lodge Middle G James Gholson Middle Kenmoor Middle Samuel Ogle Middle Thomas Johnson Middle William Wirt Middle Area 3
318 295 215 65 191 121
81% 74% 63% 27% 61% 91%
4 6 11 22 12 1
Benjamin Tasker Middle Drew-Freeman Middle Ernest Everett Just Middle James Madison Middle Kettering Middle Walker Mill Middle Area 4
75 243 136 174 63 177
27% 68% 39% 38% 41% 53%
23 9 20 21 19 15
Benjamin Stoddert Middle Gwynn Park Middle Isaac J Gourdine Middle Oxon Hill Middle Stephen Decatur Middle Thurgood Marshall Middle
147 48 39 203 29 53
68% 42% 57% 64% 53% 60%
8 18 14 10 16 13
Elementary-to-Middle School Transition Planning Report, SY2011
Page 26
DRAFT—DO NOT CIRCULATE Appendix C – Middle School Rankings by Percent Participation in SPED, SY10
Number
%
% Participation Rank
Area 1 Charles Carroll Middle Greenbelt Middle Hyattsville Middle Martin Luther King Jr. Middle Nicholas Orem Middle
8 8 34 30 7
6.1% 10.5% 10.7% 14.3% 10.1%
22 14 13 5 16
45 63 44 23 21 22
11.9% 16.0% 13.1% 9.8% 6.9% 16.5%
10 2 8 18 21 1
22 53 47 46 19 38
8.1% 14.9% 13.8% 10.1% 12.7% 11.6%
19 4 6 17 9 11
24 4 7 45 4 12
11.2% 3.5% 10.3% 15.0% 7.7% 13.5%
12 23 15 3 20
Area 2 Buck Lodge Middle G James Gholson Middle Kenmoor Middle Samuel Ogle Middle Thomas Johnson Middle William Wirt Middle
Area 3 Benjamin Tasker Middle Drew-Freeman Middle Ernest Everett Just Middle James Madison Middle Kettering Middle Walker Mill Middle
Area 4 Benjamin Stoddert Middle Gwynn Park Middle Isaac J Gourdine Middle Oxon Hill Middle Stephen Decatur Middle Thurgood Marshall Middle
Elementary-to-Middle School Transition Planning Report, SY2011
7
Page 27
DRAFT—DO NOT CIRCULATE Appendix D—Middle School Rankings by Percent Proficient and Advanced in MSA Reading, SY10
All Incoming Students
% Proficient Rank
Proficient N %
Advanced N %
126 76 310 201 67
60 52 132 86 34
48% 68% 43% 43% 51%
41 15 117 96 26
33% 20% 38% 48% 39%
17 6 16 2 4
366 387 330 234 300 123
205 208 134 83 128 62
56% 54% 41% 36% 43% 50%
93 80 155 140 136 23
25% 21% 47% 60% 45% 19%
14 21 9 1 7 22
272 350 340 452 149 324
92 190 161 246 73 142
34% 54% 47% 54% 49% 44%
151 72 144 135 50 143
56% 21% 42% 30% 34% 44%
5 20 3 10 12 8
211 112 64 294 51 88
91 54 25 153 24 47
43% 48% 39% 52% 47% 53%
52 40 26 70 17 25
25% 36% 41% 24% 33% 28%
23 11 18 19 15 13
Area 1 Charles Carroll Middle Greenbelt Middle Hyattsville Middle Martin Luther King Jr Middle Nicholas Orem Middle
Area 2 Buck Lodge Middle G James Gholson Middle Kenmoor Middle Samuel Ogle Middle Thomas Johnson Middle William Wirt Middle
Area 3 Benjamin Tasker Middle Drew-Freeman Middle Ernest Everett Just Middle James Madison Middle Kettering Middle Walker Mill Middle
Area 4 Benjamin Stoddert Middle Gwynn Park Middle Isaac J Gourdine Middle Oxon Hill Middle Stephen Decatur Middle Thurgood Marshall Middle
Elementary-to-Middle School Transition Planning Report, SY2011
Page 28
DRAFT—DO NOT CIRCULATE Appendix E – Middle School Rankings by Percent Proficient and Advanced in MSA Math, SY10 All Incoming Students
Proficient N %
Advanced N %
% ProficientRank
Area 1 Charles Carroll Middle Greenbelt Middle Hyattsville Middle Martin Luther King Jr Middle Nicholas Orem Middle
124 75 311 204 63
74 43 176 128 46
60% 57% 57% 63% 73%
20 0 77 40 10
16% 0% 25% 20% 16%
11 20 6 5 1
364 387 329 232 300 124
202 203 137 125 189 71
55% 52% 42% 54% 63% 57%
84 52 145 80 43 8
23% 13% 44% 34% 14% 6%
9 17 3 2 10 19
271 349 335 456 148 323
166 186 167 263 96 185
61% 53% 50% 58% 65% 57%
51 38 104 70 10 85
19% 11% 31% 15% 7% 26%
8 18 7 12 13 4
211 113 65 294 52 88
105 71 34 166 24 42
50% 63% 52% 56% 46% 48%
6 6 3 37 2 19
3% 5% 5% 13% 4% 22%
22 16 21 15 23 14
Area 2 Buck Lodge Middle G James Gholson Middle Kenmoor Middle Samuel Ogle Middle Thomas Johnson Middle William Wirt Middle
Area 3 Benjamin Tasker Middle Drew-Freeman Middle Ernest Everett Just Middle James Madison Middle Kettering Middle Walker Mill Middle
Area 4 Benjamin Stoddert Middle Gwynn Park Middle Isaac J Gourdine Middle Oxon Hill Middle Stephen Decatur Middle Thurgood Marshall Middle
Elementary-to-Middle School Transition Planning Report, SY2011
Page 29
DRAFT—DO NOT CIRCULATE Appendix F –Middle School Rankings by Percent Frequently Absent and Habitually Truant, SY10
All Incoming Students
Habitually Truant N
%
Frequently Absent N
%
% Frequently Absent/ Habitually Truant Rank
Area 1 Charles Carroll Middle Greenbelt Middle Hyattsville Middle Martin Luther King Jr Middle Nicholas Orem Middle
133 87 319 211 72
0 4 2 0 0
0.0% 4.6% 0.6% 0.0% 0.0%
8 17 25 9 1
6.0% 19.5% 7.8% 4.3% 1.4%
20 1 12 22 23
394 401 339 237 308 133
5 14 9 0 1 1
1.3% 3.5% 2.7% 0.0% 0.3% 0.8%
28 60 26 14 23 8
7.1% 15.0% 7.7% 5.9% 7.5% 6.0%
13 4 10 21 16 18
275 358 342 458 153 332
3 21 1 6 0 4
1.1% 5.9% 0.3% 1.3% 0.0% 1.2%
20 60 21 32 11 40
7.3% 16.8% 6.1% 7.0% 7.2% 12.0%
14 2 19 15 17 8
215 113 68 319 55 89
10 1 0 9 1 1
4.7% 0.9% 0.0% 2.8% 1.8% 1.1%
29 14 13 48 4 9
13.5% 12.4% 19.1% 15.0% 7.3% 10.1%
5 7 3 6 11 9
Area 2 Buck Lodge Middle G James Gholson Middle Kenmoor Middle Samuel Ogle Middle Thomas Johnson Middle William Wirt Middle
Area 3 Benjamin Tasker Middle Drew-Freeman Middle Ernest Everett Just Middle James Madison Middle Kettering Middle Walker Mill Middle
Area 4 Benjamin Stoddert Middle Gwynn Park Middle Isaac J Gourdine Middle Oxon Hill Middle Stephen Decatur Middle Thurgood Marshall Middle
Elementary-to-Middle School Transition Planning Report, SY2011
Page 30
DRAFT—DO NOT CIRCULATE Appendix G – Middle School Rankings by Percent Suspended, SY10
All Incoming Students
Suspended in SY10 %
N
% Suspended Rank
Area 1 Charles Carroll Middle Greenbelt Middle Hyattsville Middle Martin Luther King Jr Middle Nicholas Orem Middle
133 87 320 211 72
0 4 4 10 2
0.0% 4.6% 1.3% 4.7% 2.8%
23 13 22 12 15
394 401 339 237 312 133
20 41 22 5 8 2
5.1% 10.2% 6.5% 2.1% 2.6% 1.5%
11 2 7 17 16 20
276 360 349 458 154 332
5 41 24 26 5 19
1.8% 11.4% 6.9% 5.7% 3.2% 5.7%
19 1 6 10 14 9
215 113 68 319 55 89
19 7 1 26 1 7
8.8% 6.2% 1.5% 8.2% 1.8% 7.9%
3 8 21 4 18 5
Area 2 Buck Lodge Middle G James Gholson Middle Kenmoor Middle Samuel Ogle Middle Thomas Johnson Middle William Wirt Middle
Area 3 Benjamin Tasker Middle Drew-Freeman Middle Ernest Everett Just Middle James Madison Middle Kettering Middle Walker Mill Middle
Area 4 Benjamin Stoddert Middle Gwynn Park Middle Isaac J Gourdine Middle Oxon Hill Middle Stephen Decatur Middle Thurgood Marshall Middle
Elementary-to-Middle School Transition Planning Report, SY2011
Page 31