Name
School ____________________________________ Date
19.2 - Electric Fields and Potential Purpose
To develop an understanding of the relationship between equipotential lines and electric field lines.
To investigate equipotential lines produced by three different configurations of charge.
To discover the cause of electric shielding.
Equipment Electric Field Mapping Apparatus
PENCIL
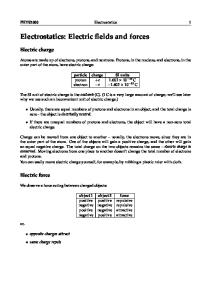
Note: Your teacher will assign you a power supply voltage, V ps, which you’ll use beginning in part I of the procedure. We’ll use the Electric Field Mapping Apparatus in this lab activity. You can get quick access to help by rolling your mouse over most objects on the screen. Complete instructions are provided in Apparatus Exploration.
Figure 1 – The Electric Field Mapping Apparatus
VPL_Lab_ah- Interference and Diffraction of Light
1
Rev 1/12/15
Theory Everyone has experienced the fun of rubbing a balloon against a sweater and then seeing it attach itself to nearly anything nearby. And this is sometimes accompanied by a few sparks. The balloon in its uncharged state is made up of equal numbers of negatively charged electrons and positively charged protons. But when it’s rubbed against the sweater, it will attract some electrons away from the sweater. When the charged balloon is brought near your body you can feel its influence when it’s still several inches away. When that happens it’s either time to run or, if you’re brave, to excitedly ease a finger toward the balloon and feel your hair stand on end, then get zapped, and run for it. Or is it just me? (Nope. Please Google “static charge images.”) You’re hopefully aware that when a storm approaches it may be time to run for shelter, but not across an empty field, and not to the shelter of a tree which is shelter from the rain but a dangerous place to be when lightning is imminent. We’ll learn what makes a good shelter in this lab. Coulomb’s Law tells us that a charge in one location can exert a force on another charge some distance away. And that will pretty well explain the effect of the charged balloon or cloud. But as your finger nears the balloon it does feel like there’s “something in the air” around the balloon. How does the balloon over there act over here? Electric Fields The concept of an electric field was hypothesized in the 19th century as a way of describing this action at a distance. An electric field is said to exist in the space around any charge and the force on a second charge is exerted by the field at its location. The electric field, E, is a vector quantity whose magnitude and direction at any point are defined by considering a small positive test charge, qo, at that point. The test charge must be small enough so that it would not disturb the charges producing the field. The magnitude of the field is equal to the force per charge on the test charge, E = F/qo.
(1)
Thus the electric field has units of Newtons per Coulomb. The direction of the field is in the direction of the force on the positive test charge, qo. The field would exert a force in the opposite direction on a negative charge at that point. So a negative charge would work just as well for our test charge, but we always use a positive charge so that the direction is always immediately clear.
We could visualize the field near a charged balloon by drawing many force vectors around it showing the force acting on a test charge moved from point to point. The length of these force vectors would decrease with distance according to Coulomb’s Law. If instead the individual vectors are replaced by continuous lines always tangent to the force vectors, it can be seen that the density of the lines serves the same function as the length of the force vectors. The lines actually get further apart for the same reason that the force vectors get shorter – the geometry of the 3D space the forces act in. These continuous lines are called “lines of force” or “electric field lines.” In this lab we will observe electric fields in two dimensions.
VPL_Lab_ah- Interference and Diffraction of Light
2
Rev 1/12/15
A few observations about the behavior of electric fields.
Electric field lines start on positive charges and end on negative charges. Or they may do only one of these two. For example the field around a lone positive charge points away from it and we may not be concerned with where it might end. See Figure 2, and the corresponding field for a negative charge in Figure 3.
Figure 2 – Field due to a Positive Point Charge
Figure 3 – Field due to a Negative Point Charge
When multiple charges are involved, the total electric field at each point is equal to the vector sum of the individual fields contributed by each charge. For example, suppose the charges in Figures 2 and 3 were moved close together. Their overlapping fields would add vectorially at every point producing the resultant field shown in Figure 4.
Figure 4 – Field due to a Dipole
The net charge on a conductor will redistribute itself on its surface until it reaches static equilibrium. That is, the charges will move about until each has zero net force acting on it. Once each charge is in equilibrium, there would be no field tangent to the surface of the conductor. Thus all electric field lines would be perpendicular to the surface of the conductor in this static case. (Any other direction would result in further motion of the charges.) (In this lab there will be a very small current flowing through the apparatus to allow us to measure the fields, but this steady current will be small enough that the charges will remain distributed as they would be with truly static charges.)
Since the force on a test charge can be in only one direction, we know that field lines can never cross.
Work, Electrical Potential Energy (EPE), and Electric Potential, V It’s also useful to attribute the work done by electrical forces to electric fields. In Figure 5 two infinite parallel plates produce a uniform electric field, shown in green. This field will do positive work on a positive charge moving from A to B. Thus the test charge will have a lower amount of electrical potential energy at B than at A and the energy per charge, V, will be less at B than at A. The electrical potential difference, ΔV, between two A and B is given by 𝑉𝐵 − 𝑉𝐴 =
−𝑊𝐴𝐵
(1)
𝑞𝑜
where WAB is the work done on the positive test charge by the field in moving the test charge from A to B. Note the signs involved. The electrical potential drops from A to B, so 𝑉𝐵 − 𝑉𝐴 would be negative. But positive work, 𝑊𝐴𝐵 , is done since the positive test charge moves in the direction of electric force. Thus the negative sign is required to make both sides of the equation negative.
VPL_Lab_ah- Interference and Diffraction of Light
3
Rev 1/12/15
Since there is no component of the electric field along line 1, no work would be done by the field on a charge moving between A and C. Thus the electrical potential energy of a charge would be the same at any point along this line. And the difference in electrical potential between these points would be zero. This line and the other three lines parallel to it connect points of equal electrical potential and are called equipotential lines.
Figure 5 – Infinite Parallel Plates
Equipotential lines are always perpendicular to electric field lines.
In Figure 5, the electric field between the infinite parallel plates is constant, so the work done by the field to move a charge from equipotential line 1 to line 2 is the same as the work to move the charge between line 2 and 3 or 3 and 4 or any two other equally spaced lines since the field and thus the force is constant. Thus we can see that the potential difference from line 1 to line 2 is the same as that between line 2 and 3, etc. Also, a charge moving from any point on line 1 to any point on line 2 would drop in potential by the same amount regardless of the starting and ending points. From Equation 1 we can then see that the work done by the field would be the same in each case. This also means that the change in kinetic energy would be the same regardless of the starting ending points on the two lines. This behavior is typical to all conservative forces.
For a constant field, equipotential lines representing uniform increments of potential will be uniformly spaced.
Figure 6 shows the radial field of a positive point or spherical charge. In order for the equipotential lines to always be perpendicular to the field lines, they must be circular. In three dimensions they would be spherical shells.
Figure 6 – Field around a point or spherical charge
For the field produced by a point charge, equipotential lines representing uniform increments of potential will be increasingly farther apart with increasing distance from the charge according to the inverse square law.
We won’t pursue a mathematical description of these shapes in this lab. We’ll instead discover and investigate their shapes experimentally. There are two different ways of mapping the fields and equipotential lines produced by charged objects.
We could devise a way to measure the direction of the force on a small test charge at various points, and then draw a series of smooth curves tangent to the force vectors at each point. The vagueness of the term smooth curve makes this a difficult task.
We could devise a way to measure the electric potential at many points in the field. If we found many points at the same potential we could connect these points with a smooth curve passing through each point at that potential and then repeat for another potential, etc. Electric field lines could then be created by drawing smooth lines passing at right angles through the equipotential lines. The direction of the electric field would always be from high to low potential. Our apparatus uses this technique.
VPL_Lab_ah- Interference and Diffraction of Light
4
Rev 1/12/15
Introduction to the Apparatus
Figure 7 – Field Mapping Tools Figure 7 the shows the tools you’ll be working with in the space between two parallel plates. Let’s first look at the wiring of the circuit. The DC power supply is set at 40 volts. The positive terminal, which is at 40 volts is connected to the right plate. One wire from the negative terminal, which is at 0 volts, is connected to the left plate. When the connections are made, electrons at the negative terminal of the power supply travel into the black wire and down to the left plate giving it a negative charge. The larger the voltage of the power supply, the more electrons will flow. At the same time electrons leave the right plate and travel to the positive terminal of the power supply. This sets up a potential difference of 40 volts between the plates as discussed earlier. If the plates were in a vacuum, the system would remain in this condition. But the plates are attached to a weakly conductive sheet of material which conducts a flow of electrons from the negative left plate to the positive right plate. By convention, we would say that a (conventional) current flows in the opposite direction. If the sheet was an excellent conductor we wouldn’t have the buildup of charge on the two plates to produce our fields. A third, short wire connects the negative, zero volt terminal of the power supply to the negative terminal of the voltmeter. This keeps that terminal of the voltmeter at 0 volts. The left, red wire of the voltmeter has a probe on the free end that can be dragged to any part of the conducting sheet or either plate. When this is done, the voltmeter displays the potential difference between the zero volt side of the meter and the point touched. We’ll say that the voltmeter’s reading at that point is the potential or voltage at the point. It’s really the potential difference between that point and the zero voltage side of the meter but, the potential is defined as the potential difference between a point and another point defined as zero potential. In Figure 7 the probe is shown touching the left plate which is kept at 0 volts since it’s attached to the negative side of the power supply. (For your convenience, a small voltmeter display follows the probe wherever it goes.) Further down the screen you see the probe when it was just to the right of the negative plate. When it was placed there the voltmeter read 10.02 V. The probe readings are shown at two other points along a line between the centers of the plates. At each of those three points you also see two circles connected by a blue line. There’s a third smaller circle too but it’s covered up by the probe. This is a segment of an equipotential line. You’ll learn how to work with them shortly. If you move the probe along one of these lines you’d find that the voltage reading stays almost constant, hence the name equipotential line.
VPL_Lab_ah- Interference and Diffraction of Light
5
Figure 8 – Equipotential Line Segments
Rev 1/12/15
As discussed earlier, electric field lines are always perpendicular to equipotential lines. The horizontal, orange line is an equipotential line. Note the arrow indicating the direction of the electric field – away from the positive plate and toward the negative plate – which is the direction of the force on a positive test charge.
Figure 9 – Electric Field Lines
These voltmeter readings are measures of the change in potential as our weak current flows through the conductive sheet. Placing the probe at any point will provide the potential at that point relative to the negative plate. As a result we can produce a detailed map of the electrical potential between our plates. Here are the steps you’ll follow.
You’ll first create a set of equipotential lines connecting points of approximately equal potential.
Then you’ll use these lines to guide you in producing a map of the electric field. Your electric field lines will either be straight or smoothly curve so as to cross equipotential lines at right angles as shown in Figure 10.
Explore the Apparatus In this exploration you’ll be creating your own version of Figure 10, so refer back to it as needed for help and clarification. 1.
Using the drop down menus at the bottom of the screen select Station #1 and the Dipole.
2.
If the two electrodes are not centered on (x = 6.0 cm) and (x = 22.0 cm), adjust them to those locations. Use the Lock Electrodes check box to lock them in place.
3.
Set the power supply voltage to 24.00 V. Note the course and fine adjustment knobs.
4.
Drag the probe
5.
Drag the probe to the center of the electrode on the right. Record the voltmeter reading
V
6.
What is the potential difference between the two electrodes?
V
to the center of the electrode on the left. Record the voltmeter reading
V
Figure 10 – Voltage Markers and Labels Measuring Potential (Voltage), Setting Voltage Markers, Creating Labels 7.
Drag the probe to the (x = 8.0 cm, y = 10.0 cm) point. Zoom in once for a better view. (Just right click and choose Zoom in. Also note Zoom out and 100 %.) The up, down, left, or right cursor keys are the most efficient way to move the probe around. And Shift + a cursor
VPL_Lab_ah- Interference and Diffraction of Light
6
Rev 1/12/15
key moves the probe one centimeter in the selected direction. The voltmeter should read approximately 6.7 volts. Which way (left or right) should the probe be moved to reach a point where the voltage is approximately 8.0 V? Move it to that point using your cursor keys. It probably won’t be exactly 8.0 V. That’s OK. You’ll always just use the closest value available in all these readings. It’s helpful to think of this motion to the right as “uphill” in voltage. Later you’ll see a very visual representation of that “uphill” motion. 8.
Create a marker at that point. Here’s how. Press “m”. (Think “m” for marker.) Using Shift + left, move the probe a centimeter to the left to get it out of the way. You should see a circular marker where the probe used to be. This just records the position where you took a reading. Now we need to label it.
9.
Put an “8 V” label beside the probe. Here’s how. Right click on the marker. You’ll see the choices “Delete Marker” and “Add Label.” Select “Add Label.” A label that displays “0 V” appears. The labels are a bit quirky to edit. Click in the label and leave your mouse pointer where it is. You can now edit the default label to “8 V”. Use 8 V even if that’s not the exact voltage reading. This number represents the target voltage for a collection of measurements you’ll be taking. So it’s more of an average. Right-click on the little arrow on the left end of the label. You’ll see that you can delete it if you like. Don’t. Left click and drag it to be right next to the marker.
10. We now want to label our two electrodes to record their voltages. Move the probe onto the left electrode to get the voltage reading. (You now see why we have the small voltage display attached to the probe. This lets you work in zoomed mode.) Make a 0 V label (omit the .00 to keep it small) and it put it on top of the left electrode. Do this by rightclicking on the 8-V marker to create a label and then drag it on top of the electrode. There are two reasons for adding these labels – to record your voltage readings and because most of your grade in this lab is from the figures you upload or print out using the Screenshot account of what you found. There will be other things to label later.
camera. So you need them to include a full
Now add a 24 V label to the positive electrode. Hmm. You probably can’t see it. You could zoom back out and then zoom in on this other electrode. But, these Flash labs allow you drag the screen around. Try that. Click in an empty spot on the lab screen and drag to the left. Nice electric field line. Hmm. Not what you wanted. Right click on one of the three “control points” on the electric field line and clear (delete) it. Move your mouse pointer just below the small voltage display attached to the probe. The pointer changes to a hand. Move the pointer around to see that it remains a hand for some distance below and to the left of the voltage display. Now click somewhere within this region and drag to the left to drag the screen. You may sometimes need to move the probe before dragging, but you’ll probably find that dragging is quicker than zooming in and out in most cases. Now label your positive electrode “24 V.” 11. Using the cursor keys to move around, find two more 8-V points – one above the x-axis at about (7.2 cm, 12.2 cm) and one below that one and about an equal distance below the center axis. Everything is very symmetrical with the dipole arrangement. Put markers at each one. You don’t need labels on these new 8-V markers. Your equipotential line will handle that. Creating Equipotential Lines 12. Draw an equipotential line. This will be a curved line passing through each (approximately) 8-V point. In the future you’ll find more equal voltage points, but this is an exploration. Drawing these lines is pretty cool. Click on your top marker and drag and release at the middle marker. A blue line should appear connecting the points. There’s also a dot in the middle. Do the same from the middle point to the bottom one. You’ll need to move your probe so that it’s not covering up the bottom marker. Notice that you just need to release close to the second point. It will snap to the marker. You now have two straight lines but you want to adjust them so that they curve approximately through all the other 8-V points in between. (Hence the name equipotential lines.) The little mini-me voltmeter is attached to the probe so that you can see the voltmeter reading while zoomed in. You can sort of wing it once you get the hang of it, but for now, try this. Move the probe to one of the light green mid-point dots. The voltage will read less than 8.0 V since you’re closer to the zero volt electrode than you need to be. Move the probe approximately perpendicular to the line until you hit about eight
VPL_Lab_ah- Interference and Diffraction of Light
7
Rev 1/12/15
volts. Now, click and drag the green circle to the eight volt point. You’ll see that the center of the marker point attaches to the end of the mouse pointer which is convenient. Do the same for the other line segment. You now have an 8-V equipotential line, or part of one. Check it out by slowly dragging the probe along the line. Your 8-V label could point to any part of this line. By the way, these equipotential lines aren’t exactly arcs of circles. But in this case they’re close. 13. Editing note: You can get rid of any equipotential line segments that you don’t need by right clicking on the center adjustment point and then clicking “Clear this Line.” 14. Create a second equipotential line for 12 V. Make it connect all 12-V points within the boundaries of the grid. You’ll quickly discover that you don’t have to take much data. Label it 12 V. Creating Electric Field Lines 15. Now try an electric field line. These are orange and have arrows on them to indicate the direction of the field. They start on the positive electrode and end on the negative electrode since that’s the direction of the force on a positive test charge. Click and drag a couple of inches at some empty spot on the grid. Nice work! These field lines are adjusted just like the equipotential lines. But note that the end nodes are part of the lines. The equipotential lines that you’ve been making have one central adjustment node and attach to your markers which are not part of the lines. The field lines include the end points. The arrow and these points are all adjustment nodes. Try it. Create a second field line somewhere else. Right-click on one of the three nodes on either of your field lines. Click “Reverse Direction.” That’s provided to help you easily correct mistakes. Click “Reverse Direction (all).” Now clear both field lines to get rid of them. 16. Now to put a field line where it’s needed and adjust it. Consider a positive charge at (20 cm, 10 cm), that is, just to the left of the positive electrode. If released it would head straight for the negative electrode. This motion indicates that the direction of the field is along the y = 10 cm line. So a field line in this region would start on the left side of the positive electrode and end up on the right side of the negative electrode. We’ll start our lines just outside of the electrodes rather than right on them. About a quarter to a third of a centimeter is good. Click just to the left of the positive electrode and drag and release just to the right of the negative electrode. You now have a field line that passes through both equipotential lines at right angles and that’s what they must do. Here’s why. If all points along an equipotential line are at the same potential, then no charge would move along them. The electric field line shows the direction of the electrostatic force on a charge. Since there’s no component of force along an equipotential line, field lines must intersect them at right angles. Also, the surface of each electrode is an equipotential surface, so the ends of the field lines would arrive at right angles if we extended them to the surface of the electrodes. We’ll later discuss the reason why we stop some distance away. 17. Now try another one. Start (just outside of) the negative electrode at about 2 o’clock and go straight horizontally to just outside of the positive electrode at about 10 o’clock. Your field line is headed in the wrong direction so let’s fix that. Right click on one of the nodes or the arrowhead and change the direction. Remember, the field indicates the direction of the force on a positive charge. Now drag the arrowhead upward until the line crosses both equipotentials normally. Notice what happens when you move the arrow from side to side. In this case it needs to be in the middle due to the left-right symmetry of the field. Add a third equipotential line, this time below the x-axis from about 7 o’clock on the positive to 5 o’clock on the negative. 18. Adjust the locations of your 8-V and 12-V labels if they’re behind the field line. They just need to point at any point on their equipotential lines. It doesn’t need to be a node.
VPL_Lab_ah- Interference and Diffraction of Light
8
Rev 1/12/15
19. If you were going to add more to this screen as you will with the rest of the lab you might want to use the locking feature on the electric field lines or equipotentials to keep from disturbing them. Just lock and unlock them to see how this works. It takes away their drag handles. Some Points about Electric Field Lines and Equipotential Lines Electric field lines are always perpendicular to equipotential lines. This includes the surface of a conductor. Electric field lines never cross and equipotential lines never cross. Electric field lines start on positive charges and end on negative charges. Or they may do only one of these two. For example the field near a lone positive charge points away from it and we may not be concerned with where it might end. The density of the field lines in any region indicates the strength of the field in that region. Where lines are close together the field is strong. Where lines are farther apart the field is weak. (-Yoda, after learning to use a grammar checker.) 20. Why couldn’t a field line that starts at 7 o’clock on the positive charge end on 2 o’clock on the negative charge?
21. Why would equipotential lines never cross?
Charged Conductors in Electrostatic Equilibrium If a collection of electrons were added to a conductor, they would all begin to move apart, thus reducing the total amount of repulsive force between them. Any charge not on the surface of the conductor could get farther away, on average, from all the others by moving to the surface. So all charges will eventually end up on the surface of the conductor with no net force acting to move them elsewhere. For this reason the surface of any conductor in electrostatic equilibrium is an equipotential surface, or an equipotential line for our 2D objects. 22. How does this explain why electric field lines are always perpendicular to such a surface?
Procedure We now want to investigate electric fields in three different configurations – the field between parallel plates, the field of a dipole, and the field inside a hollow shell located in an electric field. You should use a different station for each of these. This will allow you to work on more than one configuration without having to erase what you’ve done. You have five stations to choose from. SCREENSHOTS: When you finish working with a given configuration you’ll be asked to take a Screenshot to either print out or upload. Be sure to include the entire grid plus the voltmeter and power supply. Don’t forget to do this before you shut down your computer. The work you create on the screen can’t be saved. When you exit the lab or shut down your computer, all is lost! It looks best if you lock Electric Fields and Equipotentials using the Lock panel. This makes the circular end points of the line invisible. The other reason for locking is to keep you from accidentally deleting or moving one type of line or another.
VPL_Lab_ah- Interference and Diffraction of Light
9
Rev 1/12/15
In each case you’ll follow a similar procedure. You’ll set the voltage to your assigned voltage. (Part III is an exception.) You’ll adjust the positions of the electrodes if necessary. You’ll then begin creating a series of equipotential lines. Using the fact that electric field lines are always perpendicular to equipotential lines you’ll then create a set of electric field lines to illustrate the field produced by your charged electrodes. You’ll always want to identify the voltage of each equipotential line using labels. Always use whole numbers such as 10 V, 20 V, etc. even though your measured values of the voltage will vary from point to point along the equipotential lines. (In part III we’ll actually use tenths of volts, but these values will be specified as needed.) Always be sure that your field line direction arrows are in the correct direction.
I. The Field Produced by a Pair of Equally but Oppositely Charged Parallel Plates 1.
Choose an unused station and set the configuration to “Parallel Plates.”
2.
Set the power supply voltage to your assigned Vps, between 20 and 60 V.
3.
Make sure that the plates are at 10 cm and 18 cm which are the defaults. Lock the Electrodes in place.
4.
Create an equipotential line for half your assigned voltage, .5 × Vps. That is, if your assigned voltage is 40 V, you’ll want to create a line connecting points at 20 V. Use 5 voltage markers and connect them with equipotential segments to form the complete equipotential line.
5.
Create a label to identify the voltage of points along this line. You can move it later if it’s in the way. Just make sure it points at the equipotential line.
6.
Create an equipotential line all the way around the negative plate connecting points at .3 × Vps. Here’s how.
Vps = ___________ V
Find points at that voltage in front of the plate (to its right) at y = 10 cm, 12 cm, 14 cm, 16 cm, 17 cm, and then above the plate at x = 10 cm. You’ll usually have to choose between two points, one higher and one lower than the target voltage. For example if your target voltage is 12 V, you might find 11.90 Volts to the left and 12.03 V to the right. Always use the closest one, 12.03 V in this case. Choose the higher voltage point in the event of a tie.
Repeat with the symmetrical points below the x-axis, e.g. y = 8 cm, etc.
Find the nine points behind the plate corresponding to the nine points you’ve found in front of the plate.
7.
Connect your voltage markers with equipotential segments. Add a voltage label for this line.
8.
Your equipotential line should already be a nice smooth curve except near the top and bottom of the electrode. Use the small, control point between the larger voltage markers to make small adjustments. This is easiest when you’re zoomed in a couple of times. Don’t spend too much time on this. Just try to nudge things a bit so that they look pretty close to having a smoothly changing in slope.
9.
Figure 11 – Equipotential Line
Repeat the necessary steps for the positive plate using .7 × Vps. Don’t forget the voltage label.
10. Add voltage labels for your two electrodes. 11. Repeat all the pertinent steps above to produce equipotential lines for .4 × Vps and .6 × Vps. But make the following changes. Don’t do any voltage measurement outside the plates. That is don’t do any measurements at x < 10 or x > 18. To improve your results near the ends of the plates, add voltage readings for y = 2 cm and 18 cm.
VPL_Lab_ah- Interference and Diffraction of Light
10
Rev 1/12/15
You now need to add the electric field lines. Remember there are two important points that will guide you in adjusting the curvature of your lines.
By convention the direction of these vectors is in the direction of the force on a positive test charge, that is, from the positive plate to the negative plate.
Electric field lines always cross equipotential lines at right angles. Since our conductors are in electrostatic equilibrium, their surfaces are equipotential surfaces. So our electric field lines will intersect them at right angles.
This second point is a problematic since charges are not uniformly spaced along the plates, but instead they’re concentrated more toward the ends of the plates. This causes some strong curvatures of lines near the plates that we can’t detect with our bulky probe. Figure 12 shows how the lines will start out perpendicular to the plate but then quickly change to the direction predicted by our field lines. If we could have measured potentials very close to the plate we would have been able to predict this quick change in direction. This is the reasons for starting our field lines a quarter to a third of a centimeter from the plates. See Figures 10 and 13 for any needed clarification.
Figure 12 – Electric Field Lines
12. Draw your first field line at y = 10 cm. That’s easy since the equipotential lines are parallel. 13. Go up two centimeters and draw another line. It should be essentially horizontal too. Fields are fairly constant in direction in this region between plates. 14. Keeping with the pattern of starting and ending each line at the same y-level as you used to measure your voltage – 10, 12, 14, 16, and 17 cm, draw a third horizontal line at 14 cm. This one needs adjusting. Drag the center control point upward until the field line strikes each equipotential line at approximately a right angle. 15. Continue this process for the full height of the plates. You should have nine field lines. 16. What about outside of the area between the plates? Any field lines from the top of the positive plate would also return to the top of the negative plate but it would go off screen in between. You’ll need to use three electric field segments to accomplish this. Here’s how. Use the two numbered orange circles in Figure 13 as approximate starting (1) and ending (2) points for an electric field line coming from the positive plate. You’ll need to tweak the center control points (arrow ) a bit to make it work but you should be able to create a segment that matches the trend suggested by the other field lines. Create a second, symmetrical segment ending on the top of the negative plate.
Figure 13 – Off-screen Field Lines
You can then fill in the middle section to make a complete line by drawing a new field line in between. It should start at point 2 and end on the corresponding starting point on the segment on the left. It will go up out of the grid a bit but the apparatus isn’t picky. 17. Finally fill in the field lines in the lower half of the screen and you’re done. There are plenty of places in books and on line to check your work.
VPL_Lab_ah- Interference and Diffraction of Light
11
Rev 1/12/15
Be sure that you have everything you need before taking your Screenshot and possibly shutting down the apparatus because there is no way to save your work. You should have: a.
Two full equipotential lines that wrap around the plates.
b.
Two partial equipotential lines that don’t go outside of the area between the plates.
c.
The central equipotential line between the plates.
d.
A voltage label on each electrode and each of the five equipotential lines.
e.
Eleven electric field lines.
18. Lock Electric Fields and Equipotentials and take a Screenshot that includes all of the grid plus the voltmeter and power supply. 19. Save your Screenshot as “EFields_plates.png” You can unlock the fields and equipotentials afterwards if you like. 20. Print out and paste your Screenshot in the blank grid provided below.
Figure 14 – Electric Field due to Parallel Plates A 3D Perspective of Electric Potential – Parallel Plates It’s useful to think about the way that potential varies with position in the same way that altitude varies with position (latitude and longitude) on a hilly terrain. A topographical map represents the third dimension with curves connecting points of equal altitude. Moving across a map between two topographical, aka “topo,” lines corresponds to moving across the terrain while rising or falling a given vertical distance. The closer together the topo lines, the shorter the horizontal distance is between points differing in altitude by a given amount. That is, the steeper the terrain in that area. Our equipotential lab represents the same sorts of steep and gentle rises and falls as a charge moves across the grid. But in this case the rises and falls represent changes in electrical potential. Figure 15a is just such a map for our parallel plates. The power supply was set to 40 V when this data was taken. Compare it to your sketch above. The two long spikes represent the two plates. They’re pointed because data was taken only every centimeter, so the plates are effectively lines. Notice the steep drop in voltage between the plates and similar drops, or rises, to the 20-volt plane everywhere else. A voltmeter doesn’t actually measure voltage, but rather the difference in voltage (potential difference) between its two terminals. So the plates could be at 1,040 V and 1,000 V and the results would be identical. In figure 15b this is illustrated by
VPL_Lab_ah- Interference and Diffraction of Light
12
Rev 1/12/15
decreasing all the voltage readings by 20 V. As a result the left part of the graph drops down into negative voltages and the right side drops from a maximum of 40 V to 20 V. So the voltage range is -20 V to +20 V. As far as qo is concerned, the fall looks just as scary. Only the potential difference matters.
15a: ΔV = 40V between 0 and +40V
15b: ΔV = 40V between -20V and +20V
Figure 15 – Potential vs. Position for Parallel Plates (3D) Figure 15a was created in Microsoft Excel. Rather than finding points of equal potential and connecting them as you did in this lab, the potential was measured at each 1 cm intersection on the grid and recorded in an Excel spreadsheet. Here’s how to create the graph in Excel. (The method varies with Excel version. Google awaits your inquires.) Note: this is not a part of your assignment. I just thought you might find it interesting. 21. Take data at every one-centimeter intersection on the grid. Use Shift + a cursor key to move around quickly. 22. Enter the data in an Excel spreadsheet like the one shown below. Note the columns of mostly 0’s, 20’s and 40’s. 0
2
4
6
8
10
12
14
16
18
20
22
24
26
28
0
18.92
18.71
18.43
18.10
17.77
17.83
18.71
20.00
21.29
22.17
22.23
21.90
21.57
21.29
21.08
2
18.73
18.41
17.95
17.24
15.98
14.31
17.22
20.00
22.72
25.68
24.06
22.78
22.06
21.60
21.28
4
18.55
18.12
17.47
16.33
13.67
0.00
15.20
20.00
24.67
40.00
26.42
23.71
22.55
21.89
21.46
6
18.40
17.89
17.10
15.69
12.57
0.00
14.37
20.00
25.49
40.00
27.53
24.35
22.92
22.12
21.61
8
18.30
17.75
16.88
15.37
12.25
0.00
14.20
20.00
25.66
40.00
27.85
24.67
23.15
22.27
21.71
10
18.27
17.70
16.80
15.28
12.19
0.00
14.19
20.00
25.67
40.00
27.91
24.76
23.22
22.31
21.74
12
18.30
17.75
16.88
15.37
12.25
0.00
14.20
20.00
25.66
40.00
27.85
24.67
23.15
22.27
21.71
14
18.40
17.89
17.10
15.69
12.57
0.00
14.37
20.00
25.49
40.00
27.53
24.35
22.92
22.12
21.61
16
18.55
18.12
17.47
16.33
13.67
0.00
15.20
20.00
24.67
40.00
26.42
23.71
22.55
21.89
21.46
18
18.73
18.41
17.95
17.24
15.98
14.31
17.22
20.00
22.72
25.68
24.06
22.78
22.06
21.60
21.28
20
18.92
18.71
18.43
18.10
17.77
17.83
18.71
20.00
21.29
22.17
22.23
21.90
21.57
21.29
18.92
Table 1 – Potential vs. Position (x, y) for Parallel Plates 23. Select all the data in the spreadsheet by clicking in the top left and then Shift-clicking the bottom right cell. From here on the actual steps depend on your version of Excel. 24. Click the Insert tab and select Recommended Charts. 25. Click on the All Charts tab. 26. Select Surface. Click OK.
VPL_Lab_ah- Interference and Diffraction of Light
13
Rev 1/12/15
27. Further investigation will allow you to rotate your graph about any axis. In my version you right click in the chart and a select 3D rotation from the list.
II. The Field Produced by an Electric Dipole An electric dipole is made up of two point charges of equal magnitude but opposite signs. This is an arrangement that happens a lot in nature on the molecular scale. In a water molecule, H2O, the two hydrogen atoms are at a 105° angle from one another resulting in a constant positive side to the molecule with the oxygen providing the negative side to the molecule at the third corner of the triangle. When a negatively charged object is brought near a falling stream of water, the water molecules rotate with their positive, hydrogen side closer to the negatively charged object. This results in a net attraction because of the difference in distance between the negative object and the positive and negative sides of the dipole. Please try this at home. Rubbing a plastic glass or comb with paper will do nicely. To be point charges the objects holding the charges must be far enough apart so that the charges on one object are all very nearly equidistant from the charges on the other. Ours aren’t really point charges, but they’re a pretty good approximation. And the excess charges are symmetrically arranged around the electrodes which makes the result more like that of a real dipole. From your work with parallel plates you should have a good idea of how the apparatus is used. You’ll find a series of points that are at the same potential and then connect them with smooth curves – equipotential lines. You’ll then draw a collection of electric field lines that start out near the positive electrode and end up at corresponding points near the negative electrode. Since our electrodes are circular now we’ll not draw our lines starting and ending at certain y-values. Instead we’ll use clock positions such as 8 o’clock and 2 o’clock as end points. 1.
Choose an unused station and set the configuration to “Dipole.”
2.
Set the power supply voltage to your assigned power supply voltage, Vps.
3.
Make sure that the plates are at 6 cm and 22 cm which are the defaults. Lock the Electrodes in place.
4.
Create a series of equipotential lines for .3 × Vps, .4 × Vps, .5 × Vps, .6 × Vps, and .7 × Vps. Four of these will wrap completely around one or the other electrodes.
5.
Create seven full electric field lines as follows:
6.
One starting at 9 o’clock and ending at 3 o’clock
Three starting at three evenly spaced points on the positive electrode between 6 o’clock and 9 o’clock
Three starting at three evenly spaced points on the positive electrode between 9 o’clock and 12 o’clock
Create another electric field line starting at 12 o’clock. Handle this just as you did with the parallel plates as shown in Figure 16. That is, let it end at the edge of the grid and then restart a new, symmetrical line, to the left of the center line, to proceed to the negative electrode. Then join the two with an additional segment in between the open ends. This will take you well outside of the grid. Repeat for a field line starting at 6 o’clock. This brings the total to nine field lines.
7.
Figure 16 – Off-screen Field Lines
Label each electrode and electric field line with its voltage.
Be sure that you have everything you need before taking your Screenshot and possibly shutting down the apparatus because there is no way to save your work.
VPL_Lab_ah- Interference and Diffraction of Light
14
Rev 1/12/15
8.
Lock Electric Fields and Equipotentials and take a Screenshot that includes all of the grid plus the voltmeter and power supply.
9.
Save your Screenshot as “EFields_plates.png” You can unlock the fields and equipotentials afterwards if you like.
10. Print out and paste your Screenshot in the blank grid provided below.
Figure 17 – Electric Field due to a Dipole A 3D Perspective of Electric Potential – Electric Dipole The 3D potential vs. position graph for the dipole, shown in Figure 18, looks similar to the parallel plates except for there being a larger space between them which resulted in a more of a gentle slope. Note that charges released away from the line connecting the two points would always move in a sweeping arc and the particular path would be highly dependent upon the charge’s exact starting position. Thus the uniform field of a parallel plate system is always used for accelerating charges for scientific work, old model televisions and any other situation where predictability is required. 11. Think about what this 3D graph would look like for an alternating current. That is, if the positive side gradually reduced in positive voltage down to zero and then continued on until it reached -40 V, and then went in reverse back up to 40V, etc. The reverse would be happening on the other side. Describe what this animated graph would look like over time.
VPL_Lab_ah- Interference and Diffraction of Light
15
Rev 1/12/15
This is much like the behavior of an antenna except that the charges in the antenna are flowing back and forth along the antenna wire between the two ends. This change in field over time produces a changing magnetic field over time which produces a changing electric field, etc. These varying electric and magnetic fields propagate away from the antenna as an electromagnetic wave. If the frequency of this oscillation happens to be between 4.3×10¹⁴ and 7.9×10¹⁵ Hz, your eyes will be able to detect it.
Figure 18 – Potential vs. Position for a Dipole (3D)
III. The Field Inside a Circular Conducting Ring between a Pair of Equally but Oppositely Charged Parallel Plates; Shielding PENCIL REQUIRED: Your final task will test your skill and patience, and let you discover the reason why you’re provided some degree of protection from lightning by staying in your car. That is, if your car has a metal body. 1.
Choose an unused station and set the configuration to “Shielding.”
2.
Set the power supply voltage to 40 V. We’ll all use the same voltage this time to make the instructions easier to follow.
This arrangement uses two oppositely charged parallel plates. They’re farther apart this time to make room for a small, uncharged conducting ring in the center of the grid area. Let’s think about what difference the ring might make. 3.
Suppose first that the ring was not present. An electric field would now be produced, directed from right to left. As we know, the field near the center of the parallel plates is pretty uniform. Draw five equally spaced field lines in Figure 19.
Figure 19 – Field between Parallel Plates 4.
What would happen if the conducting ring was now added? It’s initially neutral, but some of its electrons are free to move. Some electrons will pass through the ring as part of the small current flowing through our weekly conducting grid, but just as with the plates, many electrons will build up on one side of the ring, giving that side a net charge. Let’s let nine electrons represent all of these electrons. In Figure 20, assume that the electric field is still present, but don’t draw it. Instead draw nine negative signs on the ring indicating where the nine electrons might be. Not yet! Let’s examine what happens a step at a time. Consider the first electron. Where will it end up? As close as possible to the positive plate. Add that to the figure as a negative sign. But we now have a positive charge somewhere without a mate. All the charges will readjust and leave that positive charge in a symmetrical position on the other side of the ring. Draw a positive sign there with your pencil. What about the next electron? And it’s matching positive mate. You can’t just add them to the figure because the initial pair will adjust too. (The positive charges don’t move. Instead electrons move in one direction, effectively moving the
VPL_Lab_ah- Interference and Diffraction of Light
16
Rev 1/12/15
positive charge in the other direction.) Erase the first + - pair and draw the two pairs where they should be. Get the picture? These nine negative and nine positive charges will be distributed in such a way to just balance the effect of the external field and the forces they (the charges) exert on one another. Erase the two + - pairs and draw all nine pairs on your figure.
Figure 20 – Charges on Circular Conductor between Parallel Plates 5.
Hopefully you now have nine negatives on the right and nine positives on the left. And you’ve also figured out that they’re closest together toward the middle of each side and farther apart as you move along the ring toward its vertical centerline. Individually they’d all want to be on the far left or right, but as more of them collect there, they begin to repel one another with an increasingly larger force.
6.
So what will this do to our nice horizontal electric field that we’ve been ignoring. It’s now going to be modified by the charges on the ring because the excess charges create their own fields. And there’s one other effect. The electric field in the space now occupied by the ring was originally toward the left. But the excess charge on the two sides of the ring will produce their own field inside the ring and it will be generally toward the right! Let’s see how that works out. This takes some patience. We’ll work just between the plates, ignoring what’s above or below them. Be sure to put voltage labels on every equipotential line you create. And use the small control points on the equipotential lines to adjust their curvatures where needed.
NOTE: You may find that the lines end up on top of your labels sometimes. While electric field lines always go on the top layer, the voltage markers and labels are stacked in order of their creation. So if you find a control point on top of a label, just delete the label and recreate it. It will then rise to the top of the stack. Or you can just ignore this if you like. 7.
Create five 10-V markers and connect them to create a 10-V equipotential line. To do this create voltage markers every three vertical centimeters, that is, at y = 16, 13, 10, 7, and 4 cm. Using Shift-cursor makes this very easy. Add a 10 V label for this line. Add a voltage label for this line.
8.
Create 0 V, and 40 V markers and labels for the two plates.
9.
Similarly create five 15-V, 17-V, and 18-V markers and create their three equipotential lines. As usual, add labels.
You should have noticed that the 18-V line bent back away from the ring at its center. Just as a surveyor would do, you’ll need to take more than five voltage reading for each of your next few lines because the terrain is getting more complicated. Your labels will start to get crowded but you can move them around as needed. You might want to keep them all above the centerline of the grid and use the space below the centerline for the lines you’ll create on the right side of the grid. 10. Create an 18.5-V equipotential but take data every two vertical centimeters. That is, create voltage markers at y = 16, 14, 12, 10, 8, 6, and 4 cm. Add and smooth an equipotential line. 11. Repeat for 19 V and 19.5 V. You may find that when you create equipotential segments in close like this that you’ll sometimes create a pair with the extra one attaching to a nearby marker. Just delete the extras. You can minimize this by starting the line at the marker in the tight spot and release it on the one that’s in the less congested region. 12. Finally, create a 19.8-V line taking readings every vertical centimeter. That is, y = 16, 15 cm, etc. There’s some chance that you won’t be able to measure some points near the ring, but just do your best.
VPL_Lab_ah- Interference and Diffraction of Light
17
Rev 1/12/15
If you select “Equipotentials” in the “Lock” check list on the left of the screen you’ll see just your equipotential lines without the control points. You’ll see that our drawing tools are not fine-tuned enough to deal with the quick change in direction of the lines. When you draw your field lines just use your best judgment instead of trying to hit each equipotential line at a right angle. This is the reason why we don’t draw the field lines right up to the electrodes. The field changes direction a lot over short distances in these locations. 13. You should now be able to do the right side of the grid on your own. Not surprisingly the results will be symmetrical with the vertical centerline. We won’t draw a complete set of electric field lines. You should be able to see the “terrain” pretty well with your experience with the two other configurations. 14. Draw two electric field lines from plate to plate starting just inside the positive plate at y = 5 cm and 15 cm. Clearly the field is swerving away from the central region. What’s more interesting is what’s happening in the center. The field lines coming from the positive plate are going to start out swerving outward a bit but will then swerve back in toward the ring because of the negative charge on its right side. It would take a lot of trial and error to put together a convincing series of field lines to show what’s happening. Instead we’ll just work in the center third of the screen. 15. Start five electric field lines at x = 19 cm and y = 8, 9, 10, 11, and 12 cm. End them near the surface of the ring. It won’t be perfect because our equipotential lines can’t register all the twists and turns. 16. Then draw a symmetrical set of five on the left side of the ring. The easiest way is to draw them from left to right and then switch the directions to show the arrows pointing to the left. To do this you’ll right click and select “Reverse Direction” on each of the five lines. Now for the big punch line. The ring is in electrostatic equilibrium just as the plates are. And since the ring is not connected to either electrode, it remains neutral. But it can be polarized by the field it’s immersed in. Remember that we said that electric field lines start on positive charges and end on negative charges. Now imagine overlaying your plus and minus charges from Figure 20 onto the ring in your apparatus. Notice how nicely the field lines diverted to the ring can leave the positive plate and arrive on the negative side of the ring. And they can leave the positive side of the ring and end on the negative plate. This effectively stops the field at the outside of the ring! This effect, by conductors, of preventing electric fields from penetrating their surfaces is called shielding. It’s what the outer mesh of wire on a coaxial cable is for – to keep out stray fields. It’s what keeps you fairly safe inside a closed conducting shell such as a car when you’re in a lightning storm. It also reduces your radio reception inside your car. It gets even weaker if you drive along a steel bridge with girders above, below, and on each side of you. So even a non-solid shell can provide shielding. 17. Try it with your apparatus. Take some voltage readings at various points inside the ring. Add a label there to record your results. 18. Lock Electric Fields and Equipotentials and take a Screenshot that includes all of the grid plus the voltmeter and power supply. 19. Save your Screenshot as “EFields_shielding.png” You can unlock the fields and equipotentials afterwards if you like. 20. Print out and paste your Screenshot in the blank grid provided below.
VPL_Lab_ah- Interference and Diffraction of Light
18
Rev 1/12/15
Figure 21 - Field Inside a Circular Conducting Ring between a Pair of Parallel Plates A 3D Perspective of Electric Potential – Shielding This one pretty well speaks for itself. I’d say it looks like a crazy new design for Skee Ball, but there’s currently a bit of a legal battle going on with that sport. Seriously. Look it up. I’m going with “Corn hole for the terminally lazy.”
Figure 22 – Potential vs. Position for a Conducting Ring between a Pair of Parallel Plates (3D)
VPL_Lab_ah- Interference and Diffraction of Light
19
Rev 1/12/15