1 40
Revue de l’OFCE
EIGHTEENTH-CENTURY INTERNATIONAL TRADE STATISTICS SOURCES AND METHODS edited by Loïc Charles and Guillaume Daudin
edited by Loïc Charles and Guillaume Daudin
EIGHTEENTH-CENTURY INTERNATIONAL TRADE STATISTICS SOURCES AND METHODS
f
Revue de l’OFCE
OFCE L’Observatoire français des conjonctures économiques est un organisme indépendant de prévision, de recherche et d’évaluation des politiques publiques. Créé par une convention passée entre l'État et la Fondation nationale des sciences politiques approuvée par le décret n° 81.175 du 11 février 1981, l'OFCE regroupe plus de 40 chercheurs (es) français et étrangers. « Mettre au service du débat public en économie les fruits de la rigueur scientifique et de l’indépendance universitaire », telle est la mission que l’OFCE remplit en conduisant des travaux théoriques et empiriques, en participant aux réseaux scientifiques internationaux, en assurant une présence régulière dans les médias et en coopérant étroitement avec les pouvoirs publics français et européens. Philippe Weil a présidé l’OFCE de 2011 à 2013, à la suite de Jean-Paul Fitoussi, qui a succédé en 1989 au fondateur de l'OFCE, Jean-Marcel Jeanneney. Depuis 2014, Xavier Ragot préside l’OFCE. Il est assisté d'un conseil scientifique qui délibère sur l'orientation de ses travaux et l'utilisation des moyens.
Président Xavier Ragot. Direction Jérôme Creel, Estelle Frisquet, Éric Heyer, Lionel Nesta, Xavier Timbeau.
Comité de rédaction Christophe Blot, Gérard Cornilleau, Jérôme Creel, Estelle Frisquet, Jean-Luc Gaffard, Éric Heyer, Sandrine Levasseur, Françoise Milewski, Lionel Nesta, Hélène Périvier, Henri Sterdyniak, Xavier Timbeau.
Publication Xavier Ragot (directeur de la publication), Gérard Cornilleau (rédacteur en chef), Laurence Duboys Fresney (secrétaire de rédaction), Claudine Houdin (adjointe à la fabrication), Najette Moummi (responsable de la fabrication).
Contact OFCE, 69 quai d’Orsay 75340 Paris cedex 07 Tel. : +33(0)1 44 18 54 87 mail :
[email protected] web : www.ofce.sciences-po.fr
Dépôt légal : juillet 2015 ISBN : 978-2-312-03378-5 N° ISSN 1265-9576 – ISSN en ligne 1777-5647 – © OFCE 2015
Contents EIGHTEENTH-CENTURY INTERNATIONAL TRADE STATISTICS edited by Loïc Charles and Guillaume Daudin Eighteenth-Century International Trade Statistics: Sources and Methods. General introduction . . . . . . . . . . . . . . . . . . . . . . . . . . . . . . 7 Loïc Charles, Guillaume Daudin PAPERS Past and present issues in trade statistics: An insider’s view . . . . . . . 39 Hubert Escaith Dealing with commodities in Navigocorpus Offering tools and flexibility . . . . . . . . . . . . . . . . . . . . . . . . . . . . . . . 53 Jean-Pierre Dedieu and Silvia Marzagalli Trade statistics of the Zollverein, 1834-1871 . . . . . . . . . . . . . . . . . . . 67 Béatrice Dedinger Early modern trade flows between smaller states: The PortugueseSwedish trade in the eighteenth century as an example . . . . . . . . . . 87 Maria Cristina Moreira, Jari Eloranta, Jari Ojala, and Lauri Karvonen One source to rule them all? Combining data about trade and shipping from Amsterdam to the Baltic in the late eighteenth-century . . . . . .111 Jeroen van der Vliet French imports to the Baltic, a quantitative analysis . . . . . . . . . . . 137 Werner Scheltjens The quantitative development of Germany’s international trade during the eighteenth and early nineteenth centuries . . . . . . . . . . 175 Ulrich Pfister QUESTIONNAIRES Austrian Netherlands, 1759-1791 . . . . . . . . . . . . . . . . . . . . . . . . . . 225 Ann Coenen France, c.1713- c.1821 . . . . . . . . . . . . . . . . . . . . . . . . . . . . . . . . . . . 237 Loïc Charles and Guillaume Daudin Genoa, sixteenth century-1797. . . . . . . . . . . . . . . . . . . . . . . . . . . . . 249 Luisa Piccinno and Andrea Zanini Habsburg Monarchy, eighteenth century-1918 . . . . . . . . . . . . . . . . 253 Klemens Kaps Hamburg, 1728-1811 . . . . . . . . . . . . . . . . . . . . . . . . . . . . . . . . . . . . 265 Klaus Weber Revue de l’OFCE, 140 (2015)
Ireland, 1698-1829 . . . . . . . . . . . . . . . . . . . . . . . . . . . . . . . . . . . . . . 269 Patrick Walsh, Aidan Kane, and Eoin Tennisman Naples, sixteenth century-1809 . . . . . . . . . . . . . . . . . . . . . . . . . . . . 275 Daniela Ciccolella Livorno, 1680-1845 . . . . . . . . . . . . . . . . . . . . . . . . . . . . . . . . . . . . . 281 Mathieu Grenet Milan, 1762-1790 . . . . . . . . . . . . . . . . . . . . . . . . . . . . . . . . . . . . . . . 289 Giovanna Tonelli Netherlands, 1753-1809 . . . . . . . . . . . . . . . . . . . . . . . . . . . . . . . . . . 295 Werner Scheltjens Norway, 1731-1795 . . . . . . . . . . . . . . . . . . . . . . . . . . . . . . . . . . . . . 301 Ragnhild Hutchinson Papal States, sixteenth-nineteenth centuries . . . . . . . . . . . . . . . . . 307 Donatella Strangio Poland, 1764-1791 . . . . . . . . . . . . . . . . . . . . . . . . . . . . . . . . . . . . . . 311 Szymon Kazusek and Jan Kochanowski Portugal, 1775-1831 . . . . . . . . . . . . . . . . . . . . . . . . . . . . . . . . . . . . . 319 Maria Cristina Moreira Romanian Principalities, eighteenth century . . . . . . . . . . . . . . . . . 335 Cristian Luca Russia, 1758-1766 . . . . . . . . . . . . . . . . . . . . . . . . . . . . . . . . . . . . . . . 343 Werner Scheltjens Scotland, 1707-1783 . . . . . . . . . . . . . . . . . . . . . . . . . . . . . . . . . . . . . 345 Philipp Robinson Rössner Spain, 1717-1827 . . . . . . . . . . . . . . . . . . . . . . . . . . . . . . . . . . . . . . . 355 Javier Cuenca-Esteban Spanish America, 1790-1830 . . . . . . . . . . . . . . . . . . . . . . . . . . . . . . 365 Alejandra Irigoin Sweden and Finland c.1700-1809, Finland 1809-c.1850 . . . . . . . . . 373 Jari Ojala and Jari Eloranta United Kingdom, 1696-1899 . . . . . . . . . . . . . . . . . . . . . . . . . . . . . . . 379 David Jacks United States, 1790-1819 . . . . . . . . . . . . . . . . . . . . . . . . . . . . . . . . . 385 Javier Cuenca-Esteban Missing countries . . . . . . . . . . . . . . . . . . . . . . . . . . . . . . . . . . . . . . . 391 Loïc Charles and Guillaume Daudin
The opinions expressed by the authors are their own and do not necessarily reflect the views or positions of the institutions to which they belong.
General introduction
EIGHTEENTH-CENTURY INTERNATIONAL TRADE STATISTICS SOURCES AND METHODS1
Loïc Charles Université de Paris 8 & INED
Guillaume Daudin Université de Paris Dauphine & Sciences Po
Trade statistics provide unique sets of data on early modern economies. They can help explore their economic geography. They are of interest for economists interested in economic development and early globalization. They are crucial to understand the Industrial Revolution. Still, they have been underutilized by economists and economic historians alike. This volume gives a detailed overview on the existing quantitative sources on European trade data, focusing on the eighteenth century. In the introduction we discuss the historiography of the use of early trade statistics in economic history and we present two recent projects conducted in France in this area: TOFLIT18 and RICardo. The volume includes twenty-three short essays that present the sources of European early trade statistics. Seven additional papers discuss the methodological issues of using early trade statistics and illustrate how these statistics can be mobilized to produce new insights on European economic history. Keywords: administrative history, eighteenth century, international trade statistics, Europe, globalization, economic history
1. This volume was funded by the OFCE and the Agence Nationale de la Recherche (Projet TOFLIT18, ANR-13-BSH1-0005). The editors thank the contributors to this volume, the participants to the 2014 Paris workshop on early trade statistics, Béatrice Dedinger for her contribution to the RICardo presentation, and the OFCE editorial and administrative staff for the preparation of this volume. e-mail:
[email protected];
[email protected]
Revue de l’OFCE, 140 (2015)
8
Loïc Charles and Guillaume Daudin
T
he long eighteenth century is of special interest for economic historians, as it includes the event that founded the economic history of modern societies: the Industrial Revolution. Its genesis effectively goes back to sometime between 1750 and 1815, when Great Britain opened the era of the Great Divergence and escaped once and for all from the economic constraints of the Ancien Regime. The ongoing debate among economists and historians shows there is no agreement on the direct causes as to why Britain was the first industrial nation and why other countries lagged behind.2 Current and past works have explored several hypotheses. The most traditional explanations have ascribed the causes to previous technological advances (Mantoux, 1905), the “agricultural revolution” (Bairoch, 1966, 1997) and the role of slavery (Williams, 1944). Recently, the debate has been largely renewed as researchers have emphasized the roles of: efficient institutions (Acemoglu, Johnson, & Robinson, 2001; D. C. North, 1973; Robinson, Acemoglu, & Johnson, 2005); the scientific revolution and the industrial enlightenment (Mokyr, 2004, 2010); privileged access to natural resources (such as coal and sugar), which relaxed the Malthusian trap (Pomeranz, 2000; Wrigley, 2010); an economy marked by high-wages and low-energy costs (Robert C. Allen, 2009); transforming attitudes toward work and consumption, (De Vries, 2008); the rise of bourgeois values (McCloskey, 2010); Social Darwinism (G. Clark, 2007); and, finally, the importance of the Royal Navy and the military successes of the British (Findlay & O’Rourke, 2007; O’Brien, 2011; Pomeranz, 2009).
1. Why are trade statistics important? 1.1. Understanding early modern economies The explanations mentioned above acknowledge the mainly indirect role that international trade played through its contribution to good institutions (Robinson et al., 2005) or to making Great Britain a high wage economy similar to the Netherlands (Allen, 2. See, for example, the panel on the causes of the Industrial Revolution in the 2011 European Historical Economics Conference in Dublin. For a recent review of the literature, see (Allen, 2008; Various, 2008).
Eighteenth-century international trade statistics: Sources and methods
2003) However, with the exception of those who adopted Williams’ thesis, the direct effects of foreign trade on the English eighteenth-century economy have been traditionally found to have limited importance (Roitman, Pétré-Grenouilleau, & Emmer, 2006). Yet, recently influential syntheses have reconsidered the importance of foreign trade. For Pomeranz, tropical agricultural goods have provided alternative sources for calories and raw materials and, as such, contributed significantly to England’s escape from ecological constraints (Pomeranz, 2000). For Jan De Vries, tropical commodities and Asian-made industrial goods have created new consumption needs, which in turn have established strong incentives for English workers to increase their labor supply (De Vries, 2008). From the same evidence, Berg has emphasized the role of imported industrial goods in encouraging British manufacturers to develop new products and processes (Berg, 2002, 2004). More generally, as Allen and many others have argued, the inventions that were so important for the Industrial Revolution were not simply the consequences of the independent development of techniques and science. Relative factor prices and market size were also important in creating incentives for Research and Development (R&D) and in determining the R&D opportunities to be pursued. Both are linked to external trade.3 The importance of international trade for economic historians cannot be reduced to its role in the Industrial Revolution. It is also relevant for understanding the workings and transformations of early modern European economies. Goods that were traded and circulated at the international level occupied a special place. External trade provided European consumers with new goods (sugar, coffee, tea, Asian manufactures, etc.) and producers with new inputs (indigo, cotton, etc.). At the same time, it allowed regional specialization both in agricultural and industrial production by connecting these overseas markets to European regions that furnished non-local supplies such as meat, textiles, grains or wine. For a long time, researchers deemed international trade of little importance in a world where most economic activities were conducted outside the market. However, for economic historians that are mostly interested in explaining economic changes rather 3.
For a recent synthesis, see (O’Rourke, De La Escosura, & Daudin, 2010).
9
10
Loïc Charles and Guillaume Daudin
than the deeper social structure (the civilisation matérielle) of these economies, it is a good research strategy to study first those goods traded in the market. Actually, As a whole, data on external trade give fundamental insights into the material culture of Early Modern Europe and its transformations in the eighteenth and early nineteenth centuries. Because such data measure flows rather than stocks, and they allow analyzing short- and medium-term variations of the economy, it is a “dynamic” complement to the more “static” vision offered by probate inventories studied by Daniel Roche and others (see Roche, 1989, 1997). It is also relevant to stress that external trade flows have been the single macroeconomic data that early modern states have collected with the most care. Indeed, the first attempts at measuring foreign trade can be dated from the early seventeenth century. Later on in the century, several Italian states, such as the Republics of Genoa and Venice, began to systematically collect customs data to create balances of trade. England and Ireland followed and, from 1696 on, they collected a continuous series of data flows as reported in each of the kingdom’s ports and released a yearly evaluation of the English balance of trade. Most of the continental states, such as France, copied these early examples, and by the end of the eighteenth-century most of them produced more or less comprehensive balances of trade (see infra table 2). 1.2. From the global to the local Obviously, international trade data inform us about global relationships. More interestingly, they can also inform us about intranational data. The example of the French data is interesting, but the same could also be said about the Habsburg and British data. On the one hand, these data are of a macroeconomic nature: they can supplement the macroeconomic quantitative retrospective reconstructions that are available for a better understanding of the transformations of the economy. For example, they can be used to compare the relative revealed comparative advantages of one economy with those of other European countries. On the other hand, a significant part of the local data synthesized by the central bureau have been preserved in a number of cases (France, Habsburg Empire), and they can be used to better understand the economic
Eighteenth-century international trade statistics: Sources and methods
linkage between local/regional economies, international trade and the national economy. The existence of local data makes it possible to provide a rigorous framework for an economic analysis that links different geographical levels: international, national, regional, and local, as well as with individual actors. Economic transformations in general and the Industrial Revolution in particular have traditionally been understood and theorized as a country-level phenomenon. However, both historians and economists have developed alternative points of view. In his classic book, Sydney Pollard suggested that the British Industrial Revolution was region- rather than nation-based (Pollard, 1981). This is coherent with the importance of local spillover effects discussed in the economic geography literature (Clark, Gertler, & Feldman, 2003). Yet, we lack a thorough study of the eighteenth and early nineteenth century sub-national continental geographical economy. As continental countries were often larger and more diverse than Britain (think of France and the Habsburg Empire), regional differences might be especially relevant for understanding the evolution of their economy and trade. Moreover in most European countries, political and customs borders were not alike. Regarding trade statistics, the central administration treated some provinces as foreign countries, Alsace and Lorraine in the French case. This was also often the case for colonies who had a specific status and sets of customs taxes. In the case of France, despite not being in the customs union, most free ports (except Dunkirk) and some provinces were treated as domestic French trading partners. Taking into account this complexity will allow us to deepen our understanding of the specific impact on trade of political borders versus customs borders, especially as we might have the occasion to cross-check French external trade data with the statistics of other countries (especially Britain and the Austrian Netherlands). This strategy can be replicated for other European countries such as the Habsburg Empire. 1.3. Understanding development and globalization Finally, a more comprehensive view of international trade in the early modern period is also of importance for economists, as it will deepen our understanding of economic development and transformation, as well as the determinants of international trade in general.
11
12
Loïc Charles and Guillaume Daudin
1. The way in which the low-growth economies of the premodern era transformed into sustained-growth economies is an important economic subject. The current economic understanding of this historical phenomenon is dominated by the unified growth theory (Galor, 2011), which has been partly constructed on the stylized facts provided by Great Britain’s Industrial Revolution. We know much less about the evolution of the other European economies, yet their path to sustained economic growth was quite different from Great Britain’s in terms of their share of agriculture, manufacturing, investment level and openness (Crafts, 1984). Thus, a better understanding of these economies will offer new materials to test existing theories of development and to conceive new ones. 2. Other than the COMTRADE data that begins with 1962, there is a lack of easily accessible merchandise and trade partner databases, and this impairs any research into the determinants of international trade. Pure bilateral databases starting in the 1870s are becoming more widely used (Jacks, Meissner, & Novy, 2011). RICardo, which starts in 1830, will be available soon. But the lack of a unified trade nomenclature before the twentieth century makes it difficult to establish a world trade database organized by goods. Even though no general database for eighteenth century trade exists, looking at country-level data should be fruitful as it allows eighteenth and nineteenth century international trade to be explained by exploring the relative role of differentiation in goods, production factor endowments and technological differences. It also allows further exploration of the role of trade costs during this period, as we can contrast their evolution for more or less bulky goods. Finally, this data can help us discriminate between existing theories of international trade and also provide economists with “stylized facts” to improve them. Surprisingly, the huge sets of economic information collected by early modern states have not been studied systematically by historians and economists. Although several (and some of them very interesting) works of limited scope have been published, these rich sources on early modern economies have been underused. These works have concentrated primarily on English foreign trade and to a much lesser extent on French foreign trade.4 Broadly speaking, their results are often too general and fragile to support
Eighteenth-century international trade statistics: Sources and methods
precise economic analysis and comparisons. Even worse, the location and scope of the original documents that still exist are not well-known. This situation, which our volume intends to change, can be ascribed to several causes, some of which are historiographical, and some others are linked with technical difficulties
2. This volume in context 2.1. Historiographical issues with trade statistics With the exception of English trade statistics, very little research was conducted on historical trade statistics before the 1950s. On the one hand, the interwar period was dominated by the classical model of trade theory that was first presented by David Ricardo in his Principles of Political Economy and Taxation (1817); this was further developed by the Swedish historian and economist Eli Hecksher (1919) and his student Bertil Ohlin in his doctoral thesis published in 1933 (Heckscher, 1919; Heckscher & Ohlin, 1991; Ohlin, 1933; Ricardo, 1817). Moreover, national accounting systems were still in their infancy, and these two characteristics of the economic theory of the time combined to create a context in which balances of trade had little theoretical significance. On the other hand, there was no consensus on how to classify international trade. Indeed, one of the main areas of economic work concerning the late League of Nations involved creating an international standard for trade statistics that would allow including national trade statistics into a coherent whole. However, when the war broke out and swept away the League of Nations, the task remained uncompleted. It is only in 1950 that the United Nations and World Trade Organization released and used the first Standard International Trade Classification. The development of economic history provides another context for understanding the lack of interest in early-modern trade statistics, especially in Europe and after 1945. Before 1945, economic history was mainly of a qualitative nature, and quantity-based analyses were scarce. Through the work of economic historians like François Simiand and Ernest Labrousse, it was only in France that 4. To the point that English and French sources were used to measure trade of other countries, such as Germany (Kutz, 1974).
13
14
Loïc Charles and Guillaume Daudin
quantitative analysis and the construction of economic series become central to historians in the context of the development of the Annales School. Their interdisciplinary works combined a statistical analysis of past series, economic theory and qualitative analysis, all of which flourished in the 1930s and later.5 However, the Annales School and Labrousse in particular favored price series over quantity series. For French Annales historians, series of production quantities and values were more liable to contain registration errors and frauds. Conversely, they found prices and especially mercuriales (grain market prices) to be much more reliable, since they were made public. They also believed they were much more representative of the social and economic relationships that structured Old Regime France. The consequence was that French trade statistics were systematically criticized and dismissed by French historians. In his comprehensive listing of French statistical sources, Bertrand Gille judges that the external trade statistics are among “the most consistent economic series” while also asserting that “the numbers produced are often fanciful” and “difficult to match” from one document to another (Gille, 1980). On the whole, only those French historians who studied French ports and their hinterland showed any interest in trade statistics (Butel, 1974; Carrière, 1973; Dardel, 1963). These historians were more interested in data on a local rather than a national level. Although the field of economic history was quite different internationally than in France, the lack of interest in trade statistics was almost universal. In most countries, the focus of history departments was on social rather than on economic history per se. Like French historians, they usually preferred to recreate price series and demographic statistics rather external trade ones. England was a notable exception, as the pre-war publications on the English balance of trade (such as Clark, 1938) continued after World War II and thus created a wealth of printed records on English trade (Clark, 1938; Davis, 1954, 1969, 1979; Mitchell, 1962; Schumpeter, 1960). There is no equivalent for other countries during this period. For Sweden, a country with a strong and lively tradition in economic history, we also have a printed summary version of the 5. On the statistical turn in French history, see (Borghetti, 2002). The works of Ernest Labrousse published in this period best illustrate this new paradigm (Labrousse, 1933, 1944).
Eighteenth-century international trade statistics: Sources and methods
balance of trade records (Statistika Centralbyran, 1972; Vallerö, 1969). A third exception is the United States, where the cliometric revolution took place in the 1950s and 1960s. This revolution gave birth to a new kind of economic history that was characterized by the systematic use of quantitative arguments, either in the form of general equilibrium or econometric models, and it made wide use of counterfactuals. Douglass North, one of the leaders of this “new economic history”, released a comprehensive reconstruction of the US balance of payments from the time of Independence to the Civil War (D. North, 1960). However, most cliometric research on globalization or market integration focuses more on the analysis of prices than trade flows (O’Rourke & Williamson, 2002). A partial explanation for the general disinterest of historians is that the necessary technology for making full use of the sources on trade statistics was simply not available even ten years ago. Given the sheer size of the sources for national trade, the collection and organization of trade statistics for early-modern states is a daunting task. Our experience with the French data shows the obvious achieved by using computers, digital photography and internet. The costs of collecting and centralizing all the trade data without these technologies would simply be enormous in terms of both time and money.6 In its current version, our database comprises three hundred thousand observations, each with multiple items of information on geography, quantities or prices and values. When armed with only traditional technologies (paper, pencil and sliderule), one must have a very large team and amount of time to use this information for addressing various research issues. 2.2. Creating research momentum When we began to work on the French balance of trade statistics in the late 2000s, we were quickly convinced that such a project would very much benefit from being put into a European or even global perspective. Without a comparative perspective, we 6. At the end of the 1950s, the historian Pierre Dardel contacted several regional and national French archives to collect as much information as possible on the French balance of trade, as well as more general information on French trade statistics. He ended up with very little, since most of the sources used in Dardel (1963) come from the French National Archives. With more resources, he could have visited archives and collected more, but that would have been a huge undertaking.
15
16
Loïc Charles and Guillaume Daudin
felt that we would run the risk of ending up with results that would have been rich in terms of description, but limited from a more interpretative and theoretical point of view. Furthermore, we believed that, by using mirror trade flows to check trade, our data could improve their credibility. Hence, we took the initiative to establish a pan-European research group devoted to the study of eighteenth-century trade statistics in 2009. This group now includes around 80 scholars from all around Europe. The group met twice in 2011 (Lille and London), in 2012 (Glasgow and Stellenbosch) and once in 2014 (Paris). It has a website that includes a mailing list and a repository of papers on the subject (listes.cru.fr/ sympa/info/18c_trade_data). Since 2009, this network has engaged itself in exchanging information, coordinating research and building common tools that will help the study of trade in eighteenth century European countries within a common framework. This volume is a concrete result of its work. Our first endeavor was to look for ways to develop multiple and similar projects on the balance of trade data in different countries, with the objective of making them compatible at some point in the future. That would have enabled us both to produce a detailed quantitative analysis of early-modern international trade, and to confront and cross-check the data from various countries. It would have provided a completely new source of information for evaluating the quality of the data produced by the different bureaus of balance of trade. It would have also allowed us to assess the importance of illicit trade and contraband, an issue that is still open to debate and very difficult to assess quantitatively. These objectives were at the core of the conference on “European External Trade Statistics, 1700-1830”, which was organized in Lille in March 2011 and where several of the papers assembled here in the questionnaire section were first presented. During the discussions, it became clear that our initial objective was simply too ambitious to be completed in the foreseeable future. Several issues that came to the surface during the sessions show the range and the complexity of methodological problems that our project faced. First, it was obvious that the information available for each country was of a very different nature and quality (see infra Table 2 for details on individual countries). In some cases (e.g., England), the series were continuous or almost continuous, but in most cases (e.g., France)
Eighteenth-century international trade statistics: Sources and methods
they were not. Moreover, even when the series was more or less continuous, the nature of the information recorded often changed over time: sometimes it included values only, sometimes quantities only, and sometimes both. Last but not least, the political frontiers also changed over time in most European countries. Moreover, comparing one set of data to another made it clear that the data were constructed in different ways, with different purposes and by different means in each country. The disappointing conclusion was that it was currently impossible to employ the available sources for constructing a coherent set of data on European external trade. Still, the general feeling of the participants was: 1) there was much more information on early-modern European balances of trade than expected; and 2) even if the aggregation of national data seemed to be a daunting task, it was an interesting and useful challenge. The mixed results of the conference induced us to move into two directions. First, we decided to undertake a multi-country, comprehensive inventory of the sources. Hence, we sent each of the participants and other historians who could not attend a detailed questionnaire on the sources that existed for each earlymodern European country. This questionnaire was set to collect information on the available sources, the institutional setting in which they were processed, and the methods for recording and computing. This was a necessary step before we could even dream of creating a usable database on Europe. This volume is the result of this work. Second, the conference encouraged each researcher to explore in more detail his or her respective set of national data, which in our case was that of France. In this way we could pinpoint the main issues and imagine ways to cope with problems such as missing prices, commodity classification, etc. 2.3. The French case: TOFLIT18 In 2012, we applied for funding for the project “Tools for the study of French External trade, 1716-1830” (TET18). This project was over-ambitious in that its objective was to collect data in parallel for France, Venice, the Austrian Netherlands and Sweden. It was also mainly a data-collecting exercise without a clear interpretative program. It was not funded.
17
18
Loïc Charles and Guillaume Daudin
In 2013, we applied successfully for the funding of another project called “Transformations of the French economy through the Lens of International Trade, 1716-1821” (TOFLIT18). This project aims at improving our knowledge of the pre-industrial French economy by using the statistics produced and collected by the French balance of trade administration. This is not a trivial task. The breadth of the data collected by the French state as well as their complexity made them more difficult to handle. Not only did the political and customs borders fail to coincide, they both changed during the eighteenth century. Moreover, it was much more complicated for economic historians to use the data, due to the significant evolution in customs legislation (the transformation of the Exclusif, free ports, etc.) as well as the fact that a great many of the sources were dispersed during the French Revolution. The data we use here are a representation created by administrative agents with limited resources and specific motivations. We need to understand enough of this creation process and of the motivations driving its actors so that we can control the bias they introduced. More generally, we need to check the data to ensure that they contain enough reliable information to be used safely as a guide to the past. Other objectives of the project are: to check the reliability of data (e.g., the importance of smuggling); more broadly, to account for the difficulties of fitting the realities of merchant activities into administrative categories (as shown in the study of goods in the merchant accounts); to create a reliable and stable list of goods and geographical entities; and to find a unified treatment for the pricing of goods. Beyond these objectives, this project still seeks to compare the French trade data with other databases, specifically: the navigation databases NAVIGOCORPUS (http://navigocorpus.org/) and SoundToll Registers Online (http://www.soundtoll.nl/); other countries’ trade databases (Great-Britain and the Austrian Netherlands); and the merchant activity databases at MARPROF (http://marprof. univ-paris1.fr/). 2.4. The nineteenth century: RICardo Much more is known about international trade in the nineteenth century than in the eighteenth century. Some contributors to this volume have also participated in RICardo7. RICardo (RIC for
Eighteenth-century international trade statistics: Sources and methods
Research on International Commerce) is a database that documents bilateral trade flows around the world, mainly covering the period 1800/30 to 1938. For more than ten years now, the project has mobilized the skills and knowledge of economic historians, statisticians, developers and designers. The original concept for RICardo emerged in 2004 with the realization that all existing historical databases on bilateral trade suffer from various limitations. Either they provide values only for the total trade of various countries, or they cover the period after 1870, or they are limited to a selection of countries or regions. The starting point of the RICardo project was the discovery of a significant and neglected compilation of bilateral foreign trade data, the French Extraits d’Avis Divers, published between 1829 and 1839. Its exhumation prompted a search for all extant publications of commercial statistics from around the world that suggested a great part of archival material had not yet been incorporated into available compilations of world trade statistics. Through funding from the Agence Nationale de la Recherche and Sciences Po, we have built a large bilateral trade database. The outcome of this effort will be the RICardo website dedicated to visualizing bilateral and total trade within a period spanning from the early era of trade globalization to the eve of the Second World War. The RICardo database assembles all obtainable quotations of bilateral imports and exports for the largest possible sample of countries. The current version of RICardo (v1) covers the period 1787-1938 with a total of 267 000 observations, of which 17 000 are missing or null flows8 (1 observation = one annual bilateral export or import flow). Trade flows are not byproducts. Each trade flow links a reporting entity with a partner entity. Reporting entities consist of those entities which collected foreign trade statistics, while partner entities are trading partners they indicate; the two lists differ substantially because reporting entities are sovereign states which collect and publish their foreign trade figures, whereas partner entities listed in the reporting country’s trade documents may be sovereign states or other kinds of entities, such as cities (mainly ports), regions, etc. A total of 1459 different RIC 7. 8.
Thank you to Béatrice Dedinger for allowing us to use her text. Very sporadic information before 1830.
19
20
Loïc Charles and Guillaume Daudin
entities are thus identified and divided up into five types: 361 “city/part of”, 93 “colonial area”, 385 “country”, 88 “geographical area”, and 532 “group”. The names of the entities, particularly of the “country” type, have been translated according to the lists established by the Correlates of War project.9 Original trade flows in different currencies have been converted into current sterling pounds, meaning that the RICardo project also provides a valuable database of historical exchange rates. Access to RICardo data will be made available through a website that should be launched in 2016. One of the main attractions is the creation of visualizations that provide the user with an instant and synthetic view of long-term trade relationships.
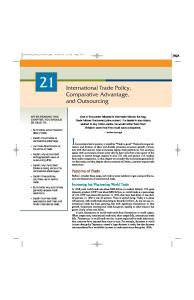
3. The questionnaires 3.1. An overview of the questionnaires The twenty-three country questionnaires form the core of this special issue. They present detailed information on trade statistics and balances from twenty-seven areas. In Map 1: Coverage of the volume (excluding countries discussed in the “missing countries” section), one can see that altogether these areas cover most of the European territory. With the help of the existing secondary literature, we were able to gather information on eight additional areas that we assembled in a specific section dedicated to “missing countries”. Out of these thirty-five countries, nine can be considered to have collected comprehensive balances of trade on a regular basis during the eighteenth century. These are Bavaria, England, France, Habsburg monarchy, Ireland, Scotland, Sweden, the United States and Venice. Nine others produced occasional balance of trade data: Genoa, Milan, Naples, Portugal, Spain, Poland, Prussia, Russia and Switzerland (Bern). Six others – Austrian Netherlands, Danzig, Hamburg, Norway, Sound Toll, and the United Provinces – recorded detailed trade flows, but this information was not framed into a balance of trade. Finally, only scattered data exist on the external trade of the remaining eleven countries: China, Denmark, 9. www.correlatesofwar.org. The relevant database is: Correlates of War Project. 2011. “State System Membership List, v2011.” Correlates of War 2 Project, Colonial/Dependency Contiguity Data, 1816-2002, Version 3.0.
Eighteenth-century international trade statistics: Sources and methods
Hanover, Japan, Livorno, Ottoman Empire, Papal States, Romanian Principalities, Sardinia, Spanish America and Württemberg. We have summarized this information in Table 1: Coverage of the volume and Map 2: Trade data availability. Map 1. Coverage of the volume (excluding countries discussed in the “missing countries” section)
Table 1. Coverage of the volume In the Questionnaires: 27 countries/areas In the “missing countries” section: 8 countries Regular balance of trade data
Occasional balance of trade
Detailed information on trade flows
Occasional data
9 countries
9 countries
6 countries
11 countries
21
22
Loïc Charles and Guillaume Daudin
Map 2. Trade data availability
Balances of trade (≥ 10 years before 1800) Balances of trade (< 10 years) Detailed trade flows Some data Unknown
As can be seen from this map, it is in Germany that information on trade flows is almost completely lacking. With their intricate frontiers and their small administrative means, the small German states that composed most of the Holy Roman Empire were not in position to gather data on trade flows on a regular basis. Moreover, these states were governed by men trained in the cameralist tradition and were more interested in collecting information on the states’ natural resources than on their commerce.10 This was reinforced by the fact that only a small part of the state revenues were based on external customs taxes. The same applied to the Swiss cantons. Finally, as can be seen in Table 2: Summary of the questionnaires below, the quality of information given by the sources differs greatly from one geographical unit to another. 10. On the ideology of eighteenth-century cameralism and its almost exclusive focus on the inventory of natural resources to increase the state’s power, see (Tribe, 1998).
Eighteenth-century international trade statistics: Sources and methods
Taxes on trade are the bedrock of all the early trade statistics featured in this volume. These taxes required record keeping regardless of whether they were tolls (Sound), convoy duties (Hamburg, United Provinces), customs duties (almost everywhere). Records were necessary for checking what the agents on the ground were actually collecting, as for example in the case of legal disputes between them and taxpayers. The state also used the records to monitor firms or institutions that collected taxes in its stead. The importance of these taxes to the revenue of the state differs across countries. It is well-known that they represented a large share of the English state’s income, while it was less important to states with large territories, such as France, Spain and especially the Austrian Empire. However, taxes on external trade represented a significant share of the revenue for most of the earlymodern states. Furthermore, as international trade grew steadily during the entire eighteenth century, the return of taxes on trade increased in absolute value. In a number of instances, records of taxes on trade proved very useful for reconstructing the pattern of trade flows entering and leaving one political space: Hamburg, Naples, the United Provinces, etc. Furthermore, even when those records have been lost, a simple list of customs tariffs can at least give a rough idea of the type of goods that were traded (see the questionnaires on Romanian principalities and Spanish America). However, records of taxes on trade are usually insufficient for reconstructing a comprehensive image of eighteenth-century trade flows, especially not one which allows a rigorous historical and quantitative analysis. First, they are unwieldy affairs that are difficult to transcribe into a useable form for quantitative economic historians, as demonstrated by the difficulties of the very ambitious project concerning the Sound or the Norwegian data. Second, they are often in bad shape. These masses of papers were either thrown away regularly (see the example of the Milanese statistics) or they did not survive historical calamities such as the French Revolution.11 Third, the records of taxes on trade lack a significant amount of relevant information. 11. The revolutionaries dissolved the Ferme Générale, the private firm that collected most of the French taxes, particularly the customs taxes. Such was the popular hatred for the Ferme that a public bonfire of its archives was organized.
23
24
Table 2. Summary of the questionnaires
Austrian Netherlands Bavaria
1759-1791 1765-1799
Region State
No No
China Denmark
Values?
Quantities?
Motivation?
Yes
No
Yes
Policy making
No
p. 225 No breakdown by product
?
p. 391
United Kingdom
1697-1899
State
France
1714-1821 (-)
State
Genoa
16th century1797
Habsburg
1720-1789 (regions) 1790-1918 (aggregate)
Hamburg
1728-1811
No
No
Yes
No
Yes
Yes (-)
Yes
?
p. 393
Yes
Yes
Policy making
p. 379
Yes
Yes (-)
Policy making
p. 237 p. 249
Port
No
No
Yes
Yes
Revenue management
State and region
No
Yes
Yes
Yes
Policy making
Local up to 1776. State from 1776
p. 253
Port
No
No
No
Yes
Revenue management
Data do not cover all goods or partners
p. 265 + p. 180
Yes
Policy making
Hannover
Not much data exist 1698-1829
Region
Yes
Yes
Yes
p. 179 p. 269
Some data in Dutch sources. The only Japanese 18th century sources are for internal trade
Japan
p. 186
p. 393
No
Spanish America
No
Page
Except for the Sound Toll registers, there does not seem to be much data Port
Ireland
Yes
Remarks
Most useable data come from consular reports 1651-1815 ( (with lapses)
Dantzig
By region?
1790-1830
Only partial information (mainly on exports)
Livorno
1680-1845
Mostly navigation statistics (only imports)
Milan
1762, 1766, 1767, 1769, 1778, 1790
State
Yes (-)
No
Yes (-)
Naples
16th century1809. BoT for 1771 and 1772
State
No
Yes
Norway
1731-1828 (with lapses)
Port
Yes
Yes
p. 391 p. 365 p. 281
Yes (-)
Customs duties reform
Balances published unofficially by state employees
p. 289
No
Yes
Revenue management
Published by private initiative
p. 275
Yes
Yes
Revenue management
p. 301
Eighteenth-century international trade statistics: Sources and methods
Country/geograGeographical Period covered By partner? phical area scale
(continued) Table 2. Summary of the questionnaires Country/geograGeographical Period covered By partner? phical area scale Papal states
By region?
Not continuous
Values?
Quantities?
Motivation?
Remarks
p. 307
Not much data exist
Ottoman Ottoman Empire
Page
Most useable data come from consular reports
p. 392
1764-1767, 1786-1790
State
Yes
Yes
Yes
Yes
Revenue management
p. 311
Portugal
1776, 1777, 1783, 1787, 1789, 1796-1831
State
Yes
Yes
Yes
Yes
Policy making
p. 319
State
No
No
Yes
No
?
Prussia
1795-1796
Romanian
18th century
Russia
1758-1766, 1802-1807
State
Yes (-)
Yes
Sardinia Scotland
p. 180
Not much data exist Yes
Yes
p. 335 ?
p. 343
No data seem to exist 1707-1783
Region
Yes
Yes
Yes
p. 393 Yes
Policy making
Data continue well into the 19th c.
p. 345
Sound Toll
1497-1857
Strait
Yes
NA
No
Yes
Revenue management
Spain
1717-1827 (with huge lapses)
State
Yes
No
No
Yes
Revenue management
Only colonial trade before the 1780s
p. 355
Sweden
1739-1809
State
Yes
No
Yes
Yes
Policy making
Local data exist
p. 373 p. 392
p. 295
p. 137
Switzerland
1785
Region (Bern)
No
No
Yes
No
?
Published by an ad hoc private commission. Nothing on the rest of the country
Netherlands
1753, 1774, 1784-1793, 1796-1799, 1803-1809
Mostly regional, some state
Yes (-)
Yes
Yes (-)
Yes (-)
Policy making
Partial regional data before the 1800s
United States
1790-1819
Federal state
Yes
No
Yes (-)
Yes
Policy making
No value for some imports
Venice
1713-1800
State
Yes
Yes
Yes
Yes
Policy making
Württemberg
Not much data exist
Loïc Charles and Guillaume Daudin
Poland
p. 385 p. 392 p. 202
25
26
Loïc Charles and Guillaume Daudin
Fraud and smuggling were not recorded and, furthermore, we know that in some case such (as the US and Hamburg) that data on tax-exempt trade was collected either badly or not at all. Even more problematic is the fact that prices were rarely recorded for goods subjected to quantity-based duties (known as, “specific duties”). Fortunately, a significant number of European countries attempted to gather data on trade and synthesize it into balances of trade. These statistical maps were usually realized at the national level, except in the case of the Habsburg Empire, where a large part of the economic administration – including the recording of external trade – was decentralized at the regional level. In some countries, balances of trade were computed for only a few years, at the initiative of either private individuals (Bern, Milan, and Naples) or the state (Spain, Poland, Prussia, and Russia). In other cases, they were more systematic long-term endeavors guided by the state (Austrian Netherlands, France, Habsburg Empire, Portugal, Sweden, United Kingdom, United States, and Venice). The rationale behind the making of these balances of trade varied. Private individuals created them either as a complement to the general description of a state (as in Naples) or as a contribution to ongoing policy debates (as in Milan). Hence, they were usually published or at least circulated widely at the time. Alternatively, the state used them mainly as an aid for policy making, especially in the context of negotiating international trade treatises. Consequently, they were neither printed nor circulated widely. In the latter case, the small number of copies produced meant that loss or dispersion of some of the original documents occurred in several cases, such as in Portugal and France. Still, even with these partial losses, they provide a much better starting point for reconstructing the pattern of international trade than the records of taxes on trade. However, it must be said that balances of trade were not better than tax records in treating smuggling and fraud: as tax records were the basis for constructing the synthetic documents, any information missing in the former did not appear in the latter. Hence, tax-free imports were not listed in the United States balances of trade, and the United Kingdom synthesis used unchanging official prices for valuation. Likewise, the French synthesis did not include trade from the whole of France. Still, in some cases, extra data were
Eighteenth-century international trade statistics: Sources and methods
researched in order to complete the picture. The authors provided their estimates of missing prices (United States), and sometimes they even asked merchants to check their numbers (Milan). In some cases, the state put in place a complex circulation of data in order to obtain prices from the merchant community (France). In doing so, the French bureau for the balance of trade created sources that were both local and standardized. The central authorities in the Habsburg Monarchy used prices that were different from those of the local authorities, but we do not know much about the exact process. Finally, it must be noted that in the internal debate about the consequences of the Eden Treaty, the French bureau for the balance of trade provided estimates of smuggling and fraud in Anglo-French trade.
It is now time to delve deeper into the sources and to discuss some recurrent themes, which will allow us to better understand the way these sources may be used to reconstruct the pattern of eighteenth-century international trade. 3.2. Thematic issues: 3.2.1. Geography The sources presented in the questionnaires concern various types of geopolitical units. Some cover a single port such as Hambourg or Dantzig. Others cover a region which was either an independent political unit such as Venice or part of a larger empire such as Austrian Flanders. Some others cover an empire or a nation (e.g., France, England). Local statistics are better for geographical analysis (e.g., gravity models), but as they are usually records of taxes on trade, they can be difficult to handle (too micro, no value/prices) and difficult to aggregate. National statistics are easier to use, but they usually bypass some of the information given in the local data. Geography is also important when we consider whether or not a political/geographical unit includes a sizeable land frontier (from an economic point of view), as one would expect that smuggling is easier over land than sea as smuggler benefit from more flexibility in the choice of their itineraries.
27
28
Loïc Charles and Guillaume Daudin
3.2.2. Institutions Although fiscal issues have been crucial in triggering the institutional will to measure interregional/international trade flows, there is a strong distinction between whether the data were collected by local or by national institutions. Data gathered at the various local levels may be aggregated and transformed in such a way that they would provide some sort of balance of trade for a port-region-nation. But they were not recorded for this reason; they were generally compiled for fiscal purposes. Most of the states that set up a balance of trade administration throughout the eighteenth century were motivated by mercantilist objectives. This is self evident in the cases of England and France, the two great economic powers of the time; but Portugal, Prussia, Spain, Sweden and others also emulated these examples. Data produced at the national level were more coherent (units of measure, series, etc.), and the personnel who amassed them were probably more competent. Only the data compiled at the national level can truly be called balance of trade data. 3.2.3. Comparison A major goal of our project is to motivate economic historians to create a common framework for measuring European international trade data. However, in order to compare the data from diverse sources and, better still, to create a common template, we ought to find a way to solve the issue of price. Indeed, in some statistics, prices are simply missing (Austrian Netherlands). In others they were set for long periods of time regardless of real prices (England). Sometimes several different prices coexisted, whether they were local or national prices (e.g., Habsburg Empire). To solve this conundrum, three issues should be addressed. One has to find a common measure between the different units of monetary accounts. They may be converted to grams of silver at par, thanks to existing knowledge of early modern currencies. It would be more difficult to do the same thing for the quantity units and try to reduce them to kilograms, meters and liters. Werner Scheltjens’s paper on this issue is a good illustration of the difficulties underlying such an enterprise. The most difficult task would be to find a common procedure for calculating or recalculating prices in a way that is economically satisfactory. One possibility would be
Eighteenth-century international trade statistics: Sources and methods
to use one set of prices (e.g., Amsterdam prices) and calculate a premium that would include cost of freight and insurance, as computed from the existing prices, and to then impute the prices at other Atlantic ports. The equivalent could also be possible for the Mediterranean (perhaps by using Marseilles or Genoa prices). However, this leaves the issue of prices on land unresolved, as these areas are economically remote from the sea. 3.2.4. Economic issues It is important to underline that the available dataset strongly constrains the scope of economic and historical issues that can be addressed . To take one extreme example, we have only a few balances of trade for the state of Milan, (1762, 1766-7, 1769, 1778 and 1790), each with different sets of information (e.g., only 1766-7 data have descriptions of countries of origin/destination). Overall, these documents provide an interesting snapshot of Milan’s economy during the second part of the eighteenth century, but it is difficult to imagine that they could allow us to go much further. One set of issues that seems quite promising regards geographical economics. This is especially relevant for datasets constructed by ports of trade (e.g., Norway). At the national level, bilateral comparisons may be quite informative. Although the comparison of large economies like France and England may be the first thing that comes to mind, pairs of smaller countries such as Portugal and Sweden may provide interesting insights as well. Bilateral comparisons combined with navigation data may facilitate a much more clear evaluation of the extent of smuggling and the impact of political events, such as wars or trade treaties. When long time series are available, it would be quite interesting to compute indicators of trade specialization, such as the relative contribution to trade balance. This could provide a link to the theme of economic development. Finally, the availability of trade statistics for many countries might allow using mirror trade flows to study the trade of missing sources. For example, we have very little information on trade by the Kingdom of Sardinia, whose economic center was in Piedmont. However, this country’s situation could possibly be approximated by using trade information from France, Genoa and Milan.
29
30
Loïc Charles and Guillaume Daudin
3.2.5. What’s next? As noted by Hubert Escaith, one of the first international collaborations on trade statistics was to unify the different typologies of goods used by various countries. Like nineteenth-century statisticians, we believe that, in order to enable meaningful bilateral and/ or multilateral comparisons, the first step would be to create a unified database for the names of goods, units of physical measures and monetary measures (the last one being simpler than the first two) in different datasets. Such a versatile database would allow the datasets to “communicate with each other”. Two approaches for this are possible. One, we can try a comprehensive approach by creating a database that includes the names of all the individual goods, their descriptions and translations into other European languages, with the same being done for physical/ monetary units of measure. On the one hand, the advantage is obvious: we could coordinate the program with maritime history projects such as Navigocorpus. On the other hand, it is doubtful that this could be done in a reasonable amount of time: it would require a huge team of people from different backgrounds, which implies a large amount of coordination problems and difficulty. However, a limited version may be possible, for example, one that concentrates on creating the descriptions and translation tools necessary for comparisons. In that case, it is important that the work be done in a format that could be easily adapted to the most numerous possible types of research projects. A second possibility is to focus on economic issues only. The database would then follow broad categories rather than individual goods, and it would not feature individual prices but the value of trade per category, as expressed in a common currency. In this approach, the issue of constituting categories (classifying individual goods and pricing them) could be delegated to “national teams”, while coordination would be needed only to define categories and compare results. The two approaches are not mutually exclusive. The former should be considered as a long-term goal framed by a network of different national teams.
Eighteenth-century international trade statistics: Sources and methods
4. The papers In addition to the twenty-three country questionnaires, this issue includes seven articles. Three are methodological, and four illustrate how the available data on external trade can be used to produce new results. 4.1. Methodological articles The article by Hubert Escaith analyzes trade statistics in the longue durée. He argues that they are one of the oldest official statistics. For a long period of time, they remained closely linked to their original eighteenth-century purpose of informing the Prince about the amount of taxes collected by customs. Trade statistics experienced a profound transformation in the mid-twentieth century, when they were integrated into the national accounts that the state required for managing the economy. Escaith argues that we are currently experiencing another period of important changes. Trade statistics are going beyond the initial purpose of service to the state and becoming a tool for understanding the complex relationships that link various industries across different borders. To some extent, historians face a similar issue: how can we use trade data to answer historical questions about eighteenth-century economies and economic relations although they were not produced with that objective? Returning to the actual manipulation of data, Jean-Pierre Dedieu and Silvia Marzagalli’s article looks at the difficult question of the treatment of goods. In the context of ANR-funded projects from 2008 to 2011, they created Navigocorpus, an online database on shipping. This article deals with the way they have processed cargoes and explains the three possibilities their solution offers. First, one can query a field containing a standardized English translation of cargo items. Second, one can create their own classification categories in an “on-the-way coding field” according to the specific needs of their research. Finally, one can query a permanent coding which provides, through a codified string of characters, information on the raw material, elaboration process and use of the product. A few concrete examples illustrate these features. The last methodological paper, by Béatrice Dedinger, conveys a message of hope to all people working with miscellaneous trade
31
32
Loïc Charles and Guillaume Daudin
sources She highlights that no deadlock is implied by the lack of useable German trade statistics for the period preceding German political unification. It is true that the documents published during the Zollverein period by the Central Bureau of the Zollverein, the Statistische Uebersichten über Waaren- Verkehr und ZollErtrag im Deutschen Zoll-Vereine für das Jahr [...], provide neither prices nor trade flows in value, nor do they indicate countries of ultimate origin and destination. To overcome these imperfections, estimates of Zollverein trade statistics have been published in great numbers since 1842, but they are questionable as well. Nevertheless, the good quality of Statistische Übersichten’s quantity data should make it possible to reconstruct consistent series of German trade according to totals, byproducts and values for the period 1834-1871. Even if the period covered by the paper is different from the focus of this issue, it is germane to the discussion on how to combine different data sources in an imaginative way that is on the mind of all those who try to work with early trade statistics. 4.2. Using external trade data: Preliminary findings Considering the difficulty of working with some of our sources, it is fruitful to show how they can nevertheless be used to provide new insights into early-modern European trade. The last four papers of this issue show us that new trade data can indeed shed light on international relations and domestic evolutions. The article by Maria Cristina Moreira, Jari Eloranta, Jari Ojala and Lauri Karvonen looks at the way smaller nations were able to carve out a niche in international trade during a politically turbulent period. By examining new sources in a comparative fashion, it provides new insights into bilateral relations between Sweden and Portugal. They were not equally dependent on their bilateral trade. The French Revolutionary and Napoleonic conflicts were a time of difficulties for both states, but there were also new opportunities that they continued to grab until having to adjust to the intense competition of nineteenth century globalization. The article by Jeroen van der Vliet also discusses ways to combine sources for advancing knowledge, this time on the role that local merchants in Amsterdam played in eighteenth-century entrepot trade to and from the Baltic. The Sound Toll Registers show that the Dutch were driven out of the Baltic by the end of the
Eighteenth-century international trade statistics: Sources and methods
eighteenth century. Looking at the Amsterdam muster roll, it seems that a number of ships may have been Dutch in disguise. Werner Scheltjens also uses the Sound Toll Registers to conduct a quantitative analysis of direct French imports to the Baltic for the period 1670-1850. On the methodological level, the main issue he addresses is in finding a way to aggregate various units of measure. The article brings to light structural changes in the volumes of the main product categories imported to the Baltic. He interprets these changes as the result of reconfiguring the role played by Russian and Prussian ports in the Baltic, the decline of Dutch commercial dominance and the emergence of modern structures for commercial exchange. The final paper, by Ulrich Pfister, assembles indirect evidence from several sources to establish the patterns of international trade in eighteenth-century Germany. It computes the increase in German openness, the growing role of colonial goods in consumption and the importance of import substitution of cotton. The study of trade fits well in the author’s larger project of reconstructing the German economy, whose growth seems to have resulted from increased use of seasonally underemployed labor to produce manufactures for export. This in turn contributed to the stabilization of per capita incomes in the face of declining marginal labor productivity in agriculture. It is our wish that these papers and their innovative use of trade sources will be emulated in a way that deepens our understanding of various economies and their relationships during the eighteenth century. We hope also that the questionnaires will provide useful tools for that endeavor.
Bibliography Acemoglu, D., Johnson, S., et Robinson, J., (2001), “The colonial origins of comparative development: An empirical investigation”, American Economic Review, 91(5): 1369–1401. Allen, R. C., (2003), “Progress and poverty in early modern Europe”, The Economic History Review, 56(3): 403–443. Allen, R. C., (2008), “A review of Gregory Clark’s A Farewell to Alms: A brief economic history of the world”, Journal of Economic Literature, 46(4): 946–973.
33
34
Loïc Charles and Guillaume Daudin
Allen, R. C., (2009), The British Industrial Revolution in global perspective, Cambridge University Press Cambridge. Bairoch, P., (1966), “Originalités et conséquences de la Révolution industrielle”, Diogène, 54: 53–64, avril-juin. Bairoch, P., (1997), Victoires et déboires?: histoire économique et sociale du monde du 16e siècle à nos jours. Berg, M., (2002), “From imitation to invention: creating commodities in eighteenth-century Britain”, The Economic History Review, 55, 1: 1–30. Berg, M., (2004), “In pursuit of luxury: global history and British consumer goods in the eighteenth century”, Past and Present, 85–142. Borghetti, M. N., (2002), “L’histoire à l’épreuve de l’expérience statistique: l’histoire économique et le tournant des années 1930”, Revue d’Histoire des Sciences Humaines, 1: 15–38. Butel, P., (1974), Les négociants bordelais, l’Europe et les îles au XVIIIe siècle, Aubier. Carrière, C., (1973), Négociants marseillais au XVIIIe siècle: contribution à l’étude des économies maritimes, Vol. 2, Institut historique de Provence. Clark, G., (2007), A Farewell to Alms: A Brief Economic History of the World, Princeton University Press. Clark, G. L., Gertler, M. S., et Feldman, M. P. (éd.), (2003), The Oxford Handbook of Economic Geography, New Ed., OUP Oxford. Clark, G. N., (1938), Guide to English commercial statistics, 1696-1782, London: Royal Historical Society. Crafts, N. F. R., (1984), “Patterns of development in nineteenth century Europe”, Oxford Economic Papers, 438–458. Dardel, P., (1963), Navires et marchandises dans les ports de Rouen et du Havre au XVIIIe siècle, Vol. 11, SEVPEN. Davis, R., (1954), “English foreign trade, 1660–1700”, The Economic History Review, 7(2): 150–166. Davis, R., (1969), “English Foreign Trade (1700-1774)”, in W. E. Minchinton (Éd.), The Growth of English Overseas Trade in the Seventeenth and Eighteenth Centuries, p. 99–118, London: Methuen. Davis, R., (1979), The Industrial Revolution and British Overseas Trade, Leicester: Leicester University Press, Humanities Press Inc. De Vries, J., (2008), The industrious revolution: consumer behavior and the household economy, 1650 to the present, Cambridge University Press. Findlay, R., et O’Rourke, K. H., (2007), Power and Plenty: Trade, War, and the World Economy in the Second Millennium, Princeton University Press. Galor, O., (2011), Unified growth theory, Princeton University Press. Gille, B., (1980), Les sources statistiques de l’histoire de France, Genève, Droz.
Eighteenth-century international trade statistics: Sources and methods
Heckscher, E., (1919), “Utrikeshandelns verkan pa inkomsstfördelningen. Nagra teoretiska grundlinjer”, Ekonomik Tidskrift, 21, part II, 1–32. Heckscher, E. F., et Ohlin, B., (1991), “The effect of foreign trade on the distribution of income”, in Heckscher-Ohlin Trade Theory, Cambridge: MIT Press. Jacks, D. S., Meissner, C. M., et Novy, D., (2011), “Trade booms, trade busts, and trade costs”, Journal of International Economics, (83)2: 185– 201. Kutz, M., (1974), Deutschlands Aussenhandel von der französichen Revolution bis zur Gründung des Zollvereins. Eine statistiche Strukturuntersuchung zur vorindustriellen Zeit, in VSWG, cahier 61, 1974., VSWG: Vierteljahrschrift für Sozial- und Wirtschaftsgeschichte (supplement). Labrousse, E., (1933), Esquisse du mouvement des prix et des revenus en France au XVIIIe siècle, Paris: Dalloz. Labrousse, E., (1944), La crise de l’économie française à la fin de l’Ancien Régime et au début de la Révolution, Vol. 1, Paris: Presses universitaires de France. Mantoux, P., (1905), La révolution industrielle au XVIIIe siècle : essai sur les commencements de la grande industrie moderne en Angleterre. McCloskey, D. N., (2010), Bourgeois Dignity: Why Economics Can’t Explain the Modern World, University Of Chicago Press. Mitchell, B. R., (1962), Abstract of British historical statistics, Vol. 1, CUP Archive. Mokyr, J., (2004), The gifts of Athena : historical origins of the knowledge economy. Mokyr, J., (2010), The enlightened economy: an economic history of Britain, 1700-1850, Yale University Press. North, D., (1960), “The United States balance of payments, 1790-1860”, in Trends in the American economy in the nineteenth century, p. 573–628, Princeton University Press. North, D. C., (1973), The rise of the Western world: a new economic history / Douglass C. North and Robert Paul Thomas. O’Brien, P., (2011), “The contributions of warfare with Revolutionary and Napoleonic France to the consolidation and progress of the British Industrial Revolution”, LSE Economic History Departement working papers, 150/11. Ohlin, B., (1933), Interregional and international trade, Harvard University Press, Cambridge, MA. O’Rourke, K. H., De La Escosura, L. P., et Daudin, G., (2010), “Trade and Empire, 1700-1870”, in K. O’Rourke & S. Broadberry (Éd.), The Cambridge Economic History of Modern Europe, vol. 1 1700-1870, Cambridge University Press.
35
36
Loïc Charles and Guillaume Daudin
O’Rourke, K. H., et Williamson, J. G., (2002), “When did globalisation begin?”, European Review of Economic History, 6(01): 23-50. Pollard, S., (1981), Peaceful Conquest: The Industrialization of Europe, 17601970, Oxford ; New York: Oxford University Press. Pomeranz, K., (2000), The great divergence: China, Europe, and the making of the modern world economy, Princeton University Press. Pomeranz, K., (2009), La force de l’empire : révolution industrielle et écologie, ou pourquoi l’Angleterre a fait mieux que la Chine / Kenneth Pomeranz ; introduction, Philippe Minard ; [traduction, Vincent Bourdeau, François Jarrige et Julien Vincent]. Ricardo, D., (1817), Principles of Political Economy and Taxation, London: John Murray. Robinson, J., Acemoglu, D., et Johnson, S., (2005), “The Rise of Europe: Atlantic Trade, Institutional Change, and Economic Growth”, The American Economic Review, 95: 3. Roche, D., (1989), La culture des apparences : une histoire du vêtement : 17e18e siècle, Fayard., Paris. Roche, D., (1997), Histoire des choses banales : naissance de la consommation dans les sociétés traditionnelles (17e-19e siècle), Paris: Fayard. Roitman, J. V., Pétré-Grenouilleau, O., et Emmer, P. C. (éd.), (2006), A deus ex machina revisited: Atlantic colonial trade and European economic development, Brill. Schumpeter, E. B., (1960), English overseas trade statistics 1697-1808, Oxford: Clarendon Press. Statistika Centralbyran, (1972), Historisk statistik för Sverige Del 3 Utrikeshandel 1732-1970-1972. Tribe, Keith (1998), Governing Economy. The Reformation of German Economic Discourse 1750-1840, Cambridge: Cambridge University Press. Vallerö, R., (1969), Svensk handels-och sjöfartsstatistik 1637-1813: en tillkomsthistorisk undersökning, Statistiska centralbyr\a an. Various, (2008), “Symposium on Gregory Clark’s A Farewell to Alms”, European Review of Economic History, 12(2): 137. Williams, E. E., (1944), Capitalism & slavery, UNC Press Books. Wrigley, E. A., (2010), Energy and the English Industrial Revolution, Cambridge: Cambridge University Press.
Part 1
PAPERS
Past and present issues in trade statistics: An insider’s view . . . . . . . 41 Hubert Escaith Dealing with commodities in Navigocorpus Offering tools and flexibility . . . . . . . . . . . . . . . . . . . . . . . . . . . . . . . 55 Jean-Pierre Dedieu and Silvia Marzagalli Trade statistics of the Zollverein, 1834-1871 . . . . . . . . . . . . . . . . . . . 69 Béatrice Dedinger Early modern trade flows between smaller states: The PortugueseSwedish trade in the eighteenth century as an example . . . . . . . . . . 89 Maria Cristina Moreira, Jari Eloranta, Jari Ojala, and Lauri Karvonen One source to rule them all? Combining data about trade and shipping from Amsterdam to the Baltic in the late eighteenth-century . . . . . .113 Jeroen van der Vliet French imports to the Baltic, a quantitative analysis . . . . . . . . . . . 139 Dr. Werner Scheltjens The quantitative development of Germany’s international trade during the eighteenth and early nineteenth centuries . . . . . . . . . . 177 Ulrich Pfister
Revue de l’OFCE, 140 (2015)
PAST AND PRESENT ISSUES IN TRADE STATISTICS AN INSIDER’S VIEW Hubert Escaith World Trade Organization
Trade statistics are perhaps among the oldest official statistics alongside population censuses. Until very recently, trade statistics remained closely tied to their original eighteenth-century purpose of informing the Prince about taxes collected by customs officials; more recently in the mid-twentieth century, they came to serve also in establishing the National Accounts required by the State for managing the economy. Then the world economy became truly global. Trade statistics had to become trans-national and multi-dimensional if they were to be representative of the twenty-first century economic system. The methodology has matured in the 2010s; in the process, trade statistics have gone beyond their initial purpose of serving the State to become a tool for understanding the complex relationships linking various industries across different borders. The resulting information is increasingly used to assess not only the economic dimensions of trade but also its implications in terms of employment and the environment. Keywords: administrative history, international trade statistics, globalization, economic history
T
his special issue discusses the “birth” of official statistics, and trade statistics are among the oldest official statistics available. This paper provides some perspective on how official public trade statisticians perceive the nature of their activities and their history. It also reflects on the current debates among official statisticians and how the changes in their practices and conceptions can inform our views on past statistics. The final section highlights the changes now taking place in the theory and practice of trade statistics. e-mail:
[email protected]
Revue de l’OFCE, 140 (2015)
40
Hubert Escaith
1. Past approaches to official statistics Modern statistics, as a science, was born in the seventeenth century with the rise of experimental approaches, including the interest in repeatable experiments and control groups (Devlin, 2008; Hacking, 2006). Interpreting and deriving inferences about the numbers produced by experiments was made possible by the progress in understanding probabilities, in which the pioneers were Blaise Pascal, Pierre de Fermat, and Christian Huygens. Those breakthroughs were consolidated in the eighteenth century into two schools of thought, one led by Jacques Bernoulli (Loi des Grands Nombres) based on the objective observation of frequencies derived from independent repeated events (giving the name of “frequentists” to this school of statistics) and the other derived from Thomas Bayes’s work in which a priori inferences (subjective probabilities) are revised by observations. This divide between “frequentists” and “subjectivists” (or Bayesians) still exists today. Statistics as an aid to decision-making is often of the subjective type: decisions are based on partial belief rather than full knowledge built from the frequency of events. This type of statistics is especially relevant for private business where the entrepreneur innovates and therefore, past observations are of little help in building long-term scenarios in the presence of uncertainty.1 Public sector statisticians, on the contrary, prefer to avoid subjectivity in their professional work, leaving that to the policy makers. Hence, they avoid the use of statistics and if they must use them, they prefer the frequentist approach. Avoiding statistics may seem a counterintuitive aim for a public sector statistician producing official statistics. Let me explain. For a mathematician, a statistic is a number with an associated distribution of probability.2 “Probability” leads to “contestability”; the number has to be contestable in the etymological sense: it should 1. Uncertainty arises when inferences based on observed events are no longer reliable predictors of future events. The traditional frequentist approach, based on extrapolating observed data, fails to provide a robust forecast when the future cannot be modeled as a repetition of the past. 2. More formally, data result from the observed occurrences of an unknown “Data Generating Process”. These observations may appear randomly (as when a sample of households is taken out of a given population) and are affected by additional measurement errors. Data in statistics are always tentative unless they are from a complete and error-free enumeration (e.g. an exhaustive population census).
Past and present issues in trade statistics: An insider’s view
be tested and called into question. And calling an official statistic into question is not something that public sector statisticians very much care for. The dislike for probability in our profession can be related to the epistemological differentiation of “statistics as a science” (actually, a branch of applied mathematics) and “statistics as an instrument at the service of the Prince” (and later the State) (Porter, 1980). This big divide marked our profession at least up until the second half of the nineteenth century. It was perhaps sharpest in Germany, according to Desrosières (2010). The German approach to statistics (circa 1660) was to map and organize the territory in order to measure the wealth of the Prince and his State – which included the individual wealth of the Prince’s subjects. A further goal was to help the State in collecting taxes and levying soldiers. These statistics resulted in a holistic yet diversified recognition of the fragmented empire that emerged after the Thirty Years War. The two pillars of German statistics were “Classification” and “Systematic Data Collection”, Desrosières (2010).3 “Systematic” meant that no place should be given to chance or probability. This could most easily be achieved by using exhaustive censuses and well-maintained administrative registers. In some ways, official statistics were nothing more (or nothing less) than an endeavor to translate into numbers a textual narrative that reflected both the whole (the Empire) and the parts (the microstates that composed the Empire). Surveys looked like a collection of monographs. It would have been a heresy for a seventeenthcentury German statistician to refer to the “average German county” or the “average German subject”. Like God, the Prince was supposed to be able to comprehend the universe both in its totality and in the details of each one of its numerous components. French practices were close to those of the German school, even though the kingdom of France was much more centralized than the German Empire. Ever since Richelieu and Colbert, intendants, holders of a public administrative office, were tasked with keeping track of what was going on in their province and informing the King. From Colbert onward, these reports were increasingly stand3. Desrosières (2010) ascribes the term “statistics” to Achenwall (1719–1772) of Gottingen University where the German school matured.
41
42
Hubert Escaith
ardized, leading to the development of systematic accounting procedures that aimed at erasing local particularities. Those reports remained confidential, Gilles (1964). At about the same time (circa 1660), a different approach to statistics was developing in England. This approach is often described as “political arithmetic”. It was more closely linked with a precise objective (e.g. the establishment of mortality tables) rather than the completion of a holistic quest.4 It was also more prescriptive than descriptive. Because of the more liberal organization of society, and also because English precursors were more often scientists than civil servants, English statisticians looked beyond the administrative registers to make inferences about unobserved data. Among the techniques inherited from the English school is the concept of “multiplier of population”, to be used when no population census is possible or accepted, Rohrbasser (2005). The method extrapolates the total population on the basis of a few limited censuses in some counties plus administrative registers related to births. This was the ancestor of what statisticians today call the “sampling approach” to data collection, based on samples defined on the basis of their probabilistic properties. The co-existence of the German and English approaches helps identifying a point of tension in official statistics: is exhaustiveness important? To put it another way, is an average truly representative? It is only at the end of the nineteenth century that Adolphe Bertillon brought some clarification to the various meanings of “average”.5 In modern official statistics, both exhaustive and probabilistic approaches coexist. My subjective opinion (I am a Bayesian by training) is that, on the one hand, public servants would rather deal with “administrative registers” that are cheaper to manage in the long run and closer to the public administration perspective. For example, the German approach to statistics 4. Needless to say, our presentation omits many details since some influential authors on political arithmetic, such as William Petty, favored a more holistic approach and exhaustive censuses. However, it is fair to say that the probabilistic approach to official statistics first arose in England in the context of political arithmetic. 5. Bertillon distinguished “objective average” (repeated measures of a physical object of fixed – yet unknown – dimensions), “subjective average” (what a modern statistician would refer to as the mean value of a sample when its probabilistic characteristics are known), and “arithmetic mean” of disparate objects, where the notion of average does not carry any objective value.
Past and present issues in trade statistics: An insider’s view
prevailed in the Soviet Union: most if not all of the data collected there were not “statistics” but streams of administrative data collected by local authorities and compiled by the line ministries. On the other hand, statisticians tend to prefer the design of sampling where they can use their scientific training (unless they become managers and set about reducing operating costs).
2. The importance of taxonomy for the history of trade statistics A second legacy, more specific to the German school (translating the various specificities of a territory into descriptive numbers), is the quest for representative classifications and nomenclatures. It is perhaps not surprising that one of the main contributors to taxonomy was the seventeenth-century German mathematician and philosopher, Gottfried Leibniz. His aim was to define a universal coding structure able to express various concepts. Modern statisticians are still busy today developing and adapting classifications, and it is an important issue if trade statistics are to be internationally comparable. This has been a crucial area in the history of trade statistics. Much of the action in the history of trade statistics is linked to the history of tariff nomenclatures, as the data collection aspect of these administrative registers has not changed much until recently (even if, as we shall see, things are now changing rapidly). From an international perspective, the first serious attempts to harmonize tariff classifications internationally date back to the mid-nineteenth century. Harmonization was both a scientific and an economic objective. Using common standards and classifications facilitates the crossing of borders. The following timeline details the main steps in the evolving measurement and classification of world trade statistics (Asakura, 2003; Nakagawa 2011). — In 1853 an International Statistical Congress, held in Brussels, debated the necessity of unifying customs schedules. — In 1889 the International Trade and Industry Congress, held in Paris, adopted a resolution to employ uniform nomenclature.
43
44
Hubert Escaith
— In 1906 the second International Congress of Chambers of Commerce and Commercial and Industrial Associations, held in Milan, issued a Recommendation calling for common classification in customs tariffs. After World War I, the League of Nations made efforts to reduce customs duties and tariff barriers; in the process, the period marked the opening of the age of international cooperation with respect to customs and tariffs statistics. Most – if not all – of the procedures were aimed at standardizing the statistical dimension of the administrative registers collected by participating countries as well as facilitating trade between nations. — In 1923: the International Convention for the Simplification of Customs and other Formalities was established. — In 1927: the World Economic Conference of the League of Nations held in Geneva examined the simplification of customs tariffs and unification of tariff nomenclatures. The League of Nations established a Sub-Committee of Experts for the Unification of Customs Tariff Nomenclatures. — In 1931: A draft customs nomenclature (Geneva Nomenclature) was established by the Sub-Committee of Experts for the Unification of Customs Tariff Nomenclatures. — In 1937: the Geneva Nomenclature was revised. The expansion of its usage was stopped by the breakout of World War II. The modern nomenclatures and classifications were developed in the post World War II period, both by the United Nations and the World Customs Organization. — In 1948 a Customs Committee was set up by the European Customs Union Study Group under the auspices of the Committee of European Economic Cooperation and formulated a new tariff schedule based on the Geneva Nomenclature. It was called the Brussels Tariff Nomenclature (BTN). It also developed a definition of values for customs valuation. — In 1952 the Convention establishing the Customs Co-operation Council (CCC) came into being. In 1955, the BTN was revised following a review of its method of classification and methodology.
Past and present issues in trade statistics: An insider’s view
— In 1959, the Convention on the Nomenclature for the Classification of Goods in Customs Tariffs (the Nomenclature Convention), including the revised BTN, was applied internationally. — In 1974 BTN was renamed the Customs Cooperation Council Nomenclature (“CCCN”). — In 1983, the International Convention on the Harmonized Commodity Description and Coding System (“HS Convention”) was adopted. It became effective in January 1988. Today, custom statistics are compiled according to the 2012 version of the Harmonized System (HS). The Harmonized System is administered by the World Customs Organization and is updated approximately every five years.
3. New issues in trade statistics While trade statistics were considered a “mature” branch of official statistics, things began to change with the transformation of the nature of trade. The first driver of change was the rise of services as an important source of export revenues; the second was the socalled “Third Industrial Revolution” with the international fragmentation of manufacturing activities along global value chains. 3.1. Trade in service statistics The history of trade in services statistics is quite different from the history of trade in goods statistics, as governments do not collect taxes on services trade. Taxes being the best friends of official statisticians, the quality and coverage of these statistics on services are much poorer. The compilation of trade in services is closely related to the Balance of Payments manual edited by the International Monetary Fund. The earliest coordinated attempt at unifying the statistical methodology is found in the first edition of the Balance of Payments Manual in January 1948. This effort was a continuation of the work by the League of Nations to develop guidelines for balance of payments statistics. Today, the Manual is in its sixth revision, in parallel with the updating of the System of National Accounts in 2008.
45
46
Hubert Escaith
But balance of payment statistics are not detailed enough to provide a clear view of the economic importance of trade in services. They traditionally cover three broad categories: Transport (closely related to trade in goods), travel (of persons) and others (business statistics, etc.). With the signature of the Uruguay Round and the General Agreement on Trade in Services (GATS) that was applied from 1995 on, trade negotiators have required more detailed information on trade in commercial services. The job of developing international concepts, definitions, and classifications for trade in commercial services was attributed to a “Task Force” established by the UN Statistical Commission in 1994. In 2010 the Statistical Commission validated the latest revision of the Manual on Statistics of International Trade in Services. 3.2. “Trading tasks” in the twenty-first century: the end of traditional trade statistics? Most of these efforts may appear obsolete when one realizes that the nature of international trade has changed dramatically since the mercantilist era. In the pre-globalized world, it was difficult to separate production and consumption across space because of poor transportation technology. Most trade took place on village market squares, putting the producer and the consumer in direct relationship. Only the most precious items were traded internationally. The Industrial Revolution and the invention of the steam engine broke the overwhelming unity of space between production and consumption. By reducing transportation costs in time and money, railways and steamers promoted the mass consumption of goods produced far away. But most of what was exported by a given country was actually produced in that same country, or at least made from imported primary goods. In fact, the Industrial Revolution took root in countries that had coalmines and, to a lesser extent, iron ore to make the manufactured goods. Countries exported goods they themselves produced, sometimes with the input of certain primary goods imported from less developed areas – often their own colonies. In the nineteenth century, when Ricardo developed what were to become the foundations of international trade theory, the Portuguese entrepreneur importing a steam engine from England would know that everything from the steel of the wheels to the boiler
Past and present issues in trade statistics: An insider’s view
pressure gauge came from Great Britain. Similarly, an English club importing Port wine for its members could be sure that it came from Portugal. Today, if Port wine is still of Portuguese origin, the concept of country of origin for manufactured goods has gradually become obsolete. Through outsourcing and offshoring, the geographical fragmentation of the various operations, from the design of the product to the manufacture of the components, assembly, and marketing have spread across the world, creating international production chains. Nowadays, as the WTO proclaims, more and more products are “Made in the World” rather than “Made in the UK” or “Made in France”, (Jara et al. 2012). Trade in tasks is very much in tune with the idea of a smaller world, where traditional boundaries and distances are collapsing and human societies interact as closely across oceans as they did among villages in the Middle Ages. When goods are “Made in the World”, traditional statistics that are based on customs records of international transactions in merchandise cannot reflect the actual origin of the value-added embodied in the final goods. Economically speaking it becomes meaningful to split these flows into intermediates – goods that are further used in the production process – and goods for final consumption. The specific contribution made by each country participating in the chain has to be identified in order to avoid double counting and properly identify the origin of the value-added. To take a famous example of a globally manufactured good, if we want to assign to each country of origin the value-added imbedded in an iPad imported by the U.S. from China (traditional trade statistics), we must be able to measure how much comes from China, Japan, or Korea, and, of course, from the US itself. This new “international trade in tasks” calls for a new measurement of international trade focusing on the value-added content – or domestic content – of trade flows. Interestingly enough, national statisticians alone cannot compute these statistics as they need information from other trade partners. Trade in value-added is truly global. In this process, the traditional distinction between goods and services has become increasingly blurred. When statisticians have to identify each country’s contribution to global production chains, every good boils down to an assemblage of manufacturing and business services. Indeed, another way of describing the new
47
48
Hubert Escaith
nature of trade along global value-added chains is to refer to trade in tasks, where each country/industry makes its contribution as a specific task, from research and development to manufacturing or after-sale services. The approach favored by international statisticians up to now (but this is a very young field of work and things may change rapidly) makes use of existing trade and national accounts data (see Daudin et al. (2011) for an example based on non-official statistics). It is only recently that comparable global indicators based on official statistics have been made available (2012 for the WIOD project; 2013 for the OECD-WTO TiVA database). Those results capture the main effects of global manufacturing in the twenty-first century. They redistribute the relative weights of goods and services and of bilateral trade imbalances. Trade in value-added also helps in apprehending the direct and indirect impacts of tariff policy on the effective rate of protection received by industrial sectors and the additional costs borne by services. The existing indicators on trade in value-added still suffer from serious shortcomings. While they provide very valuable information about the relationship between international trade and economic development, available databases developed on official data still need to be extended in order to cover all developing and least developed countries. The present trend is to go beyond inputoutput tables and to base TiVA estimates on Supply and Use Tables. This simplification opens the way for the inclusion of more countries and more frequent updating of the official datasets. Furthermore, for trade analysts used to working at the very detailed levels of the Harmonized System (HS6 digit or more) when analyzing the impact of tariff and non-tariff measures, trade in value-added information is still excessively aggregated. This is especially important as the new theoretical models of international trade place great emphasis on the heterogeneity of firms (Escaith, 2014). Firms that are active on the international market are often larger and technologically more advanced than firms producing for domestic use only. In addition, exporting firms tend to make more intensive use of imported inputs, especially in developing countries. All those characteristics have important implications and may lead to substantial aggregation bias if ignored. To return to the seventeenth century debates that opposed the exhaustive
Past and present issues in trade statistics: An insider’s view
and probabilistic approaches to official statistics: there is no such thing as a “representative firm”, at least if one stops at the traditional classification of the UN System of National Accounts. One could either try to disaggregate as much as possible – which might run into decreasing returns to scale – or introduce a probabilistic approach to trade statistics, based on prior inferences.6 The new frontier for trade statisticians lies therefore in (i) developing micro-databases to fully capture the heterogeneity of firms that are active in these global value chains, and (ii) incorporating heterogeneity into the input-output models, for example by differentiating firms by size or by their export-orientation (often leading to the same sub-sets). Thanks to the excellent reception of the new datasets and the support received from the G-20 in 2012, the research program on global value-chains is now firmly rooted in the working program of international statistics. A recent initiative by the UN Statistical Commission to develop international recommendations for developing new indicators on International Trade and Economic Globalization based on the global value chain concept is a significant step forward in this direction.
4. Conclusion Trade statistics – the collecting of import and export data – is firmly and deeply rooted in the German tradition. The collection of these data was vital for the Prince, as duties paid on shipments served as a significant source of revenue for the State, and trade restrictions were a key ingredient in the Prince’s internal and external strategy. Actually, for the mercantilists, trade was just another way of waging war, or, at least, financing the war effort. Even if the bellicose purpose of trade is not as prominent nowadays as it was for the mercantilists (following the hypothesis of “sweet commerce”, some modern politicians even advocate trade on the basis that countries which trade among themselves do not make war),7 the fiscal dimension is still here, especially in countries with limited tax-collection capacities. In many places, 6. For example, we know that exporting firms are usually large; moreover, most industrial surveys include some indicator of size (number of employees, turnover, etc.). An a priori disaggregation of industrial surveys between exporting and non-exporting firms could be based on firm size.
49
50
Hubert Escaith
statistical statements on imports and exports are based on administrative registers maintained by customs administrations that belong to the ministry of finance. The first difficulty for the continuation of this tradition is the renewed interest in trade in services and trade in tasks. It is not clear whether the exhaustive approach can satisfy the curiosity of the researcher and the public on these issues. In addition, the way official statisticians interpret their social role is changing. Since its inception and until very recently, official statistics was considered a function of the State in the service of the Prince. That can be seen in all the examples of trade statistics that are given in this special issue. In the second half of the twentieth century, and more specifically in the 1990s, official statistics came to be viewed as a public good for the benefit of all citizens. Today, there is an increasing need to serve different users and adapt production to their needs. Official statistics are not only required to be representative, but also transparent and “customized”. Transparency has both political and technical dimensions; the technical dimension is easily dealt with through best practices and international quality frameworks accepted by all professionals, but impeccable quality does not always solve the political issue of trust and (mis)perceptions. The increasing demand for micro data reflecting the diversity of civil society, sends us back – after two centuries – to the old controversy of unrepresentative averages. Eighteenth-century trade statistics were incomplete and of poor quality. The exhaustive, German tradition cannot be used to interpret them. Historians, like modern day statisticians, have to be more like the English pioneers and look at all the contextual data that can be used to extrapolate the partial statistical information available and to understand the bigger picture. They must also be sensitive to the issues of transparency so that their work can be useful to the whole research community and even to the wider public.
7. This idea is present from Montesquieu to Mill on the liberal side, and was also expressed by Kant in his late eighteenth-century essay On Perpetual Peace in which he argued that commerce is incompatible with war. On the development of this idea, see Hirshman (1977).
Past and present issues in trade statistics: An insider’s view
5. Bibliography Asakura H., (2003), World History of the Customs and Tariffs, World Customs Organization. Daudin, G., C., Rifflart and D. Schweisguth, (2011), “Who produces for whom in the world economy?”, Canadian Journal of Economics, 44(4): 1403-1437. Desrosières, A., (2010), La politique des grands nombres: histoire de la raison statistique, La Découverte. Devlin, K., (2008), The Unfinished Game: Pascal, Fermat and the Seventeenth Century Letters that Made the World Modern, Basic Books. Escaith, H., (2014), “Mapping global value chains and measuring trade in tasks” in Ferrarini and Hummels (eds), Asia and Global Production Networks: Implications for Trade, Incomes and Economic Vulnerability, Asian Development Bank and Edwards Elgar Publishing. Gille, B., (1964), Les sources statistiques de l’histoire de France. Des enquêtes du XVIIe siècle à 1870, Librairie Droz, Genève. Hacking I., (2006), The Emergence of Probability: A Philosophical Study of Early Ideas about Probability, Induction and Statistical Inference, Cambridge University Press, Cambridge. Hirshman A., (1977), The Passions and the Interests: Political Arguments for Capitalism before its Triumph, Princeton University Press, Princeton. Jara A. and H. Escaith, (2012), “Global value chains, international trade statistics and policy making in a flattening world”, Journal of World Economics, Vol. 13, 4, October-December. Nakagawa J., (2011), International Harmonization of Economic Regulation, University Press, Oxford. Porter, T., (1980). The Rise of Statistical Thinking, 1820–1900, University Press, Princeton. Rohrbasser, J.-M., (2005), « Commet compter la population ? La méthode du multiplicateur aux XVIIe et XVIIIe siècles », Population & Sociétés, n° 409, février.
51
DEALING WITH COMMODITIES IN NAVIGOCORPUS OFFERING TOOLS AND FLEXIBILITY
Jean-Pierre Dedieu Framespa (CNRS – Université Jean Jaurès, Toulouse) IAO (CNRS – Université de Lyon)
Silvia Marzagalli Centre de la Méditerranée Moderne et Contemporaine, Nice Institut Universitaire de France
From 2008 to 2011, we created Navigocorpus, an online data-base on shipping. While conceiving the data-base structure, we aimed at preserving data as close as possible to the way they appear in the sources – spelling and languages included – but also at developing a series of tools to handle the mass of data stored in the database. This paper deals with the way we processed cargoes and explains the three possibilities we offer to users. First, they can query a field containing a standardized English translation of cargo items. Secondly, they can create their own categories of classification in a on-the-way coding field, according to the specific needs of their research. Finally, they can query a permanent coding which provides, though a codified string of characters, information on the raw material, elaboration process and use of the product. A few concrete examples illustrate these features. Keywords: eighteenth century, navigation statistics, Europe, economic history, commodity classification, database, standardization.
e-mail:
[email protected];
[email protected]
Revue de l’OFCE, 140 (2015)
54
Jean-Pierre Dedieu and Silvia Marzagalli
F
rom 2008 to 2011, the French Agence Nationale de la Recherche sponsored a research project called Navigocorpus.1 The program aimed at creating a common database on shipping to cope with different kinds of sources related to ship voyages and to provide, both through the density of information and through the facilities it offers to researchers, a useful online tool for new research in maritime history. The database was designed to allow the integration and preservation of existing databases created by individual researchers and the collection of new information.2 The general philosophy of the project relies on two different and apparently contradictory goals: on the one hand, we provide data as close as possible to the way they appear in the sources; on the other, we developed a series of links and fields which transform the database into something radically different from a collection of loose data. For instance, we provide ships and captains with an identifier, so that it is possible to track them easily through different sources. Finally, we developed a series of tools to handle the mass of data stored in the database. Navigocorpus at present (October 2014) contains information on over 75,000 ship voyages in the eighteenth and nineteenth centuries. Creating the database has been a challenge for two main reasons: first, contrary to most database projects, Navigocorpus was not conceived or structured to answer a specific research question or set of questions. We were therefore obliged to keep the structure as flexible as possible so that researchers might easily retrieve and 1. Navigocorpus (“Corpus des itinéraires des navires de commerce, XVIIe-XIXe siècles” “Database on the Itineraries of Merchant Ships, 17th-19th Centuries”) is a research project sponsored by the French Agence Nationale de la Recherche (ANR-07-CORP-028) and coordinated by Silvia Marzagalli (Centre de la Méditerranée Moderne et Contemporaine, Nice) in collaboration with Jean-Pierre Dedieu (at that time, Laboratoire de Recherche Historique Rhône-Alpes, Lyon) and Pierrick Pourchasse (Centre de Recherche Bretonne et Celtique, Brest). Werner Scheltjens worked on this program as a post-doctoral fellow from 2008 to 2010. The database is available online at http://navigocorpus.org/. More on this project at http:// navigocorpus.hypotheses.org/?lang=fr_FR. 2. The main theoretical problems we faced and the solutions we elaborated have been presented in a joint paper: Jean-Pierre Dedieu, Silvia Marzagalli, Pierrick Pourchasse and Werner Scheltjens, “Navigocorpus, a database for shipping information. A methodological and technical introduction”, International Journal of Maritime History, XXIII, No 2, December 2011, p. 241-262. See also, by the same authors, “Navigocorpus at Work. A Brief Overview of the Potentialities of a Database”, International Journal of Maritime History, XXIV, No 1, June 2012, p. 331-359.
Dealing with commodities in Navigocorpus: Offering tools and flexibility
handle the data they need for their specific research goals. Second, Navigocorpus is an open database in which new data can be added at any moment. In order to go beyond the simple digitalization of sources and to make their content manageable to researchers, we had to develop fields and tools for selecting and handling data according to their needs. The result is a powerful engine for research in maritime history, although its complexity requires that one has a good understanding of the database structure before he/ she be able to extract information efficiently. We believe that some of the solutions we adopted might be useful to other research projects facing similar issues. This paper deals specifically with the way we processed cargoes. Colleagues dealing with merchant accounts or balances of trade statistics face the same challenge as maritime historians: how should they best make hundreds of different terms manageable? Navigocorpus provides researchers with a considerable amount of data on cargoes and the circulation of products in time and space. At the moment, the database contains 98,000 records, written with 5,000 different spellings, related to commodities. Data have been collected in five languages (Danish, English, French, Italian and Spanish). We present here the general features of the database and the choices we made in order to process cargo-related data. We will take a few examples – notably in the category “fish”, which illustrates the complexity of dealing even with apparently simple categories. Before going into detail about how we handled cargoes, it is useful to understand that Navigcorpus is structured around the points the ship touched during its journey. A point is defined as a place (which we geo-referenced) through which a ship sailed, characterized by a date and an action (entering, clearing, passing through, etc.). The points are chronologically ordered and stored in a specific table. Information on the ship, captain, crew, cargoes, taxes, etc., are linked to the different points to which they pertain. Most sources we inserted into Navigocorpus provide some information on the cargoes. We created a cargo-table in the database and inserted cargo items as individual records linked to the point to which information is related: a cargo entering the port of Marseille on a ship coming from Smyrna is linked to Marseille. We defined an item as a product stated by the source and expressed with the same unit of conditioning, weight or price. A ship cargo
55
56
Jean-Pierre Dedieu and Silvia Marzagalli
listed by the source therefore originates as many records in the cargo table as the combination of items/units of measure. The 57 bundles and 280 bales of nankeens entering Bordeaux on 28 September 1805 on the ship Charlotte from Providence, for instance, generate two records in the cargo-table: nankeens, 57 bundles; and nankeens, 280 bales. Both are linked to the point Bordeaux, characterized by the date of entry and the action – in this case “IN”, as the cargo items are being introduced into Bordeaux (Figure 1). Figure 1. Example of cargo items on the Charlotte a. Database main layout (cargo items on the right)
b. Cargo-table main layout
In constructing the cargo-table, we adopted the terminology provided by the sources without trying to impose any standardized notion of commodity. We believe that commodities do not exist as such and that they are the product of decisions taken by the actors: In international trade we define commodities as materials and articles movable and procurable. The term “commodities” may be applied to the finest detail or to homogeneous groupings of the detailed classifications. There is therefore really no firm answer as to whether “fabrics” or “cotton fabrics” are “commodities”[...] The answer depends on the use made of the classification and thus depends on whether the products are sufficiently homogeneous in price, economic use, market, etc., to fit the needs of classification.3
3. V. S. Kolesnikoff, “Commodity classification”, in R. G. D. Allen and J. Edward Ely, International Trade Statistics, London, John Wiley and Sons, Inc., 1953, p. 50-81, here p. 55-56.
Dealing with commodities in Navigocorpus: Offering tools and flexibility
Sources, however, are not always explicit enough for the needs of researchers. Depending on the goals authorities had when collecting data on ships and cargoes, information on cargoes are more or less exhaustive. The lack of information introduces categories of commodities which artificially overlap with other categories provided in other entries of the database. Differences can show up even within the same sources. The American consul in Bordeaux generally clearly distinguished the nature of the cod imported by incoming United States ships. He stated, for instance, that the brig Retrieve, which entered Bordeaux on 1 July 1795, introduced 90 quintals of dry codfish and 1,300 quintals of green codfish; on 12 December 1797, however, the cargo of the schooner Sally is laconically described as “a parcel of cod”. These two documentary units therefore provide three different commodities: cod, green codfish and dry codfish.4 Similarly, with the general category “drygoods”, some officers noted without further detail the manufactured goods put onboard whereas merchants and captains would record each item. For example, the outbound cargo of the Eliza of Salem, which sailed from Bordeaux on 15 October 1794, comprised “91½ tons of old claret; 100 pieces best Bordeaux brandy coloured & prepared, being fortified with 500 velts best 3/ 5th spirits 5 velts to each piece; 288 best silk stockings; 348 pairs Paris & other [stockings] – including woman & men, with work'd clocks, coulored, etc.; 1 piece superfine Brussels lace; 1 piece broader Brussels lace; 1 piece Valenciennes Cambric thick; 2 pieces Valenciennes Cambric finer; 2 pieces clear Cambric Handkerchief,” etc., which the United States consul at Bordeaux systematically and laconically recorded as “wine, brandy and drygoods”.5 Whenever general categories show up, researchers have to make a choice. A scholar interested in salt fish will have to decide whether he or she takes the unspecified cod into account. His or her specific knowledge will probably induce him or her to decide 4. National Archives and Record Administration, RG 84, Bordeaux Consulate, 26, Consular register of vessels entered and cleared, 1795-1797. 5. Peabody Essex Museum, Salem (Mass.), Derby family papers, Vol. 4. Elias Haskett Derby Invoice book, Inward cargoes, 1786-1796, No. 100: Invoice of the sundry merchandises shipped on the American Vessels the Eliza of & for Salem, Stephen Phillips master, on order of said Phillips for account & risk of M. Elias H. Derby of said place. See Silvia Marzagalli, Bordeaux et les États-Unis, 1776 – 1815 : politique et stratégies négociantes dans la genèse d’un réseau commercial, Geneva, Droz, 2015, p. 225.
57
58
Jean-Pierre Dedieu and Silvia Marzagalli
that “cod” entering Barcelona in 1790 is salt cod, whereas “cod” entering Le Havre the same year is green cod6. Other criteria will have to be taken into account to decide that the Sally probably had dry fish on board: the schooner arrived directly from Newfoundland, and the fact that she entered Bordeaux in December makes it likely that she had spent the summer on the shores to dry the fish. But we cannot make decisions of this kind throughout the database, both for a practical reason – we do not have universal knowledge on all trades and commodities – and for a methodological reason – we do not want to impose our categories on researchers. If we conceive it proper to classify in terms of salt/fresh fish, researchers might think of other, potentially unlimited categories for conceptualizing and reducing the enormous variety of commodities provided by the sources in a more manageable way. In order to allow the greatest flexibility to Navigocorpus users to meet their own needs, we created the ability to classify “on-theway” (or “on-the-run”): we created a field in which the researcher can add a term or a string of terms which correspond to the classification categories he or she wishes to adopt. In the example in Figure 2, we imagined that a researcher working on late eighteenthcentury trade chose to label as “colonial goods”, rum, sugar, coffee and tobacco. Working on fish consumption in early modern Catholic Europe can similarly induce a researcher to label whales as “fish”, as contemporaries considered them to be. Classifying a whale as a mammal would be completely inadequate for the purpose, but might fit for someone working on the twenty-first century. Other researchers might want to create a category of “protected animals”, and so on. This on-the-way coding is fast and temporary but highly unstable, as it is related to specific research, to a specific context and to a personal classification. However, we did not want users to have to face the task of dealing with thousands of different cargo items on their own. One of the most obvious problems in a database such as Navigocorpus comes from the variety of languages and spellings used in the sources to designate products. There was an evident need to help users wishing to locate an item whatever the language of the 6. On the areas of consumption of green and salt cod, see Atlas historique du Canada, vol. I : Des origines à 1800, Montréal, 1987.
Dealing with commodities in Navigocorpus: Offering tools and flexibility
Figure 2. Dealing with commodities in Navigocorpus From sources to standardization through flexibility
Raw data: spelling as in the sources Commodity (English): standardized equivalent in English (and identifier) Permanent coding: alphanumeric string added by the Navigocorpus team to data “On the way” classification: applied by users for the scope of their research.
sources and the spelling. Looking for trade in anchovies, the user obviously wants to retrieve in one click information about acciughe, anchois and anchovies. Navigocorpus handled this aspect by introducing an additional field in which different spellings and languages are standardized in English. The user can query the database in any language used in Navigocorpus and access all the related corresponding languages, although the original source-based definition of the item is preserved, so that it is, for instance, possible to correlate the use of a specific terminology to study institutionalized categories, linguistic aspects, or to point to differences among commodities that were self-evident for contemporaries but that we might overlook (for instance, different terms to designate the same fish in the same port at the same time according to the treatment it underwent for preservation). We also provided each entry of a standardized commodity with a numeric identifier. In so doing, we kept the distinctions in the sources: acciughe, anchois and anchovies are provided with the same identifier, but acciughe salate, anchois salées and salt anchovies are provided with another identifier. We therefore have maintained separate categories but also provided tools to users so they can save time while retrieving information from the database without having to query individually, one after the other, salt anchovies, salt cod, stockfish, etc., when
59
60
Jean-Pierre Dedieu and Silvia Marzagalli
trying to locate salt fish. For that purpose, in order to control the instability of the data, we added a third level of codification through permanent coding. The latter is composed of a string of characters to univocally identify the commodity in question, whatever the name given by the sources. This phase involves a most difficult task of standardization, which kept generations of economists, statisticians and customs officers busy in largely fruitless efforts. The fact that we do not materially manage the product, as we are dependent on the partial descriptions given by the sources, made the task even more delicate. Moreover, we had to meet the very special and unpredictable needs of researchers, not the clear-cut requirements of an administration. Practitioners agree that classifications of commodities rest on one of the following three criteria: the raw material; the elaboration process; or the most frequent use of the product.7 Accordingly, a wine bottle can be classified as a mineral (glass); or as an industrial product; or as a (food) container. In the pencil-andpaper era, people who classified items had to choose one of these criteria and stick to it, making only slight and partial allowance for the other two when absolutely necessary to avoid making the result hopelessly unmanageable. Computers removed these constraints, as they can easily retrieve complex queries from complex character strings. We therefore could adopt a multicriteria classification. Our classification includes the three standard criteria based on material, elaboration and use (Figure 3). Figure 3. Composition of permanent coding. The example of eighteenth-century white sugar imported from Saint-Domingue
7.
Kolesnikoff, “Commodity classification”, p. 50–81.
Dealing with commodities in Navigocorpus: Offering tools and flexibility
The first part of the code provides information on the raw material; the second part provides additional information on the elaboration processes; the last part helps identify the use of the product. The meaning of each coding constitutive unit (letter) depends on its position. The length and number of elements composing each part is always the same in order to facilitate queries, with lower-case “x” filling void (non-significant) positions. The highly structured, context-dependent and modular nature of the coding sequence makes a correct interpretation by means of interpretative tables a relatively easy task (see Appendix 1 for more details). Such permanent coding responds to different needs. First, it sticks as closely as possible to an effective description of the product, taking into account every factor which might affect its insertion into economic, social and cultural contexts.8 Second, it provides three possible entries to researchers, depending on the interest they have. Third, we provide a grammar which can be expanded to cope with unexpected cases, as well as with partially documented ones: generic designations will be coded using the first positions only; more precise ones will use the same root and will be completed by extra characters. Finally, the hierarchically ordered sequence of coding elements, fully in consonance with the way computers work, allows a natural grouping of commodities into classes. The elaboration of such codes requires complete knowledge of the products. It is therefore a considerably complex and timeconsuming task for which scientific collaboration among research groups with different expertise would be very beneficial. At an early stage, operators could process the commodity, even when precisely described, by using the first, more generic part of the code. In a later stage, they might add to the coding whenever extra information on elaboration processes, uses and raw materials made that possible. In all instances, full coding implies full research on products based on contemporary technical dictionaries, from 8. The last sequence, concerning use of the product, may change when coding a commodity designated by the same name depending on the social function it is supposed to fulfill in the context in which it appears: imported lemon juice to Marseille in the eighteenth century did not have the same use if in bottles (for drinking) or casks (for industrial use), whereas it can be classified as a drug if delivered, for instance, to the Navy or to the East India Company.
61
62
Jean-Pierre Dedieu and Silvia Marzagalli
d'Alembert’s Encyclopedia9 to less known but nonetheless highly useful works such as the Technological listing... published at the beginning of the twentieth century by the French statistical office, which is a fairly complete description of products and elaboration processes.10 We believe that the coding procedure we suggest constitutes a useful collaborative tool for storing and making available specialized knowledge usually restricted to expert circles. The permanent coding obviously cannot be freely tampered with, but its use is optional: the on-the-way coding provides Navigocorpus users with the margin of liberty they need.
Conclusion In handling commodities within Navigocorpus, we have tried to overcome constraints and methodological challenges. We wanted to preserve data as they appear in the sources, and we managed to do that. We also wanted to do something more than providing users with an enormous amount of rough data, so we provided a standardized English translation of items. We invented a multi-criteria classification which users are free to use or not – knowing that at this stage we have not fully processed all cargo data we collected. And through on-the-way coding we allowed for the greatest possible flexibility in adding classifications that users think proper according to their research goals.
9. An excellent online version of the same by the ARTFL Encyclopedie Project of the University of Chicago (http://encyclopedie.uchicago.edu/) (consulted: May 2014). 10. Ministère du Travail et de la Prévoyance Sociale. Statistique générale de la France, Répertoire technologique des noms d'industries et de professions français – anglais – allemands avec notices descriptives sommaires, suivi des trois listes alphabétiques des noms allemands, anglais et français, Paris/Nancy, Berger-Levrault et Cie, 1909, 771p.
Dealing with commodities in Navigocorpus: Offering tools and flexibility
Appendix: Commodities permanent coding adopted by Navigocorpus The example of fish Each commodity is described by a permanent coding string of the form: xx-xxxxxx-xx-xxxxxx-xxxx Permanent coding is composed of three legs. The first two are in turn composed of two parts. The first leg describes raw materials. The second describes the elaboration process. When the commodity is mere raw material, this second leg remains empty (empty meaning a series of xxxxx). The third leg expresses the use generally made of the commodity (human food, fodder, industrial process, etc.). Each position of the coding string must be materially filled with a letter, as positions are significant. Positions which should remain blank must therefore be filled with "x". Hyphens have no meaning: their function is to make the string easier to read. Segments match meaning in the following way: -[1] [2] Material, basic product . Class . Material - [3] [4] Elaboration process . Class . Special description - [5] General use given to the commodity xx-xxxxxx-xx-xxxxxx-xxxx 1 2 3 4 5
Dictionary We present here extracts from the general dictionary for permanent coding we are presently elaborating.
a) First leg: raw material Ix: Raw products IA: raw fishery products IA-FAxxxx: fish in general IA-FAAxxx: fish, without further detail IA-FBxxxx: great fishery products
63
64
Jean-Pierre Dedieu and Silvia Marzagalli
IA-FBBAxx: whale IA-FBBABx: sperm whale IA-FBBCxx: cod IA-FBBExx: seal IA-FCxxxx: fishery of open sea products IA-FCAxxx: products of high sea fishery (generic) IA-FCABxx: fish salted on board (generic) IA-FCBxxx: fish from high sea fishery (special items) IA-FCBAxx: herring IA-FCBBxx: pilchard IA-FCBCxx: mackerel IA-FCBDxx: anchovy IA-FCBExx: tuna IA-FCBEBx: blue fin tuna IA-FDxxxx: inshore fishery, coastal fishing products IA-FDAxxx: fish from coastal fishing (general) IA-FDAAxx: fresh fish IA-FDABxx: skate IA-FDBxxx: shellfish products IA-FDBAxx: salvage shellfish products IA-FDBAAx: oysters IA-FDBABx: mussels IA-FDBBxx: shell culture products IA-FDBBAx: oysters IA-FDBBBx: mussels IA-FDBCxx: shell (undetermined breed) IA-FDBCAx: oysters IA-FDBCBx: mussels IA-FFxxxx: river fishery IA-FFAxxx: generic river fish IA-FFBxxx: special fishing IA-FFBBxx: salmon
b) Second leg: elaboration processes JF-Hxxxxx: preserves JF-HAxxxx: preserves (generic) JF-HBxxxx: preserves through additives JF-HBAxxx: preserves through additives (generic) JF-HBBxxx: sugared preserves JF-HBBAxx: sugar preserved (generic) JF-HBBBxx: candied (unused) JF-HBBCxx: industrial jams JF-HBBDxx: syrups
Dealing with commodities in Navigocorpus: Offering tools and flexibility
JF-HBCxxx: salted preserves JF-HBCAxx: salted preserves (generic) JF-HBCBxx: ham JF-HBCCxx: [code left empty for possible future use] JF-HBCDxx: bacon JF-HBDxxx: [code left empty for possible future use] JF-HBExxx: oil preserves JF-HBFxxx: marinated preserves JF-HBGxxx: pickles JF-HCxxxx: dried preserves JF-HDxxxx: mixed dried and salted preserves JF-HExxxx: [code left empty for possible future use] JF-HFxxxx: chilled preserves JF-HFBxxx: chilled JF-HFCxxx: iced JF-HFFxxx: frozen JF-HGxxxx: paste preserve, pressed preserves JF-HGBxxx: meat pastes JF-HHxxxx: canned preserves JF-HIxxxx: vinegar and derived condiments JF-HIAxxx: vinegar JF-HIBxxx: mustard JF-HKxxxx: smoked preserves JF-HKAxxx: smoked preserves in general
c) Third leg: uses given to the commodity Fxxx: food FAxx: food (undetermined) FBxx: human food FBAx: basic product FBBx: luxury products FBCx: FBDx: drinking products FBEx: FBFx: seasonings FBGx: fats FDxx: mixed human and animal food FExx: animal food, fodder FFxx: mixed human and animal food FGxx: mixed food and industrial use
65
66
Jean-Pierre Dedieu and Silvia Marzagalli
d) Examples of combinations of the three legs IA-FCBAxx-JF-HAxxxx-FBxxx: preserved herring IA-FAAxxx-JF-HBCAxx-FBxxx: salt fish IA-FCBAxx-JF-HBCAxx-FBxxx: salt herring IA-FFBBxx-JF-HBCAxx-FBxxx: salt salmon IA-FCBExx- JF-HBCAxx-FBxxx: salt tuna IA-FCBExx- JF-HBExxx-FBxxx: tuna preserved in oil IA-FCBAxx-JF-HBFxxx-FBxxx: marinated herring IA-FCBExx-JF-HBFxxx-FBxxx: marinated tuna
TRADE STATISTICS OF THE ZOLLVEREIN, 1834-18711 Béatrice Dedinger Centre d’histoire de Sciences Po
The purpose of this paper is to highlight the fact that the lack of useable German trade statistics for the period preceding the German political unification is not a fatality. The documents published during the Zollverein period by the Central Bureau of the Zollverein, the Statistische Uebersichten über WaarenVerkehr und Zoll-Ertrag im Deutschen Zoll-Vereine für das Jahr..., do not provide prices nor trade flows in value nor any indication of countries of ultimate origin and destination. To overcome these imperfections, a great number of estimates of Zollverein trade statistics have been published since 1842 but they are questionable as well. Nevertheless, the good quality of Statistische Übersichten’s quantity data should make possible the reconstruction of consistent series of German trade, total, by product and in value, over the period 1834-1871. Keywords: administrative history, nineteenth century, international trade statistics, Germany, globalization, economic history, Zollverein.
G
ermany is a very special case in the history of trade statistics. For the eighteenth century there are virtually no contemporary trade statistics, as Pfister notices in this issue.2 He is nevertheless able to provide a consistent picture of German foreign trade between c. 1740 and the 1790s by using documents from Bavaria, Prussia, Hanover, and Hamburg. The creation of a German customs union in 1834 led to the creation of a Central Bureau and to the 1. I would like to thank Markus Lampe for useful advices and Ulrich Pfister for very helpful comments. 2. Pfister (2015), in this issue. e-mail:
[email protected]
Revue de l’OFCE, 140 (2015)
68
Béatrice Dedinger
first elaboration of “a” German trade statistics, i.e. trade statistics of a unified German entity with the outer world excluding intraGerman states trade flows. Data were published in the first German official document dedicated to the collation of trade information, the Statistische Uebersichten über Waaren-Verkehr und Zoll-Ertrag im Deutschen Zoll-Vereine für das Jahr... But this document is well known among German trade experts for its many shortcomings, particularly the absence of any information on price or the value of trade flows. Germany did not produce “useable” trade statistics before 1872, namely statistics of exports and imports in value. Until the end of the nineteenth century there was no German publication equivalent to the Tableau général du commerce de la France or the Annual Statement of Trade of the United Kingdom. Discussions of Zollverein’s trade statistics have so far been available only to German-speaking researchers. The purpose of this article is to make use of these publications to shed light on documents that have been progressively abandoned by economic historians.3 It is divided into three sections that present the collection of trade statistics in the Zollverein, describe the information contained in the Statistische Übersichten, and make a review of the estimates of German trade in the nineteenth century.
1. The collection of trade statistics in the Zollverein The formation of the German Zollverein was a gradual process that took seven decades from the 1818 Prussian customs reform to the latest accession of Bremen and Hamburg in 1888. The Zollverein was officially established by the Zollverein treaties of 1833 that merged three German customs unions including twenty one German states in a common customs system. After its implementation in January 1, 1834 for a period of eight years tacitly renewable every twelve years, six other German states joined the union over the 1835-1852 period. After the unification wars of 1866 and 1870, six new territories integrated the Zollverein and the process ended in 1888 with the entry of Hamburg and Bremen.4 The aim of Prussia and its cosignatories was to establish a free trade area with a common tariff and a common commercial policy, 3.
But not all, see Lampe (2008).
Trade statistics of the Zollverein, 1834-1871
but this objective has not resulted in the creation of truly federal institutions. In fact, the main federal organ of the Zollverein was the Generalkonferenz, an assembly of plenipotentiaries of the Zollverein governments which met once a year to discuss problems relating to the customs union. Decisions were taken unanimously. The other federal-like administration was the Central Bureau, which function was to calculate the distribution of custom revenues between the Zollverein members. It must be stressed that, as a customs union, the Zollverein was not as integrated as the European Economic Community, which has established common institutions for implementing the common commercial policy. In the Zollverein, while Prussia played a leading role throughout the period, each member state retained jurisdiction over the administration of its customs, used its own customs officers at the external and internal borders of the union, and kept its own customs revenues fund. This model of “loose” customs union may have influenced the elaboration of trade statistics in the Zollverein.5 The first motivation to the centralization of trade statistics by the Central Bureau was the calculus of each member’s share in the common customs revenues.6 But soon enough, it became clear that the establishment of a statistics of the external trade of the Zollverein also provided a strong motivation. To these end the Commerzialnachweisungen were elaborated as soon as 1834 to set up a common list of merchandises and a common way of collecting the information. A common instruction for the collection of data was communicated to the Ministry of Finance of each state in 1836; it was revised in 1841. The merchant had to declare the quantity and nature of the merchandise, not the value that was considered as too difficult for merchants and customs officials. The 4. The 1833 treaty of the Zollverein may be found at: http://www.verfassungen.de/de/de0666/zollverein33.htm. The founding members were Prussia, Hesse-Darmstadt (Prussia-HesseDarmstadt Custom Union, 1828), Kurhessen, Bavaria, Württemberg (Bavaria-Württemberg Customs Union, 1828), Saxony, and the states of Thuringia (Thuringian Customs Union). The following states joined the Zollverein: Baden and Nassau (1.1.1836), Frankfurt (1.2.1836), Brunswick (1.1.1842), Luxemburg (1.4.1842), Hanover, Oldenburg, Schaumburg-Lippe (1.1.1854), Schleswig-Holstein (15.11.1867), Lauenburg, Mecklenburg Schwerin, Mecklenburg Strelitz, Lubeck (over 1868), Alsace-Lorraine (1.1872), Hamburg and Bremen (15.10.1888). (Dates in brackets are those of the entry in the Zollverein). 5. See Dedinger (2012a). 6. See Borries (1970), 22-26; Statistik des deutschen Reiches (1873), vii-ix; Zimmermann (1905), 302-305.
69
70
Béatrice Dedinger
task of the customs official did not require any particular qualification; he had to register each commodity with an alphabetical list consisting of 250 tariff lines. The data collected by each member of the Zollverein were checked by the other members. They were next sent to and added up by the Central Bureau in Berlin.7 The role of the Central Bureau was thus limited to that of an accountant until the foundation of the Second Reich and the creation of the Kaiserliches Statistisches Amt in 1872. The documents it issued, the Commerzialnachweisungen, were not used to discuss Zollverein’s trade policy. In fact the huge mass of data8 collected by the Central Bureau was not easily manageable, especially on the import side. Imports were divided into many categories that could not be added and could contain duplicates. The categories are: imports for direct consumption, transit (complicated system of certificates), warehouse goods (not systematically registered in imports), trade with fairs, postal trade, processing trade, transit on short roads, HarzLeine-Distrikt trade,9 and special tables for reduced tariffs (trade with Switzerland, Austria and the Netherlands for example). On the other side, exports were registered under the three traditional main categories: goods coming from domestic production, transit, goods coming from warehouse (postal trade not included). The lack of interest in common trade statistics by the states of the Zollverein is also reflected by the fact that the publication of the Nachweisungen was not decided before 1843. The mass of information gathered by the Central Bureau was initially reserved for use by the governments and it was not meant to be made public. This led to unofficial estimates of German trade10 that were criticized for their inaccuracy at the 1843 Generalkonferenz. It was then decided to publish the official documents. The Statistische Uebersichten über Waaren-Verkehr und Zoll-Ertrag im Deutschen ZollVereine für das Jahr... that was first published in 1844 (year 1842) is 7. Borries (1970), 22-23. As Borries points out, there is no detailed study of the methods used by the Zollverein states to collect and check trade statistics. 8. Borries (1970), 24. 9. This Brunswick district cut through the Hanover territory. From the inclusion of Brunswick (1844) to the annexation of Hanover (1854), the Harz-Leine-Distrikt trade was subjected to tariffs lower than those of the Zollverein. 10. See below section 3.
Trade statistics of the Zollverein, 1834-1871
only a small part of all the information contained in the Commercialnachweisungen. It was edited by the Central-Bureau des ZollVereins nach den amtlichen Mittheilungen der Zoll-Vereines-Staaten. 1873 (year 1871) is the last year of edition. The document was then replaced by the Auswärtiger und überseeischer Waarenverkehr des deutschen Zollgebiets und der Zollausschlüsse.11
2. A closer look at the Statistische Übersichten Once it was made available to the public, the Statistische Übersichten was subjected to severe criticism. According to the Journal des Economistes this document was incomplete, useless and unworthy of a government concerned with public information.12 More neutral and “diplomatic” the comment of the Annales du commerce extérieur13 is nevertheless worth noticing. During thirty years, each report on the external trade of the Zollverein begins by highlighting the same drawback, the fact that customs official statements do not record the value of commodities. On the German side also statisticians lamented about the poor state of German trade statistics until the reform of 1872.14 A hundred years later the imperfection of the Zollverein statistics motivated the works of Bondi and Borries.15 As summarized by Bondi, there are 11. Published in Statistik des Deutschen Reiches, Alte Folge 1872-1882, Neue Folge 1883-1944; edited by the Kaiserliches Statistisches Amt; from 1891 onwards its title is Auswärtiger Handel des deutschen Zollgebiets. 12. “La Prusse publie depuis trois ans un tableau des exportations et des importations de l’Association des Douanes […]. Ce document est fort incomplet ; l’on y chercherait en vain des résumés propres à faire connaître le mouvement commercial par pays ou par catégories de marchandises […]. Nous déclarons qu’il est tout à fait indigne d’un gouvernement qui a la prétention d’informer le public, car il n’apprend absolument rien, et ne peut servir ni aux fonctionnaires publics ni aux économistes ; encore moins peut-il éclairer les hommes qui n’appartiennent ni à l’une ni à l’autre de ces catégories”, in Le Journal des Economistes, Tome 13, Déc. 1845-Mars 1846, 326. This comment is cited in Junghanns (1848), vii. 13. The Annales du commerce extérieur provide statistical information on the external trade of foreign countries. From 1829 to 1916 it is divided into four series: Extraits d’Avis Divers, 18291839; Bulletin du Ministère de l’Agriculture et du Commerce, 1840-1842; Faits commerciaux, 18431883; Mouvement général du commerce et de la navigation des principaux pays étrangers, 1884-1916. 33 booklets on the German Zollverein are published from 1843 (Association allemande, Faits commerciaux n° 1, février 1843) to 1873 (Association allemande, Faits commerciaux n° 33, juillet 1873) in which no official value of German foreign trade can be given. French consular reports had to rely on unofficial estimates. 14. Junghanns (1848), iii-viii. In his foreword, he is very critical of the work of the Central Bureau. Twenty years later, the judgement is still quite tough: “We have no German trade statistics and have never had something that could deserve such a name” (author’s translation), in Hirth (1869), 67. Hirth was member of the Commission of reform of the statistics from 1869 to 1870.
71
72
Béatrice Dedinger
four major shortcomings: no indication of value, no coverage of all the exports and imports, no satisfactory classification of goods, no indication of partner country.16 After noticing what is not in the Statistische Übersichten, it is interesting to know what information can actually be found in these tables. The documents are available and can be downloaded online.17 The language is German. The first edition of the Statistische Übersichten (1844) includes an appendix retracing trade of the Zollverein over 1834-1843 (208-261). From 1842 to 1871, there was no indication of value or price. Data are given in different quantity units, mostly in Centner, but also in Stück, Klafter, Scheffel, Schiffslast, Tonnen, Ohm and Pferdelasten.18 According to the German statisticians these data are quite reliable and the problem of smuggling is reduced compared to other countries.19 Two periods must be distinguished. Until 1857 (ed. 1859) information is divided into the following sections: goods cleared at the frontier imported by each state of the Zollverein; goods exported by each state of the Zollverein; goods transiting in each state of the Zollverein; import, export and transit of goods in the Harz-LeineDistrikt; re-imports of domestic goods; foreign fairs’ trade with German states; German fairs’ trade with the outside; tables of customs revenues. From 1858 (ed. 1860), the size of the document increased significantly. It was now classified in three sections. I. imports and customs revenues in the Zollverein and each German state by border country; exports and customs revenues in the Zollverein and each German state by border country. II. Transit trade in the Zollverein and each German state by border country on entry and exit. III. Summary of trade; trade of small ports (Ostsee, Nordsee, Prussian ports, Hanover, Oldenburg); trade of fairs; tables of customs revenues. Trade statistics of the Zollverein are said to be incomplete because they did not register duty-free goods. In particular, waste 15. Cf. Bondi (1958), 149-150, Borries (1970), 22-25. Kutz (1974) was concerned with German trade statistics before the creation of the Zollverein. 16. Bondi (1958), 149. 17. The Bayerische Staatsbibliothek is currently processing the digitization of the Statistische Übersichten for the years 1842-1862. See: https://opacplus.bsb-muenchen.de/metaopac/ 18. Prussian Centner (100 kg) before 1840 and Zoll Centner (50 kg) after. 19. Hirth (1869), 68-69.
Trade statistics of the Zollverein, 1834-1871
products, products of horticulture, agriculture and livestock, hay, straw, fodder herbs, fresh herbs, fresh fruit, milk and eggs, tree seeds, fresh fish, bread, a large number of earth and ores, mill and other carved stones, firewood, and timber in land transport were excluded from trade statistics.20 But according to a careful review by Borries, the total value of non-registered exports and imports should not have exceeded two million Thalers.21 The classification of merchandises remains relatively stable over the whole period. There are 43 main categories plus a ‘miscellaneous’ group, and about 250 positions in total.22 It seems that this quite simplistic classification should facilitate the work of customs officials and merchants by being easy to use. The categories for colonial and agricultural products provide an adequate degree of precision, but those for raw materials, semi-finished and finished goods are less disaggregated and mix products of different nature.23 Another feature of these statistics is non-homogeneity due to the changing definition of the Zollverein throughout the period.24 In 1858 (ed. 1860) the contents of the publication changed to include some simplifications and new information, but this reform did not solve any major defect of the Zollverein statistics.25 The main evolution was that the border country through which the goods enter or exit was now specified. The border approach was mostly used to register partner countries at that time.26 In the case of the Zollverein the problem of the determination of bilateral trade was complicated by the fact that free ports such as Hamburg were not included in the Zollverein and reported as foreign partners (see below an extract of the Statistische Übersichten). “Hence”, as Lampe rightly points out, “most seaward trade with the Zollverein/Germany was accounted to as coming from or going to 20. Statistik des Deutschen Reiches (1873), x. Abfälle verschiedener Fabrikationszweige, gewisse Erzeugnisse des Garten- und Ackerbaus und der Viehzucht, Heu, Stroh, Futterkräuter, frische Gartengewächse, frisches Obst, Milch und Eier, ferner Waldsämereien, frische Fische, Brod, eine grosse Anzahl von Erden und Erzen, Mühl- und andere behauene Steine, Brenn-, Bau- und Nutzholz bei Landtransport. 21. Borries (1970), 28-29. 22. Lampe (2008) relies on the Statistische Übersichten to reconstruct German bilateral trade by products in 1857 and 1865. According to his counting (85) there is an increase in the number of positions in 1865 where separate statistics were published for each semester. 23. Borries (1970), 26-27. 24. Cf. note 3. 25. Zimmermann (1908), 304-305. 26. See Lampe (2008), 101.
73
74
Béatrice Dedinger
the free-ports of Hamburg and Bremen and smaller free-ports in the states of Hanover (since 1866 Prussia) and Oldenburg. For the smaller share of sea trade through national ports that were not free ports, i.e. Prussian ports in the North and Baltic Sea, geographical distribution on origins and destinations was published since 1858 in separate tables, whose sums except for supposed transmission and printing errors matched the sum of trade reported in the main tables.”27 German official documents began to indicate ultimate countries of origin and destination in 1880 only.28 But it is not until the annexation of Bremen and Hamburg in the Zollverein that German statistics converged toward a comprehensive description of German trade flows with the rest of the world. This is confirmed by the shift in German trade statistics between 1888 and 1889. First, the total value of special imports sharply increased (+ 22%) showing that German imports from Hamburg were inferior to Hamburg total imports, whereas total exports slightly declined (-1.3%). Second, the consequences of the inclusion were quite important on the structure of bilateral trade since Hamburg represented about 20% in German total measured trade in 1888 (exports = 24%; imports = 16%). Indeed, between 1888 and 1889, a sharp increase in the share of non-continental countries (United Kingdom, United States, Brazil, Chili and India) occurred.29 Given all its shortcomings, the publication of the Statistischen Übersichten did not put an end to unofficial estimates of German trade. Over more than a century there have been many attempts to reconstruct statistics of the Zollverein in value that are reviewed in the next section.
27. Lampe (2008), 102. 28. Auswärtiger Handel (1898). 29. Dedinger (2012b). 39-40.
Trade statistics of the Zollverein, 1834-1871
Table 1. Extract from Statistische Uebersichten über Waaren-Verkehr und Zoll-Ertrag im Deutschen Zoll-Vereine für das Jahr 1852
Gesamte Eingangs-Verzollung in jedem einzelnen Vereins-Staate und im Gesamt-Verein, im Jahre 1852.
75
76
Béatrice Dedinger
Table 2. Extract from Statistische Uebersichten über Waaren-Verkehr und Zoll-Ertrag im Deutschen Zoll-Vereine für das Jahr 1858
Uebersicht des Waaren-Einganges und der erhobenen Eingangszölle in sämmtlichen Staaten des Zollvereins nach den Grenzstrecken des Einganges für das Jahr 1858.
3. The estimates of the value of German trade in the nineteenth century Over the whole period from the foundation of the Zollverein to the unification of Germany, German statisticians produced estimates on the Zollverein trade. In the context of the European trade policy debate, when free trade was fiercely debated, the economic union of German states was not able to advance any synthetic figures to establish if it was invaded by foreign goods or vice versa.30 Hence several authors attempted to fill this statistical hole by producing estimates, which Borries had analysed thoroughly.31 Many attempts to estimate the value of the Zollverein trade for a 30. See Junghanns (1848b), 46-47. He was a fervent free-trader. 31. Borries (1970), 33-52.
Trade statistics of the Zollverein, 1834-1871
given year were done but few authors produced continuous series. Dieterici, who was appointed director of the Prussian statistical office in 1844, published the “Statistische Uebersicht der wichtigsten Gegenstände des Verkehrs und Verbrauchs im preussischen Staate und im deutschen Zollvereine” from 1838 to 1857. It was the continuation of the Ferber’s “Beiträge zur Kenntnis des gewerblichen und commerciellen Zustandes der preussischen Monarchie.”32 In the six volumes of Dieterici’s Übersichten, value estimates appeared in the 1842, 1844, 1857 editions for the years 1837-39, 1840-42, 1849, and 1853.33 Dieterici used average prices from Prussia and Hesse, with identical prices for exports and imports, to calculate the export or import surplus for each position of the classification. This work is worth mentioning for its precursory character. However, the method used to set prices is too vague and the estimates are not considered reliable. A second set of estimates, based on Austrian prices, must also be used with caution.34 The works that made a more lasting mark are those of Junghanns and Hübner.35 In 1848 Junghanns relied on Biersack’s prices36 and Statistische Übersichten’s quantities to estimate the value of special exports, special imports and transit by products for the years 1834 to 1846. His series used the same unit values for each year.37 Four years later, Hübner published the first of the eight volumes of his Jahrbuch.38 In the section devoted to the deutsche Zollverein, Hübner provided annual estimates of special imports, special exports, and transit, by products, over 1850-1861. He relied on different price sources to calculate current values (identical prices are used for exports, imports and transit): German or foreign prices; Hamburg prices; reports of merchants and industrialists.39 32. Dieterici (1838), iii-viii. After the death of Ferber, Dieterici continued his work and extended the statistical overview to all members of the Zollverein and to production activity. 33. Dieterici (1842), 405-407; Dieterici (1844), 634-635; Dieterici (1857), 829-839. 34. Reden (1847) used Austrian prices to estimate the total value of Zollverein exports, imports and transit over 1843-1845. His figures, considered to be overvalued, are published in the Annales (Association allemande, Faits commerciaux n° 10, Mai-juin 1848). 35. Cf. Borries (1970), 37-41; Hirth (1869) 110. 36. Developed in Borries (1970), 34-35. Biersack estimated average prices for imports and exports over 1837-1841. His data are the first estimate of the value of Zollverein trade given by the Annales (Association allemande, Faits commerciaux n° 5, juillet 1844). 37. Junghanns (1848), zweite Abteilung. 38. Jahrbuch für Volkswirtschaft und Statistik (1852-1863). Hübner is also the author of the Statistische Tafel aller Länder der Erde (1850-1912).
77
78
Béatrice Dedinger
Two other estimates have been attempted before the unification of Germany by Bienengräber and Hirth for Zollverein trade in 1864 and 1867.40 Hirth has been quite critical of the method of valuation of all these estimates, but it should be underlined that the problem is not specific to estimates of German trade: the issue of the valuation of trade arose in all countries at this time. A hundred years later, several researchers undertook the task of revising these first evaluations and produced new series of external trade flows. Bondi reported the value of total exports and imports of the Zollverein over the period 1834-1871. His time series are taken from Junghanns (1834-46), Hübner (1850-61) and Bienengräber (1864). The missing points are estimated from the Statistische Übersichten. The territory is that of the Zollverein in its current borders.41 His work has been strongly criticized by Borries because it took old estimates at face value and, moreover, it did not specify the method of calculation used to produce its estimates when data went missing in the 19th century literature.42 Consequently, Borries provided his own calculations to estimate the value and volume of exports and imports of the German Empire in its borders of 1870 over the period 1836-1856.43 To this end, he recalculated German trade by adding the total trade of all German states and subtracting trade between German states. The final result is a synthetic table of three-year averages exports and imports of all Germany.44 The seminal work of Hoffmann et al. did not aim at new estimates of the value of German foreign trade before 1871. Its main value-added over this period is the calculation of real series of imports and exports by categories of goods from 1836 onwards. They are estimated from a selection of quantity data taken from the Statistische Übersichten and import prices in 1880.45 39. Borries (1970), 38–39; Hirth (1869), 110. 40. Bienengräber (1868); Hirth (1869), 115-130; Borries (1970), 40–41. 41. Bondi (1958), 145: 147–151. 42. Borries (1970), 5-6. “Seine Zahlen sind unüberprüfbar und wissenschaftlich von sehr eingeschränktem Wert.” 43. Borries (1970), 2-3. His aim is to reconstruct trade series for Gesamtdeutschland = Deutsches Reich of 1870 (excluding Alsace-Lorraine, including Bremen and Hamburg). 44. Borries (1970), 178. 45. Hoffmann et al. (1965), 530–544.
Trade statistics of the Zollverein, 1834-1871
The latest estimate of German trade statistics is the one made by Lewis in an article that focuses on the reconstruction of series of world exports at current and constant prices over the period 18501913.46 Noting that “German trade statistics for this period [18361888] cannot be used at all without some doctoring,”47 he offered new estimates of German exports (total and manufacturing), at current prices from 1847 to 1888 and at constant prices over 18361888. Lewis relied on volume indices of Hoffmann, on import statistics of Germany's partners, and on prices of British exports to recalculate annual and homogeneous series of German exports within its borders in 1913.48 He also revised the figures for the 1870s that are problematic according to him.49 This last point needs some clarification, though. It is true that German trade statistics were still plagued with methodological problems during the 1872-79 transition period. In fact, except for taxed imports, there was no legal obligation to declare traded merchandises, and transit trade could be included in export or import trade in different proportions. The result was that exports tended to be undervalued rather than overvalued, as said by Lewis, and imports were overvalued.50 From all these estimates, one can try to reconstruct long-term series of German total trade at current and constant prices. Despite the overall quality of the work done by Borries, his series are generally ignored because of the limitation of the period and the absence of annual data.51 Actually, the estimates of Borries differ little from those of Bondi that have the advantage of covering each year of the period 1834-1871.52 In order to provide a comparison between the different evaluations, I have drawn a series of four graphs (see below). They compare Lewis export series at constant territory, current and constant values with Bondi and Hoffmann export series at current territory, current and constant values. 46. Lewis (1981), 27–32. 47. Lewis (1981), 27. 48. It is a deduction because Lewis does not give an exact definition of the German territory. 49. Lewis (1981), 27. 50. Statistik des Deutschen Reiches (1875), x.41-x.42; Zimmermann (1905), 305-309. The problem was solved with the Reichsgesetz vom 20. Juli 1879. 51. Dumke (1994), part two, 4, explains why he does not use Borries’s estimates. Lewis (1981), 27, also points to the drawbacks of Borries’s series: they cover only the 1836-56 period and contain no annual data. 52. See the comparative table in Borries (1970), 91.
79
80
Béatrice Dedinger
Figure 1. German exports, 1834-1889 (current values, million Marks) 3500 3000
Bondi-SJ 2500 2000
Lewis 1500 1000 500 0 1834
1840
1846
1852
1858
1864
1870
1876
1882
Sources: Bondi (1958), 145; Lewis (1981), 29-30; Statistisches Handbuch für das Deutsche Reich (1907), 9, 15.
Figure 2. German exports, 1836-1889 (volume indices, 1913=100) 35 30 25
Hoffmann 20 15 10
Lewis 5 0 1836
1842
1848
1854
1860
Sources: Hoffmann et al. (1965), 530-32; Lewis (1981), 29-30..
1866
1872
1878
1884
1888
81
Trade statistics of the Zollverein, 1834-1871
Figure 3. Germany's trade openness (X/PIB, current prices, in %), 1850-1913 25
Bondi-SJ
20
15
Lewis
10
5
0 1850
1858
1866
1874
1882
1890
1898
1906
Sources: Exports = Bondi (1958), 145; Hoffmann et al. (1965), 530-32; Lewis (1981), 29-30; Statistisches Handbuch für das Deutsche Reich (1907), 9, 15; Statistisches Jahrbuch für das Deutsche Reich (1938), 254. PIB = Hoffmann et al. (1965), 825-828 (NNP zu Marktpreisen); Ritschl and Spoerer (1997), 51 (BSP).
Figure 4. France and United Kingdom trade openness (X/PIB, current prices, in %), 1850-1913 25
United Kingdom 20
15
10
France
5
0 1830
1840
1850
1860
1870
1880
1890
1900
1910
Sources: Asselain and Blancheton (2005), 86; Mitchell (2011), 451-53, 831-33.
The first two graphs show that Lewis’s growth rates are roughly similar to those of Bondi and Hoffmann. There are however differences for years that see territorial enlargment of the Zollverein (1838, 1842, 1853-54, 1868, 1888-89) and over the period of transition (1870s). The third graph depicts estimations of Germany’s nineteenth century trade integration. One could conclude that
82
Béatrice Dedinger
Lewis’s series should be preferred if one’s purpose is to use a homogeneous series of trade. But, apart from the problem of the transition period, the third graph casts some doubt on Lewis data for his series indicates no increase in openness of the German economy between 1850 and 1889.53 Is it credible that Germany (i.e. Zollverein in its 1889 borders) was as open in 1889 as in 1850? It looks strange that this industrializing and new economic union did not take part in the trade globalization process that unfolded in the third quarter of the nineteenth century, as is demonstrated by the cases of France and the United Kingdom (see graph 4). Besides, I have strong reservations vis-à-vis re-estimations at constant territory. If it is quite sensible from a retrospective point of view, it makes little sense from a historical point of view because analysis is carried on a fictional entity.54 A better option seems to me to take into account an additional variable, the territorial changes, in the analysis of economic movements. Therefore, I would not recommend the use of Lewis series (remember that his work covers only exports). I do agree with what Lampe told me in a private exchange: “Bondi offers a series of estimates which have been criticized but without clear alternative series”. The same can be said about Hoffmann’s volume series.
4. Conclusion We still need global, detailed, annual, at current and constant prices time series of German trade statistics over 1834-1871. There is a wealth of information in the Statistische Übersichten that could be exploited in a new way. Now that the documents are being digitized by the Bayerische Staatsbibliothek the main problems remain the valuation of each good of the classification and the determination of partner countries. The estimations of Bondi, Hoffmann et al., and Lewis can certainly be improved. Lampe has paved the way in his paper by using prices quoted in Hamburg and Bremen complemented with British prices, Kaiserreich official prices for 53. The rate goes from 13.4 % in 1850 to 14.2 % in 1889. 54. See, for example, Maddison’s series that estimate German population over the long run. In Maddison (1995), 110, the population in 1913 is 37.8 million (Germany in 1989 borders); then in Maddison (2001), 195, German population jumps to 65 million (Germany in 1913 borders without Alsace-Lorraine). The current figure is 66.9 million (Statistisches Jahrbuch, 1952: Germany in 1913 borders including Alsace-Lorraine).
Trade statistics of the Zollverein, 1834-1871
1872-73, Hübner’s and Bienengräber’s prices to convert quantity into value for two years.55 He thus demonstrates that the many criticisms addressed to the trade statistics of the Zollverein should not be taken as an argument for not using them at all, although it certainly means that they should be used with caution. However, reconstructing German bilateral trade flows before 1871 seems very problematic since German documents provide unusable information.56 Using trade statistics of German states partners, as was attempted by Kutz for the years around 1830, can be a second-best solution.
References Asselain J.-C. and Blancheton B., (2005) “Dynamique de l’ouverture internationale. Paradoxes, enjeux, éléments d’interprétation à partir du cas de la France,” Économies et Sociétés, Série “Histoire économique quantitative,” AF, 32(1): 49–179. Bienengräber A., (1868), Statistik des Verkehrs und Verbrauchs im Zollverein für die Jahre 1842-1864, Berlin. Biersack H.L., (1843), Über Schutzzölle und andere, gegen das Ausland gerichtete Schutzmaβregeln zur Förderung der inländischen Industrie… nebst der Handelsbilanz des deutschen Zollvereines von den Jahren 18371841, Darmstadt. Bondi G., (1958), Deutschlands Aussenhandel 1815-1870, Berlin, Akademie Verlag. Borries B. v, (1970), Deutschlands Auβenhandel 1836 bis 1856. Eine statistische Untersuchung zur Frühindustrialisierung, Stuttgart, Fischer Verlag. Bowring J., (1840), Report on the Prussian Commercial Union, London, (House of Commons Parliamentary Papers). Charles L., Daudin G., (2011), “Le Bureau de la balance du commerce,” Revue d’Histoire Moderne et Contemporaine, 58-1: 128–155. Dedinger B., (2012a), “Le problème des statistiques allemandes du commerce extérieur avant 1871,” Histoire@Politique. Politique, culture, société, 17. www.histoire-politique.fr. Dedinger B., (2012b), “L’Allemagne et la France dans la mondialisation commerciale aux XIXe et XXe siècles,” in J-F. Eck & D. Hüser, eds., Deutschland und Frankreich in der Globalisierung im 19. und 20. Jahrhundert, Steiner Verlag. 55. Lampe (2008), 99-100. 56. Borries (1970), 30 ; Lampe (2008), 100-101.
83
84
Béatrice Dedinger
Dieterici C.F.W., (1838, 1857), Statistische Uebersicht der wichtigsten Gegenstände des Verkehrs und Verbrauchs im preussischen Staate und im deutschen Zollvereine, Berlin, 6. Dumke R. H., (1994), German economic unification in the 19th century: the political economy of the Zollverein, Faculty of Social Sciences Universität der Bundeswehr München, part 2,. Ferber C.W., (1829, 1832), Beiträge zur Kenntnis des gewerblichen und commerciellen Zustandes der preussischen Monarchie, Berlin. Hahn H.-W., (1984), Geschichte des Deutschen Zollvereins, Göttingen, Vandenhoeck & Ruprech. Henderson W. O., (1984), The Zollverein, London, Frank Cass, 3e ed. Hirth G., (1869), “Beiträge zu einer Deutschen Handelsstatistik,” Staatshandbuch für Gesetzgebung, Verwaltung und Statistik des Norddeutschen Bundes und des Deutschen Zollvereins, II: 67–144. Hoffmann W.G. et al., (1965), Das Wachstum der deutschen Wirtschaft seit der Mitte des 19. Jahrhunderts, Berlin, Springer Verlag. Hübner O., (1852-1863), Jahrbuch für Volkswirtschaft und Statistik, Bd I-VIII, Leipzig. Junghanns C., (1848a), Der Fortschritt des Zollvereines, Leipzig, Weidmann’sche Buchhandlung. Junghanns C. (b), (1848), Die Fabrikindustrie des Zollvereins, Leipzig, Weidmann’sche Buchhandlung. Kaiserliches Statistisches Amt, (1875), Statistik des Deutschen Reichs, Vierteljahrshefte zur Statistik des Deutschen Reichs für das Jahr 1875, “Menge und geschätzter Werth der Waareneinfuhr und Menge des Waarenausfuhr im Jahre 1874,” Band XIV, erster Theil, Berlin. Kutz M., (1974), Deutschlands Aussenhandel von der französischen Revolution bis zur Gründung des Zollvereins, Wiesbaden, Steiner Verlag. Lampe M., (2008), “Bilateral trade flows in Europe, 1857-1875: A new dataset,” Research in Economic History, 26: 81–155. Lewis A., (1981), “The Rate of Growth of World Trade, 1830-1973,” dans Sven Grassman et Erik Lundberg (dir.), The World Economic Order. Past and Prospects, London, Macmillan, 27–32. Maddison A., (1995), L’économie mondiale 1820-1992, Paris, OCDE. Maddison A., (2001), L’économie mondiale : une perspective millénaire, Paris, OCDE. Mitchell B. R., (1988, ed. 2011), British Historical Statistics, Cambridge University Press. Morgenstern O., (1972), L’illusion statistique. Précision et incertitude des données économiques, Paris.
Trade statistics of the Zollverein, 1834-1871
Pfister U., (2015),“The quantitative development of Germany’s international trade during the eighteenth and early nineteenth centuries,” Revue de l’OFCE, 140. Reden F.W. von, (1847), “Werth und Richtung des auswärtigen Handels Deutschland,” Zeitschrift des Vereins für deutsche Statistik, I. Reichsamt des Innern, (1898), Auswärtiger Handel des deutschen Zollgebiets nach Herkunfts- und Bestimmungs-Ländern in den Jahren 1880 bis 1896, Berlin. Ritschl A. and Spoerer M., (1997), “Das Bruttosozialprodukt in Deutschland nach den amtlichen Volkseinkommens- und Sozialproduktsstatistiken 1901-1995,” Jahrbuch für Wirtschaftsgeschichte, 1997/2: 27–54. Soetbeer A., (1864), “Ueber die Ermittlung zutreffender Durchschnittspreise,” Vierteljahrschrift für Volkswirtschaft und Kulturgeschichte, Zweiter Jahrgang, Dritter Band, 13–22. Statistik des Deutschen Reiches, (1873), Auswärtiger und überseeischer Waarenverkehr des Deutschen Zollebiets und der Zollausschlüsse sowie Seeschiffahrtsverkehr im Jahre 1872, Band III, erster Theil. Statistik des Deutschen Reichs, (1875), “Menge und geschätzter Werth der Waareneinfuhr und Menge des Waarenausfuhr im Jahre 1874,” Vierteljahrshefte zur Statistik des Deutschen Reichs für das Jahr 1875, Band XIV, erster Teil. Wulf J., (1968), Der Deutsche Auβenhandel seit 1850, Stuttgart. Zimmermann F.W.R., (1908), “Die deutsche Handelsstatistik in ihrer geschichtlichen Entwicklung und ihrem derzeitigen Stand,” Jahrbücher für Nationalökonomie und Statistik, 1.
85
EARLY MODERN TRADE FLOWS BETWEEN SMALLER STATES THE PORTUGUESE-SWEDISH TRADE IN THE EIGHTEENTH CENTURY AS AN EXAMPLE1 Maria Cristina Moreira School of Economics and Management, University of Minho, Interdisciplinary Centre of Social Sciences (CICS.NOVA.UMinho), Portugal
Jari Eloranta, Appalachian State University (USA), University of Jyvaskyla, (Finland),
Jari Ojala, Lauri Karvonen University of Jyvaskyla, (Finland)
The eighteenth century was a period of many great power wars and competition for colonies. However, despite the turmoil, smaller nations were able to carve their niches in the international trade of the period. Examination of new sources, used in a comparative fashion, indicates that bilateral trade still has much to offer for the analysis of international trade history. The pattern of bilateral trade between Sweden and Portugal indicates that they were not equally dependent on that trade, and that the products traded varied over time. Usually bulk commodities dominated this trade, as each country focused on its core competencies. Overall, the volume of trade and the number of ships traveling to each nation tended to grow over time, although this growth was not very even. The French Revolutionary and Napoleonic conflicts were a time of difficulties for both states, given their involvement in wars. While the overall effects of warfare are typically quite negative, these years offered opportunities for smaller states too, until they had to adjust to the intense competition of nineteenth century globalization. Keywords: eighteenth century, international trade statistics, Portugal, Sweden, globalization, economic history, wars.
1. This article was funded by the Project PTDC/HIS-HIS/118984/2010: Trade Networks of Small and Neutral States before, during, and after the Revolutionary and Napoleonic Conflicts (1750-1850). Funding for this project has been provided by Fundação para a Ciência e Tecnologia, FEDER, PTDC 2010, as well as the Finnish Centre of Excellence in Historical Research, funded by the Academy of Finland. e-mail:
[email protected];
[email protected];
[email protected],
[email protected]
Revue de l’OFCE, 140 (2015)
88
Maria Cristina Moreira, Jari Eloranta, Jari Ojala, Lauri Karvonen
1. Introduction Early modern international trade has been researched as part of the issue of how the growth of international trade contributed to economic growth and industrialization. Trade flows have usually been analyzed in the context of great (trading) powers, and by focusing on major trade routes such as East Indian trade to Europe,2 Mediterranean trade (Braudel, 1995), Baltic–Dutch Trade (Tielhof, 2002), and trade flows between North America and Europe (North, 1966; Ahonen, 2005). Despite wars and the short-term disruptions they created for trade, the seventeenth and eighteenth centuries were a period of growth, in the context of the expansion and consolidation of European empires. The age of mercantilist warfare was accompanied by the rising importance of sea power. France, the Netherlands, and England, became the “systemic leaders” due to their extensive fleets and commercial expansion in the period before the Napoleonic Wars (Kennedy, 1976; Kennedy, 1989; Modelski and Thompson. 1988). Early modern states attempted to exert tight control over external trade flows. Even if trade was not a large sector in the national economies, given the predominance of agricultural production and activities, it nevertheless provided much needed revenue for the state. Moreover, states that relied more on trade revenues in order to cater for their spending needs usually also developed more complex systems of finance, including public debt. These, in turn, facilitated the transfer of some of the political and economic power to the merchant elites (Acemoglu, Johnson, and Robinson, 2005; Bonney, 1999a; Bonney, 1999b; Ferguson, 2001; Ferguson, 2003; Findlay and O’Rourke, 2007; Hart, 1999). Therefore, the extent and structure of early modern trade flows and their economic and fiscal impacts should be a major issue in the study of early modern economic growth and development. Although trade has been an object of interest for economic historians of the industrial revolution, less attention has been paid to exchanges between small countries. More generally, the roles 2. Relatively few studies of the various East-India Companies have analyzed the actual trade flows in detail, or applied statistical methods to the analysis. See e.g. Blussé, 1996; Hejeebu, 2005; Lawson, 2014. On trading companies and the emergence of multinational corporations, see Carlos and Nicholas, 1988. On trade expansion in this period, see O’Rourke and Williamson, 2002a.
Early modern trade flows between smaller states
that smaller nations played in the international economy, especially in this period of expansion of the European empires, need further investigation. Most trade historians have assumed that small countries occupied an insignificant role in the colonial networks. As Moreira and Eloranta (2011) have argued, while most smaller European states and the United States of America were politically and economically weak, they still contributed to and even controlled some significant commodity trade flows. Although, it is natural that historians focus on great empires, such as Great Britain and France, the consequence is that we have too little understanding of many of the trade networks between small and large nations, even though these networks were quite literally the lifelines of the great powers during times of intense conflict. During recent years, more effort has been put into investigating the concept of neutrality and the role of small states during the Napoleonic wars than previously. In this perspective, this article discusses the patterns of trade between Sweden and Portugal during the turbulent late eighteenth and early nineteenth centuries. The trade between small nations can also provide insights into the overall development of trade and shipping, such as the role of the “transport revolution” in the growth of international trade, and the causes for this revolution. Were they technological, organizational, or institutional? The idea of the “early transport revolution” presented by North in the 1950s was largely refuted by Harley in the 1980s who claimed that the real transport revolution did not occur until the wider introduction of iron steam ships in the late nineteenth century (North, 1958; Harley, 1988). The evolution of risk and economic instability is important for transport costs. In researching the Swedish trade with Southern Europe, Leos Müller has claimed that the risks of shipping declined during the eighteenth century. That had a positive impact on trade productivity, since shipping required smaller crews (Müller, 2003; Müller, 2004; Müller, 2006; Müller, 2012). The decline of such a risk was vital for small nations, as they did not have the resources, for example, to provide convoys to protect merchant vessels. However, even if business risks have been extensively studied, general trends of how uncertainty affected fluctuations in trade volume has not been widely discussed. Ojala and Karvonen (2013) demonstrate how fluctuations in trade between Sweden and
89
90
Maria Cristina Moreira, Jari Eloranta, Jari Ojala, Lauri Karvonen
Portugal leveled out during the eighteenth century. It is likely that even if there was not any “transport revolution”, overall, the trade fluctuations diminished as communications slowly improved and the semi peripheries became better integrated in the international economy and trade. In what follows, we provide an in-depth look at the trade flows between two smaller nations that will reveal some of the opportunities and problems in engaging in research on bilateral trade flows. Thus, the article discusses whether there was a “transport revolution” and whether conflicts expanded trade between small nations during the period. First, we explore some of the issues related to the sources of data as well as the methods used to compare the data. Then we observe and analyze the general trade flows from the seventeenth to the nineteenth centuries. Our main focus, however, is on the eighteenth century and especially the latter part of that century.
2. Sources and methods Multiple reasons make early modern trade a difficult issue: for example lack of reliable data, measurement issues, comparability of the data, and the difficulty in accessing the sources. The recent digitization of the Danish Sound Toll Registers has broken new ground for quantitative historians as this unique source provides abundant information on trade entering and leaving Northern Europe.3 All vessels (with a few exceptions due to the war of privileges attached to certain ships) entering or leaving the Baltic were registered. Moreover, these registers contain detailed information on flows of commodities through the Danish Sound.4 The purpose of the Sound Toll Registers was to document the collection of duties from vessels passing through the Sound.5 In the toll accounts, all the ships that were required to pay duty were listed. In the customs office, Toldkammer, the officials recorded the date of passage, name of the ship’s master and his town of residence, port or ports of 3. See http://www.soundtoll.nl/index.php/en/over-het-project/str-online. For a discussion of the usefulness of the data in the Sound Toll Registers see e.g. Gøbel and Hansen, 2007. 4. See Ahonen, 2005 for details. They do not measure intra-Baltic trade, of course. 5. Sound Toll records recorded transfer traffic, whilst the Portuguese and Swedish records were about the overall foreign trade. Thus, there are, of course, also Danish foreign trade statistics, which we do not use here.
Early modern trade flows between smaller states
departure and destination,6 home port and the name of the ship,7 the composition of the cargo, and finally the custom duties paid (Ahlström, 2000: 16; Rössner, 2010: 1). At the Sound, ships had to pay two different duties: “cargo dues” and “shipping dues”. The first were set according to cargo and the later according to the size of the vessel (Ahonen, 2005: 107). The payment of duty was based on various agreements and numerous regulations. In the customs office, the names of foreign articles were translated into Danish. No conversion or standardization of the foreign units was made: the original unit was retained (Scheltjens, 2009: 79). If the ship was carrying only ballast, it had to pay only light duty. For example in the 1740s, it was only two riksdalers. A ship with an average-sized cargo on the way from Sweden to Portugal paid some 75 riksdalers. Generally speaking the itemization was done carefully and meticulously, and the accuracy of the registration improved over time (Ahonen, 2005: 23). It is worthwhile noting that the rate of custom payments for each product seldom changed, even though the commodity prices varied considerably over time. However, the Sound Toll Registers’ value as a historical source deserves careful consideration as the present authors have shown in a preliminary work (Ojala, Karvonen, Moreira and Eloranta, 2015). The trade volumes provided by the Sound Toll Registers and by Swedish and Portuguese sources match fairly well. This suggests that both sets of sources are fairly accurate. Thus, they can be used to assess the trade flows between Portugal and Sweden in the late eighteenth and early nineteenth centuries. The second main source we use in this paper is the Portuguese trade records with Scandinavia (Sweden and Denmark) for the years 1776, 1777, 1783, 1787, 1789, and 1796–1800. They come from the Portuguese Balances of Trade. The body that recorded the entry and exit of merchandise in Portugal was the Contadoria da Superintendencia Geral dos Contrabandos, e Descaminhos dos Reaes Direitos (General Superintendence Accounting of Smuggling and Embezzle6. The port of destination is mentioned from the mid–1660s (Gøbel, 2007). During the eighteenth century sometimes only a rough estimate of the point of departure is mentioned, for example: Baltic or Mediterranean. 7. The name and size of the ship were often missing. Meanwhile the name of the agent is often mentioned, especially from the early nineteenth century onwards (Ahlström 1997: 50. Ahonen, 2005: 23).
91
92
Maria Cristina Moreira, Jari Eloranta, Jari Ojala, Lauri Karvonen
ment of Royal Rights). The officer who signed the balances of trade between 1800 and 1825 was Maurício José Teixeira de Moraes, who had been an employee of the Contadoria since 1774. The Balance of Trade was built upon different sets of documents issued by several state bureaus and compiled in “Books, Deals, Maps, Customs dispatch manifests of all the Kingdom Custom Houses and tax bureaus of this city”.8 These departments were responsible for the accuracy of the data collected. The source displayed both quantitative and qualitative information: prices, quantities, units, goods, classes, origins, and ports of entry of goods, exchange rates (for some years and markets), number of Portuguese and foreign ships that arrived and departed the country (also, for some years and markets). Each record of imports or exports was measured in terms of value. Most of the time it is also possible to identify the product and its quantity, price, and unit. The currency unit used was the réis and prices varied over the years. Export prices were FOB – free on board – and import prices were CIF – cost, insurance, and freight. It is possible to identify the flows of goods by destination and by Portuguese administrative region (where that flow was registered). For exports of goods to foreign nations, the origin within the Portuguese Empire (Africa, Asia, Atlantic Isles, Brazil, or Kingdom) is indicated. It is possible to identify the last port-of-call origin of imports as well. Moreover, in some cases we have information about the importing administrative region.9 Bearing in mind that smuggling and tax evasion were a perennial issue during the mercantilist era, it is safe to say that the Portuguese Balance of Trade provides a good representation of the actual flows of goods from and to Portugal and their prices. Furthermore, complementary sources are available in various Portuguese archives and can also be used to study trade between Portugal and Sweden. 8. “Livros, Relações, Mappas, e Manifestos dos Despachos de todas as Alfandegas do Reyno, e Mezas Fiscáes desta Cidade”. The Balance of Trade within the Kingdom of Portugal with the Foreign Nations, year 1800. 9. For further details, please check Portugal by Maria Cristina Moreira, included in this volume’s questionnaires.
Early modern trade flows between smaller states
Swedish foreign trade statistics are similar to Portuguese statistics. They were constructed to make the collection of customs duties by the state more efficient.10 It was in 1637 that the kingdom of Sweden first attempted to collect quantitative information about its foreign trade. However, until a century later, the statistics remained fragmented.11 From 1738 onwards, the Board of Trade (kommerskollegiet) started to summarize yearly trade statistics in tables (Historisk statistisk för sverige del 3. p. 66-68; Alanen, 1964). These tables were based on customs information from all Swedish ports and included all foreign trade data. The reporting convention remained uniform until 1814.12 The Swedish Board of Trade collected various types of information. The bulk of the archive concerns the series of annual reports on foreign trade and shipping (Series 1, 2, 4, and 5) and the balance of trade accounts (Series 3). Besides these, there are several collections of reports on, for example, the number and size of the ships leaving or entering the country. Some of the series (Series 1, 4, and 5) provide separate yearly data on each port for trade and shipping. The entire amounts of traded products are reported (in a summarized form, not ship by ship) both in volume and in value (riksdaler). Series 2 is organized by different products and product sets. It contains tables or sheets labeled according to a product name; rows are domestic ports or foreign countries (the bottom line summarizes the total import or export amount), and the columns contain periods ranging from 10 to 15 years. Thus, each table was for one year or one product, with information on import or export of each product group, with details given for each Swedish port as well as a total for the whole of Sweden. The balance of trade accounts give the trade balance (Handelsbalans). The trade balance is classified either geographically or by product.
10. Most of the important studies of Swedish foreign trade statistics were written at the turn of 1960s and 1970s. See Vallerö, 1969; Högberg, 1969; Historisk statistik for Sverige. Del 3 Utrikeshandel, 1972. 11. On Swedish foreign trade from 1637–1737, see Heckscher and Boethius, 1938; Vallerö, 1969. 12. During this long period, the collection of foreign trade statistics was strongly debated and criticized within the state administration. In 1776, the Board of Trade was no longer allowed to interfere with the trade statistics, and from there on other officials started to supervise the process. Historical Statistics för Sverige, del 3, 1972: 66-68; Vallerö, 1969: 97-99. See the questionnaire on Sweden in this volume for further details.
93
94
Maria Cristina Moreira, Jari Eloranta, Jari Ojala, Lauri Karvonen
There are some difficulties in making comparisons between the national sources and the Sound Toll Registers. The Sound Toll Register data provide customs dues for each cargo and volumes with dozens of units that were used for each specific commodity. It is therefore only possible to measure trade in volume by converting the various measuring units into tonnages. The customs payments amounts are the most uniform numerical data in the Sound Toll Registers. By comparing customs payments to tonnages, Scheltjens has estimated that 56.8 kg of cargo was valued at 1 skilling of taxes (or 2727.7 kg per riksdaler). Even though the ratio of tonnage and product varied for each individual product, this evaluation fits well with the equivalency of one riksdaler for one last of freight when handling large amounts of data (Scheltjens, 2009: 94). Thus, using this estimator, it is possible to translate volumes into values. Our goal is to use Sound Toll Register data to evaluate trade flows. In order to do so, however, we have to examine the comparability of the data. We endeavor to use a quantitative (cliometric) approach in our study. The study of early modern trade has not usually embraced quantitative methods that have become common among economic historians, i.e. the cliometric approach to historical analysis. Many economic historians studying the early modern period have focused on warfare and fiscal developments. For example Philip Hoffman has shown that it is possible to analyze the military sector and technology over several centuries, in fact before the industrial revolutions (Hoffman, 2011; Hoffman, 2012). Nonetheless, less effort has been placed on the broader trade flows before the nineteenth century, i.e. the type of analysis used to investigate the first era of globalization (Jacks, O’Rourke and Williamson, 2011; O’Rourke and Williamson, 1994, 2002a, 2002b). We use fairly simple statistical methods to uncover changing patterns over time instead of delving into intensive time series techniques. As already stated, the main purpose of compiling trade statistics was to collect customs duties and compute the trade balance for the benefit of the state administration. Therefore, the trade balances of early modern Europe mostly represented trade in monetary values. Some authorities, for example in Sweden, also measured trade, especially for bulk items, in volumes as well. Meanwhile, in Denmark, the Sound dues were based on trade
Early modern trade flows between smaller states
volumes. Thus, one of the problems in any comparison of trade flows is to reconcile statistics on volumes and values. There are both advantages and disadvantages to using trade statistics in value or volume. Volume is most suitable for long time series, because it abstracts from prices changes that might have an effect on the relative value of each good. On the other hand, it might sometimes be pointless and difficult to analyze and compare trade development in volumes for very different products in the absence of a common yardstick.13 Accordingly, values provide commensurability. When trade flows for different products are all measured in a common currency, the distribution of trade between different sets of commodities and between different geographic areas is immediately comparable. It must be underlined, though, that comparing trade amounts between different countries can be challenging because of exchange rates. While exchange rate data especially for the biggest European economies, such as Britain, the Netherlands, and France, are readily available, this may not be the case for semiperipheral countries (Denzel, 2010). Another issue with trade statistics measured in value concerns the significant price gaps between different areas. Because of trade costs and violations of the law of one price, different prices for the same commodity are measured at the different extremities of one trade flow. Even within the same country commodity prices could vary greatly. In 1800, for instance the price of log timber was about four times higher in Stockholm or Uppsala than in Jämtland, some 200 kilometers northwest of Stockholm and Uppsala. Therefore, one should study trade flows both in values and volumes, as we have done in the following section, to get a better picture of the economic relationships between two locations. The major question of whether there was a transport revolution within small nations during the eighteenth century relates also to the overall economic development of these countries. Even though the Swedish economy, for example, was rather agrarian at the time, international trade had a crucial impact on export-led growth. As Lars Magnusson states: “The expansion of Sweden’s international 13. On these issues, see Historisk statistic för Sverige Del 3. Utrikeshandel 1732–1970, 1972: 79-80.
95
96
Maria Cristina Moreira, Jari Eloranta, Jari Ojala, Lauri Karvonen
trade drew the country into a process of international capitalist growth” (Magnusson 2000: 1). Therefore, it is vital to know the size and composition of foreign trade in order to study the standard of living or GDP in the early modern period.14 The long eighteenth century is particularly interesting because there was a substantial increase in trade volumes during the century: for instance longdistance shipping expanded greatly. At the same time income, measured either by GDP or real wages, increased only slowly in Western Europe and almost stagnated in Sweden (Harding, 1999: 14).15
3. Trade flows between Scandinavia and Portugal: overall patterns and observations Dutch, French, and British vessels dominated seventeenthcentury international trade and shipping. Dutch dominance was especially clear in the Baltic trade. However, during the eighteenth century, the British acquired an increasing share of the Baltic trade. Moreover, countries and city-states with access to the Baltic, such as Prussia, gained a significant role. During the late eighteenth and early nineteenth centuries, the French Revolutionary and Napoleonic wars put a halt to the maritime trade of some of the great powers, France in particular, which in turn afforded opportunities for neutral commercial fleets to play a more prominent role. The first part of this story emerges clearly from the Sound Toll Registers (see Figure 1). Overall, the volume of trade remained fairly flat in the seventeenth century and increased substantially in the eighteenth century. We can then observe the devastating impact of the Revolutionary and Napoleonic conflicts. Growth after the fall of Napoleon in 1815 was quite rapid too, reflecting the surge of trade of the first globalization. It was sustained until the 1850s when the Crimean War brought a slowdown in trade.16
14. Trade balance (X-M) is one of the four components in the demand approach to GDP: (GDP) Y = C + I + G + (X • M), where C= consumption, I= investments, G= government spending, X=exports, I=imports. 15. On GDP, see Maddison, 2010. On nominal wages, see Allen, 2001. On the development of Swedish GDP, see Edvinsson, 2011. 16. The fall may also be explained by the fact that the collection of Sound Toll Register data may still be incomplete at the very end of the period.
97
Early modern trade flows between smaller states
Figure 1. Overall trade volume via the Danish Sound, based on the number of passages, 1634–1857 30000
25000
20000
15000
10000
5000
0 1634
1654
1674
1694
1714
1734
1754
1774
1794
1814
1834
1854
Source: Sound Toll Registers.
Both Sweden and Portugal were states to be reckoned with in this period, with Portugal having a more extensive overseas empire. Moreover, in the eighteenth century, economic relations between Sweden and Portugal were significant. In Southern Europe and the Mediterranean, which was long-distance shipping for Sweden, Portugal was Sweden’s most important trading partner, and the oldest Swedish consulate (founded in 1641) was in Lisbon.17 During the eighteenth century, Portugal was the most important salt exporter for Sweden and the salt trade was a significant part of Portugal’s foreign trade policy toward Sweden.18 For Sweden it was salt and for Portugal naval stores that were considered strategic products. In this bilateral trade some products were especially important in certain periods: in the 1720s, over 50 percent of Swedish wood board export went to Portugal, and in the mid-1750s a quarter of Setúbal’s salt went directly to Sweden. During the seventeenth century, it was the Dutch shipmasters that carried the salt imports to Sweden, but Swedish mercantilist policy was to reduce foreign 17. On Swedish-Portuguese trade, see especially Müller, 2004. See also Müller, 2008. Also, Lindberg, 2005. 18. On the Swedish salt trade, see especially Carlén, 1997.
98
Maria Cristina Moreira, Jari Eloranta, Jari Ojala, Lauri Karvonen
shipping and Sweden managed to expand its own salt shipping from Portugal after the passing of the Navigation Act in 1724. Sweden increased its trade volumes and the range of traded goods by negotiating commercial treaties, paying a dole for safe passages, and in general by maintaining good political relations with the pirate states in Northern Africa. Swedish–Portuguese shipping increased rather steadily in the course of the eighteenth century. While the Great Northern War, which lasted for almost the entire first quarter of the eighteenth century, interrupted some of those trade flows due to privateer activity, it was only a temporary setback. The number of ships sailing from Sweden to Portugal increased about fivefold from the late seventeenth to the late eighteenth centuries. Both diplomatic and national sources correlate fairly well with the Sound Toll Registers: the eighteenth century was a period of significant growth for exchanges between these two countries. Moreover, it appears that Sweden increased its role in providing freight capacity in this trade, especially during the turbulent years of the Revolutionary and Napoleonic wars. Figure 2. Share of Portugal in Swedish trade (right axis) and the number of Swedish merchant vessels traveling to Portugal (left axis), 1686–1815 120
16 The share of the trade with Portugal (bar)
100 Total 80
14 12 10
60
8 6
40
4 20
2
0
0 1686 1696 1706 1716 1726 1736 1746 1756 1766 1776 1786 1796 1806
Sources: Swedish Board of Trade, Sound Toll Registers (see also the text for details). See also Ojala et al. (2015), ‘Assessing the Reliability’ of the sources and calculations.
Early modern trade flows between smaller states
The Sound Toll Registers reveal that Swedish–Portuguese trade patterns were quite distinct. First of all, the ships engaged in this trade were more than 90 percent Swedish (including ships from Finland and Swedish dominions). Portuguese ship owners played only a minor part. In addition, it appears that exchanges consisted in a very select number of bulk commodities – Sweden’s main export to Portugal was iron, and Portugal’s main export to Sweden, salt. In fact, about 75 percent of the Swedish export cargo volume was bulk iron, while, according to the Sound Toll Registers, salt accounted for 99.1 percent of the cargo tonnage of Swedish imports, the remaining 0.9 percent being wine, fruit, sugar, and various luxury items.19 The trade between Portugal and Sweden was thus quite active, with almost 30 Swedish ships on average being annually employed in it. Still it did not yet have an established status as a routine trade as we were unable to find ships and shipmasters that specialized in it. From the Sound Toll Registers, it appears that the great majority of the Swedish captains sailed only occasionally to Portugal. As the total of 3,000 passages included over a thousand individual captains, few captains had frequent connections with southern Europe. When analyzing the shipping activity and routes of some of the captains who sailed to Portugal, their routes to and from Sweden appear to be diverse. Still, some shipmasters spent their careers almost entirely in the maritime trade to Portugal and southern Europe.20 As seen in Figure 2, Portugal’s significance for Swedish trade peaked in the mid-eighteenth century, and then started to decline. However, the number of ships traveling to Portugal continued to grow until the Napoleonic wars. If we now look from the side of Portugal, the eighteenth century was also a growth period for trade, at least in terms of the number of ships traveling to Sweden (see Figure 3). However, the most 19. In the Swedish Board of Trade tables, the cargoes from Portugal to Sweden appear to be more diverse. However, even there salt made up a substantial proportion of the entire cargo volume. 20. The amount of data concerning shipmasters is vast, and because of the various ways of spelling names, treating it is laborious work. Therefore, our notes on the shipmasters are only preliminary. For instance, Stockholm captains like Anders Molitor, Rasmus Rahm and Oluf Berlin spent their careers sailing exclusively between Stockholm and Portugal (or the Mediterranean). Shipmaster Isach Hulst from Karlshamn sailed only between Amsterdam and Karlshamn in first half of his career, but then specialized in sailing between Karlshamn and Setúbal.
99
100
Maria Cristina Moreira, Jari Eloranta, Jari Ojala, Lauri Karvonen
significant feature of this leg of the bilateral trade was not its growth but the considerable magnitude of its cyclical fluctuations. Figure 3. Share of Sweden in Portuguese trade (right axis) and the number of Portuguese merchant vessels traveling to Sweden (left axis), 1686–1800 120
90
Share of Sweden in Portugues trade (bar)
80
Portugues vessels traveling to Sweden (line)
100
70 60
80
50 60 40 30
40
20 20 10 0
0 1686
1696
1706
1716
1726
1736
1746
1756
1766
1776
1786
1796
Source: Portuguese Balance of Trade, Sound Toll Registers (see also the text for details).
The trade between Sweden and Portugal was concentrated both geographically and in terms of the variety of products. In Sweden, 65 percent of this trade was carried to and from Stockholm, and in Portugal Swedish trade focused on the Lisbon area.21 This was mainly due to the organization of domestic trade at the time through staple towns with rights to foreign trade and shipping in the mercantilist system. In the case of Sweden and Finland, the nature of ports did not make much difference – practically all towns had ports deep enough to accommodate international shipping. Moreover, vessels most commonly sailed first to Lisbon to sell their cargo of iron and then visited Setúbal to purchase salt cargo for the return journey.
21. The importance of ports has been measured by using Sound Toll Registers Online. Therefore, the Swedish ports on the North Sea coast were not involved in the calculations made in this article.
101
Early modern trade flows between smaller states
Table 1. Trade composition, measured from tonnage Percentages of the total volume
Swedish exports to Portugal
%
Portuguese exports to Sweden
Iron
75.2
Steel
4.1
Timber
5
Tar and Pitch
8.7
Copper
0.3
Miscellaneous
7.8
Average annual export tonnage
8,508 tons
%
Salt
99.1
Wine
0.21
Sugar
0.08
Fruit
0.003
Miscellaneous
0.61 14,171 tons
Source: Sound Toll Registers. See also Ojala et al (2015), ‘Assessing the Reliability’ of the sources and calculations.
There is one obvious phenomenon we can discern immediately in Swedish–Portuguese trade during the eighteenth century. Even though the trade expanded, it did not expand by becoming more diverse or including new products. On the contrary, bulk commodities dominated the trade in Portuguese and Swedish exports throughout the period. This observation seems to go against the idea that lighter and more sophisticated goods, such as sugar, coffee or wine, provided greater margins for merchants. Why did the share of these products not increase in the trade from Portugal to Sweden? The main explanation may be linked to the decline of real wages in eighteenth century Sweden. Although overall GDP rose during the century, due to notable population growth, per capita GDP declined. Even if the elites were still eager to buy foreign luxury items, the lower strata did not have the adequate purchasing power to do so. It is also possible that Portuguese luxury products became less competitive compared to the supply from nearby competitors, like France and Spain. In Portugal, even if a majority of the cargoes were destined for Lisbon, other ports played a role by specializing in certain commodities: for instance most of the Swedish steel arrived in Porto. The exports of Swedish and Finnish tar and timber, both essential for shipbuilding and maintenance, went mostly to Lisbon. Lisbon also received the majority of valuable miscellaneous products such as building materials, manufactured goods, grain and dyes. However, times of war and other upheavals had a dramatic impact on trade flows of specific products. As can be seen from Table 2, for most of the last quarter of the eighteenth century
102
Maria Cristina Moreira, Jari Eloranta, Jari Ojala, Lauri Karvonen
imports to Portugal from Sweden greatly exceeded exports. The cover rate fluctuated greatly due to the social and economic upheavals of the period. For example, in 1789, exports to Sweden plummeted. In 1798, imports fell, yet exports remained high. For most of the period, though, the overall volume of trade tended to grow quite vigorously, as seen in Figure 4. Table 2. Trade between Portugal and Sweden, 1776–1800 In Contos (one million réis) and as a percentage
Imports (1)
Exports (2)
Cover Rate = (2) / (1) * 100
1776
155
28
18
1777
183
55
30
1783
456
98
21
1787
270
30
11
1789
382
16
4
1796
673
165
25
1797
634
159
25
1798
302
205
68
1799
1,496
237
16
1800
1,164
148
13
Source: Portuguese Balance of Trade.
Figure 4. Portuguese imports and exports with Sweden, 1776–1800 30000
25000
20000
15000
10000
5000
0 1634
1654
1674
1694
Source: Portuguese Balance of Trade.
1714
1734
1754
1774
1794
1814
1834
1854
103
Early modern trade flows between smaller states
As seen in Table 3, the Swedish share of Portuguese imports and exports fluctuated considerably in the 1780s and 1790s, due to the upheavals of the period. Quite naturally, wars offered both opportunities and challenges for external trade. More often than not, wars in which smaller nations were able to remain out of the conflict enabled them to explore new markets and serve as channels for important commodities for the feuding great powers (Moreira and Eloranta, 2011; Moreira, 2013). For example, 1783 saw a big increase in Sweden’s role for Portugal, although this role was rather short-lived. The same happened in 1789 and 1799. While wars may have hurt trade flows among global powers in the aggregate sense, they did not necessarily have the same impact on smaller nations. The overall pattern is shown in Figure 5. Note that the cover rate jumped substantially during the turbulent 1790s. Table 3. Share of Swedish trade in Portuguese foreign trade In %
1776 1777 1783 1787 1789
1796 1797 1798 1799 1800
Share of imports
1.6
2.0
6.4
2.6
4.2
2.6
3.2
1.1
4.3
3.3
Share of exports
0.3
0.7
1.7
0.4
0.2
0.7
0.7
0.7
0.6
0.4
Source: Portuguese Balance of Trade.
Figure 5. Portuguese imports and exports with Sweden, 1776-1800 120
Cover rate external markets 100
80
60
40
Cover rate Sweden 20
0 1776
1777
1783
Source: Portuguese Balance of Trade.
1787
1789
1796
1797
1798
1799
1800
104
Maria Cristina Moreira, Jari Eloranta, Jari Ojala, Lauri Karvonen
In general, the bilateral trade with Portugal was a worthwhile business for Swedish vessels and captains. The ships had cargo to transport in both directions, and only in a few individual cases did the returning ships carry ballast in part.22 One of the reasons that attracted Swedish ships to sail to Mediterranean ports was also the possibility of continuing freight shipping there during wintertime. The profits from bulk cargoes transported from Sweden to Portugal were fairly low, but this was compensated by the possibility of participating in the fairly profitable freight shipping during the period when the Baltic was iced over.23 There were a number of Swedish and Finnish ships engaged in the profitable freight carrying trades in the Mediterranean area already during the eighteenth century. By the turn of the century, this activity increased as there was rising demand for cargo carrying capacity with neutral flags during the ongoing Revolutionary and Napoleonic wars. Several of the Swedish ships entering and departing from Setúbal in the early nineteenth century were ordered to sail to a port other than a Swedish port. Of the 46 Finnish ships visiting Setúbal in 1800, 1801, and 1803, almost half were heading somewhere other than the Baltic. In this case, though, nine ships were bound for Gothenburg, which underscores the importance of this westernmost town for Swedish trade and shipping.24 During the eighteenth century, the bilateral trade between Sweden and Portugal increased significantly in absolute value, yet its proportion in the aggregate Swedish trade did not show a significant rise. After the War of Roussillon (1793–1795), the increase in Portuguese imports from Sweden was not only due to an upturn in the demand for Portuguese products, but also because Brazil was an important final destination for Swedish iron. Swedish iron had to be transported to Portugal because of the Colonial Pact. The increased Portuguese trade between the late eighteenth century and the beginning of the Peninsular War was, in essence, linked to the demand for Brazilian colonial products in the domestic and international markets. In turn, the growth of Swedish trade to Portugal was rather 22. Jeannin, 2002, discusses the ballast with which many ships left Holland for the Baltic. 23. Unfortunately, as Müller reminds us, the original sources do not provide sufficient data to analyze the importance of this Mediterranean tramp shipping (Müller, 2004; Müller, 2006). 24. Swedish National Archives, Board of Trade, Consular reports, Setubal 1800, 1801, 1803.
Early modern trade flows between smaller states
linear from the end of the Great Northern War to the early nineteenth century, and from the Sound Toll Registers, the revolutionary wars did not seem to have significantly altered this trend in either direction. Our other sources, though, indicate that Swedish freight carrying had been growing steadily during this period. The growth in Swedish shipping in terms of passages through the Danish Sound during the eighteenth century was about 140 percent, while shipping to Portugal increased 141 percent.25 Thus, trade and shipping between Sweden and Portugal grew steadily, and was not hindered significantly by the conflicts of the period or changes in market conditions. The bilateral trade was fundamentally useful to both parties, and the turmoil of the period changed domestic demand for their respective products very little.
4. Conclusions and further challenges The pattern of bilateral trade between Portugal and Sweden in the long eighteenth-century indicates that the two countries were not equally dependent on their bilateral trade – this trade was more important to Sweden than to Portugal, since the latter had more extensive colonial markets to rely on. However, certain products such as tar, timber, salt, and wine dominated trading relations. Overall, trade volumes and the number of ships traveling to each nation tended to grow over time, although this growth was uneven. For Portugal, the aggregate trade tended to develop in a cyclical fashion, possibly driven by domestic market fluctuations and residual effects of conflicts, whereas the Swedish trade with Portugal peaked in the middle of the eighteenth century, only to decline during the tumultuous years at the close of the century. It seems that the Revolutionary and Napoleonic Wars particularly impacted Swedish trade as they hindered the use of the Danish Sound. The Portuguese, who had to endure brutal fighting during the Peninsular War, were able to turn to their colonial connections and Atlantic markets during these conflicts. The analysis of international trade has focused too much on trade by great powers and, respectively, disruptions caused by great power conflicts. With the availability of new sources of informa25. Estimated by comparing the averages in the periods 1723–1727 and 1796–1800.
105
106
Maria Cristina Moreira, Jari Eloranta, Jari Ojala, Lauri Karvonen
tion on trade, such as the Sound Toll Registers, we can now analyze international trade flows more effectively. Based on this article and our other work, we believe the Sound Toll Registers, in general, correspond fairly well with national historical sources on trade. By combining these records we can analyze bilateral trade in a much more comprehensive manner. It seems that trade between smaller nations – and most likely between neutral states and great powers – actually thrived despite the international turmoil. This was clearly the case for Swedish–Portuguese maritime trade. Here we cannot go further into the discussion of smaller states’ roles during conflict periods and the impact on trade – however, it is clear from this data that bilateral (and surely multilateral) trade relationships were affected by the conflicts of the period. In general the trade between smaller states like these offered opportunities to engage in trade while the great powers fought for supremacy. Thus the impact of warfare as a negative force in economic transactions is a complex phenomenon to be analyzed from different angles, including the smaller and/or neutral states. While we can reach such conclusions based on the available data, there are still limitations to this study. First of all, the records are more complete on the Swedish side, and the Napoleonic conflicts did not have an equally devastating impact on them. Second, the issues of measurement and conversion are quite daunting – here we have not gone into great detail about them. Fortunately, there is now more and more information about conversions into common units and currencies. Third, it is not necessarily very telling in itself to look at bilateral trade flows. Most nations are engaged in multilateral trade networks, and the study of such networks holds great promise. Here we simply provide some initial findings in the study of early modern Swedish and Portuguese trade.
References Acemoglu, D., Johnson, S., and Robinson, J., (2005), “The rise of Europe: Atlantic trade, institutional change, and economic growth.” American Economic Review: 546–79. Ahonen, K., (2005), From Sugar Triangle to Cotton Triangle: Trade and Shipping between America and Baltic Russia, 1783–1860. Jyväskylä: Jyväskylän yliopisto.
Early modern trade flows between smaller states
Allen, R. C., (2001), “The great divergence in European wages and prices – from the Middle Ages to the First World War.” Explorations in Economic History, 38. Blussé, L., (1996), “No boats to China. The Dutch East India Company and the changing pattern of the China Sea trade, 1635–1690.” Modern Asian Studies, 30(01): 51–76. Bonney, R., (1999a), “Introduction” In The Rise of the Fiscal State in Europe C. 1200–1815, R. Bonney, Oxford: Oxford University Press, 1–17. Bonney, R. ed., (1999b), The Rise of the Fiscal State in Europe C. 1200–1815. Oxford: Oxford University Press. Braudel, F., (1995), The Mediterranean and the Mediterranean World in the Age of Philip II. University of California Press. Carlén, S., (1997), Staten som marknadens salt: en studie i institutionsbildning, kollektivt handlande och tidig välfärdspolitik på en strategisk varumarknad i övergången mellan merkantilism och liberalism 1720–1862. Stockholm. Carlos, A. M. and Stephen, N., (1988), “‘Giants of an Earlier Capitalism’: The chartered trading companies as modern multinationals.” Business History Review 62(03): 398–419. Denzel, M. A., (2010), Handbook of World Exchange Rates, 1590–1914. Burlington: Ashgate. Edvinsson, R., (2011), “New estimates of Swedish GDP by activity 1665– 2010.” Stockholm Papers in Economic History 12. Ferguson, N., (2001), The Cash Nexus: Money and Power in the Modern World, 1700–2000. New York: Basic Books. Ferguson, N., (2003), Empire: The Rise and Demise of the British World Order and the Lessons for Global Power. New York: Basic Books. Findlay, R. and O’Rourke, K., (2007), Power and Plenty: Trade, War, and the World Economy in the Second Millennium. Princeton: Princeton University Press. Gøbel, E. and Hansen, U. F., (2007), “Denmark” in Baltic Connections: Archival Guide to the Maritime Relations of the Countries around the Baltic Sea (including the Netherlands) 1450–1800 Vol. 1, L. Bes, E. Frankot, and H. Brand (eds.), Leiden. 25-86. Harding, R., (1999), Seapower and Naval Warfare from 1650–1830. London: UCL Press. Harley, C. K., (1988), “Ocean freight rates and productivity, 1740–1913: the primacy of mechanical invention reaffirmed”. Journal of Economic History 48. Hart, M., (1999), “The United Provinces, 1579–1806.” In The Rise of the Fiscal State in Europe C. 1200–1815, R. Bonney. Oxford: Oxford University Press.
107
108
Maria Cristina Moreira, Jari Eloranta, Jari Ojala, Lauri Karvonen
Heckscher and Boethius, (1938), Svensk handelsstatistik 1637–1737. Stockholm. Hejeebu, S., (2005), “Contract Enforcement in the English East India Company.” The Journal of Economic History 65(02): 496–523. Historisk statistik for Sverige. Del 3 Utrikeshandel, 1972. Stockholm. 79–80. Hoffman, P. T., (2011), “Prices, the military revolution, and Western Europe's comparative advantage in violence.” The Economic History Review 64(01): 39–59. Hoffman, P. T., (2012), “Why was it Europeans who conquered the world?”. The Journal of Economic History 72(03): 601–633. Högberg, S., (1969). Utrikeshandel och sjöfart på 1700-talet. Stockholm. Jacks, D. S., O’Rourke, K. H., and Williamson, J. G., (2011), “Commodity price volatility and world market integration since 1700.” Review of Economics and Statistics. 93(3): 800–813. Kennedy, P., (1976), The Rise and Fall of British Naval Mastery. London: A. Lane. Jeannin, P., (2002), “Les villes hanséatiques dans le commerce européen du XVIIIe siècle”, Marchands d’Europe, p. 79–107. Kennedy, P., (1989), The Rise and Fall of the Great Powers. Economic Change and Military Conflict from 1500 to 2000. London: Fontana. Lawson, P., (2014), The East India Company: A History. Routledge. Lindberg, E., (2005), “An eighteenth century Swedish perspective on the Portuguese salt industry. With trade and production figures.” In Actas I Seminário Internacional sobre o sal português. Porto. Maddison, A, (2010), Historical Statistics of the World Economy. Magnusson, L., (2000), An Economic History of Sweden. London: Routledge. Modelski, G. and Thompson, W. R., (1988), Seapower in Global Politics, 1494–1993. Houndmills, Basingstoke, Hampshire: Macmillan Press. Moreira, M. C. and Eloranta, J., (2011), “Importance of ‘weak’ States during conflicts: Portuguese trade with the United States during the Revolutionary and Napoleonic Wars.” Revista de Historia Económica 29(03): 393–423. Moreira, M. C., (2013), Relaciones comerciales luso-españolas, 1774–1860. Madrid, Editorial Académica Española. Müller, L., (2003), “The Swedish East India trade and international markets: Re-exports of teas, 1731–1813.” Scandinavian Economic History Review 51(3): 28–44. Müller, L., (2004), Consuls, Corsairs, and Commerce: The Swedish Consular Service and Long-Distance Shipping, 1720–1815. Uppsala: Uppsala Universitet.
Early modern trade flows between smaller states
Müller, L., (2006), “The Swedish consular service in southern Europe, 1720–1815” Scandinavian Journal of History 31(2): 186–95. Müller, L., (2008), “Swedish–Portuguese trade and Swedish consular service, 1700–1800.” In A articulação do sal Português aos circuitos mundiais antigos e novos consumes, I. Amorim (ed.). Porto. Müller, L., (2012), “The forgotten age of swedish shipping: The eighteenth century.” International Journal of Maritime History 24(2): 1–18, North, D. C., (1958), “Ocean freight rates and economic development 1750–1913” Journal of Economic History 4. North, D. C., (1966), The Economic Growth of the United States, 1790–1860. New York: Norton. Ojala, J. and Karvonen, L., (2013), “Scandinavian trade flows with the smaller and medium-sized states in the 18th and 19th centuries Swedish–Portuguese trade in 18th century”. In APHES conference. Braga. Ojala, J., Karvonen, L., Moreira, M. C., and Eloranta, J., (2015), “Assessing the reliability of the Sound Toll Accounts: comparing the data in the Swedish and Portuguese sources.” In The Baltic in European Maritime History, 1600–1800, J.W. Veluwenkamp and W. Scheltjens (eds.). Forthcoming. O’Rourke, K. H. and Williamson, J. G., (1994). “Late nineteenth-century Anglo-American factor-price convergence: were Heckscher and Ohlin right?” The Journal of Economic History 54(04): 892–916. O’Rourke, K. H. and Williamson, J. G., (2002a), “After Columbus: explaining Europe's overseas trade boom, 1500–1800.” The Journal of Economic History 62(02): 417–456. O’Rourke, K. H. and Williamson, J. G., (2002b). “When did globalisation begin?” European Review of Economic History 6(1): 23–50. Scheltjens. W., (2009), “The volume of Dutch Baltic shipping at the end of the eighteenth century: a new estimation based on the Danish Sound Toll Registers.” Scripta Mercaturae 43(1): 74–102. Tielhof, M. van, (2002), The ‘Mother of All Trades’: The Baltic Grain Trade in Amsterdam from the Late Sixteenth to the Early Nineteenth Century. Leiden: Brill Academic Publishers. Vallerö, R., (1969), Svensk handels- och sjöfartsstatistik 1637–1813. Stockholm. Whaples, R., (1991), “A quantitative history of the Journal of Economic History and the cliometric revolution.” The Journal of Economic History 51(2): 289–301. Whaples, R., (2002), “The supply and demand of economic history: recent trends in the Journal of Economic History.” The Journal of Economic History 62(2): 524–532.
109
ONE SOURCE TO RULE THEM ALL? COMBINING DATA ABOUT TRADE AND SHIPPING FROM AMSTERDAM TO THE BALTIC IN THE LATE EIGHTEENTH-CENTURY
Jeroen van der Vliet1 Curator of Maritime Collections at the Rijksmuseum, Amsterdam, The Netherlands.
Even after the economic boom of the 17th century had faded away, during the 18th century Amsterdam remained an important entrepot for a wide variety of goods, especially to and from the Baltic, considered by contemporaries as the 'mother of all trades'. What role did local merchants have in the continuation of maritime trade? What were the challenges they faced? Combining different data sources might provide a better understanding of their activities. In this paper several data sources are discussed, with a focus on the Baltic trade and the use of data from both muster rolls and the Sound Toll Registers. Keywords: eighteenth century, international trade statistics, Amsterdam, globalization, economic history, Baltic trade, navigation.
1.
email:
[email protected]
Revue de l’OFCE, 140 (2015)
112
Jeroen van der Vliet
1. Introduction The Dutch Republic witnessed a period of unprecedented economic prosperity in the first half of the 17th century, later described by historians as a ‘golden age’. This was most evident in Amsterdam. It became the entrepôt of Europe, a major centre of the arts and sciences, and the birthplace of many innovations in finance, insurance, commercial services, shipbuilding and maritime transport (De Vries and Van der Woude, 1995; Prak, 2002). Amsterdam was a big magnet for both people, trade, capital and ideas; it was simply ‘the place to be’ in 17th century Europe. Much of the historical debate on this prosperity has traditionally focused on the rise of the Dutch Republic as an economic powerhouse. What happened afterwards received far less attention. To many historians the 18th century was just a long period of stagnation and decline in the shade of a more glorious past (Brugmans, 1930; Boxer, 1965; Schama, 1977; Israel, 1988), and they found themselves confirmed by contemporary sources. A letter, written in 1764 by James Boswell to his friend William Temple about his visit to the Netherlands, summed it all up nicely: “this trading nation must be in a very bad way. Most of their principal towns are sadly decayed, and instead of finding every mortal employed, you meet with multitudes of poor creatures who are starving in idleness” (quote from Pottle, 1952). And Boswell was not the only one to note these changes. Commentators in the Dutch broadsheets of the time railed against the unscrupulous bankers, the frolicking of the regent class, the moral decay of the middle classes and the lazy merchants who rather sat on their piles of money than invest it in ‘good and honest’ trade, as they surely would have done if only they had lived a century earlier (Brugmans, 1912). Indeed many of the defining factors that had contributed to the rise of the Dutch Republic in the 17th century were still present a hundred years later: its strategic location on a crossroads of trade routes connecting all major European economic regions; the presence of a large and relatively wealthy, literate and urbanized middle class; the accumulation of know-how and investment capital; it still boasted one of the largest merchant fleets in the world, serving a colonial trade network that spanned three continents. So, what had changed? Was it stiffer competition from merchants from other countries, especially the British? Some argue
One source to rule them all?
that the Dutch were beaten in their own game, with the ‘Glorious Revolution’ of 1688 as the defining moment when the British copied Dutch business and financial practices and thus the foundations were laid for their own ‘golden age’ (Jardine, 2008). Others might rather point to the erosive effects of the increasing number of protectionist measures, starting with the Navigation Act of 1651 of Britain and the later mercantilist policies put in place by France, Sweden and Russia. Although not immediately these measures did have a damaging long-term effect on the Dutch merchant fleet that could only thrive in a trully open and free market. ‘Neutral goods in neutral ships’ was the maxim of 18th century Dutch shipmasters (Van Eyck van Heslinga, 1982) and it paid them a handsome dividend when countries other than there own were fighting. It was also based on the premise that Dutch neutrality was respected by all parties and could be backed up by naval force if necessary, but by the third quarter of the 18th century the five Admiralities of the Dutch Republic were no longer in fighting form (Bruijn, 1998). But the 18th century had not been one long period of doom and gloom. Westermann (1948) discovered a new peak in Dutch economic growth between 1730 and 1740. Decline only had set in during the second half of the 18th century, when it became apparent throughout the Dutch economy, as was confirmed by Israel (1989). A major contribution to this economic debate came from Johan de Vries2 who made a clear distinction between “absolute” and “relative” decline in the economy of the Dutch Republic (De Vries, 1959). Overall trade remained remarkedly constant throughout the 18th century, but considering that trade in the surrounding countries rose considerably faster during the same period this meant an increasing gap, but not necessarily a decline. Recent studies seem to confirm this idea as even in the latest historiography of Amsterdam the word “decline” made way for “stagnation and stability” (Lesger, 2005). Maybe the 18th century is not the exception to the rule, but should we start to consider the Wirtschaftswunder of the 17th century as the oddity in Dutch history. 2.
Not to be confused with the already mentioned Jan de Vries.
113
114
Jeroen van der Vliet
Meanwhile, the problems facing the much criticised merchants of Amsterdam must have seemed to them almost overwhelming at times, as solutions were mainly out of their reach, at least when it came to foreign economic policies or naval spending. This makes the question how these merchants were able to even continue trading, especially at the end of the 18th century, even more relevant. How did they cope with the major disruptions in international trade and shipping, caused by political developments in Europe and abroad, such as the American War of Independence or the wars of Revolutionary France? What sources do we actually have about trade and shipping in the Dutch Republic and what can they tell us about the very real economic circumstances the merchants in Amsterdam had to deal with on a daily basis? As the Baltic trade was considered the ‘mother of all trades’ of the Dutch Republic (Van Tielhof, 2002) and the cornerstone of Amsterdam’s prosperity, we will look more closely to developments in this sector in particular.
2. Trade statistics Throughout the 18th century there was hardly any form of systematic data collecting, at least not for the statistical purposes we have become accustomed to.3 Therefore we have to make use of largely indirect information; data that were not brought together for the purpose we are now using them for. While there are several sources that can be used as an indication of general economic developments, like population growth, migration, housing prices, employment and production, what are the sources that specifically concern trade and shipping in the 18th century? Pringsheim (1890) was one of the first who made use of data available in the municipal archive in Amsterdam (Knotter, 1995): the collected duties of the ‘convooien en licenten’ (Figure 1) and the published ship tidings of vessels arriving at Texel and Vlieland. The ‘convooien en licenten’ were a collection of import and export duties on a number of commodities. These duties were raised at the sea and land borders of the Dutch Republic on behalf of the five 3. For a general discussion of the sources of Dutch trade statistics, see also the Scheltjens entry in this volume.
115
One source to rule them all?
Admiralties, and were originally intented to maintain a fund to pay for the costs of protecting the merchant fleet by way of a convoy system (‘convooien’) in times of war. The accounts for 1681-1766 have survived. This makes this source particularly attractive for the study of long-term developments in trade. Not surprisingly, Pringsheim’s own findings quickly found their way into other publications too (Brugmans, 1901; Becht, 1908; Brugmans, 1911; Posthumus, 1943-1964) before being proven wrong by Westermann (1948). Westermann corrected his colleagues for not taking into full account the long-term changes in the tariffs, let alone the effects of inflation over such a long period. The height of the tariffs also differed too much over the years and in 1725 the States General ordered a major overhaul of the administration. The data from before this reorganisation simply cannot be compared with those from the rest of the 18th century (Van Dillen, 1948: 148). Figure 1. The collection of the ‘convooien en licenten’ duty, 1725-1796 1200
1000
800
600
400
200
0 1725
1735
1745
1755
1765
1775
1785
1795
Source: Oldewelt, 1953: 127-129.
That there can also be problems with the very meaning of a data source, was pointed out by Oldewelt (1953) for the second source Pringsheim had used: the ship tidings. These tidings recorded the ships that had arrived at the roadstead of Texel and in the Vlie and from the 1770s onwards these were published weekly in the newspapers of the time. As Texel and the Vlie are the two major entry points from the sea to the port of Amsterdam, Pringsheim interpreted their numbers as the total number of ships that sailed for
116
Jeroen van der Vliet
Amsterdam. But there were more ports along the Zuyderzee, Amsterdam was only the largest. The use of this source raises another question, too. The very number of ships arriving does not say much on its own (Welling, 2009). Knowing their size or cargo capacity will prove much more useful especially as there were considerable differences between the sizes of the ships employed on different routes. For instance, ships to the Russian port of Archangelsk were on average twice the size of those that sailed to the Atlantic ports of Spain and France (Knoppers, 1977: Table I). A second, and often used duty is the ‘gewone veil- en lastgeld’ (Oldewelt, 1953; Figure 2). It was a combined duty, consisting of the ‘lastgeld’ of 1623 and the ‘veil- en mastgeld’ introduced in 1645. The first was originally intended to attribute to the costs of protection provided by the Admiralties for ships in the Mediterranean trade, a dangerous route because of the presence of pirates from the Barbary states. In 1632 the measure was enlarged to include the Baltic trade. The second was added in 1645 for ships bound for Norway. These duties were combined in 1687. By 1702 the duty was not enough to counter the increasing costs for anti-piracy measures in the Mediterranean and the Baltic and a new fund was created to be supplied from another duty, the ‘verhoogde veil- en lastgeld’. The ‘lastgeld’ duty was raised annually and was based on the ship’s capacity, in lasts. The ‘veilgeld’ duty was, like the ‘convooien en licenten’, based on the value of the carried commodities. Figure 2. The collection of the ‘veil- en lastgeld’ duty, 1725-1796 1200
1000
800
600
400
200
0 1725
1735
Source: Oldewelt, 1953: 127-129.
1745
1755
1765
1775
1785
1795
117
One source to rule them all?
The third duty is the ‘paalgeld’ (Figure 3). This source was first published by Heeres (1982), while Welling (1998) used it substantially in his research into the trade relations between the Dutch Republic and North America between 1771 and 1817. The ‘paalgeld’ duty was raised in all the Zuyderzee ports on the cargoes that were imported by the ships arriving at Texel and Vlieland. The duty was used for the maintenance of lights, buoys and other markers in the sea-lanes. Until 1836 the town of Enkhuizen was responsible for this maintenance and was allowed to raise this duty, although in practice it was collected by the same officers from the Admiralties as all the other duties. The annual ledgers or Havenboeken van de Heffing van het Paalgeld have survived for the years 1742 and 17711836 and record all the incoming ships, the name of the ship, the name of shipmaster and the port of origin. As the ‘paalgeld’ was based on the total value of the cargo, it is possible to establish which goods every ship was carrying. However, for ships from the West Indies and Africa only the total amount is documented, while those from European ports are broken down to specific types of goods and their subsequent values. Figure 3. The collection of the ‘paalgeld’ duty, 1725-1796 50000 45000 40000 35000 30000 25000 20000 15000 10000 5000 0 1725
1735
1745
1755
1765
1775
1785
1795
Source: Heeres, 1982: 9-11.
The composition and value of cargoes of individual ships can also be found in the Danish Sound Toll Registers, albeit only for ships going to and coming from the Baltic. Because of the long period of data collecting, 1497 to 1857 (Gøbel, 2010), and the
118
Jeroen van der Vliet
amount of details gathered, the registers provide both a consistent and highly detailed view on international goods flows, including those between Amsterdam and the Baltic (Figure 4). The Baltic trade was of great importance to the Dutch Republic and was considered by contemporaries ‘the mother of all trades’. Both Dutch shipmasters and merchants dominated the trade and shipping of Baltic goods, especially grain, for three centuries (Van Tielhof, 2002). The rise of Amsterdam as entrepôt in the 17th century was the direct result of the increasing trade in Baltic grain shipped through the port to a growing population in the south of Europe. This trade had been very substantial throughout, but also proved vunerable to economic and demographic changes elsewhere. When after 1650 the population of Europe stopped growing this affected both the demand in northern grain in the South and the demand for southern products in the North, causing stagnation and decline in Amsterdam (Westermann, 1948; Posthumus, 1943-1964; Van Dillen, 1970). However, the port of Amsterdam remained an important entrepôt in the 18th century thanks to the large volumes of Baltic grain and southern products that still went through the port. Figure 4. Overall traffic from Amsterdam to the Baltic, based on recorded eastbound passages through the Danish Sound, 1700-1800 1400 1200 1000 800 600 400 200 0 1700
1710
1720
1730
1740
1750
1760
1770
1780
1790
1800
Source: Sound Toll Registers Online.
In the registers can be found the commodities, the amounts in which they were carried onboard, from which port they came and
One source to rule them all?
where they were going and by which shipmaster. Not only can we establish the share of Amsterdam in the Baltic trade, as an entrepôt for both Baltic goods as well as for goods for the Baltic markets, but also the part Dutch shipmasters played as carriers of these goods, also to other ports than those in the Dutch Republic. In the end, the Sound Toll was ‘just another’ duty with its own shortcomings. Officials were not allowed on board to examine the cargoes but depended on the declaration of the shipmasters. Also, we do not know from this source for which merchants these goods were carried or by whom the shipmasters were employed.
3. Merchant activities To get a better understanding of the daily business of 18th century merchants in Amsterdam, the use of the above sources alone falls short; they provide us with insights on the level of trade, specific traffic flows and the sorts and amounts of the commodities involved, but at this point they cannot be related to individual merchants. Several studies have been published about merchants and their firms located in 18th century Amsterdam (Veluwenkamp, 1981; Jonker & Sluyterman, 2000; Voorthuysen, 2001), but most concern the larger firms and businesses like Hope (Buist, 1974), Van Eeghen (Rogge, 1949) and Insinger (Jonker, 2000). From the second half of the 18th century these larger firms started their transition from trading firm to merchant banks, and therefore their histories are atypical for the common merchant. But who are these common merchants? Contrary to the already mentioned firms, the archives of these smaller businesses did not survive so it is difficult to learn about their daily activities. Many merchants were united in larger associations, called ‘directies’ or boards, which were organised according to the regions with which they traded the most and whose elected boards lobbied the governments and town councils of both Amsterdam and the major trading ports, like the Board of Eastern Trade (‘Directie der Oostersche Handel en Rederijen voor de Oostzee’) for the Baltic, the Board of Muscovy Trade (‘Directie van de Moscovischen Handel’) for Russia, the Board of Norwegian Trade (‘Directie van den Noorweegschen Handel’), the Board of the Greenland Fisheries (‘Directie van de Groenlandsche Visscherij’) or the Board of Trade and Navigation to
119
120
Jeroen van der Vliet
the Levant and the Mediterranean (‘Directie op de Levantsche Handel en de Navigatie in de Middellandse Zee’) (Bruijn, 1990). Merchants were barred from doing business directly in Asia due to the strict trade monopoly of the East India Company (VOC), but from the 1730s they were able to trade directly within the wider Atlantic, when a similar monopoly held by the West India Company (WIC) was lifted (Den Heijer, 1994). The archives of these boards contain the names of the board members and sometimes the names of the associated merchants, too. From the income tax statements from 1742, we discover that in that year 33 recipients stated their profession as a ‘cargadoor’ (Oldewelt, 1945). The ‘cargadoors’ or ship’s agents played an important role in bringing together merchants who needed a ship to carry the goods and the shipmasters who could provide that service. The number of 33 ship’s agents is remarkable, as at that time London counted just one ship’s agent; it is an indication of the high level of specialisation and efficiency that allowed the port of Amsterdam to remain ahead of the competition (Broeze, 1977: 134). The ‘cargadoors’ could be found at the Exchange (‘Beursgebouw’) where they had their own stands (Spooner, 1983: 19-20). According to a floor plan of the Exchange from 1801 the ‘cargadoors’ were located right in the middle of the courtyard. Not far from them assembled the ‘cargadoors’ and shipmasters specialised in regions and ports, like Hamburg and Bremen (pillar 14), Great Britain (pillar 34), Sweden (pillar 39) and Surinam (between the seventh and 41st pillar). That the ‘cargadoors’ played an important role was also confirmed by Le Moine de l’Espine and Le Long (1780: 292-294). In their description of several services available to the merchant in Amsterdam, they stated that it was through the ‘cargadoor’ that a merchant came into contact with the shipmaster when he needed a ship or just wanted to ship some items, and when a deal has been made, it was the ‘cargadoor’ who could make a contract too, without the need to visit a notary.
4. The muster rolls The important role of the ‘cargadoor’ in the port of Amsterdam is also evident from another source, the muster rolls. ‘Cargadoors’
One source to rule them all?
acted as local correspondents, especially to shipowners who did not live in Amsterdam. In the Municipal Archive in Amsterdam there is a collection of some 30,000 muster rolls, ranging from 1747 to 1852.4 Muster rolls are written, legally binding labour contracts between the captain and his crew, and usually valid until the end of the stated voyage. Both the rights and responsibilities of the captain and the crew are specified in full detail, listing the everyday tasks of the crew but also the daily rations of food and drink crew members can expect and the wages they will earn on a weekly or monthly basis. The archive was collected by the ‘waterschout’ or water bailiff, who policed the port of Amsterdam and, among other duties, was present when the muster roll was read to and signed by the crew (Oldewelt, 1935). After the signing of two copies of the muster roll the water bailiff kept one copy – the other remained with the ship’s captain. Apart from some handwritten copies, all muster rolls in the Amsterdam archive are large pre-printed forms containing a standard text with empty spaces where the name and nationality of the ship, its captain and crew and its next destination were filled in. At the bottom of each document, and continuing on the reverse side, was the list of the mustered – hired – crew. Every member of the crew was mentioned with his full name, his position or rank while on board, his home address when from Amsterdam or the name of his home town when from outside Amsterdam, followed by the wages per week or month. A simple cross for a signature indicated the approval of the said the crew member to the conditions on which he had embarked for the voyage ahead. The voyage was defined in the muster roll by one or more destinations. In most cases they bore the name of a specific port or a region, for example Danzig or the Baltic, but sometimes the description reads like an itinerary – to the Baltic and then to the French Atlantic coast. Most ships did not have their cargoes assigned when the muster roll was drawn up, and many crews were still being mustered while a ship’s agent advertised at the nearby Exchange that a ship was ready to sail within days to the specified destination. When even the destination was unknown at the 4.
Stadsarchief Amsterdam: Archief van de waterschout (archive no. 38).
121
122
Jeroen van der Vliet
moment of signing the standard phrase “op Avontuur” was used, meaning the ship and crew were ready to sail, mostly by the week, to whatever the destination shall be (Broeze, 1977: 134). Furthermore, it was always possible for the captain to deviate from the given destination, and this, too, was captured in a standard phrase: “waar de Capt. Syn orders sullen komen te vallen”. Activities like whaling, privateering or slave trading were specifically mentioned in the margins of the muster roll, but apart from that, there usually is no information in the document about the cargo the ship would be carrying nor about its tonnage. What makes the muster rolls from Amsterdam somewhat unique is that we also come to know a bit more about ownership. Although smaller ships were still owned by their captains, most of the sea-going vessels were owned not by one, but by a group of private investors, and the ship’s captain was hired by them. This form of shared ownership or ‘partenrederij’ was common practice in the 17th and 18th century in order to reduce the huge risks and liabilities involved in sea-going commerce (Broeze, 1977: 106-112). The costs for outfitting a ship and hiring a crew during a prearranged number of voyages were spread over several private investors, mostly merchants with a stake in the cargoes carried by the ship. Usually the individual shares (‘parten’) accounted for 1/32 or 1/64 of the total sum. When the agreed number of voyages had been completed, the final balance was drawn up. Any gains or losses were divided between all participants according to their share in the enterprise, after which the partnership was dissolved. The administrative tasks involved were performed by a ‘boekhouder’ or ship’s accountant, usually the largest shareholder. After the signing of the muster roll the water bailiff wrote on his copy the name of the person he could contact if something were to happen to the ship or to individual members of its crew. Not surprisingly, in most cases this was the name of the above mentioned boekhouder, who acted on behalf of the owners. If the ship in question was a foreign registered vessel, the name on the muster roll was usually that of a local contact, called a correspondent. By the end of the 18th century merchants from Amsterdam acted as accountants for several ships at the same time, while also providing their services as correspondents to merchants from outside Amsterdam. Among them we find an increasing number of the ‘cargadoor’ firms.
123
One source to rule them all?
Figure 5. Number of muster rolls, 1747-1852 1400 1200 1000 800 600 400 200 0 1747
1757
1767
1777
1787
1797
1807
1817
1827
1837
1847
Source: Stadsarchief Amsterdam: Archief van de waterschout (archive no. 38).
Unfortunately, the archive of the water bailiff is rather fragmentary (Figure 5). While the position of water bailiff was established in Amsterdam back in 1641, the oldest surviving copy of a muster roll in the archive only dates from 1747. Of the following twentyodd years just 163 copies remain, and the picture is even worse for the concluding years 1839 to 1852, from which a meagre 13 copies have survived. A more or less continuous series has only survived for the years 1770 to 1838, but even within this series several months are missing, as do all records from 1790 to 1793, 1811 and 1812. Apart from the gaps in the archive itself, there is another, related, issue. Muster rolls only exist in the archive of the water bailiff of Amsterdam when a captain hired one or more new crew members while his ship was moored in the port of Amsterdam. If the crew came on board prior to the ship’s arrival in Amsterdam, say in Rotterdam, there is no record of it in the archive in Amsterdam – but ideally there should be one in Rotterdam. If only some crew members were hired in Amsterdam, while the rest of the crew was already on board when the ship entered the port of Amsterdam, a new document would usually have been drawn up and signed, but more often than not it only mentioned the names of these new sailors, not of those already on board.
124
Jeroen van der Vliet
So how does the number of voyages from the muster rolls compare to other statistics about the port of Amsterdam? Unfortunately, there is no conclusive source. As we already concluded, the numbers of ships entering the Texel and Vlie cannot be used as the number of ships coming to Amsterdam; they account for all the ships going to all the ports along the Zuyderzee. All other attempts to quantify trade in the port of Amsterdam have been based on special taxes which were usually charged on imports, not on exports. So we do have some idea of the extent of incoming traffic, but not of how much went out. Even if the archive of the water bailiff were complete, the muster rolls cannot provide us that answer either; not all shipmasters hired a crew in Amsterdam. But, if we argue that every ship that sailed into the port of Amsterdam had to sail out again eventually, the number of incoming ships can still be used as an indication. Welling (1998; 130) estimated that an average of 3,000 ships per year frequented the port of Amsterdam until 1798 when the number first dropped to 2,500 and by 1810 had nose-dived to a mere 200 ships per year. This means that for the 18th century the number of muster rolls, taking into account that the archive is incomplete, would be about a quarter to a third of the total number of ships. This discrepancy cannot result from missing muster rolls alone and can only mean that most ships arriving in Amsterdam did not hire new crews there.
5. The Baltic as case-study From Amsterdam ships sailed to every port in the world and this is reflected in the muster rolls. Although the rolls only exist in cases when new crew members were taken onboard, we find that all regions are accounted for. The largest share – roughly a quarter of all muster rolls – concern voyages to the Baltic, followed closely by voyages to ports along the Atlantic coast of France, Spain and Portugal. These two regions are interconnected; many ships sailed from Amsterdam to the Baltic and then sailed on to southern ports before returning to Amsterdam again. That number might be even higher, as a number of ships whose destination was unknown at the time of signing the muster roll could have sailed to the Baltic after all. Some others might have sailed to another or a second destination than the one stated on the muster roll, or they did not
One source to rule them all?
even set sail at all. This means that whatever was written on the muster roll as a destination might not be where the ship actually sailed to. This is were the Sound Toll Registers might provide a useful instrument to check upon the ship’s actual movements. If the ship really did sail to the Baltic, it should show up in the Registers. Although this is not a guarantee that it did arrive at its destination, this might be confirmed by its recording in the registers on its way out. The strength of combining the two sources is that the Sound Toll Registers include information about the cargo. The voyages of four ships, the Johanna en Pieter, the Jonge Lieve, the Henderina and the Houtmolen, all mustering new crews in 1770, are used as examples here for the thousands of ships that sailed from Amsterdam to the Baltic each year. Captain IJsbrand Mouthaan of the Johanna en Pieter mustered a crew of eight on 24 April 1770 intended to sail from Amsterdam to Saint Petersburg and back. Mouthaan arrived at the Sound three weeks later, on 15 May. The cargo consisted of a wide range of products, from sugar and exotic spices, to brazilwood, planks, bales of cotton, Turkish yarns, salted lemons, prunes, cheese, wines and vinegar, peas and fish. He returned three months later, on 22 August, at the Sound with a consignment of hemp, canvas and sail cloth, candles, Russian leather and furs. Many ships went from Amsterdam to the Baltic only to return to Amsterdam after a second voyage to the south of Europe as was the case with the Jonge Lieve of Eldert Brandaris. Brandaris mustered a crew on 31 May 1770 for a voyage to St. Petersburg and Marseilles. Two weeks later he arrived at the Sound with a varied cargo of sugar, indigo, planks, paper, yarns, cotton and linen, vinegar, wine and cheese. On 23 August Brandaris again called at the Sound, this time with a load of iron, hemp and sail cloth destined for Marseilles. In some cases the real destination was unknown at the time of signing the muster roll, as was the case with the Henderina of Claas Gorter. According to the muster roll, signed on 29 May 1770, the ship could sail either to Lisbon or Cadiz from the Baltic. It did go to the Baltic according to the Sound Toll Register, were its arrival was noted on 15 June as coming from Alicante and was heading for an unspecified Baltic port with a cargo of salt. From this we learn
125
126
Jeroen van der Vliet
that the Henderina came from Alicante before she moored in Amsterdam to muster her new crew. On 8 September that same year the Henderina was on her way out of the Baltic again. She had visited the port of Viborg and was carrying wooden planks to Cadiz. The ship Houtmolen made several voyages from Amsterdam to the Baltic and back in the year 1770. Captain Cornelis Sleswijk of Lemmer came from Riga when he registered at the Sound with a mixed cargo of hemp and rye bound for Amsterdam. He mustered a crew in Amsterdam on 2 August for a return voyage to Riga. Two weeks later he arrived at the Sound with nothing to declare, the ship sailed in ballast. A month later he again sailed from Riga to Amsterdam when he declared a cargo of balks, spars and masts, hemp and rye at the Sound. Table 1 shows the different Baltic ports mentioned in the muster rolls, taken from a 5-year sample between 1770 and 1800.5 As some muster rolls stated more than one destination, as many ships either stopped at other ports on their way to the Baltic, or would do so on their return voyage, only the first and second destinations have been taken into account. In most cases these were either ports along the Zuyderzee or the Atlantic coasts of France, Spain and Portugal (Le Croisic, Bordeaux, Porto, Lisbon, Setubal, Cadiz). The largest number of documents simply stated the Baltic as the intended destination.6 It is quite possible that these ships were still waiting for their actual orders to come through at the time the muster roll was signed, but as many shipmasters were specialised in the Baltic trade, at least the region was known. For a number of muster rolls the destination was entirely unknown. The number of muster rolls which stated ‘Avontuur’ as their intented destination accounted from eight (1770) to 59 (1785) documents. As these ships might have sailed to destinations outside the Baltic they have not been included in the table. The most popular destination by far was Riga, followed by St. Petersburg, Danzig and Narva.
5. As no muster rolls survived from 1790, documents from the year 1789 have been used instead. 6. In cases where two destinations were mentioned, both in the Baltic, these have been counted as ships going to the Baltic in general.
127
One source to rule them all?
Table 1. Ports in the Baltic, as mentioned as first and second destinations in the muster rolls, 1770-1800 Destination
1770
1775
1780
1785
Alborg
Baltic Copenhagen
1
7
1
46
52
101
1
3
10
4
26
7
4
19
301
9
2
29
6
1
76
1 15
1 1
Elbing
5 1
Frederikshafen
3
5
9
Göteborg
1
2
2
Greifswald Helsingør
1
1
Flensburg
6
8
5
1
2
1
18
2
20
1
1
7
45
1
2
1 7
Kronjstadt
12
13
6
1
Landskrona Libau
1 9
60
21
1
3 1
Total
1
19
Domenæs
Koningsbergen
1800
1
Dagö Danzig
1795
1
Anholt Arensburg
1789
24
5
Marstrand
1
2
1
1
5
Memel
9
22
8
7
46
5
13
19
11
Lübeck
Narva
7 2
15
9 7
2
Riga
25
85
11
Rostock
1
3
48 1
2
12
1 35 2
1
4
25
24
11
32
4
107
6
6
2
3
1
5
1
4 9
2
Windau
1
7
11
6
7
2
Wismar
1
11
2
1
141
1
114
195
359
718
1 263
616
954
68
253
18%
16%
15%
23%
28%
18%
21%
Source: Stadsarchief Amsterdam, Archief van de waterschout (archive no. 38).
268
41 11
1 63
14 1
1 4
274
17 2
1
Viborg
% to Baltic
1
3
10
39
Vaasa
Total number of muster rolls
62
1
Swinemünde
Total
7
81
1
Stettin Stockholm
11
44 1
1 2
Reval
St. Petersburg
1
3
Pietarsaari Pillau
1
1
Nörrkoping Pernau
5
3
7
12
53
128
Jeroen van der Vliet
What can we find out about ownership or the merchants involved in the Baltic trade? Only a very small number of shipmasters sailing to the Baltic seem to have been also the owners of the ship. From 1760 to 1800 fourteen shipmasters also acted as the ship’s accountant, while only five of them mustered a crew in Amsterdam more than once during this period.7 In all other cases the names in the muster rolls were of merchants or ‘cargadoor’ firms. However, it remains unclear in what capacity these people were connected to the ship as both merchants and ‘cargadoors’ routinely acted as accountants. Tables 2a to 2e show the names of the five most important accountants for ships sailing to the Baltic and the other four most popular destinations from Table 1: Riga, St. Petersburg, Danzig and Narva, based on a 10-year sample from 1770-1800. From these some interesting patterns emerge. From these regional top fives, seven firms or companies appear in more than one list: Hijlke Jacobs & Comp. (Baltic, Riga, Danzig); Thomas Asma & Ruurds (Baltic, Riga, Danzig); Jacob de Flines & Zn. (Baltic, Riga); Tamme Beth IJsbrandsz & Zn. (St. Petersburg, Danzig); Koopman, De Witt & Lenardsz (Baltic, St. Petersburg); Tijmen Drieses (Baltic, Narva); Jan, Dirk and Willem van Vollenhoven (Riga, Danzig) and Ten Broeke & Comp. (Riga, Danzig). Some routes seem to be completely dominated by one or two firms. This is most evident for St. Petersburg with half of all ships registered to Tamme Beth IJsbrandsz & Zn. and where the next accounted for only six and at Riga where the firms of Pieter Woestenraad & Blok and Hijlke Jacobs & Comp. are mentioned 14 and 13 times respectively, but that is still twice as many as compared to the third largest, Ten Broeke & Comp. Lastly, the trade to Narva seems to have been in the hands of Zaandam firms, with Gerrit Cornelisz Visser, Jan and Willem Middelhoven and Pieter Corver & Zn.
7. These five shipmasters were Simon van Putten of Hindeloopen (8 times), Cornelis Sleswijk of Lemmer and Sietje Lammerts of Hindeloopen (3 times) and Sjoerd Abes Kat of Hindeloopen and Siebe Cornelisz. Rotgans of Amsterdam (2 times).
129
One source to rule them all?
Tableau 2a. Most named persons and firms in muster rolls of ships to the Baltic, 1770-1800 Baltic (N=174)
1770
1780
1789
Luitje Broers
4
5
Pieter Smit Everhardsz
1
4
Frederik Lammers Jacob de Flines & Zn.
2
Allert Joostes
1800
Total
4
9
9
8
8
6
8 7
2
5
Hessel Sijmensz & Zn.
1
1
5
Thomas Asma & Ruurds
2
3
1
Tijmen Drieses
1
5
6
Hijlke Jacobsz & Comp.
3
2
5
Jacob Paulus & Barend Vermeulen
2
3
5
Koopman, De Witt & Lenardsz
4
1
5
7 1
7
Source: Stadsarchief Amsterdam, Archief van de waterschout (archive no. 38).
Tableau 2b. Most named persons and firms in muster rolls of ships to Riga, 1770-1800 Riga (N=152)
1770
1780
4
10 6
5
Ten Broeke & Comp.
2
4
1
Cornelio van Castricum
1
5
Pieter Woestenraad & Blok Hijlke Jacobsz & Comp.
Thomas Asma & Ruurds
2
1789
1800
Total 14
2
13 7 6
4
6
Jacob de Flines & Zn.
3
2
Jan, Dirk and Willem van Vollenhoven
2
3
5
Arnoldus Hooghard & Zn.
2
2
4
Christiaan Fraser
2
Claas Taan & Zn. (Zaandam)
5
2 3
4 1
4
Source: Stadsarchief Amsterdam, Archief van de waterschout (archive no. 38).
Tableau 2c. Most named persons and firms in muster rolls of ships to St. Petersburg, 1700-1800 1770
1780
1789
1800
Total
Tamme Beth IJsbrandsz & Zn.
St. Petersburg (N=68)
5
15
11
1
32
Jacobus and Martinus van der Schaaf
2
2
2
6
Koopman, De Witt & Lenardsz
3
3
Tijmen Lubberts & Zn.
2
2
Van Heijningen & Denijs Tentijen
2
2
1
2
Weddik & Wendel Source: Stadsarchief Amsterdam, Archief van de waterschout (archive no. 38).
1
130
Jeroen van der Vliet
Tableau 2d. Most named persons and firms in muster rolls of ships to Danzig, 1700-1800 Danzig (N=57) Jacob de Clercq & Zn.
1770
1780
1
4
Tamme Beth IJsbrandsz & Zn.
2
1789
1800
Total 5
2
4
Thomas Asma & Ruurds
1
3
4
Hendrik Walje or Waare Jr.
1
2
3
Adam Hackman
2
Bartholomeus Pampus (& De Grijs)
1
Hijlke Jacobsz & Comp.
2
Jacob de Flines & Zn.
2
Jan, Dirk and Willem van Vollenhoven
2
Ten Broeke & Comp.
1
2 1
2 2 2 2
1
2
Source: Stadsarchief Amsterdam, Archief van de waterschout (archive no. 38).
Tableau 2e. Most named persons and firms in muster rolls of ships to Narva, 1700-1800 Narva (N=39)
1770
Gerrit Cornelisz Visser (Zaandam)
4
Arnoldus Hooghard & Zn.
2
Cornelis Duijm & Van de Stadt
1780
1789
2 2
2
2
2
2 1
1
2 2
2
Pieter Corver & Zn. (Zaandam) Tijmen Drieses
8
2
J.A. Goebel Jan en Willem Middelhoven (Zaandam)
Total
2
Dirk Visser Frederik van der Valk & Ternuijs
1800
4
1
1
2 2
Source: Stadsarchief Amsterdam, Archief van de waterschout (archive no. 38)
During much of the 18th century Dutch merchants profited from their country’s neutrality while most other European countries were at war with each other. By the end of the century the tables were turned. The war with Great Britain in 1780-1784 and the Revolutionary and Napoleonic Wars ten years later resulted in a sharp decline in the Dutch share of the Baltic trade. No ship flying the Dutch flag could possibly leave a port without the risk of being taken by a British warship or privateer. With the Admiralty incapable of providing sufficient ships to organise an adequate convoy system, Dutch merchants either chose not to risk their capital and kept their ships in port or brought their ships under
One source to rule them all?
the flag of a neutral country, a procedure called the ‘flag of convenience’. Using a flag of convenience required some very dodgy paperwork (Kolff, 1944; Van Eyk van Heslinga, 1982). A foreign merchant from a neutral country had to be found willing to buy the ship and its crew. This new owner merely acted as an agent on behalf of the true owners who agreed to buy back their ship in due course, just by shredding all the documents. Not to raise too much suspicion the ship got a new, foreign sounding name and its crew had to be relocated to a foreign town. The analysis of the muster rolls of Amsterdam bring up some interesting evidence of this illegal practice. (As do the Prize Papers in London, because in the end out at sea many ships were still caught red-handed.) Dutch merchants favoured the nationalities of the larger neutral states like Austria and Prussia, but also of Denmark, Sweden and the many small German principalities and free cities bordering the North Sea. Tiny states like Papenburg, Oldenburg and Kniphausen saw their merchant fleet multiply overnight. Although not complete for the years 1780-1784, from the surviving muster rolls a similar picture emerges: in 1781 32% of the ships that mustered a crew in Amsterdam flew the Prussian flag, in 1782 this was 35% and in 1783 23,8%. In 1782 36% had an Austrian nationality, in 1783 this was the case for 15,7% of the ships. In 1782 15% was Danish, followed by Russian (2,6%) and German, with ships registered in Bremen, Lübeck and Hamburg accounting for 3,2%. Surely captains from these neutral countries saw new possibilities to carry goods to and from the port of Amsterdam too, as their Dutch counterparts had done for so many years before. Only by comparing the muster rolls over a longer period of time might we be able to determine whether these Austrian or Prussian ships were Dutchmen in disguise. Take the ship Jonge Anna Buwalda for example. Captain Siebe Broers sailed on the Jonge Anna Buwalda and mustered a new crew in Amsterdam in 1773, 1774 and 1780. The ship’s accountant for the first two voyages was the firm Fokkes & Van Heijningen, in 1780 it was Jan and Pieter Kersijes. Three years later the Jonge Anna Buwalda, still under the command of Broers and with the Kersijes firm as its accountant, now hailed from Emden, flying a Prussian
131
132
Jeroen van der Vliet
flag. In 1786, Siebe Broers mustered a new crew in Amsterdam for the Jonge Anna Buwalda, this time for a voyage to the Baltic. This time Broers is registered as an inhabitant of the Frisian town of Lemmer, while the Jonge Anna Buwalda flies a Dutch flag, again. In a similar case Sipke Pietersz Sevensma was captain of the Jonge Barber when he mustered a crew on 18 September 1780, the firm of Van Heijningen was its accountant. In 1782 and 1783 we find the same Sevensma as captain of the Sociëteit of Bruges, while the same firm of Van Heijningen & Tentije were the ship’s correspondents. The newly acquired nationalities not only provided a – relatively – safe passage on the high seas but opened new possibilities for trade, too. Ports hitherto closed to Dutch ships due to mercantilist policies, were now open to trade. This must have proved to be highly profitable; even years after the Fourth Anglo-Dutch War had ended an increased number of foreign ships kept mustering new crews in Amsterdam. In 1788 they still comprised 10% of all muster rolls, while before the outbreak of the war their number was practically nil. It is widely believed that the Dutch were driven out the Baltic by the end of the 18th century due to stronger local and British competition, and the numbers from the Sound Toll Registers have usually been used as evidence for this (Knoppers & Snapper, 1987). However, as evident from the examples of the Jonge Anna Buwalda and Jonge Barber, many more ships may actually have been Dutch in disguise, the extent of which has still to be fully exposed.
6. Methodological issues Combining different data sources clearly has its advantages, but also presents new challenges to the researcher. The biggest issue with combining different data sources is spelling. Many different ways of spelling of names and places existed and this makes it difficult to ascertain the true identity of either a shipmaster or a destination. The Dutch shipmasters translated the names of many ports they sailed to. For instance, the port of Le Havre was usually called ‘Habel de Graas’ or ‘Haver de Graas’, derived from the French Le Havre de Grâce. In a similar vein, Drøbak in Norway became ‘Droogbak’, Topsham in England ‘Topzon’ and Greifswald ‘Griepwolde’, La Coruña ‘de Caronie’ and Bayonne was generally
One source to rule them all?
referred to as ‘Bayoenen’, Le Croisic became ‘de Krooswijk’ while the Oslofjord was called ‘het Soenwater’.8 However, it only becomes difficult when such a dutchified place-name might point to different ports. How can we be certain that when St. Martin (‘Sint Maarten’) is mentioned in a document it refers to the port on Île de Ré and not to the Dutch island in the West Indies? Does ‘St. Valery’ mean St. Valéry-en-Caux or St. Valéry-sur-Somme? The same problem occurs with the spelling of names of shipmasters. Foreign surnames have often been written down phonetically. This makes it near impossible to find that same person in another source. Also there are many Jansen, Jansz. en Janszoons in Dutch, so how can we make sure that we have found the right one? Because the shipmaster’s name is the only value to ‘cross-reference’ data from the muster rolls and the Sound Toll Registers (the latter source does not provide shipnames), it can turn trying to find a match between the two different sources into looking for the proverbial needle in a haystack.
7. Conclusions Unfortunately, there is not one single source that can be used to study the trade activities by merchants from Amsterdam to answer all our questions. For the trade to the Baltic however, combining data from muster rolls with the Sound Toll Registers does look promising and the findings presented here are even just preliminary ones. From the perspective of the muster rolls in the Amsterdam archive alone the ships mentioned set sail into the great unknown. They might have reached the stated destination or they did not – either way, there is no way of telling based on the muster rolls alone. In The Sound Toll Registers we can check whether the ships that left Amsterdam for the Baltic did – at least – make it to the Danish Sound. We might even be able to tell whether they have reached their destination in the end, too, as the last port they visited is recorded on their return voyage from the Baltic, again recorded in the Sound Toll Registers. A major advantage is that the Sound Toll Registers mention the cargoes carried by the ships in 8.
A great help in translating place-names is Damsteegt, 2001.
133
134
Jeroen van der Vliet
and out of the Baltic. While from the muster rolls we can deduct ship names, crew names and crew totals, and some of the merchants involved. Combined, these two archival sources prove to be very complementary. As shown in some of the examples, it is even possible to ascertain the true identity of some ships, lifting the veil on ships flying flags of convenience in times of war. Therefore, using these two different sources it may be possible to provide a more nuanced view of the evolution of the Dutch position in European international trade. While the historiography usually holds for granted that Dutch trade rapidly fell after 18th century, a judgement based on the record of the Sound Toll, the analysis of the Amsterdam archive suggests that a growing part of Dutch trade was in fact carried under other flags, either to escape retaliation from the nations at war with the Dutch Republic or to go around the increasing level of customs duties to which ships bearing a Dutch flag were submitted in the second half of the 18th century.
References Becht H.E., (1908), Statistische gegevens betreffende den handelsomzet van de Republiek der Vereenigde Nederlanden gedurende de 17e eeuw (1579-1715), The Hague. Boxer C.R., (1965), The Dutch seaborne empire 1600-1800, London. Broeze F.J.A., (1977), “Rederij,” In Maritieme Geschiedenis der Nederlanden III, G. Asaert et al., Bussum, 92–141. Brugmans H., (1901), Handel en nijverheid, The Hague. Brugmans H., (1911), Handel en nijverheid van Amsterdam in de zeventiende eeuw, The Hague. Brugmans H., (1912), “De koopman. Mercurius als spectator.” Jaarboek Amstelodamum 10: 61–135. Brugmans H., (1930), Geschiedenis van Amsterdam. Van den oorsprong af tot heden. Deel V: Afgaand getij. Amsterdam. Bruijn J.R., (1990), “In een veranderend perspectief: het ontstaan van directies voor de vaart op de Oostzee, Noorwegen en Rusland,” Special issue Tijdschrift voor Zeegeschiedenis 9: 15–25. Bruijn J.R., (1998), Varend verleden. De Nederlandse oorlogsvloot in de 17e en 18e eeuw. Amsterdam. Buist M.G., (1974), At spes non fracta. Hope & Co. 1770-1815, The Hague.
One source to rule them all?
Damsteegt B.C., (2001), Nieuwe spiegel der zeevaart. 2nd ed., Amsterdam. Den Heijer H.J., (1994), Geschiedenis van de WIC, Zutphen. De Vries J. and A. van der Woude, (1995), Nederland 1500-1815. De eerste ronde van moderne groei. Amsterdam. De Vries Joh., (1959), De economische achteruitgang der Republiek in de achttiende eeuw, Leiden. Gøbel E., (2010), “The Sound Toll Registers Online Project, 1497-1857,” International Journal of Maritime History 22: 305–324. Heeres W.G., (1982), “Het paalgeld. Een bijdrage tot de kennis van de Nederlandse handelsstatistiek in het verleden,” Economisch en SociaalHistorisch Jaarboek 45: 1–38. Israel J.I., (1988), The Republic. Its rise, greatness, and fall 1477-1806. Oxford. Israel J.I., (1989), Dutch primacy in world trade 1585-1740. Oxford. Jardine L., (2008), Going Dutch. How England plundered Holland’s glory. London. Jonker J. and K. Sluyterman, (2000), Thuis op de wereldmarkt. Nederlandse handelshuizen door de eeuwen heen, The Hague. Jonker J., (2002), “De vroege geschiedenis van de firma Insinger & Co,” Jaarboek Amstelodamum 94: 110–131. Knoppers J.V. Th., (1977), “De vaart in Europa,” In Maritieme Geschiedenis der Nederlanden III, G. Asaert et al., Bussum, 226–227. Knoppers J.V.Th. and F. Snapper, (1978), “De Nederlandse vaart op de Oostzee vanaf het eind van de 17e eeuw tot het begin van de 19e eeuw,” Economisch en Sociaal-Historisch Jaarboek 41: 115–153. Knotter A., (1995), “Strooptochten... in de schatkameren van Amstels oudheid. Het Amsterdamse Gemeentearchief en de geschiedschrijving van handel en scheepvaart in de tijd van de Republiek,” Jaarboek Amstelodamum 87: 197–220. Kolff B., (1944), “Achter de schermen van het onder onzijdige vlag brengen van koopvaardijschepen ten tijde van de Bataafsche Republiek,” Rotterdams Jaarboekje 1944: 81–107. Le Moine de l’Espine J. and I. le Long, (1780), Koophandel van Amsterdam, naar alle gewesten der waereld, 9th ed., Rotterdam. Lesger C., (2005), “Stagnatie en stabiliteit. De economie tussen 1730 en 1795,” In Geschiedenis van Amsterdam. Deel II-2: Zelfbewuste stadstaat, 1650-1813, W. Frijhoff and M. Prak (eds), Amsterdam, 219–265. Oldewelt W.F.H., (1935) “Referaten van mededeelingen over ‘oude Amsterdamsche boekbanden’ en over ‘de waterschout’,” Tijdschrift Amstelodamum 22: 35–35.
135
Oldewelt W.F.H., (1945), Kohier van de personele quotisatie te Amsterdam over het jaar 1742, Amsterdam. Oldewelt W.F.H., (1953), “De scheepvaartstatistiek van Amsterdam in de 17e en 18e eeyw,” Jaarboek Amstelodamum 45: 114–151. Posthumus N.W., (1943-1964), Nederlandsche prijsgeschiedenis, Leiden. Pottle F.A., (1952), Boswell in Holland, 1763-1764, London. Prak M., (2002), Gouden eeuw, Nijmegen. Pringsheim O., (1890), Beiträge zur wirtschaftlicher Entwicklungsgeschichte der Vereinigten Niederlande im 17. und 18. Jahrhundert, Leipzig. Rogge J., (1949), Het handelshuis Van Eeghen. Proeve eener geschiedenis van een Amsterdamsch handelshuis, Amsterdam. Schama S., (1977), Patriots and liberators. Revolution in the Netherlands, 1780-1813, New York. Spooner F.C., (1983), Amsterdam insurance and maritime Europe, 1776-1780, Cambridge. Van Dillen J.G., (1948), “Naschrift. De achttiende eeuw,” Tijdschrift voor Geschiedenis 61: 16-30. Van Eyck van Heslinga E.S., (1982), “De vlag dekt de lading. De Nederlandse koopvaardij in de Vierde Engelse Oorlog,” Tijdschrift voor Zeegeschiedenis 1: 102–113. Van Tielhof M.J., (2002), The mother of all trades. The Baltic grain trade in Amsterdam from the late 16th to the early 19th century, Leiden. Veluwenkamp J.W., (1981), Ondernemersgedrag op de Hollandse Stapelmarkt dans De Tijd van de Republiek. De Amsterdamse Handelsfirma Jan Isaac de Neufville & Comp., 1730-1764, Meppel. Voorthuysen W.D., (2001), Koopman Amsterdam. Beknopte economische geschiedenis van Amsterdam 1200–1795, Amsterdam. Welling G.M., (1998), The prize of neutrality. Trade relations between Amsterdam and North America 1770-1817, Amsterdam. Welling G.M., (2009), “De zin en onzin van schepen tellen”, Tijdschrift voor Zeegeschiedenis 28: 3–25. Westermann J.C., (1948), “Statistische gegevens over de handel van Amsterdam in de zeventiende eeuw,” Tijdschrift voor Geschiedenis 61: 3–15.
FRENCH IMPORTS TO THE BALTIC, 1670-1850 A QUANTITATIVE ANALYSIS
Werner Scheltjens University of Leipzig
In this paper, a quantitative analysis of direct French imports to the Baltic is presented, based on a converted version of the Sound toll registers online for the period 1670-1850. It is examined how the available transport space, that was employed in direct trade between France and the Baltic, was used. The dominant products taken on board are analysed; the geography of French imports to the Baltic is discussed. Structural changes in the volumes imported to the Baltic of the main product categories are interpreted as the result of the reconfiguration of the role of Russian and Prussian ports in the Baltic, the decline of Dutch commercial dominance and the emergence of modern structures of commercial exchange. Keywords: seventeenth century, eighteenth century, international trade statistics, globalization, economic history, France, northern Europe, Sound.
e-mail:
[email protected]
Revue de l’OFCE, 140 (2015)
138
Werner Scheltjens
E
ver since the pioneering research of Pierre Jeannin and his colleagues (Jeannin 1954, 1964; Desfeuilles 1959, 1961), the commercial relations between France and the Baltic in the early modern period have received considerable attention from the French as well as from the international scholarly community (for examples, see: Sée 1925; Bamford 1954; Jeannin 1968; Pourchasse 2006). Nevertheless, the Baltic still plays a secondary role in the historiography of early modern French international trade, which is largely dominated by two major themes: the French Atlantic trade and the continental blockade (Marzagalli 2007). A few notable exceptions notwithstanding (in casu the research of Pierrick Pourchasse), most research on French-Baltic commercial relations takes the form of case-studies focusing on one (or a few) specific aspects of these relations, such as a specific product or product group, trade at one or a few ports or bilateral trade relations between France and one of the Baltic States (e.g. Fox 1968; Kirchner 1975). Interestingly, the majority of these case-studies maintains a focus on the seventeenth and eighteenth centuries, while very few historians of Baltic trade have attempted to look beyond the French revolutionary wars further into the nineteenth century. In this sense, the historiography of French-Baltic commercial relations illustrates a remarkable discrepancy that continues to exist between the study of international trade and of the industrial revolution in the historiography of the early modern European economy, in general, and of the Baltic as an economic unity, in particular. While the historiography of early modern Baltic trade almost without exception makes a break in the last decade of the eighteenth century, the historiography of the industrial revolution – as a rule – continues well into the nineteenth century. Commercial distribution and international trade relations have thus become largely separated from changing patterns of production in the industrial revolution, even though both are undeniably intertwined. The consequence of this divide between international trade, on the one hand, and industrial revolution, on the other hand, is that the underlying “big picture”, viz. the gradual extension of a distribution-based commercial infrastructure with a production-based commercial infrastructure during the latter part of the eighteenth and the first half of the nineteenth century,
French imports to the Baltic, 1670-1850: A quantitative analysis
becomes invisible. This has led to misleading statements regarding the rise and decline of Baltic international trade streams in the eighteenth century as well as to erroneous assumptions about the stagnation and backwardness of the Baltic in the emerging industrial economy of the first half of the nineteenth century (Rönnbäck 2010). To some extent, the source material that is at the disposal of researchers dealing with the role of the Baltic in the early modern European (or perhaps even world) economy can explain why international trade and the industrial revolution are treated separately by economic historians. Until quite recently, the foremost important source for research into the economic history of the Baltic were the so-called Sound toll tables, or better: Tabeller og skibsfart, which Nina Ellinger Bang and Knud Korst compiled in the first half of the twentieth century (Bang and Korst 1906-1933). Despite severe, but often justified criticism with regard to these tables (extensively reviewed in Jeannin 1964), a very large number of studies on a wide range of topics dealing directly or indirectly with the Baltic has been based on this seven-volume quantification of the original Danish Sound toll registers. The Sound toll tables cover the period 1497-1783 and therefore do not include any information about the last 74 years of the original Sound toll registers. In the early 1950s, a group of French historians headed by Pierre Chaunu made an attempt to compute the period from 1784 to 1793 of the Danish Sound toll registers. Two journal articles notwithstanding, the project has not resulted in the publication of a database (Desfeuilles 1959; Desfeuilles 1961). In the 1970s, the Danish historian Hans Christian Johansen undertook a similar effort, which eventually led to the release of an electronic database of the Danish Sound toll registers for the years 1784 to 1795, also published on microfiches as an appendix to Johansen’s dissertation (Johansen 1983). This database has recently been converted to contemporary standards for historical databases by the Dutch historian George Welling (Welling 2009-10). Baltic trade in the first half of the nineteenth century attracted scholarly attention only quite recently, when Ahonen and later Rönnbäck “discovered” the so-called Sound Toll Accounts, which cover 1773-1856. But these data are neither available to the public nor do they allow adopting a long-term perspective (Ahonen 2005; Rönnbäck 2009).
139
140
Werner Scheltjens
Since 2013, however, the situation has changed drastically with the release of STRO, the electronic database of the Danish Sound toll registers, which so far covers the period 1634-1857 (STRO 2013). The full potential of STRO has not yet been unveiled, since the cargo registrations in STRO – an essential part of the electronic database – have not been standardized yet, not to speak of their categorization or a conversion of pre-modern weights and measures to their metric equivalents.1 Undisputedly, advances in this direction would greatly enhance the possibilities of the electronic database, while also stimulating the use of STRO. Moreover, it would enable economic historians of the Baltic to overcome previous source-related limitations, allowing for an encompassing history of Baltic trade which neither ends in 1800 nor ignores the effects of the industrial revolution. In this paper, I present a quantitative analysis of direct French imports to the Baltic, based on a converted version of the Sound toll registers online for the period 1670-1850. The perspective adopted in this paper requires some clarification. The primary goal of the present quantitative analysis is to examine how the available transport space, that was employed in direct trade between France and the Baltic, was used: which were the dominant products taken on board, where were the ships loaded in France and where were they unloaded in the Baltic between 1670 and 1850? As a consequence, the value of French-Baltic trade will not be discussed in this paper, rather an attempt will be made to assess the volume of French imports, expressed in tonnes of 1000 kg, calculated on the basis of registrations in the original Sound toll registers. Neither will the much-debated passiveness of French international commerce and the predominance of Dutch intermediaries in its execution be discussed here2, nor will there be room to examine indirect French imports to the Baltic, which were controlled by the Dutch and Hamburg for much of the period covered in this paper. Issues related to the conversion of pre-modern weights and measures and the standardization of cargo items registered in the Sound will be dealt with at length, since the reliability of the methods 1. Such undertaking constitutes a fundamental part of the senior doctorate-project (Habilitation) of the present author and this contribution may be seen as a preview of its potential results. 2. These topics have been discussed at length by several authors (Sée 1925; Bamberg 1954; Pourchasse 2006).
French imports to the Baltic, 1670-1850: A quantitative analysis
applied to the original “raw” data is decisive for the robustness of the quantitative analysis based upon them. The remainder of the paper is structured as follows. In section 1, I briefly introduce the electronic database of the Sound toll registers online. In section 2, I explicate the method employed to convert “raw” STRO data about French imports to the Baltic into a new data series in which (almost) all quantities shipped through the Sound from France are converted into metric tonnes. This conversion constitutes the basis for the descriptive analysis in section 3 and a tentative interpretation of its results in the final section 4.
1. STRO The Sound Toll Registers are the records of the toll levied by the king of Denmark on the passage of ships through the Sound, the strait between Denmark and Sweden connecting the North and Baltic Seas (Scheltjens and Veluwenkamp 2012). They are stored by the Danish National Archives. The more than 700 volumes of the Sound toll registers that have been preserved include a practically uninterrupted series from 1574 to 1857 and some scattered records for the period between 1497 and 1574. They hold information on about 1.8 million passages. For each individual passage, both westward and eastward, the Sound toll registers contain the passage date, the name of the shipmaster, his domicile, his port of departure and – from the mid-1660s – his port of destination, the composition of the cargo and the toll paid. STRO is a relational database set up to make the Sound toll registers’ data instantaneously available to all via www.soundtoll.nl. The next section contains a detailed description of the method employed to transform the “raw” data of the electronic database of the Sound toll registers online. More general descriptions of thi method have been published previously (Scheltjens 2009; Scheltjens 2015); therefore, I will focus on matching decisions and conversion steps that were particularly relevant for the conversion of the data set on French imports.
141
142
Werner Scheltjens
2. Converted STRO: method, results Registration of cargo items in the Sound was done on the basis of freight letters (Scherer 1845). Cargo items and their measures were translated into Danish, registered quantities were copied and the sum of customs due was calculated separately for each cargo item. While the calculation of customs was done according to a number of rules described in various customs treaties, there is no mention of any conversion of weights and measures used in the freight letters to local (Danish) equivalents. On the contrary, the 1645 Treaty of Christianopolis / Kristianopel and its confirmation in 1701 state that the size of measures of goods upon which custom payments are due is that of the place where the good had been loaded.3 This allows us to localize the weights and measures found in the Sound traffic database, stating that the registered point of departure of the ship is the point of reference for establishing the metric equivalents of the weights and measures declared at the Sound customs office.4 Conversion of STRO data into metric equivalents could be achieved by means of the conversion of combinations of good, measure and port of departure of the good. This, however, presupposes the homogenization of STRO data, which was executed first. The homogenization and categorization of French imports to the Baltic was a complex undertaking. Two major issues had to be dealt with: reduction of the amount of variation in the “raw” data and simplification of the product description. Reduction was achieved through homogenization of source-related variations, such as spelling variations in the product denominations, and of databaserelated errors, such as typing mistakes. Simplification was achieved through a process in which cargo descriptions were divided into their constituent parts, with the isolation of the main product 3. The original Dutch text of the 1645 and 1701 treaties is cited op page 88 in (Scheltjens 2009). 4. Obviously, a certain degree of uncertainty remains. It is possible that a ship departed from a different place than the one given at the Sound as point of departure. Also, it may be possible that the ship loaded additional cargo items at ports located between the registered point of departure and the Sound. In both cases, the Sound toll registers usually do not provide these data. It must be stressed, however, that both cases mentioned would involve providing false or incomplete documentation at the customs office in Elsinore. Numerous scholars have tackled this issue, providing very different indications of the percentage of fraud. Calculation of matching scores of registrations in the Sound traffic database and similar sources outside of the Sound might possibly narrow down the range. One potential method for cross-checking the Sound traffic database with other sources (in casu French customs statistics) is discussed at length in this issue by Daudin and Charles.
French imports to the Baltic, 1670-1850: A quantitative analysis
denominator as its aim. The level of complexity of “raw” cargo descriptions in STRO is highly dependent on the type of product that is described. For cargoes of wine, for example, the price per unit as well as rough indications of its type and sometimes its geographical origin are part of the cargo description. During the process of simplification, complex cargo descriptions, such as “Bordeus win a 52 Dr.” (Eng. Bordeaux wine at 52 rixdollars) was divided among 4 columns. “win” was put in the main data field; the other items – bordeus, 52, Dr. – were put in data fields describing the additional features of the cargo item. Further reduction of variation was achieved through homogenization of the various data items: “win” became “Vin”, “bordeus” became “Bordeaux”, etc. Similarly, the origin and value per unit of measurement are often included when cargoes of wine are described. As a result, the information provided in the main column corresponds to a general description of the cargo, excluding its additional features (see table 1). All in all, cargo descriptions were divided into a maximum of 13 constituent parts: Table 1. The division of cargo descriptions in STRO into their constituent parts Original
Bordeus win a 52 Rd.
ID Indication of size, mostly for timber products, as found in the original product description
Size Unit of size
Type of wood, type of skin, etc., as found in the original product description
Basic material Origin
Bordeaux
Indications in the original product description such as big, small, dry, fine, green, etc. Mostly applicable to textiles
Type Product
Geographical indications of origin, as found in the original product description
Wine
The core of the product description, as registered in STRO
Use
Indications of the use of the product, e.g. with glass: “for windows”, with timber: “for construction”
Amount per package
e.g. For cases of wine: 50
Unit of packaging
e.g. For cases of wine: bottles
Price
52
Price of one unit as found in the original cargo description
Currency
Rd.
Currency of one unit as found in the original cargo description
Etc Remarks
143
144
Werner Scheltjens
A frequency table based on the 162.856 “raw” cargo registrations of French imports to the Baltic in STRO between 1670 and 1850 reveals that STRO contains 8.654 unique cargo descriptions, the frequency of which is unequally distributed. The top 10% of unique cargo descriptions accounts for 92,4% of all cargo descriptions. Slightly more than 33% of all cargo descriptions in STRO occur more than once, which means that the lower 66% of all unique cargo descriptions – 5.754 in total – appear only once in the database. These cargo descriptions represent only about 3,5% of all cargoes passing the Sound between 1670 and 1850. Logically, the simultaneous homogenization and simplification processes were executed from the top down. The cargo descriptions with the highest frequency were processed first and the process was cut off at a minimum frequency of 3. In total, 5.350 of the 8.654 unique cargo descriptions concerning French imports to the Baltic could be homogenized, simplified and converted. The missing items account for about 14% of all relevant cargo registrations (see table 2 below). The homogenization of weights and measures and of quantities in the “raw” STRO data was dealt with in an analogical way. In the case of quantities, descriptions written in full text, roman numbers, fractions or a combination of these, were converted to their equivalent in the decimal system. Reduction of variation in weights and measures was achieved through a dual process. First, homogenization of variant spellings was pursued; then, denominations of equivalent weights and measures in different languages were linked with the help of the information provided by Horace Doursther in his Dictionnaire universel des poids et mesures anciens et modernes (Doursther, 1840). This dictionary, published in 1840, comprises the works on historical weights and measures of wellknown predecessors like Kelly and Nelkenbrecher, and adds to this vast amount of information the results of a study of commercial reports, tariff lists and the like. Though recognized by Bob Allen and Tommy Murphy as an extremely exhaustive source providing metric equivalents for all the measures (Allen and Murphy, 2005), Doursther’s dictionary is still largely unknown in the scholarly community. It has been used solely as a reference work from which short explanations of a specific measure and its value at one or a few specific places were distracted (e.g. McCusker, 1973).
French imports to the Baltic, 1670-1850: A quantitative analysis
The general scope of Doursther’s dictionary has remained largely unexploited. In this paper, Doursther’s dictionary was put to use as an “engine” for the standardisation of weights and measures in STRO for the period 1670-1850. Apart from being exhaustive and global in scope, there is another reason for selecting Doursther’s dictionary over other dictionaries and compilations of premodern weights and measures, and that is language. While reference works for specific geographic regions, micro-regions and even places may certainly be more accurate and detailed than Doursther’s dictionary, they are in most cases detached from the international context of weights and measures, providing only their local names, without referencing to ‘international’ equivalents. In a setting like ours, this would be a major disadvantage. Doursther’s dictionary regroups weights and measures under one heading, provides (cross-)references to translations of these measures into various languages and adds information about the local names of measures in the conversion details. Typically, Doursther provides the following information about a measure: lemma and corresponding names in other languages; references to analogous measures employed in different geographical regions; location, local name(s), rules for conversion and corresponding values; metric values; description of products to which the metric equivalent applies; reference to analogous measures employed at the mentioned location; reference to other, related locations. These data were matched with the weights and measures denominations in STRO. Sometimes, quantities of goods were counted rather than measured. Only in an exceptional case does Doursther provide information about these ‘numerals’. For other cases, like skok (60 pieces) or dægge (12 pieces), I have relied on information from Den Danske Ordbog.5 French imports to the Baltic were registered in STRO with 80 different weights and measures (see A1). Taking into account regional differences between weights and measures, as well as differences in the weight of different products6, a total of 5.350 product-measure-origin-combinations was applied to the 5. 6.
Den Danske Ordbog: Moderne Dansk Sprog. On line resource: http://ordnet.dk/ddo. I do not mean differences in relative weight.
145
146
Werner Scheltjens
regis-trations of French imports to the Baltic. A number of combinations with unknown weights and measures were excluded from further processing. Equally so, the so-called Kiøbmandskaber (merchant’s goods) and Kraemmeri (pedlar’s goods) were left out, since their value was “measured” ad valorem. Further conversion of these entries into metric tonnes appeared to be too problematic. The remaining combinations of product-measure-origin were linked to the database of French imports to the Baltic and then used to estimate the tonnage of French goods shipped to the Baltic. The relative weight of goods was not taken into account during this process, even though the author is well-aware of the distortion this may have caused to some of the data. All in all, however, the potential differences are small and including relative weight would give a false impression of precision that cannot be attained when working with pre-modern statistical sources. The tonnage estimates presented here are no more than – but also no less than – estimates, based on available knowledge on pre-modern weights and measures and on available records of ship movements through the Sound. The process of adding metric equivalents to all product-measureorigin-combinations was painstaking to say the least. Clearly, neither all products mentioned in STRO nor all places of origin of the goods were listed with such detail in Doursther’s dictionary of pre-modern weights and measures. Therefore, a procedure in several steps was developed in order to add as many metric values to the list of product-measure-origin-combinations. In order to overcome the limitations of Doursther’s dictionary a categorization of goods into a number of types and the categorization of places into a set of different regions was executed to achieve better results. The matching procedures were the following (described more extensively in Scheltjens, 2009; Scheltjens, 2015): — Boolean matching — matching based on identical measure and location, with product similarity (using type of good as matching category) — matching based on identical measure and product, with geographical similarity (using region as matching category) — matching based on identical measure, with location selected according to a pre-defined set of rules and product specifications either missing, similar or considered irrelevant
147
French imports to the Baltic, 1670-1850: A quantitative analysis
— matching based on measurement similarity, standardization and conversion of non-weights and non-measures ■
Boxes and cases
■
Pieces (stykker, tylt, dusin, skok, etc.)
Upon completion of the fifth matching procedure, the data that could be extracted from Doursther’s dictionary was exhausted. The remaining combinations of product-measure-origin were mostly non-weights and non-measures, like kister, casse, balle, skok, etc. which were converted to metric equivalents in two steps. First of all, the relevant “numerals” were converted to the actual “number” they contain, e.g. skok is 60 pieces, zimmer is 40 pieces, 1 kiste is 1 piece. Then, the weight of the product transported in boxes, cases or as separate pieces was estimated on the basis of historiography. Many of the decision made with regard to these productmeasure-origin-combinations are open to debate, since they require specialist knowledge that has proven to be extremely hard to find. In some cases, the metric equivalents used are merely guesstimates. The conversion of the measures ‘barrique / fad’ and ‘dusin’ into metric equivalents may serve well as examples of the way in which such difficulties were dealt with. Table 2. The conversion of wine loads in fad or barrique to a metric equivalent Product
Metric value
Frequency
Bordeaux
Origin
Wine (Vin)
226,29
24199
Nantes
Wine (Vin)
240
470
St. Martin
Wine (Vin)
226,29
424
Bayonne
Wine (Vin)
304,39
297
Seudre
Wine (Vin)
240
139
Libourne
Wine (Vin)
226,29
97
Dunkerque
Wine (Vin)
226,29
69
La Rochelle
Wine (Vin)
228,29
62
Other ports
Wine (Vin)
226,29
377
The conversion of the important measure “barrique” to a metric equivalent was based on information found directly in Doursther’s dictionary, such as the metric values for the barrique in Bordeaux, Nantes, Bayonne and La Rochelle (Doursther 1840). The metric value for the other places of origin of loads of wine in barrique was equalled to the barrique of Bordeaux. A different method had to be
148
Werner Scheltjens
applied to the conversion of goods, of which the quantity was counted, for example in dusin, or a dozen (12 pieces). Table 3. The conversion of product registrations in dusin (12 pieces) to a metric equivalent Origin Le Havre de Grace Dieppe, Rouen Le Havre de Grace
Product
Metric value
Frequency
Socks (Strømper)
0,375 kg
5
Cardes (Karder)
3,792 kg
1
Skins (Skind)
106,2 kg
1
The weight of the 12 pairs of socks that were loaded at Le Havre de Grace, was based on an indication by Doursther, that a dozen socks were estimated at ¾ pound for the payment of the Sound dues (Doursther 1840). The estimated weight of 0,312 kg for one piece of cardes is a guesstimate, equal to the weight of one square yard of Spanish cloth of fine quality (Mann 1971; Schammas 1994). The weight of one piece of skin, loaded at Le Havre de Grace, is based on the average weight of several types of skins, mentioned in the 2013 Compendium of the FAO. The calculated average is 8,85 kg per piece, or 106,2 kg for a dozen. In total, 41.576 Sound passages, specifying 162.856 commodities, were registered with a French port of departure. The main variables of this data set, including port of departure, port of destination, domicile of the shipmaster, quantities, weights and measures and commodities, have been standardized, after which a conversion to metric tonnes was executed. Obviously, a complete standardization of the data set could not be attained. Nevertheless, as is specified in table 4 below, more than 95% of all passages from French ports and more than 85% of all commodities that they carried were successfully standardized and converted. The percentage of passages that was “lost in conversion” is somewhat higher in the 1670s, but declines rapidly afterwards. From 1700 onwards, an almost stable number of passages is missing in the converted data set. There are several possible reasons for data to be lost during the standardization and conversion process. Among them, missing and unrecognised data items in the electronic database are the most important. The percentage of cargo items that was “lost in conversion” requires some further specification. In table 4, the number of cargo items per passage is specified and it is calculated
French imports to the Baltic, 1670-1850: A quantitative analysis
how many cargo items related to one unique passage are missing. These calculations reveal that on average, every ship importing goods from French ports had 3,92 different items on board, but logically, the higher the number of different items on board, the higher the number of missing cargo items in the converted data set. This logic is reflected in table 4, which shows that for 27.087 passages carrying 55.585 cargo items there was no data lost in conversion. The average number of cargo items on board was just above two; these were easy cases. One cargo item was lost during the standardization and conversion processes in 8.654 passages with 48.640 registered cargo items. But with an average number of cargo items of 6,62, one missing item does not distort the overall reliability of the converted data set. The same may be said for passages with two, three and more missing cargo items; in all cases, the missing cargo items represent only a minor part of the total number of different items on board. All in all, in this way, the volumes of 140.128 cargo items out of a total of 162.856 were successfully converted to metric tonnes, representing the majority of the items on board of about 95% of all ship departing from French ports between 1670 and 1850. 22.728 cargo items, or 14%, could not be standardized and converted. Nevertheless, it may be assumed that the converted data set reflects the volume and structure of French imports to the Baltic in a reliable way. Table 4. Statistical overview of the results of the conversion of cargo registrations in STRO to their metric equivalents Passages matched Complete Missing
Cargo items missing
27.087
matched
Average number of cargo items
55.585
2,05
8.654
48.640
6,62
1 item
8.654
2 items
2.832
5.664
20.706
9,31
3 items
874
2.622
8.219
12,40
4+ items
525
2.684
6.978
18,40
140.128
3,92
all items
3.104 39.972
Missing passages Total passages
41.576
Total cargo items Matching score
22.728
1.604
162.856 96,37%
86,04%
149
150
Werner Scheltjens
3. Descriptive analysis The volume of French imports to the Baltic between 1670 and 1850 varied greatly from 74.855,95 tonnes in 1763, at the end of the seven-years’ war and 24,29 tonnes in 1807, when the Continental Blockade was in full force. Between these two extremes, significant annual fluctuations occurred. Differences in imported volume of more than 100% between single years were no exception. Nevertheless, four major periods can be distinguished when 11-year moving averages of the volume of French imports to the Baltic between 1670 and 1850 are observed (see Figure 1). Figure 1. French imports to the Baltic, 1670-1850 In tonnes. Based on STRO
80000 70000 60000 50000 40000 30000 20000 10000
1848
1840
1832
1824
1816
1807
1799
1791
1783
1775
1767
1759
1751
1743
1735
1727
1719
1711
1703
1694
1686
1678
1670
0
The first period was marked by stagnation and decline, probably caused by the outbreak of the Great Northern War in the Baltic. This period lasted until about 1714, which means that French imports embarked on a secular trend well before the Peace of Nystadt was signed in 1721. The rise of French imports to the Baltic would continue almost without interruption until the late 1760s, after which a long period of decline set in, which would last until 1813. Only during the 1780s there was a brief upswing in the volume of French imports to the Baltic, but it was short-lived and eventually killed off by the massive disturbances caused by the French revolutionary wars of the early 1790s. Between 1763 and
151
French imports to the Baltic, 1670-1850: A quantitative analysis
1813 French imports to the Baltic would decrease by an average of 1,99% annually; in other words, by 1813 French imports had become almost non-existant. Afterwards, French imports to the Baltic slowly started to climb out of their state of depression, but even though the volume of imports rose by an average of 7,86% each year, our data suggest that it never resumed its previous state. Expressed in volumes of goods transported through the Sound, salt was the dominant commodity of French imports to the Baltic during the entire period observed, but the volumes imported declined steadily after 1763 and they would hardly recover in the nineteenth century (see Figure 2). In fact, whereas the volumes of French salt imported to the Baltic correlated very strongly with overall French imports until 1763 – the correlation coefficient between salt and total French imports between 1670 and 1763 was as high as 0,99 – other commodities (wine and brandy, overseas goods, syrup and fruits) increasingly determined the composition of French imports to the Baltic in the latter part of the eighteenth century. Figure 2. French salt imports to the Baltic, 1670-1850 In tonnes. Based on STRO
80000 70000 60000 50000 40000 30000 20000 10000
1848
1840
1832
1824
1816
1807
1799
1791
1783
1775
1767
1759
1751
1743
1735
1727
1719
1711
1703
1694
1686
1678
1670
0
French salt was imported to the Baltic primarily from places such as St. Martin, Le Croisic, Bourgneuf, Seudres and – after 1800 – Cette. Until the end of the eighteenth century, the main destinations of French salt were Danzig and Riga. After 1800, only
152
Werner Scheltjens
Riga and the vague destination “Baltic Sea” would remain; Danzig and Königsberg disappeared completely as destinations of French salt. French salt imports to the Baltic were usually complemented with imports of Spanish, Portuguese and to some extent Italian salt (Unger 1959), but while these managed to maintain a stable position in salt imports to the Baltic until 1850 at least, the French salt imports, that used to be significant until the late 1760s, were almost completely substituted with English salt imports – originating almost exclusively from Liverpool7 – in the final quarter of the eighteenth century (see Figure 3). Figure 3. The geography of salt imports to the Baltic, 1670-1850 In tonnes. Based on STRO.
250000 England France Sp., Port., It. Rest
200000
150000
100000
50000
1847
1839
1831
1823
1815
1807
1799
1791
1783
1775
1767
1759
1751
1743
1735
1727
1719
1711
1703
1694
1686
1678
1670
0
Note: Sp. = Spain; Port. = Portugal; It. = Italy
Whereas the volumes of French salt imported to the Baltic correlated very strongly to overall French imports to the Baltic until about 1740, other commodities started to determine the volume of French imports to the Baltic during the eighteenth century. Three major product groups can be distinguished here: 7. At that time, the emergence of Liverpool’s salt trade dated already back more than a century. However, it was only when the transport communications between Liverpool and the saline district of Cheshire were improved, coal supply was made more efficient and rock-salt mining took off around 1760, that the door was opened for massive exports of salt to the Baltic. According to Iredale, foreign customers took 80% of Cheshire’s salt production (Iredale 1967; see also: Smithers 1825; Poole 1854; Barker and Harris 1993).
French imports to the Baltic, 1670-1850: A quantitative analysis
(1) wine, brandy and vinegar, (2) fruits, nuts and syrup and (3) sugar, coffee and tobacco. This categorization differs somewhat from the categorization used by Giliane Besset in his analysis of Bordeaux’s exports to Russia in the second half of the eighteenth century (Besset 1982). Besset makes a distinction between wine, colonial goods (denrées coloniales) and regional products, such as eau-de-vie, vinegar and prunes (autres produits régionaux). Rather than considering eau-de-vie and vinegar to be “regional products”, I have categorized them alongside with wine, of which both were a by-product8. Moreover, I have included fruits, nuts and syrup as a separate category, because of the significant volumes that were imported from France to the Baltic in the second half of the eighteenth century (see below). Differently from Besset, I have not included indigo, alongside with sugar and coffee, as one of the overseas goods, since its volumes were very small during the eighteenth century and its importation to the Baltic was irregular (Besset 1982). On the contrary, I have included tobacco as the third overseas product, entering the Baltic from France. From about 1740 onwards, the volumes of these product groups occupied an increasing share of French imports to the Baltic, reaching a peak in the early 1790s, right before the existing structure of French imports to the Baltic became obsolete in the aftermath of the French Revolution (see Figure 4). French imports of wine to the Baltic experienced an almost uninterrupted growth between 1670 and 1805, when their volume reached a peak of almost 16.000 tonnes. Only during two periods, from 1767 until 1778 and from 1793 until 1802, a temporary setback in the volumes of French wine imports can be observed. Like French salt imports, the wine trade did not fully recover after the Napoleonic wars, with annual imported volumes stabilizing at about 50% of its 1804/1805-level. It would take until 1837 for French wine imports to the Baltic to embark upon a novel growth 8. Eau-de-vie, or brandy in English, is a distillate that results from wine (brûler les vins), which served a dual purpose: by burning the wine, the volume of the harvest of wine grapes was reduced by 4/5 or even 5/6, while at the same time, eau-de-vie was used to mix it with white wine, a process associated with Dutch wine traders active in France in the early modern period (Dion 2010). Vinegar is “a liquid produced by the further fermentation of wine or other alcoholic liquor, (…)” (Cox and Dannehl 2007).
153
154
Werner Scheltjens
period, with growth rates that were much higher than during the eighteenth century. The major port of departure of French wine, brandy and vinegar imports to the Baltic was Bordeaux, whose imports were increasingly complemented with Mediterranean imports from Cette after 1760. The wines that were imported to the Baltic from Bordeaux, Cette and other places often are described in some detail in the Sound toll registers. Thus, next to unspecified wine cargoes, such categories as “Stadsvin”, “Hoglands vin” or plain “French Wine” regularly appeared9. The fact that the descriptions of the types of wine imported from France were so imprecise, may be due to a large extent to the technique of mixing, sweeting or strengthening wines (tirer, soutirer, mutter ou frelater les vins)10 before importing them to the Baltic, which was typically associated with Dutch and Hamburg wine traders (Besset 1982; Dion 2010), was frowned upon by Colbert (Dion 2010) and Peter the Great alike (Besset 1982), but nevertheless continued to be common practice throughout the eighteenth century. Furthermore, Bordeaux and Cette also served as the port of departure for some quantities of Picardan (white wine from the Languedoc), Muscat, Madeira, Basque, Spanish and Portuguese wine. The major ports of destination of French wine in the Baltic were Lübeck, Stettin, Copenhagen, St. Petersburg and Danzig. The latter used to rank second after Lübeck until 1760, when Stettin became increasingly important as importer of French wine, brandy and vinegar, benefitting from the favourable conditions for international trade that were introduced by the Prussian government in the late 1740s and early 1750s (Gaziński 2000). Danzig definitively lost its significance in the immediate aftermath of the first partition of Poland (1772). By that time, Lübeck and Stettin had become firmly established as the primary ports of entry of French wine, brandy and vinegar in the Baltic. It is remarkable that, after 9. “Stadsvin” means wine produced in the Sénéchaussée de Bordeaux, a kind of administrative unit surrounding Bordeaux, which stretched from Bordeaux to Saint-Macaire (on the Garonne and Castillon (on the Dordogne). The term “Hoglands vin” (pays haut) is used to describe French wines coming from further inland than the Sénéchaussée, such as Agenais or Bergerac. In both cases, it is white wines that are produced mostly in these areas (Dion 2010; Besset 1982). 10. Taken from page 424 of Dion’s L’histoire de la vigne, who cited the French mid-seventeenth century economist Jean Eon on this issue (Dion 2010).
155
French imports to the Baltic, 1670-1850: A quantitative analysis
1760, the geographical pattern of French wine imports became increasingly complex; next to Lübeck and Stettin, the capitals of Copenhagen and St. Petersburg received increasing quantities of wine, while more and more different, smaller ports started to participate actively in French imports to the Baltic. Among those ports, the most significant were Stockholm, Königsberg, Riga, Rostock, Elseneur and Flensborg, which jointly accounted for about 20% of total French imports of wine, brandy and vinegar to the Baltic between 1670 and 1850. Taken together, all ports except the “big five” received just over 200.000 tonnes of wine during this period, whereas the five biggest ports received a total volume of wine imports that was just below 600.000 tonnes. Figure 4. French imports of wine, brandy and vinegar; fruits, nuts and syrup; overseas products, 1670-1850 In tonnes. Based on STRO
30000
25000
20000
Wine etc. Fruit etc. Overseas
15000
10000
5000
1848
1840
1832
1824
1816
1807
1799
1791
1783
1775
1767
1759
1751
1743
1735
1727
1719
1711
1703
1694
1686
1678
1670
0
French imports of fruits, nuts and syrup correlated quite strongly with those of wine, until the late 1830s at least, and the geographical pattern of these imports was largely identical as well. Bordeaux and Marseille were the dominant ports of departure of French imports of fruits etc. to the Baltic, whereas – before all else – Stettin, Lübeck and – until 1772 Danzig – as well as the emerging Baltic capitals of St. Petersburg, Stockholm and Copenhagen were the dominant recipients of French fruits, nuts and syrups.
156
Werner Scheltjens
The pattern for overseas goods was different. French imports of overseas goods to the Baltic took off immediately after the Great Northern War. The volumes of sugar, coffee and tobacco that were imported to the Baltic originated primarily from Bordeaux, at first, and were complemented with modest imports from Nantes from the 1750s onwards as well as from Le Havre de Grâce and La Rochelle from the late 1760s. The volume of imports rose considerably between 1721 and 1756. French imports of overseas products to the Baltic were completely interrupted during the Seven Years’ War, but resumed at a higher level in 1764. Between 1764 and 1792, the volume of overseas products imported to the Baltic rose to an all-time high of almost 10.000 tonnes in 1789, after which a rapid decline set in, probably under the impact of the Revolutionary Wars on French international commerce. Adversely affected by the French Revolution and, more importantly, the Revolt on Saint-Domingue, which caused a complete interruption of sugar imports to Bordeaux (Crouzet 1964; Marzagalli 2008), almost no French imports of overseas products to the Baltic were executed between 1794 and 1803. With the exception of the years 1821 and 1838, French imports of overseas products remained well under 1.000 tonnes annually, thus having fallen back to pre-1750 levels. In part, the decline of French imports of overseas products to the Baltic can be explained by the changing role of Hamburg as a redistributor of French sugar to the Baltic. The volumes of sugar re-exported from Hamburg into the Baltic accounted for 2.0003.000 tonnes annually after 1815, and – as such – they could not compensate for the overall decline in the volume of French imports to the Baltic during and after the Napoleonic era. Before all others, it was Great Britain that substituted French imports of overseas goods to the Baltic from the mid-1790s onwards (see Figure 5). Thus, interestingly, the decline of French imports of overseas goods in the nineteenth century bears witness of a geographical reorientation of imports that was similar to that of salt. The main destinations of French imports of overseas products to the Baltic were Stettin, St. Petersburg, Stockholm, Copenhagen and Danzig, whereby Stettin clearly stands out as primary port of entry during the second half of the eighteenth century. A notable difference to the geographical patterns observed for wine and fruit imports to the Baltic is the absence of Lübeck, which received only
157
French imports to the Baltic, 1670-1850: A quantitative analysis
2,2% of all French imports of overseas goods to the Baltic between 1670 and 1850. If we combine the insights gathered with regard to the volumes of French wine, fruits and overseas products to the Baltic, it may be assumed that Lübeck primarily played a role as port of entry for wine and fruits, of which part would be re-distributed to other ports in the Baltic, whereas Stettin became to serve mostly as port of entry for goods that had the Prussian hinterland – first of all Berlin – as their final destination (Gaziński 2000; Straubel 2004). Schmidt and Gaziński have stated that only 25% of all goods arriving at the port of Stettin actually stayed there (Schmidt 1864; Gaziński 2000). Figure 5. Geography of imports of overseas goods to the Baltic, 1670-1850 In tonnes. Based on STRO
35000 Great Britain France Dutch Republic
30000
Germany 25000 20000 15000 10000 5000
1847
1839
1831
1823
1815
1807
1799
1791
1783
1775
1767
1759
1751
1743
1735
1727
1719
1711
1703
1694
1686
1678
1670
0
To sum up, the major port of origin of products, other than salt, which were imported to the Baltic, was Bordeaux. For individual product categories Bayonne, Cette, Marseille, Rouen, Nantes and Le Havre de Grâce were significant. The major destinations of French wine, fruits and syrup and overseas goods were Lübeck, Stettin, St. Petersburg, Copenhagen, Stockholm and Danzig, which ranked in the top for each of these product categories. The volumes of French imports to Danzig went in the opposite direction of the overall trend of French imports to the Baltic; Danzig’s position was under pressure after the first partition of Poland and the economic battle against Danzig clearly left its traces in the volume of
158
Werner Scheltjens
French wine, fruits and overseas products imported to the Baltic (Rachel 1928). Indeed, the overall volumes of French imports to the Baltic collapsed during the time of the Continental Blockade and until 1850 at least they would not even come close to returning to lateeighteenth century levels. Only the imported volumes of wine, brandy and vinegar eventually reached new heights in the late 1840s. However, during and after the Napoleonic Era, further structural changes occurred in the composition of French imports to the Baltic. The total number of different products imported to the Baltic almost doubled compared to the second half of the eighteenth century, which in conjunction with the observed overall decline of imported volumes, indicating that a new type of less voluminous (but arguably more valuable) commodities started to gain momentum in the first half of the nineteenth century. After 1815, the French imports of salt, fruits and wine were complemented increasingly with imports of natural dyestuffs such as Campêchewood (lignum campechianum) and St. Martinswood, fustic (dyer's mulberry, yellow wood), krapp (rubia tinctorum), and verdigris; of oils, such as olive oil and turpentine; of gipsstone, winestone and brimstone (sulphur); lead; cotton wool, skins (mostly goat, rabbit and lamb) and (white) leather; soap, caoutchouc (predominantly Senegal and Arabic), paper and other products. Until 1815, the share of these products in French imports to the Baltic was negligible; between 1815 and 1850, their share rose from about 3% to more than 20% of the total volume of French imports to the Baltic. A first observation that can be made, is that the restructuring of the composition of French imports to the Baltic after 1815 also had a profound impact on its geography. The “new” products were exported from three different regions in France: in the North, exports of “new” products were dominated by Le Havre de Grâce and Rouen – or perhaps: the Seine estuary; in the south, Bordeaux remained significant; in the Mediterranean, Marseille and Cette were the gateways for “new” products imported to the Baltic.
159
French imports to the Baltic, 1670-1850: A quantitative analysis
Figure 6. Share of “new” products in French imports to the Baltic, 1815-1849 In tonnes. Based on STRO.
35 30 25 20 R² = 0,6398
15 10 5
1849
1847
1845
1843
1841
1839
1837
1835
1833
1831
1829
1827
1825
1823
1821
1819
1817
1815
0
Most importantly, cotton wool, linen and skins were imported to the Baltic from the aforementioned French ports. The imports of cotton wool and white leather to the Baltic followed an almost bilateral pattern, with Le Havre de Grâce on the supply side and St. Petersburg on the receiving end. Skins followed the same pattern. Soap was exported almost exclusively from Marseille and imported in larger quantities to Stockholm, Lübeck, Riga and Rostock than to St. Petersburg; lead, on the other hand, was exported from Marseille and occasionally from Le Havre de Grâce, Nantes and Dunkerque, to be imported to St. Petersburg. Yet another pattern could be observed in the exchange of gummi, which went from Bordeaux and Marseille to St. Petersburg during the decades following the Restauration. Paper was distributed from Bordeaux to St. Petersburg, Lübeck, Stettin, Copenhagen and Danzig. The imports of dyestuffs from France to the Baltic show an equally diverse pattern of regional specialisation in the production and supply of goods, on the one hand, and a high to almost complete concentration of the demand in one or – at best – a few ports in the Baltic. Verdigris, or Spanish green, was imported to the Baltic mostly from Bordeaux and less frequently from Marseille and Cette. Krapp, on the other hand, a dyestuff that is also known
160
Werner Scheltjens
as garance in French, was imported almost exclusively from Marseille, which in this case served as the entrepôt for the increasing volumes of garance cultivated in the Vaucluse and the Bouches du Rhône regions11. Campêchewood12, St. Martinswood13 and fustic, or yellow wood, were imported to the Baltic almost exclusively from Le Havre de Grâce and Bordeaux. St. Petersburg was by far the most important destination of these dyestuffs coming from France; in fact, Stettin was the only port that received significant quantities of Campêchewood, St. Martinswood and fustic, while obtaining insignificant shares of the other dyestuffs. Similarly, turpentine was exported almost exclusively from Bordeaux to be imported to St. Petersburg, Stettin, Copenhagen, Königsberg and Lübeck. These “new” products, that had been imported from France to the Baltic only in very small volumes before 1815, were all light (except lead) and many of them were of high value. This becomes clear when the details in the Tableau général for 1840 are observed, which not only include estimates of the quantities (in kilogrammes) of goods exported from France, but also a calculated value of these exports, resulting from multiplication of the registered volumes with a so-called “taux d’évaluation”14. Though these calculated values are not a reliable offprint of the actual value of French exports, they are nevertheless useful as a rough indication of the significant impact of the shift in the composition of cargoes imported from France to the Baltic. For several reasons, which cannot be discussed in detail within the framework of this article, matching the data from the Tableau général with the converted data from the Sound toll registers is a painstaking task. For starters, the geographical units do not match: exports to Russia 11. After earlier, unsuccessful attempts, rubia tinctorum was implemented successfully in 1756 in southern France by Jean Althen, the son of a provincial governor in Persia. The main production areas around 1840 were Vaucluse and Bouches du Rhône (Peeters 1975). 12. Campêchewood was exported almost exclusively from the town of Campeche in Mexico, where the exports were concentrated when the town was still under Spanish rule. Schneider estimated the exports of Campêchewood to France between 1837 and 1840 at about 113 tonnes (Schneider 1981). 13. St. Martinswood comes from northern Colombia and was exported mostly from Riohacha, Sabanilla and Santa Marta to France, England and the United States. Santa Marta gave this type of red dyestuff its popular name (Schneider 1981). 14. This value should not be confused with the price paid for these products. It is – so it seems – an estimated value, made arbitrarily by French customs officers.
French imports to the Baltic, 1670-1850: A quantitative analysis
registered in the Tableau général also include exports to the Black and White Seas. Moreover, the usual problems with statistical sources apply, such as: under-registration, the use of different categories and product descriptions, the use of different weights and measures as well as different rules for their conversion15, and so on. What the data from the Tableau général do confirm, however, is the discrepancy between light and more expensive goods, on the one hand, and cheaper bulk goods, on the other hand, that made its appearance in French imports to the Baltic after the Napoleonic Wars. The following figure, which visualizes the relation between the “taux d’évaluation” and the share of the good in the total value of French exports to Russia in 1840, shows that only one expensive good really stands out, tissus de soie et du fleuret, which had an average “taux d’évaluation” of 119,24 francs and a total value of 4.782.688 francs, an thus accounted for 26,20% of the estimated value of French imports to Russia in 1840. Together with the other products that had a “taux d’évaluation” of more than 20 francs, the share of expensive goods in the total value of French exports to Russia was 41,04%. On the other hand, the figure also shows that there were ten products with a “taux d’évaluation” between 0,03 francs (sel marin) and 5,01 francs (librairies) per kilogramme, that accounted for another 40,58% of the total value of French exports to Russia16; among them, the highest volumes were achieved by salt (average taux = 0,03 francs; volume = 5.316.859 kg), wines (average taux = 0,48 francs; volume = 4.943.460 litres), krapp (average taux = 1,00 francs; volume = 783.670 kg), cotton (average taux = 2,00 francs; volume = 592.166 kg), fruits de table (average taux = 0,70 francs; volume = 590.775 kg) and coffee (average taux = 1,20 francs; volume = 528.320 kg) (Tableau, 1841). Assuming that most of the “other goods”, that are not specified in the summary table of French exports to Russia in 1840, but account for 15,71% of the total exported value17, also had a “taux d’évaluation” lower 15. Most of the volumes in the Tableau are given in kilogrammes or litres (for wine), but no rules for conversion from one barrique to its equivalent in litres could be found in the source. 16. Interestingly, other than “librairies”(5,01 francs) there are no goods with an average “taux d’évaluation” between 5 and 20 francs per kg. 17. The remaining 2,67% of total exported value is made up with “poterie, verres et cristaux” and “machines et mécaniques”, of which only the value in francs was entered into the summary table (Tableau, 1841).
161
162
Werner Scheltjens
than 5,0018, the total share of “cheaper” goods in French exports to Russia was probably as high as 55%.19 Figure 7. Relation between “taux d'évaluation” and share in total exported value of main products exported from France to Russia, 1840 Share in total value
30 Silk fabrics
25
20
15 Wine
10 Cotton
5
Garance
Coffee
Indigo
Linen and hamp fabrics
Table fruits Oil-producing fruits Salt
0 0
20
40
60
Essences Coloured silk
80
100
120
140
Taux d’évaluation, in francs
Based on: Tableau général, 1841: 57.
4. Interpretation The composition of French cargoes entering the Baltic changed significantly between the late-seventeenth century and the midnineteenth century. The salt-dominated pattern of the early period was gradually expanded with the addition of goods, such as wine, fruits and syrups, and sugar, coffee and tobacco. In the first half of the nineteenth century, “new” products gained a significant share in French imports to the Baltic, thus witnessing a shift from the former bulk-oriented imports of salt and wine to the Baltic 18. It is possible to reconstruct the composition of these “other goods” and to find their respective “taux d’évaluation” by going through the lengthy “État de développement…” in the Tableau général. Such undertaking, however, lies well outside the scope and aims of the present paper. 19. A brief comparison with the value of French exports to other destinations in Northern Europe provides some food for thought. The share of cheap goods (average taux of less than 5,00 francs) exported to Sweden was 64,72%, to Denmark 68,74%, to the Hanseatic towns 48,32% and to Prussia 40,51%. Assuming that most of the unspecified goods probably had a taux of less than 5 francs, the estimated share of these cheap(er) goods in the total value of French exports to Sweden was as high as 87,70%, to Denmark 84,64%, to the Hanseatic towns 68,97% and to Prussia 64,59%.
French imports to the Baltic, 1670-1850: A quantitative analysis
to “light” imports of highly valued goods, that served the emerging industrialisation of Prussia and parts of the former Polish-Lithuanian Commonwealth (Jedlicki 1968; Wandycz 1974). What remained was a modest continuation of the traditional French imports of salt, wine and overseas goods to the Baltic, complemented with rising imports of “new” products. The origins and destinations of French imports to the Baltic changed accordingly and express the rise of Prussia and Russia as “new” great powers in the Baltic, which found its dramatic climax in the partitions of Poland in the latter third of the eighteenth century and which consequently led to the reconfiguration of the role of Russia’s and Prussia’s Baltic ports in international trade. Insofar as French imports to the Baltic are concerned, Danzig, Königsberg and Riga were largely replaced by Lübeck, Stettin and St. Petersburg in the course of the eighteenth century. On the French side, international trade at the traditionally predominant port of Bordeaux was complemented by a rising share of the Mediterranean ports of Marseille and Cette as well as by the growth of Le Havre de Grâce in northern France. The latter’s development after 1815 must be seen in light of the growing imports from southern America (before all Brazil) (Schneider 1981), of which part was re-exported to the Baltic, but also the take-off of industrialisation processes in the northern part of France, where Paris turned into the “capital of cotton” during the first decades of the nineteenth century (Woronoff 1989; Poussou 1993). Relevant in this context are the respective trade and tariff policies of the emerging Great Powers in the Baltic, but also of the Free and Hanse City of Lübeck, which are likely to have affected the directions and volumes of French imports to the Baltic throughout the entire period observed here. Several developments deserve to be mentioned in this context. First of all, there was the 1716 commercial treaty of the Hanseatic cities of Bremen, Hamburg und Lübeck, which formed a firm basis for these hanseatic towns to compete with the Dutch as middlemen in Baltic trade and transport (Semenov, 1858). Secondly, Russian foreign economic policy and its fierce support of the newly founded capital of St. Petersburg during the first half of the eighteenth century as well as the more comprehensive tariff policies that were established under Catherine the Great (among others expressed in the Commercial Treaty
163
164
Werner Scheltjens
of 1766 and the Franco-Russian Commercial treaty of 1787) provided a firm background for directing and redirecting foreign imports to Russian ports in the Baltic (Martens 1902). Finally, Prussia’s relentless support of the port of Stettin as its primary port of international trade, which started almost immediately after Prussia regained control over Stettin from the Swedes in 1720 and which intensified in the second half of the eighteenth century, is a decisive element in the explanation of the geography and volume of French imports to the Baltic (Rachel 1928). The changes in the structure of French imports to the Baltic also denote the decline of Dutch commercial dominance in the Baltic, which had relied to a large extent on its role as middleman in commercial operations between the Baltic and the southern European Atlantic coast. Indeed, Prussian and – later – Russian economic policies were not only directed towards increasing domestic production and the promotion of (early forms of) industrialization; they also showed a significant concern with the establishment of a domestic services sector. In particular, the development of a maritime transport sector received much attention from Prussian and Russian policymakers. Prussian efforts were directed primarily towards the establishment of a maritime transport services sector in Stettin, while the Russian government undertook several initiatives to support the establishment of a Russian mercantile fleet, not at the least through the invitation of foreign shipmasters to obtain a Russian passport and to continue operations under Russian flag. The latter’s policies were unsuccessful, at least insofar as data on the nationality of shipmasters carrying French imports to the Baltic is concerned. Prussia’s policies, on the other hand, clearly brought forth the establishment of a Prussian mercantile fleet (mostly Stettin), which, jointly with the mercantile marines of Sweden (mostly Stockholm), Denmark (mostly Copenhagen) and Lübeck, took over the role of the Dutch as carriers of French imports to the Baltic in the latter third of the eighteenth century. Remarkably, Lübeck was the dominant provider of carrier services for French direct imports to St. Petersburg. Unfortunately, it is impossible to establish to what extent these direct imports carried by shipmasters domiciled at Lübeck was an extension of re-export trade of French goods from Lübeck to St. Petersburg, that was boosted in the 1830s by the establish-
French imports to the Baltic, 1670-1850: A quantitative analysis
ment of the St. Petersburg-Lübeck steamship company, which organised a regular steamship connection between the two ports employing two and from 1835 onwards three steamships of a size of about 200 tonnes (Schiebe, 1838; Possart, 1840). Moreover, French commercial statistics of the late 1830s and beginning of the 1840s reveal that steamships, sailing under the French flag, were used between Le Havre and some other French ports like Calais, Dunkerque, St. Valéry and the Baltic.20 These steamships reflect the gradual decline of the traditional port of Bordeaux and the rapid rise of “industrial” ports, such as Le Havre after the Restauration (Amphoux, 1932; Soulas, 1940). Generally speaking, what can be observed in the development of French imports to the Baltic between the mid-seventeenth and the mid-nineteenth century is the gradual replacement of traditional with modern structures of commercial exchange. First indications of the decline of France’s traditional commercial exchange, which had relied very strongly on the redistribution of overseas goods as well as on the exportation of agricultural produce, became apparent in the 1780s (Marzagalli 2008). Marzagalli rightly describes, that “[a]lors que le coeur économique de l’Europe occidentale se transférait vers le Rhin, défavorisant les ports français sur l’Atlantique, la domination coloniale européenne aux Amériques était remise en cause” (Marzagalli 2008). In the decades following the American independence, large parts of the continent, in the North as well as in the South and on the American West Coast, became accessible to all parties interested in establishing direct commercial relations. France was forced to reconsider its previous role, not at the least because it had lost many of its former colonies and was left with only Martinique, Guadeloupe, French Guyana, Senegal, Réunion and a modest representation in India (Schneider 1981). There is no doubt that the French Revolutionary wars of 1793-1814 have played a decisive role in the restructuring of French imports to the Baltic: it is 20. In 1839, 8 steamships (2577 tonnes) departed to Russian ports in the Baltic from Le Havre, while 59 departed (13.924 tonnes) to the Hanseatic towns Bremen, Hamburg or Lübeck. In 1840-1841 the number of steamships heading for Russian ports in the Baltic rose to 12 (2742/ 2752 tonnes) annually, whereas the number of steamships destined to the Hanseatic ports remained constant at 65 steamships, carrying about 10.000 tonnes. Unfortunately, the Tableaux générals do not allow specifying how many went to each of the Hanseatic ports (Tableau 1840; Tableau, 1841; Tableau, 1842).
165
166
Werner Scheltjens
precisely during this period of war and revolution that the French international economy was forced to reconsider the structure of its international commercial exchange, while at the same time being confronted with the threats of the British Industrial Revolution. The result seems to have had a triple character, as can be observed in the following table. Table 5. Average annual volume of French imports to the Baltic, selected products In tonnes. Based on STRO
Product
Le Havre
Bordeaux
Marseille
Average annual volume, 1764-1793 Wine
7,932
2.903,155
108,768
Coffee
53,240
626,890
26,492
Sugar
203,788
3.758,196
0,671
Cotton
0,004
1,163
10,355
Campeche- and St. Martinswood
0,055
4,083
0,491
Krap (garance)
0,000
0,000
0,000
Average annual volume, 1815-1849 Wine
105,363
2.851,509
Coffee
21,897
91,922
0,307
Sugar
132,302
173,885
27,464
Cotton Campeche- and St. Martinswood Krap (garance)
330,530
69,324
2,569
3,099
220,947
140,884
12,880
3,878
2,361
215,191
After 1815, in South-West France, the merchants of Bordeaux tried to resumed their former position, some by trying to restore overseas commerce in its former glory, focussing on sugar and coffee; others by transforming and adapting to the new circumstances of the nineteenth century (which explains the rise of Campêchewood and St.Martinswood) (Marzagalli 2008). Regardless of these attempts, Bordeaux remained mostly an entrepôt for wine in the first half of the nineteenth century. Continuity and adaptation also was characteristic of the French ports in the Mediterranean, like Marseille, where overseas goods remained of limited importance, while krapp, or garance, emerged as a “new” regional product, cultivated for international commerce. Quite differently, in northern France, change was the dominant feature of the structure of French imports to the Baltic: both the volume and the
French imports to the Baltic, 1670-1850: A quantitative analysis
composition of Le Havre’s international trade underwent dramatic changes during the French Wars. The rise of Campêchewood and St. Martinswood, on the one hand, and of cotton, on the other hand, is remarkable. They are clear indications of the changing nature of France’s domestic economic development that had a lasting impact on the structure of French imports to the Baltic.
References Administration des Douanes, (1841), Tableau général du commerce de la France avec ses colonies et les puissances étrangères, pendant l'année 1840. Paris. Administration des Douanes, (1840), Tableau général du commerce de la France avec ses colonies et les puissances étrangères, pendant l'année 1839. Paris. Administration des Douanes, (1842), Tableau général du commerce de la France avec ses colonies et les puissances étrangères, pendant l'année 1841. Paris. Ahonen K., (2005), From Sugar Triangle to Cotton Triangle: Trade and Shipping between America and Baltic Russia 1783-1860. Jyväskylä. Allen R.C., and Murphy T., (2005), Before the Metre, the Gram, the Litre: Building a Rosetta Stone of Weights and Measures in the Early Modern World. http://www.nuffield.ox.ac.uk/users/murphy/measures/ before_metre.htm. Bamford P.W., (1954), “French shipping in Northern European trade, 1660-1789.” The Journal of Modern History, 26: 207–219. Barker T.C. and Harris J.R., (1993), A Merseyside town in the Industrial Revolution: St. Helens, 1750-1900. Liverpool. Besset G., (1982), “Les relations commerciales entre Bordeaux et la Russie au XVIIIe siècle.” Cahiers du monde russe et soviétique, 23: 197–219. Cox N., and Dannehl K., (viewed in 2014), “Vial - Vinegar pot.” In Dictionary of Traded Goods and Commodities, 1550-1820, British History Online, http://www.british-history.ac.uk/report.aspx?compid=58906 &strquery=vinegar wine. Crouzet F., (1964), “War, Blockade and Economic Change in Europe 17921815.” The Journal of Economic History, 24: 567–588. Desfeuilles P., (1959), “La Navigation à travers le Sund en 1784: d’après les registres de la douane danoise.” Annales: Histoire, Sciences Sociales, XIV: 492–520.
167
168
Werner Scheltjens
Desfeuilles P., (1961), “La Navigation à travers le Sund et la guerre russosuédoise de Finlande (1788-1790).” Vierteljahrschrift für Sozial- und Wirtschaftsgeschichte, XLVIII: 56–74. Dion R., (2010), Histoire de la vigne et du vin en France des origines au XIXe siècle, Paris. Doursther H., (1840), Dictionnaire des Poids et Mesures anciennes et modernes, contenant des tables de monnaies de tous les pays. Bruxelles. Ellinger Bang, Nina, and Knud Korst, (1906-1933), Tabeller over skibsfart og Varetransport gennem Oresund, Copenhagen and Leipzig. Fox F., (1968), “A view of French-Russian trade relations in the eighteenth century: the Ms Le Gendre.” Jahrbücher für Geschichte Osteuropas, NF, XVI: 481–498. Gaziński R., (2000), Handel morski Szczecina w latach 1720-1805. Szczecin. Iredale D.A., (1967), “John and Thomas Marshall and the Society for Improving the British Salt Trade: An Example of Trade regulation.” The Economic History Review, New Series, 20: 79–93. Jeannin P., (1954), “L'économie française au milieu du XVIe siècle et le marché russe.” Annales. Économies, Sociétés, Civilisations. 9: 23–43. Jeannin P., (1964), “Les Comptes du Sund comme source pour la construction de l’activité économique en Europe (XVIe-XVIIIe siècle).” Revue historique, CCXXXI: 55-102 : 307–340. Jeannin P., (1968), “En Europe du Nord : sources et travaux d’histoire commerciale.” Annales. Économies, Sociétés, Civilisations. 23: 844–868. Jedlicki J., (1968), “State industrial economy in the Kingdom of Poland in the 19th century.” Acta Poloniae Historica, 18: 221–237. Johansen, H.C., (1983). Shipping and Trade between the Baltic and Western Europe, 1784-95. Odense. Kirchner W., (1961), “Relations économiques entre la France et la Russie au XVIIIe siècle.” Revue d’histoire économique et sociale, 39: 158–197. Mann, J. de L., (1971), The Cloth Industry in the West of England from 1640 to 1880. Oxford. Martens, F., (1902), Recueil des Traités et Conventions, conclus par la Russie avec les puissances étrangères, publié d’ordre du Ministère des Affaires Étrangères. Tom XIII. Traités avec la France, 1717-1807. St. Pétersbourg. Marzagalli S., (2007), “Le Commerce du Nord : les échanges commerciaux entre la France et l'Europe septentrionale au XVIIIe siècle by Pierrick Pourchasse [Review].” The Economic History Review, New Series, 60: 851–853. Marzagalli S., (2008), “Le négoce maritime et la rupture révolutionnaire : un ancien débat revisité.” Annales historiques de la Révolution française, 2: 183–207.
French imports to the Baltic, 1670-1850: A quantitative analysis
McCusker J. J., (1973), “Weights and Measures in the Colonial Sugar Trade: The gallon and the pound and their international equivalents.” The William and Mary Quarterly, Third Series, 30: 599–624. Peeters A., (1975), “Les plantes tinctoriales dans l’économie du Vaucluse au XIXe siècle.” Études rurales, 60: 41-54. Poole B. (1854), The Commerce of Liverpool. London and Liverpool. Possart P.A.F.K., (1840), Das Kaiserthum Russland, Erster Theil: Statistik. Stuttgart. Pourchasse P., (2006), Le Commerce du Nord : les échanges commerciaux entre la France et l’Europe septentrionale au XVIIIe siècle. Rennes. Poussou J.-P., (1993), “Les activités commerciales des villes françaises de 1789 à 1815.” Histoire, économie et société, 12: 101–118. Rachel H., (1928), Die Handels-, Zoll- und Akzisepolitik Preußens 1740-1786. Dritter Band, Zweite Hälfte. Berlin. Rönnbäck K., (2009), Commerce and Colonisation: Studies of Early Modern Merchant Capitalism in the Atlantic Economy, Gothenburg. Rönnbäck K., (2010), “New and Old Peripheries: Britain, The Baltic and the Americas in the Great Divergence.” Journal of Global History, 5: 373–394. Scheltjens W., and Veluwenkamp J.W., (2012), “The Sound Toll Registers Online: Introduction and First Research Examples.” International Journal of Maritime History, XXIV: 301–330. Scheltjens W., (2015), “Maße und Gewichte: Konvertierungsmöglichkeiten am Beispiel der Sundzollregister.” Jahrbuch des österreichischen Arbeitskreises für Stadtsgeschichtsforschung, 455–479. Scheltjens W., (2009), “The Volume of Dutch Baltic Shipping at the End of the eighteenth Century: a new estimation based on the Danish Sound Toll Registers.” Scripta Mercaturae – Zeitschrift für Wirtschafts- und Sozialgeschichte, 43: 83–109. Scherer H., (1845), Der Sundzoll. Seine Geschichte, sein jetziger Bestand und seine staatsreichtlich-politische Lösung. Nebst einem Anhang über die Sundzollfreiheit der Pommerschen und Preussischen Städte. Berlin. Schiebe A., (1838), Universal-Lexikon der Handelswissenschaften, Zweiter Band. Leipzig/Zwickau. Schmidt Th., (1864), “Geschichte des Handels und der Schifffahrt Stettins.” Baltische Studien, 20: 165–273. Schneider J., (1981), Frankreich und die Unabhängigkeit Spanisch-Amerikas: zum französischen Handel mit den entstehenden Nationalstaaten (18101850). Stuttgart. Sée H., (1925), “Les relations commerciales entre la France et les pays du Nord au XVIIIe siècle.” Revue Maritime, LXXI: 595–609.
169
170
Werner Scheltjens
Shammas C., (1994), “The Decline of Textile Prices in England and British America prior to Industrialization.” The Economic History Review, New Series, 47: 483–507. Smithers H., (1825), Liverpool, its commerce, statistics, and institutions, with a history of the cotton trade. Liverpool. Straubel R., (2004), “Stettin als Handelsplatz und wirtschaftlicher Vorort Pommerns im spätabsolutistischen Preußen.” Jahrbuch für die Geschichte Mittel- und Ost-Deutschlands, 50: 131–190. Unger W.S., (1959), “Trade through the Sound in the Seventeenth and Eighteenth Centuries.” The Economic History Review, New Series, 20: 206–221. Wandycz P., (1974), The Lands of Partitioned Poland, 1795-1918, Seattle. Woronoff D., (1989), “L’industrialisation de la France de 1789 à 1815 : un essai de bilan.” Revue économique, 40: 1047–1060. Websites STRO 2013: Sound Toll Registers Online: www.soundtoll.nl http://www.let.rug.nl/welling/sont/johansen.htm.
171
French imports to the Baltic, 1670-1850: A quantitative analysis
Appendix Table A1. Weights and measures used for French imports to the Baltic Measure
Min.Value
Max.Value
Frequency
1/2 ahm
75,40
75,40
2
1/2 anker
19,045
19,045
12
1/2 bouteljer
0,452
0,452
389
1/2 fad
76,17
76,17
6
1/2 flasker
0,452
0,452
24
1/2 kister
20
20
1
3,39
3,39
1
1/2 oksehovede
114,255
114,255
372
1/2 pibe
231,85
231,85
106
1,5
1,5
1
1/2 skippund
67,82
67,82
1
1/2 stk.
113,1
113,1
2
1/2 tønde
76,17
76,17
15
1/4 bouteljer
0,226
0,226
95
1/4 oksehovede
54,3
54,3
26
1/4 pibe
115,92
115,92
54
1/4 tønde
34,78
34,78
2
1/8 pibe
54,3
54,3
10
Ahm1
150,80
150,80
134
Anker
38,09
38,09
544
Balle
30
108,85
731
Boisseau3
9,1
78,04
186
Both
412,25
412,25
34
Bouteljer
0,905
0,905
1230
Bundt
16,33
16,33
25
Bushel
36,35
36,35
1
1/2 liespfund
1/2 ris
2
4
48,95
50
37
Chaldron
2692
2692
3
Centner
5
3,16
181,9
55
0,375
106,2
8
226,29
304,39
26134
Fierdinger
31,392
31,392
3
Flasker
0,905
0,905
75
Fod
226,2
226,2
99
Dægge 6
Dusin
Eendeel Fad
7
3
172
Werner Scheltjens
Table A1 (continued) Measure Hectolitres
Min.Value
Max.Value
Frequency
100
100
2
Hundert
19760
19760
4
Kander
1,932
1,932
2
Kasse
40
40
Keel
21538
21538
1
Kilogram
1
1
30
Kiste
40
40
667
Kurv
40
40
508
8
Læst
2325
2918
Liespfund
7,99
7,99
88
1
1
932
68,2
68,2
Ladning
487
54
Liter Lof
13164
3
Mille
100
100
Monts
1250
1250
106
811,2
811,2
66
Oksehovede
197,57
304,92
15902
Ottinger
2,1736
2,1736
1
Moyen 9
10
Pakke Par
Pibe11 Pignatelli
1
3
108,85
20
0,031
0,031
170
377
608,77
3863
0,506
0,506
1
0,40655
0,5091
33735
Quardeel
345
345
Quintal
50
50
12
Pund
Rigsdaler Ring Ris
53 1 4380
720
720
3
3
4 3043
Ruller
36,4
36,4
6
Sække
81,06
81,06
163
Scheffel
47,23
47,23
9
Skieppe
17,39
17,39
2
Skippund13
122,38
148,32
7239
Skok14
18,96
16200
61
Stein
15,43
15,43
14
Stk.
0,01
304,39
11859
Tierce
150,8
150,8
1576
15
173
French imports to the Baltic, 1670-1850: A quantitative analysis
Table A1 (continued) Measure Tolft
Min.Value
Max.Value
Frequency
216
216
Tønde
135,11
135,11
1413
Tons17
904,8
979,01
6
16
1
18
144
216
23
Unknown
0
4000
9224
Viertel19
6
7,61
811
Wage
71
71
4
Wohl
30,6
30,6
2
Tylt
1. The ahm is the semantic equivalent of the French tierce, equalling 150,80 litres in Bordeaux. 2. Though not strictly speaking a measure, Doursther considered that the wide use of bales in all forms and sizes made it necessary to include at least some of its uses in his dictionary. The majority of entries of French imports measured in balles are imports of paper, for which the following calculation was made: 1 bale of paper = 10 rames of paper = 4800 sheets of paper, which corresponds to about 30 kg. The heaviest were linen bales which Doursther estimates as follows: 1 bale of linen = 60 small packs = 240 livres avoirdupois = 108,85 kilogrammes. A bale of coffee from Brasil is set by Doursther at 73,44 kg. This value was extended to almonds, kork and korkholt in my conversion. 3. In Bordeaux, one boisseau was equal to one demi-setier de Paris, or 78,04 kg. The boisseau coming from Nantes was estimated at 9,1 kg. For several French ports, no specification of the metric value of the boisseau could be found. In these cases the value of the old boisseau de Paris, equal to 13,01 kg was used. 4. Centner is the semantic equivalent of quintal, which equals 50 kg in Bordeaux and 48,95 kg in other French ports. 5. Daegge, or 10 pieces, was used to count very different types of textiles and skins. For light textiles, the weight was estimated at 3,16 kg, or 0,316 kg per piece. The weight of one piece of skin was estimated at 8,85 kg, which is the average of weight of goat, sheep and bovine skins as found in the 2013 Compendium of the FAO. The weight of a daegge juchter (better: juften) was estimated at 181,9 (or 18,19 kg for one piece). 6. Products of very different size and origin were counted in dusin or dozen. In this conversion, a dozen socks were estimated to weight 0,375 kg. This estimate is based on Doursther’s indications, which state that “A Elseneur, pour les droits du Sund, on compte que la douzaine chaussettes de cotton pèse ¾ livre (…)“ (Doursther 1840). 7. The fad or oksehovede is the semantic equivalent of the barrique. The predominant barrique of Bordeaux, contains 226,29 litres as well as the barrique of Bayonne (304,39 litres), Nantes (240 litres) and La Rochelle (228,29 litres). The value of the barrique of Bordeaux was also applied to other French ports. Potential differences in the actual type of barrique used, depending on the origin of the wine transported in them, e.g. the barrique of Bourgogne (205,46 litres) or Champagne (205,46 or 182,63 litres), could not be taken into account. 8. The last is a well-known measure with different values. For French imports to the Baltic, the most common value is that of one last of salt, which is equal to 2325 kg. Lasts of other products are assumed to be equal to the ancien last of Amsterdam: 2918 litres. 9. Oksehovede is a semantic equivalent of barrique, see footnote 7. 10. See footnote 2. 11. Pibe is the semantic equivalent of the pipe or botte, very complex measures that may represent very different values. In this paper, the pipe at Bordeaux is 377 litres; the pipe of Bayonne is 608,77 litres and the pipe of Nantes is 480 litres. All other pipes are assumed to be 377 litres. 12. Pund is the semantic equivalent of livre. In most cases, the value of the ancienne livre poids de commerce was used: 0,4895 kg. The value of the livre in Bayonne was 0,485 kg; that of Bordeaux, Dieppe, Nantes 0,4944 kg; Calais 0,510 kg; Dunkerque 0,428 kg; Marseille 0,4079 kg; Morlaix 0,4915 kg; Rouen 0,5091 kg; Toulon 0,40655 kg. 13. Skippund is the semantic equivalent of the charge, a weight equal to 146,85 kg in most of France. In Nantes, the charge equals 148,32 kg; in Marseille 122,38 kg. 14. One skok: 60 pieces. Its minimal estimated value is that of 60 pieces of cloth, where one piece weights 0,316 kg; its maximal value is that of 60 masts, where one mast weights 270 kg. 15. Stk. Means stykker, or pieces, but for wine and brandy, it may also refer to stück, which is equal to one barrique. Depending on the cargo item, its weight differs from 0,01 kg – guesstimate for one clove - to 304,39 kg – equalling one barrique in Bayonne. 16. The tønde, or tonne in French, presents a major conversion problem. Strangely, Doursther’s dictionary hardly lists any French values for the tonne or its semantic equivalents baril and fass. I have converted all measurements in tonne to the value given for the tonne of Amsterdam: 135,11 litres. 17. Following Doursther, a ton of liquid goods is 904,8 litres; of dry goods 979,01 kg. 18. One tylt: 12 pieces. One tylt brædder (a type of timber) is estimated at 144 kg; one tylt dehler (or: planks) at 216 kg. 19. Viertel – semantic equivalent of velte, which equals 7,54 litres in Bordeaux and Marseille; 7,61 litres in Bayonne and Cette, but only 6 litres in Nantes.
THE QUANTITATIVE DEVELOPMENT OF GERMANY’S INTERNATIONAL TRADE DURING THE EIGHTEENTH AND EARLY NINETEENTH CENTURIES Ulrich Pfister University of Münster
The study assembles indirect evidence to establish the patterns of international trade in eighteenth-century Germany. Major results include: (1) International trade of Germany expanded at an annual rate of 1 per cent or slightly less in real terms between the 1730s and the early 1790s. Since GDP grew by about 0.5 per cent p. a. this implies an increase in openness. (2) Imports of colonial goods, most notably sugar and coffee, expanded at slightly less than 2 per cent p. a., which suggests that Germany participated in the development of the Atlantic economy. (3) The period saw import substitution of cottons, and towards the end of the eighteenth century exports of cotton goods partially compensated for sluggish growth of trade in linen, the chief export product. Trade growth seems to have resulted from an increased utilization of seasonally underemployed labour for the production of manufactures for export and contributed to the stabilization of per capita incomes in face of declining marginal labour productivity in agriculture. Keywords: eighteenth century, international trade statistics, Germany, globalization, economic history.
e-mail:
[email protected]
Revue de l’OFCE, 140 (2015)
176
Ulrich Pfister
1. Introduction Two issues motivate this research; the first relates to economic growth, the second to divergence. An emerging consensus holds that economic growth, albeit limited, occurred prior to industrialisation (e. g., van Zanden, 2002). Technological advance in manufacturing was no prerequisite for detaching material welfare from population size. Smithian growth resulting from the expansion of long-distance trade constitutes a possible interpretation of pre-industrial growth experiences: Trade promoted regional specialization, which in turn increased the efficiency of factor allocation and permitted the exploitation of learning curves (e. g., Kelly, 1997; Crafts, 2011). Hence, one would like to know to what extent pre-industrial economic growth went together with an increase in openness and whether shifts in the commodity composition of international trade reflects an intensification of labour division among regions and larger geographical units. A concept intimately connected with Smithian growth is the Industrious Revolution (de Vries, 2008). Given love-of-variety preferences the expansion of intercontinental trade during the early modern era increased the utility of consumption through the multiplication of types of goods available to European consumers. To satisfy their own demand for consumer goods households were prepared to increase their labour effort per capita at a given wage to produce more market goods fetching a monetary income. Given constant arable surface and a declining marginal product of labour households applied their incremental labour input primarily in the non-agricultural sectors producing tradables. Hence we would expect an increase in openness taking place in the form of a parallel growth of imports of consumer goods and of exports of manufactures produced in the framework of the domestic system (proto-industries). The notion of the Great Divergence between China and other major Asian economies on the one hand and the western parts of Europe on the other hand is related to the idea that Western Europe controlled land resources in the western hemisphere whose resources could be exploited in creating an industrial sector;
The quantitative development of Germany’s international trade
China, by contrast, lacked such an opportunity (Pomeranz, 2000). More recent research suggests that income divergence between the leading European economies and the large Asian countries predated the onset of industrialization (e. g., Broadberry and Gupta, 2006). Thus, to test the argument of the Great Divergence one would like to know whether the share of new world goods in long distance trade increased during the early modern period and to what extent commodities originating in the Americas constituted substitutes of European goods whose supply was constrained by land scarcity. Existing research has discussed these issues mostly with regard to the most developed economies situated in the north-western part of the European continent. This study extends the perspective to Germany. This country presents an interesting contrast in two respects: First, much of Germany constitutes an inland economy with limited access to sea transport. Neither did it exert control over nor did it entertain direct trade relations with territories in other continents. It will be interesting to see, therefore, to what extent Germany was linked to Atlantic trade and felt its effects posited by the Industrious Revolution and Great Divergence theses. Second, income per capita probably stagnated during the second half of the eighteenth century, and the real wage of unskilled urban workers fell (Pfister, 2011, 2014). A study of growth and patterns of trade holds the potential to show to what extent an increase of the labour effort per capita in the non-agricultural sectors producing goods for export served to mitigate the effect of a falling marginal product of labour on household income. The two existing surveys of Germany's external trade during the late eighteenth century have been written more than half a century ago by Zorn (1961) and Kellenbenz (1964). Their focus lies on a discussion of sources, the organization, the institutional background and the routes followed by international trade. By contrast, this study aims at a quantitative assessment of eighteenth-century trade, including a comparison with developments during the early nineteenth centuries. Such an enterprise must cope with the challenge resulting from the virtual non-existence of contemporary trade statistics. Rare exceptions include aggregate figures for Bavaria and a database of individual import declarations in Hamburg. To arrive at a consistent picture of the growth and the
177
178
Ulrich Pfister
composition of Germany’s foreign trade from c. 1730 these pieces of evidence are combined with balance sheets for particular territories covering isolated years, transaction volumes of markets serving purchase of export goods and information from other countries concerning their trade relations with German lands. Whereas future research will hopefully expand the body of evidence assembled here the study demonstrates that such an eclectic approach arrives at meaningful statements on Germany’s external trade regarding the general issues raised at the beginning. The text is organized as follows: Section 2 describes the main sources used for the later analysis, and section 3 presents an overview of principal results regarding the evolution of openness based on aggregate import figures. Sections 4 and 5 devoted to Bavaria and Hamburg, respectively, analyse aggregate data in greater detail, again with an emphasis on imports. Sections 6 and 7 add evidence on exports. Isolated balances are used to establish the prevailing patterns of export composition at the end of the eighteenth century, and time series for principal exports serve to explore trends over time. Section 8 concludes.
2. Sources In his study covering the external trade of Germany during the four decades prior to the creation of the national customs union (Zollverein) in 1834 Kutz (1974: 10-1) opts for simply not using German sources and relies on the statistics of trading partners instead. The reason for this choice is, first, the paucity and poor quality of German data and, second, the fact that German sources often do not distinguish between trade with other German states and trade with non-German territories. By contrast, data from other countries usually consider German states as a group when describing geographical patterns of trade. Nevertheless, it is difficult to render trade statistics of several countries comparable, and Kutz’s investigation actually leads to a series of largely unconnected stories of bilateral trade relations. Only for the benchmark year of 1830 do we get an estimation of total foreign trade, of its geographical distribution as well as the commodity composition of trade. The paucity of German sources relating the eighteenth century lets Kutz’s choice appear as the most natural option for the study of
The quantitative development of Germany’s international trade
external trade during earlier periods as well. Thus, later sections will make use of information on the bilateral trade between Amsterdam and her German hinterland in 1753 and in 1789-1799, respectively (van Nierop, 1915, 1917), to derive conclusions concerning the evolution of trade between Germany and the United Provinces during the second half of the eighteenth century. The ongoing reanalysis of French trade statistics may render it possible to give an account of the trade relations between this country and Germany in the near future (cf. Charles and Daudin, 2011). The fact, however, that the availability and quality of trade statistics is far from satisfactory in Germany’s trading partners during the second half of the eighteenth century makes it advisable to exploit German sources as much as possible. Hence, the general approach followed by the present study is to abandon the ambition to create external trade statistics in the modern sense. Rather, the endeavour is to develop series that can be taken as valid proxies both for aggregate trends and shifts in the commodity composition of trade. Bavaria is the only territory that systematically collected information concerning the value of cross-border trade from 1765 (Schremmer, 1966; see below, section 4). Furthermore, the return of duties levied on cross-border trade can be used as an indicator of real trade quantities, since tolls were specific and rates remained stable over time. Only aggregate figures are known; hence, it is impossible both to conduct a critical discussion of the source and a carry out a disaggregate analysis on the level of individual commodities. This also implies that it is not possible to distinguish between trade with other German states and international trade. Since all neighbours of Bavaria were members of the Empire at that time information on this state gives an indication of cross-border trade among German states rather than trade between Germany and the outside world. Other German states that in one way or another began to assemble information on trade from the middle decades of the eighteenth century include Prussia, Hannover and Württemberg (Kutz, 1974: 9). However, the material collected in Württemberg seems to have consisted largely of periodic reports that lacked a consistent methodology; only after the creation of a statistical
179
180
Ulrich Pfister
office in 1820 did a systematic description of cross-border trade develop (Krauter, 1951: 231-235; Walter, 1990: 402-405). For Prussia information concerning the eighteenth century is similarly limited to scattered and inconsistent lists published by Behre (1905: 337-358). On the background of a mercantilist perspective of economic growth late eighteenth-century state officials collected a great body of information on the manufacturing sector. The resulting Fabrikentabellen have been analysed by Kaufhold (1978); in some cases they contain information on manufacture exports. A balance of total exports and importance was established in 1795/6 (see below, section 6). Only from 1802 were statistics on foreign trade established on a regular basis; it appears that these sources have not been analysed so far.1 Beyond scattered aggregate figures for individual years series relating to purchases and exports of linen in particular regions constitute a valuable source on eighteenth-century trade. The most important body of data refers to Silesia, where export values disaggregated according to destination have been published by Zimmermann (1885). For Westphalian regions there exist series concerning the number of pieces of linen purchased on specialized linen markets. Since the function of these markets was to channel and certify linen for export these series can be interpreted as indicators of export quantities. Section 7 below assembles this information to produce an assessment of the aggregate trend of linen exports from Silesia and Westphalia. A wealth of archival information relating to trade in Hannover and minor territories that today form part of Lower Saxony has recently been inventoried (Kappelhoff and Deggim, 2011). Existing research based on this material relates to trade with coffee and receipts of toll stations, respectively (Albrecht, 2000; Obal, 2000). Below I shall use the latter study to test the consistency of import data for Hamburg. 1. The principal sources conserved in the Geheimes Staatsarchiv-Preußischer Kulturbesitz Berlin include II. HA Gen.Dir., Abt. 25 Fabrikendepartement, Tit. 31, Nr. 47 (Balancen von der Fabrikation... und des Absatzes, 1779-1805), Nr. 89 (general balance of 1795/96); II. HA Gen.Dir., Abt. 24 Generalakzise- und Zolldepartement, Abt. A, Tit. 43, Sect. 6, Nr. 1-3 (balance of trade 1802-1806), I. HA, Rep. 151 Finanzministerium, III, Nr. 738-742 (regulations concerning the compilation of trade statistics and trade balances 1806-1818).
The quantitative development of Germany’s international trade
The nature of information available for port cities, which constituted largely autonomous political communities, differs significantly from the sources surviving from territorial states. Series concerning shipping flows have been compiled for the major Hanseatic ports, that is, Bremen, Lübeck and Gdansk (Vogel, 1928, 1932; von Witzendorf, 1951). It is not easy to infer trade volumes from ship movement data, however. In Bremen, for instance, the number of incoming ships stagnated or fell slightly between 1755 and the end of the eighteenth century whereas imports of coffee are said to have risen by a factor of 14, those of tobacco by a factor of six and those of sugar by a factor of 5 during this era (von Witzendorff, 1951: 384, 387; cf. also Rössner, 2008: 84-5). Since colonial goods probably constituted the bulk of imports it is difficult to resolve this contradiction, and the following analysis does not use data on ship movements, therefore. A different and highly valuable type of information subsists for Hamburg, namely, individual declarations of import values covering a major proportion of Hamburg’s overseas trade in 36 single years between 1736 and 1798. They have been digitized and published by Schneider et al. (2001). Despite a number of shortcomings and limitations the import declarations of Hamburg arguably constitute the most important source on the German side regarding overseas import trade during the eighteenth century (cf. section 5 below). What follows uses these scattered sources to develop a hopefully consistent picture concerning the growth trend and the evolution of the commodity composition of the external trade of Germany between c. 1740 and the 1790s.
3. Overview: growth, trade and openness, c. 1753-1830 A tentative estimate of national income based essentially on an indirect estimate of food consumption and on information concerning the structural composition of the labour force suggests that real GDP per capita in Germany grew at an annual rate of 0.2 per cent during the first half and stagnated during the second half of the eighteenth century. After the 1730s the real day wage of unskilled urban workers fell steadily until the first decade of the nineteenth century. On an aggregate level, this decline must have been offset by an increase of the annual work effort and/or an
181
182
Ulrich Pfister
expansion of other sources of income, such as the land rent. Population grew at a fairly steady rate of a bit less than a half per cent (Fertig and Pfister, 2010; Pfister, 2011; Pfister, 2014). This pattern of rather sluggish aggregate growth of the German economy during the second half of the eighteenth century suggests that if it is found that trade in constant prices grew faster than 0.5 per cent – the rate of population growth – or that real trade per capita increased it can be concluded that openness rose and that trade growth contributed to compensating for a falling marginal product of labour in the production of non-tradables. Table 1 assembles information on import values measured in quantities of silver, both aggregate and in per capita terms. Two tentative approaches to measure real trade growth consist in alternatively deflating silver values with the German consumer price index and the import price index of Hamburg, respectively (on the latter, see below, section 5). Since exports of the admiralty of Amsterdam to the German hinterland are known for 1753 and 1789-1792 these years constitute major benchmarks. Imports around 1830 are shown for the sake of comparison. Table 1. Import values and derived indicators of openness, c. 1753-1830 Period
Total import value, tons of silver
Import value in grams of silver per capita
Import value in Import value in grams of silver grams of silver per capita, per capita, constant constant import domestic prices prices of Hamof 1751-55 burg of 1751-55
Overseas
1753
318.6
19.8
19.8
19.8
Overseas
1789-1792
695.3
37.8
31.2
27.4
Bavaria
1769-1773
69.6
48.0
37.8
44.1
Bavaria
1789-1792
64.4
47.0
38.8
34.0
Prussia
1795/6
891.0
152.5
111.9
82.6
Germany
c. 1830
2 200.4
132.6
90.4
—
Sources: Trade: Bavaria: Schremmer (1966: 241); Prussia: Behre (1905: 357); Germany: Kutz (1974: 363); overseas imports combine exports of the Admiralty of Amsterdam to the German hinterland (de Vries, 1965: 28) with imports of Hamburg (Pfister, 2012). It is assumed that toll ledgers in Hamburg covered two thirds of actual overseas imports flowing through this city (Pfister, 2012: 12) and that Hamburg handled about 71 per cent of the import trade of German ports (Jeannin, 1971: 72). — Population: Behre (1905: 462); Lee (1977: 12); Fertig and Pfister (2010: 5). Population in Bavaria is extrapolated on the basis of population in 1771 assuming a negative growth rate of -0.32 p. a. This figure corrects for population loss due to change of boundaries (Denzel, 1998: 110-1). Reference population for overseas imports in the eighteenth century is Germany in the borders of 1871 excluding Alsace-Lorraine, the three north-eastern provinces of Prussia and Schleswig; reference population in 1830 is Germany in the borders of 1871 excluding Alsace-Lorraine. — Price deflators: Domestic prices refer to the consumer price index of twelve German towns (Pfister, 2014); the import price index of Hamburg is from Pfister (2012).
The quantitative development of Germany’s international trade
The most conspicuous result of Table 1 is contained in the first two lines that relate to trade flows between the Admiralty of Amsterdam and its German hinterland, and overseas imports of Hamburg. Figures for Hamburg are proportionally inflated to compensate for omissions and to take into account import trade of other German sea ports (see note to Table 1). Estimated overseas import values measured in tons of silver expanded at an annual rate of 2.1 per cent between 1753 and 1789-1792. As import prices in Hamburg and population increased by annual rates of about 0.9 and 0.4 per cent respectively during this period, real import growth amounted to only 1.3 per cent or 0.9 per cent p. a. in per capita terms. Figures relying prominently on the records of the Admiralty of Amsterdam may overstate real trade growth, however. Trade between the Admiralty of Amsterdam and its German hinterland was highly imbalanced: Whereas exports into Germany are said to have increased from 11.5 to 29.1 million guilder between 1753 and c. 1790, mainly because of a spectacular growth of trade with coffee and sugar, imports amounted to only 5.0 and 5.3 million guilder respectively (de Vries, 1965: 28). As a first possibility, this implies the towering up of a huge deficit on current account. Given the short-run character of contemporary trade finance it is difficult to imagine how it could have been balanced by long-term capital movements. Thus a second possibility appears more plausible, namely, that substantial displacement of both import and export flows took place during the second half of the eighteenth century as far the trade relations between the Netherlands and Germany are concerned. By comparison, recorded overseas imports flowing through Hamburg expanded only at an annual rate of 0.7 to 0.9 per cent in real terms between the late 1730s and the 1790s, whereas real imports of Bavaria – derived from contemporary toll and excise returns – increased at an annual rate of 0.6 to 0.9 per cent during the last third of the eighteenth century (see below, section 4). Two alternative sources support the view that values derived from the records of the Admiralty of Amsterdam may overstate import growth in north-western Germany. The first concerns the returns of the Lastgeld levied on Amsterdam’s shipping via the Rhine. It can be considered as a proxy of the cargo space hired for Amsterdam’s trade with its German hinterland and it shows a rather
183
184
Ulrich Pfister
low growth rate of 0.6 per cent over the period 1726-1794 (basis: five year averages; Heeres, 1988: 276). The second source is the crane tax levied by the authorities of Cologne. River transport on different sections of the Rhine depended from separate shipping organizations, and goods were transferred between the two systems in Cologne. At least for bulky goods, therefore, the tax on crane usage constitutes a proxy for trade between north-western Germany and the United Provinces (Figure 1). However, nothing is known on the institutional history of the crane tax so far; it cannot be excluded that part of the increase visible in Figure 1 is due to changes in tax assessment (Weber, 2005: 422-3). We also do not know whether the tax was assessed on the basis of the values or the quantities of the goods handled; the strong increase of tax returns in 1758-1762, which falls in the inflationary period during the Seven Years’ War, points to dependence of the tax on values, however. Figure 1. Return of the crane tax of Cologne in kilograms of silver, 1690-1794 400 350 300 250 200 150 100 50 0 1690
1700
1710
1720
1730
1740
1750
1760
1770
1780
1790
1800
Note: Exponential trend is 1.3 per cent (R2=0.91). Sources: Feldenkirchen (1975: 286-8); silver conversion based on Metz (1990: 366-95).
Over the whole eighteenth century the return of the crane tax increased fairy steadily by an annual rate of 1.3 per cent in terms of its value in grams of silver. If one abstracts from the rather implausible upward shift in 1758-1762, which may be due to war-time inflation and/or a change in the fiscal regime, the trend is much flatter however. From 1690 to 1755 it amounts to 1.1 per cent and
The quantitative development of Germany’s international trade
in 1760-1790 to only 0.6 per cent p. a. Particularly if the tax depended not only from loaded quantities but also from the values of the goods handled or if the tax rose the growth rate of real transactions must have been considerably lower than 1.3 per cent. All this implies that the figures derived for the imports from Amsterdam and overseas during second half of the eighteenth century in Table 1 – annual growth rates of 1.8 per cent in silver terms and 1.2 per cent in real terms – mark upper boundaries of the likely true rates of expansion of Germany’s international trade. Information on import trade in Hamburg, cross-border trade in Bavaria and the volume of shipping on the Rhine suggest that in real terms imports increased at an annual rate of 1 per cent or a bit less between the 1740s and the early 1790s. Nevertheless, since even this modest growth rate exceeds the rate of increase of population and – given stagnant per capita income – aggregate output, the openness of the German economy rose. The contrast between the trends of openness and the real day wage of unskilled labourers suggests that international trade contributed to mitigating the impact of declining labour productivity on income. Apart from Bavaria, imports from Amsterdam and overseas sources can be confronted with a balance of Prussia’s external trade in 1795/6 and an estimate of Germany’s total foreign trade around 1830 (bottom lines in Table 1). Prussian trade in the mid-1790s appears huge, even if values are deflated with domestic consumer prices, which rose drastically following the outbreak of European war in 1792. In per capita terms, imports from Amsterdam and overseas sources amounted to only about a quarter of Prussia’s imports, suggesting an important role for overland trade. The silver value of Prussia’s imports per capita in the mid-1790s also exceeds by about a quarter the corresponding figure for all-German imports around 1830. If values are deflated by domestic consumer prices – there exists no import price index for the first part of the nineteenth century – the difference becomes even larger given the deflation that occurred after the end of the Napoleonic wars. However, the Prussian balance of 1795 seems to have been compiled on the basis of data supplied by individual provinces and may thus include a fraction of domestic trade. Given the lack of a systematic concept of foreign trade underlying these data, at least aggregate values should not be interpreted (cf. below, section 6).
185
186
Ulrich Pfister
Comparison of imports from Amsterdam and overseas sources during the late eighteenth century with German imports around 1830 should take into account the limited coverage of external trade during the early period. Imports from the Netherlands, France and overseas trading partners – that is, the segment of trade covered by eighteenth-century sources – account for only 67.1 per cent of imports around 1830 (Kutz, 1974: 363), which reflects the relevance of trade with Central and Eastern Europe and Scandinavia. Hence, an assessment of the aggregate trend between 1790 and 1830 should deflate import values in 1830 by 0.671 to render the two sets of information comparable. It turns out that the silver value of imports from the Netherlands and from overseas increased by an annual rate of about 1.9 per cent in c. 1790-1830; if deflated by domestic consumer prices the growth rate of real imports amounts to 1.4 per cent. These figures are quite similar to the growth rates obtained for imports from Amsterdam and overseas sources between 1753 and c. 1790 (2.1 and 1.3 per cent, respectively). Since the pace of population growth increased in the first part of the nineteenth century (0.8 per cent p. a. in 1790-1830) and per capita incomes were possibly somewhat higher in 1830 than in 1790 openness probably expanded less between c. 1790 and c. 1830 than during the preceding half century. Very tentatively it can be concluded that between the onset of the Wars of the French Revolution in 1792 and the foundation of the Zollverein in 1834 Germany’s external economy expanded no faster than during the preceding half-century. A slow but significant increase of openness preceded Germany’s transition to sustained growth around 1820 Pfister et al. (2012).
4. Aggregate trends in detail: Bavaria, 1765-1799 From 1765 Bavarian authorities collected information on the value of cross-border trade. In addition, ledgers preserve the value of the revenues of tolls and excises paid when merchandise crossed the frontier. Since rates were specific and remained stable over time revenues can be interpreted as indicators of real trade (Schremmer, 1966: 231-237, 240). This interpretation presupposes that rates were meaningfully related to values and that relative prices among major commodities did not change drastically. Only aggregate figures are preserved; statements regarding the commodity structure or the geographical pattern of trading part-
187
The quantitative development of Germany’s international trade
ners are impossible to derive. Figure 2 gives annual series of values, whereas Figure 3 shows indices of the revenues of tolls and excises collected at the state borders in intervals of two years. Figure 2. Export and import values in Bavaria, 1765-1799 In millions of Gulden
10 Imports
9 8 7
Million Gulden
6 5
Exports
4 3 2 1 0 1765
1770
1775
1780
1785
1790
1795
1800
Note: Intrinsic value of Gulden is 11.693 grams of silver. Source: Schremmer (1966: 241).
Figure 3. Implied export and import quantities in Bavaria, 1765-1799: index of toll and excise revenues 1767=100; intervals of two years
180 160 140
Revenue import tolls
120 100 80 60 40
Revenue export tolls
20 0 1765
1770
1775
1780
1785
1790
1795
1800
Notes: Exponential trend of export toll revenues 1.2 per cent (R2=0.19), after removal of 1795 0.8 per cent (R2=0.11); exponential trend of import toll revenues 0.6 per cent (R2=0.15), after removal of 1769 0.9 per cent (R2=0.37). Source: Schremmer (1966: 238).
188
Ulrich Pfister
Apart from the three years in 1796-1799 import and export values moved in parallel; over the whole 35 year period exports were only one per cent below import values. This suggests consistency of the two series as well as the impossibility of sustaining trade imbalances over longer periods at the time in question. In per capita terms import values in Bavaria in 1789-1792 exceeded those from Amsterdam and overseas only by 24 per cent (Table 1 above). This suggests a rather limited weight of overland trade among German states relative to foreign trade, quite in contrast to the – probably deficient – information concerning Prussia in 1795/96. Figure 2 suggests that Bavaria’s foreign trade stagnated during the last third of the eighteenth century (R2 of the exponential trend is below 0.1 for both series). The indicators shown in Table 1 for per capita values corrected with alternative deflators confirm this impression; if import prices of Hamburg, which are strongly influenced by the prices of colonial groceries, are chosen as deflator real imports per capita actually declined significantly. Remarkably though, toll revenues – which should reflect the evolution of trade quantities – suggest a different picture (Figure 3): Revenues of tolls on both imports and exports rose over time; if the highest value is removed in each series the exponential trends increase at rates of 0.9 and 0.8 per cent, respectively. This corroborates the earlier statement that the external trade of Germany increased at an annual rate of a bit less than 1 per cent during the second half of the eighteenth century. A caveat remains, however. Dividing nominal trade by toll revenues yields an implied price index for external trade. Unfortunately neither the resulting export price index nor the import price is meaningfully correlated with domestic consumer prices or import prices in Hamburg.2 This suggests either a rather peculiar commodity composition of Bavaria’s external trade or a tax structure that does not reflect the share of individual commodities in total trade value. Given that Schremmer (1966) was unable to find information regarding the commodity composition of trade it is unlikely that this issue can be resolved. 2. Not shown; results are available from the author on request. The conclusion in the text also follows from the contraction between Figure 3 and the values shown in Table 1.
The quantitative development of Germany’s international trade
5. Overseas imports of Hamburg, 1733/36-1798 While probably less important than Dutch seaports in handling German overseas trade Hamburg was a highly relevant gateway between inland Germany and the North Sea basin already by the eighteenth century (Jeannin, 1971; North, 1996; Weber, 2004: 3786, 225-39; Rössner, 2008: 78-82). Accordingly, Hamburg’s import toll registers comprising about 180,000 self-declarations of the value of individual commodities by the merchants who imported them by ship covering 36 complete years in 1733-1792 constitute a source of primary importance for documenting Germany’s international trade at this time. This section summarizes ongoing work with this source that is based on the digital version of its modern publication (Schneider et al., 2001; Pfister, 2012). The source has three major shortcomings (Krawehl, 1991; Weber, 2000; Schneider et al., 2001: 11-2; Rössner, 2008: 55-7; Pfister, 2012: 10-6). The first refers to coverage. Only goods coming into the city from overseas were liable to pay tolls, and there were numerous exemptions. Only ships coming from farther west of the mouth of the Schelde River, including the British Isles and Archangelsk, had to pay the tax. Imports from the Netherlands, the Baltic and Scandinavia are therefore not documented. Transit trade and imports of some important commodities, notably coal and grain, were exempt as well. Furthermore, there must have been significant omissions, at least on the level of some individual goods. The comparison of Hamburg’s toll ledgers with figures on British exports to Germany with respect to dyestuffs, for instance, suggests a gross underestimation of trade in the former source (Engel, 2009: 151). These shortcomings and errors notwithstanding, data given by the toll registers of Hamburg are satisfactorily consistent with information provided by other sources, at least on an aggregate level. First, comparison with reports of French consuls suggest that declared import values correspond to about two thirds of effective overseas import values and that the sources convey the same picture regarding the trajectory of two major import goods, sugar and coffee (Pfister, 2012: 13-4, based on Jeannin, 1971: 51-3). Second, total declared values in Hamburg can be compared to the toll returns of Stade. This small town was situated at the mouth of the Elbe estuary, and Hanoverian officials taxed incoming traffic there. Up to 1792 the linear fit between the two series is very good (R2=0.78),
189
190
Ulrich Pfister
whereas after this year toll returns in Stade rise much faster than declared import values in Hamburg (data from Obal, 2000: 99). It may well be that the onset of European War in 1792 boosted Hamburg’s transit trade, which was not tapped by import tolls levied by the town. The upshot of these comparisons is that until about 1790 at least import declarations in Hamburg give a satisfactory representation of the evolution of aggregate import values. A second shortcoming refers to the prices used by merchants and officials in establishing the value of an imported good. We do not know the procedures in assessing taxable values, and contemporaries may have applied customary values or concluded gentlemen’s agreements rather than referring to market prices. Third, 7 per cent of total value is made up of summary categories describing merchandise in rather vague terms, such as colonial goods, retail goods, manufactures and drogues (dyes, chemical and medicaments). At the same time, only about ten products or narrow categories of merchandise regularly recorded an import share of one per cent and more. Since many goods that were of minor importance in import trade could be included in one of the summary categories if follows that it is difficult to establish their import values with some accuracy. In view of an aggregate analysis the primary implications of the second and the third shortcoming relate to the precision of the import price index: weights of the prices of minor goods will be imprecise, and the stickiness of prices that contemporaries applied in fixing taxable value leads to an underestimation of import quantities in crisis years characterized by price spikes. To assess the evolution of imports in real terms the values given in the toll ledgers are deflated by prices. An aggregate import price index is constructed as a Fisher chain index (with an adjustment of weights in every year in which import values are available) from prices for 44 commodities quoted in the price currant of Hamburg (Pfister, 2012: 26-31). The present version relies mostly on prices published by Gerhard and Kaufhold (2001). Future versions of this analysis will make use of additional price information from the original source to do justice to changes in the composition of major goods, such as the shift from white sugar to cheaper muscovado. Publication of the price current started in 1736; analysis of real imports is confined to the period beginning in this year, therefore.
The quantitative development of Germany’s international trade
Commodities for which prices are available cover two thirds of total import value in the late 1730s and between 80 and 90 per cent from 1753 (except 1797). Figure 4 shows two variants of an index of real imports based on alternative assumptions concerning the prices of goods for which prices are unknown. The black graph deflates total import value by the import price index based on the 44 commodities as described above. The grey graph is obtained by deflating the 44 commodities with the import price index and the products without price information with the price index of German linen traded in Hamburg mentioned in an earlier section. The rationale behind this procedure is that the majority of imports for which no price information exists consists of textiles whereas the import price index is driven by the prices of sugar, coffee and other colonial groceries. Use of the price of German linen to deflate imported textile makes the assumption that textile markets were integrated, which is less heroic than assuming that imported textiles followed the price movement of colonial goods. In fact, the two indices in Figure 4 follow by and large the same trajectory; results are clearly insensitive to the assumption concerning the deflator of goods for which no price information exists. Figure 4. Indices of real overseas imports of Hamburg, 1736-1798 Fisher index; 1736=100
225 200
Total imports deflated with import price index Total imports, goods without price information deflated with synthetic linen price
175 150 125 100 75 50 1735 1740 1745 1750 1755 1760 1765 1770 1775 1780 1785 1790 1795 1800 Notes: Exponential trend of real imports, goods without price information deflated with synthetic linen price, 0.9 per cent (R2=0.47), excluding years from 1795 0.7 per cent p. a. (R2=0.38). Sources: Pfister (2012: 34). Own calculation based on Schneider et al. (2001, digital version); Gerhard and Kaufhold (2001); additional price data from Kommerzbibliothek Hamburg S/49 (price current).
191
192
Ulrich Pfister
Real imports followed an exponential trend of 0.9 per cent p. a. or 0.7 per cent p. a. if the years from 1795, which saw a massive increase of real trade volumes by more than a third, are discarded (see below for an explanation). These rates are consistent with those obtained for the external trade of Bavaria. These two results combined warrant the conclusion that German imports in c. 17401792 (the onset of pan-European war) expanded at an annual rate of slightly less than 1 per cent in real terms. Figure 4 also allows some observations about the short-term fluctuation of overseas imports. First, trade reacted strongly to wars: the War of the Austrian Succession (1740-1748), the Seven Years’ War (1756-1763) and the American War of Independence (1776-1782), which escalated into the fourth Anglo-Dutch War (1780-1784), clearly had a negative effect on Hamburg’s import trade. Note, however, that these events were also linked with price shocks in traded goods; given that the procedures followed by contemporaries in fixing import values are unknown it is impossible to determine the exact magnitude of the war shocks in real terms. Second, the graphs in Figure 4 show a strong hike at the end of the period under study. It coincides with the French invasion of the United Provinces, the creation of the Batavian Republic and the collapse of Dutch entrepôt trade. This must have led to a displacement of trade between the northern Netherlands and their hinterland to German seaports. To some extent, the disaster hitting the northern Netherlands at the end of the eighteenth century constituted the basis for the subsequent emergence of Hamburg as leading port in handling German overseas trade. Third, imports stagnated between 1755 and 1783. It is not easy to account for this phenomenon. One possible explanation refers to the temporarily unfavourable institutional environment of Hamburg’s trade. Possibly as a reaction to mercantilist policies in the continental hinterland the port region of the North Sea experienced a free trade movement (or free-port movement, as early writers used to call it) in the 1750s and 1760s (Baasch, 1910a: 495, 1910b: 98; de Vries, 1959: 49). In the Netherlands, the stadholder proposed the introduction of a limited free-port regime in 1751 as a means to revive trade. Concrete measures were rather limited, however. In 1754 tariffs on Russia leather and indigo were abolished; in 1767 tariff reductions followed for tea, coffee and
The quantitative development of Germany’s international trade
cochenille. Bremen followed the Dutch in 1756 by abolishing a number of duties, which presumably boosted its trade (von Witzendorff, 1951: 363). In reaction to all this, the merchant community of Hamburg staged a petition to the town authorities demanding the reduction or outright abolition of a number of tariffs (1756). The lack of response on part of urban authorities may have diverted trade from Hamburg to Amsterdam, to Bremen and to satellite sea ports on the Elbe estuary, Altona in particular. The trajectories of imports of indigo and wine are those that fit well into such an account (see Pfister, 2012: 9, 37 for details). An alternative explanation refers to real factors. A later section will find a similar pattern with regard to a major export commodity, namely, linen. Faltering export receipts may have depressed import capacity. Preliminary work on the land rent in Westphalia also show a stagnation in the major source of income of the elite during the third quarter of the eighteenth century, which may have reduced import demand. It is left to future research to disentangle the respective effects of all these institutional and real influences on the evolution of Hamburg’s import trade. Figure 5 disaggregates real imports by major commodity groups. The idea behind this is to relate the pace of German import growth – about 1 per cent p. a. or a bit less – to the experience of the wider Atlantic world whose trade expanded at about 2 per cent p. a. during the early modern period (de Vries, 2010: 718-20). Imports of colonial goods recorded in Hamburg experienced a fairly continuous expansion between the late 1730s and the 1740s at an annual rate of 1.6 per cent. Sugar and coffee dominated this trade flow with 37 and 26 per cent of average import value in 1790-1798; from 1769 colonial commodities usually accounted for more than 70 per cent of the value of taxed imports. The commodity whose estimated import quantities experienced the fastest growth was coffee with an exponential trend of 3.7 per cent p. a. Estimated sugar imports grew slower at 0.9 per cent in real terms, but this estimate mostly likely underestimates true growth as it does not justice to the shift from white sugar to cheaper muscovado over time (see Pfister, 2012: 41-2 for details). This also implies that the true growth rate of the imports of colonial goods must also have been slightly higher than 1.6 per cent.
193
194
Ulrich Pfister
Figure 5. Real imports of major commodity groups, Hamburg 1736-1798 Fisher indices, log scale; 1736=100
200
20 1735 1740 1745 1750 1755 1760 1765 1770 1775 1780 1785 1790 1795 1800 Colonial groceries
Mediterranean beverages and groceries
Goods with unknown prices, assuming price of linen Notes: Exponential trends: colonial goods 1.6 per cent (R2=0.68); Mediterranean beverages and groceries -0.7 per cent (R2=0.36). Sources: Same as Figure 4.
The great weight of colonial commodities in Germany’s overseas imports during the late eighteenth century are also attested by more spotty evidence concerning Amsterdam’s exports to the German hinterland as well as Bremen’s trade. In 1790 colonial commodities constituted 81 per cent of Amsterdam’s export to Germany via the Rhine; in 1753 this share had amounted to merely 17 per cent (calculated on the basis of de Vries, 1965: 28). Whereas quantities of sugar exported to Germany in 1789-1791 were only 59 per cent of the estimated import quantity in Hamburg those of coffee exceeded the estimate for Hamburg by 37 per cent. Finally, recall that imports of colonial goods multiplied in Bremen over the second half of the eighteenth century (von Witzendorff, 151: 384). The bottom line of this evidence is that German imports of colonial commodities must have followed more or less the general expansionary trend of the Atlantic economy between the late 1730s and the early 1790s. The contrast between the fast growth of imports of colonial goods (probably close to 2 per cent p. a.) and the modest rate of
The quantitative development of Germany’s international trade
increase of total imports (1 per cent p. a. or slightly less) implies a marked shift of the composition of imports. In fact, Figure 5 shows that imports of goods of Mediterranean origins – mainly wine, spirits and groceries such as raisins and currants (which had constituted Hamburg’s principal overseas import good in the 1680s) – followed a falling trend. Actually, tentative estimates of import demand functions suggest that Mediterranean goods whose relative price rose over time were substituted by comparatively cheap colonial goods. This supports the Great Divergence thesis with respect to luxury goods at least in that American goods were relatively less scarce than Mediterranean goods and import demand followed relative prices. At the same time, however, American goods were unable to relieve land scarcity in Germany: There are no positive cross-price elasticities of the demand for the former type of goods with respect to land-intensive non-tradables such as grain and beer. The rise of import demand for colonial groceries cannot be explained by changes in income and relative prices and thus reflects changes in preferences (Pfister, 2012: 39-46). At least until c. 1780 the increase of imports of colonial groceries was also partly counterbalanced by a decline of imports for which no price information exists. As mentioned earlier this category consists mostly of textiles. In 1733-1742 textiles made up for a fifth of total import value, with cottons dominant (13.8 per cent); in 1781-1789 textiles accounted for only 2.6 per cent of total imports, and the share of cotton goods had fallen below one per cent. Cottons constituted fashion’s favourite of the eighteenth century (Lemire, 1991); thus, the decline of import trade with these goods must reflect import substitution rather than a decline of demand. Two types of evidence support this conclusion: First, additional evidence on imports, though not necessarily on those flowing through Hamburg, suggest vigorous import growth of inputs for the cotton industry, such as raw cotton and indigo, during the second half of the eighteenth century (Pfister, 2012: 13, 46-51). Second, evidence examined in the next two sections shows that cotton goods emerged as a new export product after the middle of the eighteenth century.
195
196
Ulrich Pfister
6. Export structure: Prussia and Amsterdam at the end of the eighteenth century Hamburg’s import toll ledgers, despite their limitations, provide valuable insights on an important segment of Germany’s import trade over a large part of the eighteenth century. Ledgers referring to exports exist as well but remain little studied so far (Weber 2000: 93–6, 106, 109). To assemble at least a minimum of information on exports the remainder of this study proceeds by two steps: The present section draws on the balance of trade of Prussia in 1795/6 and data on imports of Amsterdam from Germany around 1790 to gain a rough idea of the commodity structure of exports at the end of the eighteenth century. This provides the background for the discussion of isolated time series concerning proxies for exports of individual goods in particular places and regions over longer periods of time. Table 2 reproduces the balance of trade of Prussia in 1795/6 as it has been established by contemporary authorities. It constitutes the earliest attempt at producing a coherent representation of foreign trade and its commodity composition in Germany. Also note that the document was drawn up after the divisions of Poland in 1793 and 1795, which brought a massive expansion of the lands ruled by the house of Hohenzollern in the grain producing hinterland of the southern Baltic. There are no known traces of primary data, and the procedures followed in data aggregation have not been discussed in extant scholarship. As mentioned in the context of the discussion of Table 1 above the balance of 1795/6 suggests implausibly high levels of trade. Since the data aggregate information provided by provincial authorities during an era when there still existed many internal tariffs it is highly probable that both external trade and internal trade crossing tariff boundaries. were recorded indiscriminately. Sizeable exports of colonial groceries (one sixth of total exports) and of goods such as wine and indigo indeed suggest the possibility that the figures include internal and transit trade. Retained imports and exports from domestic sources must have been of considerably smaller magnitude, therefore.
197
The quantitative development of Germany’s international trade
Table 2. Structure of external trade of Prussia, 1795/6 (Shares in imports and exports, per cent)
Foodstuffs, beverages
Imports
Exports
19.1
15.9
Grain
5.4
9.1
Meat, fish
4.9
2.2
Wine
6.4
2.3
27.3
17.3
12.1
8.4
Groceries Sugar Coffee
6.6
3.9
Tobacco
2.1
1.3
Spices
1.3
0.6
Raisins, currants
2.9
1.9
Industrial inputs
18.4
11.7
12.2
7.9
Raw silk
2.4
0.1
Raw wool
1.2
0.1
Flax
1.2
0.5
Flax yarn
4.9
6.2
For textile manufacture
Dyes, mordants
3.3
1.9
Indigo
1.3
0.6
1.7
1.5
Semi-finished iron goods, metals Manufactures Textiles Silks
27.6
48.1
22.7
42.7
1.1
1.3
Cloth
2.7
9.5
Worsteds
1.3
4.0
Cottons
4.9
5.0
Raw and bleached linen
8.6
16.3
Leather
1.5
1.3
Pottery and glas
0.4
0.5
Iron and metal goods
1.5
1.9
0.7
1.1
1.3
1.3
7.6
7.0
(53.3)
(51.6)
Coarse iron goods Fashion goods Other Total value in million Taler Source: Behre (1905: 206-7).
198
Ulrich Pfister
Despite these shortcomings the balance of 1795/6 allows identification of major export items. Textiles are the most important category; linen constitutes the single most important good, and the importance of flax and hemp processing for Prussia’s international economy is underscored by sizeable exports of yarn (probably mostly used as input for lace making in the large metropolises of the southern Netherlands). Taken together, woollens and worsteds come second. Interestingly, cottons appear as an important export commodity with their share apparently exceeding the one of semi-finished and finished iron goods (5 vs. 3.4 per cent). The contrast between the modest value of iron goods in the Prussian list and high share of this category in Amsterdam’s imports (almost 30 per cent; Table 3) renders it possible that the former list underestimates exports of the western territories. If one abstracts from re-exports of colonial groceries, wine and indigo (possibly within the kingdom of Prussia) grain as well as fish and meat turn out as major export commodities apart from textiles and iron goods. Taken together, Prussian exports at the end of the eighteenth century were heavily concentrated on few categories, namely, textiles, iron goods and basic foodstuffs. Table 3 aims at tracking German exports to the Netherlands via imports of the admiralty of Amsterdam from its hinterland via overland and river trade as well as the North Sea around 1790. The source (Nierop, 1917) describes trade flows concerning individual commodities partly in terms of values, partly in terms of quantities. For the purpose of this study the import quantities of four major goods were converted into estimated values using prices from the price currents of Amsterdam and Hamburg (see note to Table 3). The sum of the estimated import values of individual commodities amounts to four fifth of the total given by de Vries (4.2 vs. 5.3 million guilders; de Vries, 1965: 28). Thus, an important segment of German exports is missed out, and the preliminary character of the figures presented in Table 3 should be stressed.
199
The quantitative development of Germany’s international trade
Table 3. Structure of imports of Amsterdam from Germany, 1789-1791 Shares in per cent
Raw materials
9.0
Potash
1.3
Copper
2.2
Lead
1.8
Lead oxide (Blausel)
2.5
Drogerijen Semifinished goods, industrial inputs
1.3 46.3
Glas
4.1
Rags (for papermaking)
3.3
Semifinished iron goods (includes nails and wire)
20.9
Wood, wooden goods
8.3
Yarn
9.6
Textiles
23.7
Linen
17.9
Cotton goods
4.6
Stockings, hats
1.3
Other finished goods
12.3
Guns
1.0
Other iron goods
7.7
Retail goods (kramerij) Other Total value in million guilders
3.5 8.6 (4.2)
Note: Origins of imports of the Admiralty of Amsterdam refer to river and overland trade with north-western Germany and overseas imports from the southern coast of the North Sea (Kleine Oost). Sources: van Nierop (1917), digitized by George M. Welling http://www.let.rug.nl/~welling/paalgeld/appendix.html. Values of quantities of iron wire, semifinished iron goods, copper and lead were estimated using prices for iron wire, Swedish iron and Norwegian copper quoted in Amsterdam (Posthumus, 1946, vol. 1, items #184, #168 and #174) as well as of lead from Goslar quoted in Hamburg (Gerhard and Kaufhold, 2001: 296).
It should also be borne in mind that the absolute magnitude of the trade flows documented by the Prussian balance of trade and the Amsterdam toll ledgers differ widely, even if it is acknowledged that the Prussian figures are probably inflated. In silver terms, Prussian exports in 1795/6 amount to 861 and Amsterdam’s imports from Germany c. 1790 to 51 tons of silver. Also recall the fact that in the case of the trade of the admiralty of Amsterdam with the German hinterland imports amounted to merely one sixth of exports. This suggests that a major and possibly increasing proportion of German exports to the Netherlands did not reach Amsterdam or escaped assessment by its toll authorities.
200
Ulrich Pfister
Despite these shortcomings and caveats Table 3 holds interesting information concerning the export structure of northwestern Germany, which emerged as a major early industrial region during the first half of the nineteenth century. The relative weights of iron goods and textiles are reversed compared to Prussia’s export structure. Even if Prussian figures possibly underestimate exports of iron goods this reflects both the regional structure of industry in north-western Germany and presumable patterns of import demand in Holland, which possessed more proximate sources of linen goods. Notable is the confirmation of the early role of cottons in German exports; their share is the fourth highest after linen and flax yarn, semi-finished and finished iron goods, and wood. Wood does not turn up in Prussian exports but seems to have constituted an important element of German export trade during the pre-industrial era. In particular, the Rhine and its tributaries formed an important basis for provisioning the Netherlands with timber. However, wood imports from Germany recorded in the toll ledgers of the admiralty of Amsterdam consist mainly of semifinished goods such as planks, rods and masts as well as simple finished goods, notably vats. Rafts arriving by river amounted to only 0.1 per cent of total import value in 1789-1791. Wood rafting ended in Dordrecht rather than Amsterdam, however, and in 1789-1791 wood having descended the Rhine that was auctioned in Dordrecht valued 311 thousands guilders on average. Actual import values may have amounted to the double of this figure, which is of an order of magnitude of ten per cent of the total value of Amsterdam’s recorded imports from Germany (Ebeling, 1992: 79-93, value of annual wood exports calculated on basis of the data given on pages 206-26). The case of wood exports thus constitutes a good example of the way in which the Amsterdam ledgers misrepresent trade between Germany and the Netherlands. It is not easy to go beyond establishing export patterns prevailing at the end of the eighteenth century by identifying trends concerning both aggregate exports and exports of major commodity groups. For this reason, the next section focuses on individual commodities. Starting from the information presented in Tables 2 and 3 some indications can be given nevertheless. Imports of Amsterdam from Germany around 1790 can be compared with
The quantitative development of Germany’s international trade
import patterns in 1753 (van Nierop, 1915). As already mentioned above, the value of recorded imports virtually stagnated between 1753 and c. 1790 (5.0 and 5.3 million guilders, respectively). Since we do not possess a price index of Amsterdam’s imports it is impossible to determine whether real exports of Germany to Amsterdam stagnated as well, but given known price indices (Table 1 above) it is safe to conclude that growth of this trade was small at best. On the level of individual commodities two experiences stand out: The value of cotton goods increased more than threefold from 1753 to 1789-1791, implying an annual growth rate of 3.5 per cent. However, cottons substituted linen; the value of the two products combined was slightly lower in the latter compared to the former year. Second, in terms of weight imports of iron rods, sheet and nails increased at the equivalent of 1.8 per cent p. a. To a major part this was compensated by a decline of imports of copper, however. Finally, exports of wood via the Rhine to Dordrecht, after having followed a rising trend over much of the eighteenth century, fell off drastically from the second half of the 1780s so that their level was rather lower around 1790 than during the first half of the 1750s (van Prooije, 1990: 59; Ebeling, 1992: 84-5). The Prussian balance of trade of 1795/6 can be held against a contemporary compilation of figures from Fabrikentabellen relating to exports of major categories of manufactures in 1781 (Behre, 1905: 356). Whereas export values changed little in the cases of silk and iron goods (-1.2 and 4.9 per cent, respectively), those of linen grew by 83 per cent, exports of cloth and worsteds more than doubled (122.3 per cent), whereas those of cotton goods rose fivefold (544.3 per cent). These figures are certainly influenced by wartime inflation; the price of linens quoted in Hamburg increased by 23.6 per cent between the two years. But even when allowance is made for inflation and the uncertainty stemming from possible changes of coverage over the two sources it appears possible that Prussia’s manufacture sector experienced a boom during the first phase of the French Revolutionary Wars. The considerable weight of textiles and semi-finished goods made from iron, wood and plant fibres in German exports during the late eighteenth century stands in stark contrast to the commodity structure established by Kutz for c. 1830 (Kutz, 1974: 366): At that time, 69 per cent of German exports consisted of agri-
201
202
Ulrich Pfister
cultural goods and raw materials supplied primarily to Great Britain, 9 per cent were re-exports of colonial groceries and only 22 per cent were made up of manufactures. The British industrial revolution and the differential economic growth it engendered seem to have converted Germany’s position in the international economy from a supplier of semi-finished industrial inputs and relatively simple, standardized manufactures to a provider of primary commodities.
7. Exports of individual commodities The previous section has identified linen, woollens and worsteds, cotton goods, semi-finished and finished iron goods, metals (most notably copper and lead), wood and goods made from woods as well as primary foodstuffs, notably grain, as the most import categories of exports at the end of the eighteenth century. What follows complements this general picture by short case studies on exports of important individual commodities on the regional level. These goods concern linen exports of Silesia and eastern Westphalia, worsted exports from western Württemberg and grain exports across the North Sea and the Baltic. The focus is on establishing growth rates over several decades in view of two issues. First, it will be determined whether the trajectory of exports of major commodities is consistent with the growth rate of imports, that is, about 1 per cent p. a. or slightly less. If this is the case, exports grew probably faster than national income, implying an increase in openness and a growth in specialization. Second, attention will be paid to differential growth rates of exports among commodities in order to get an idea of the nature and pattern of international labour division the German economy was part of. In particular, if manufacture exports grew more rapidly than exports of primary foodstuffs trade growth can be considered as a means to alleviate the effects of declining labour productivity in agriculture by an expansion of non-agricultural sectors producing tradables. 7.1. Linen Linen constituted an important export commodity far beyond Prussia and the non-Prussian parts of north-western Germany prior to industrialization. A list of manufacture exports of Württemberg
203
The quantitative development of Germany’s international trade
drawn up in 1795 places linen on top with 41.4 per cent of total manufacture exports (Krauter, 1951: 231-5). Qualitative evidence suggests that linen manufacture constituted the most important export industry in other parts of Germany as well, including Saxony and Swabia (Kaufhold, 1986: 124-5, 136-7, 143-6, 154, 1616, 169-75). Thus, information concerning of linen exports can to some extent serve as a proxy for the evolution of manufacture exports in general. What follows employs material for Silesia and Westphalia to establish the evolution of linen exports over the eighteenth century. Figure 6. Real exports of linen, 1748-1787, and number of weaving looms in Silesia, 1748-1795 200
35
180
30
160 25
140 120
20
100 15
80 60
10
40 5
20 0 1745
1750
1755
1760
1765
1770
1775
1780
1785
1790
0 1795
Real exports of linen, deflator: linen of Engelsberg in Hamburg (1748=100) Real exports of linen, deflator: synthetic price of linens in Hamburg (1748=100) Number of weaving looms (in thousands; right scale) Notes: Zimmermann gives export values in Taler. Exponential trend of export value 0.9 per cent (R2=0.13), of exports deflated by price of Engelsberg linen in Hamburg 1.2 per cent (R2=0.14), of exports deflated by synthetic linen price in Hamburg 0.4 per cent (R2=0.03), and of the number of weaving looms 0.8 per cent (R2=0.77). Sources: Zimmermann (1885: 458, 460-7); price deflators: own calculation on the basis of Commerzbibliothek Hamburg S/49 (Hamburg price current), cf. Pfister (2012: 63-4).
On this background Figure 6 also considers the number of weaving looms used in commercial linen production in the province. Since the overwhelming part of commercial linen production was exported the number of weaving looms can serve as a proxy for export quantities. The eight censuses conducted between
204
Ulrich Pfister
1748 and 1795 follow a trend of 0.8 per cent p. a. The contrast between this figure and export values deflated by Engelsberg linen suggests that over the period under study linen types suffering from a falling relative price were substituted by the manufacture of goods offering higher prices. The growth rate of 0.8 per cent p. a. is the one retained for the subsequent discussion. Figure 7. Purchases of linen in Westphalian linen markets, 1740s to 1795 Thousands of meters
1600 1400
Osnabrück Bielefeld Tecklenburg
1200 1000 800 600 400 200 0 1740
1745
1750
1755
1760
1765
1770
1775
1780
1785
1790
1795
Notes: Meter conversion for Osnabrück is based on average length in 1806-1815, for the other two series on length of ell in Bielefeld (0.58652 meters; Verdenhalven, 1993: 16). Exponential trend of purchases in Osnabrück 1.8 per cent (R2=0.44), in Bielefeld 0.0 per cent (R2=0.00), in Tecklenburg 1.6 per cent (R2=0.81). Sources: Flügel (1993: 281-3); Schlumbohm (1994: 634-6); Küpker (2008: 464-5).
Figure 7 uses the number of pieces recorded in the ledgers of three important linen markets to track the evolution of linen exports from eastern Westphalia. Since linen markets mediated between commercial linen producers and export merchants transaction volumes can serve as proxies of real exports. To render the series roughly comparable information on the length of pieces was used to convert all figures into meters. The picture emerging from the resulting graphs and their trend growth rates (see notes to Figure 7) is again far from uniform: Over the whole period the transaction volume of the Bielefeld market moves flat. In addition, there is a long slump between the onset of the Seven Years’ War in 1756 and 1780. To a weaker extent, a similar trajectory occurred in Tecklenburg where the transaction volume recorded in 1756 was
The quantitative development of Germany’s international trade
surpassed only in 1776, and it is also visible in the number of weaving looms in Silesia between 1755 and 1780 (Figure 6 above). Note that the timing of this slump is similar to the temporary stagnation of real imports in Hamburg (see above, Figure 4). Nevertheless, over the whole period 1747-1794 the number of pieces purchased in Tecklenburg expanded at an annual rate of 1.6 per cent. Given the trajectory of transaction volumes in Bielefeld and Tecklenburg it is difficult to interpret the graph for Osnabrück, which starts only during the recovery phase of the slump c. 17551780. If export production in this region prior to the 1770s followed a trajectory comparable to the one of the Bielefeld market then the estimated trend growth rate of 1.8 per cent is certainly too high. Information from the Hamburg price current, which listed linen prices from all three Westphalian markets studied here, can be used to estimate export values and to derive a projection of aggregate growth of linen exports from these major linen producing regions. In 1779-1783, which serves as a period of reference, the respective share of the three Westphalian markets in the region’s total known linen exports was 47 per cent for Osnabrück, 33 per cent for Bielefeld and 20 per cent for Tecklenburg. The weighted growth rate of transaction volumes is 1.2 per cent. Given the caveats concerning the Osnabrück series this certainly constitutes an upper bound of the pace of the growth of linen exports from eastern Westphalia between the 1740s and the 1790s. If estimated export values from Westphalian markets are combined with figures for Silesia the weights are nine per cent and 91 per cent, respectively (with 1779-1783 again serving as reference years). According to the synthesis of manufacture exports of Prussia in 1781 the share of Silesia in total linen exports amounted to 86 per cent and the one of the territories in eastern Westphalia to 9 per cent (Behre, 1905: 346). This looks fairly consistent with the information used in the present analysis, but it should be borne in mind, on the one hand, that the Prussian ledger does not include Osnabrück (which constituted an independent prince-bishopric). On the other hand, this study does not cover all relevant markets in the Prussian territories of eastern Westphalia (i. e., Herford). Nevertheless, the overwhelming weight of Silesia in known linen exports implies that this province largely determines any estimate of export growth: If the growth rate of the number of weaving looms is
205
206
Ulrich Pfister
accepted as the most likely figure for real growth of Silesian linen exports, total growth of linen exports remains 0.8 per cent p. a. independently from whether the growth rate for Westphalia (1.2 per cent) is weighted with 9 per cent or 20 per cent. The bottom line of this analysis is that the most likely growth rate of real exports of German linen, at least of producer regions from the northern half of the country, was about 0.8 per cent or slightly less than one per cent p. a. between the 1740s and the 1790s. This figure is remarkably similar to the earlier finding concerning the evolution of aggregate imports, which underscores its credibility. The fact that one major export-oriented manufacture sector grew faster than both population and income per capita also implies the presence both of international specialization and of a structural shift from the production of subsistence goods to the production of traded goods. To the extent that it occurred through the mobilization of underutilized labour during the slack seasons of the agricultural year the present findings also point to the operation of an industrious revolution. 7.2. Worsteds from Calw As the Prussian export structure in 1795 showed, woollens and worsteds can be considered as the second most important type of traded textiles in eighteenth century Germany after linen. The classic study of Troeltsch (1897) on the monopoly trading company in worsteds of Calw provides a glimpse of the export dynamic of this sector. While exports of woollens and worsteds valued less than those of linens in Württemberg’s manufacture exports in 1795 (Krauter, 1951: 231-2) information concerning the activity of the company of Calw constitutes one of the few pieces of systematic evidence on the evolution of cross-border trade in south-western Germany. An investigation of worsteds exports from the region of Calw thus provides an important complement to the analysis of linen exports from regions situated in the northern half of Germany. The worsted trading company possessed the monopoly to purchase and market worsteds in an important section of the Black Forest in western Württemberg (for a modern study of the industry, see Ogilvie, 1997). Many workers resented this monopoly because it depressed their revenue. Interloping was always a
207
The quantitative development of Germany’s international trade
problem, therefore, and the (probably not too unrealistic) assumption underlying the following discussion is that production and sales abroad circumventing the company did not grow faster than the market segment controlled by the company. Between the 1710s and the 1770s domestic sales were usually below five per cent of total company sales; fully 50 to 70 per cent of revenues were generated through the fairs of Bolzano, an important point of entry to the Italian market. Visits to the fairs of Frankfurt and Zurzach – still a relevant gateway to the Swiss market – provided a further ten per cent of revenues. Finally, about a quarter of all sales were conducted with agents or individual clients (Troeltsch, 1897: 181-2, 185, 188). The high proportion of sales generated through fairs characterizes the business practices of the company as rather old-fashioned. Figure 8. Activity of the worsted trading company of Calw, 1680-1778 Sales value and number of worsted cloths purchased
60
500
50
Thousands of Gulden
400 350
40
300 30
250 200
20
150 100
Thousands of pieces
450
Value of sales (left axis) Number of pieces of worsteds purchased (right axis)
10
50 0 1680
1690
1700
1710
1720
1730
1740
1750
1760
1770
0 1780
Notes: Recorded sales values in 1695-1700 were augmented by 25 per cent to compensate for underregistration (Troeltsch, 1897: 180). Exponential trend of sales value from 1711 0.7 per cent (R2=0.54), of pieces of worsteds purchased 0.8 per cent (R2=0.70). Source: Troeltsch (1897: 157-8, 175, 179-80, 185, 187).
Troeltsch gives numbers of pieces purchased by the company from weavers as well as purchase and sales values for various years between 1680 (rough estimate) and 1778. Figure 8 shows the first and the third variable. From 1711 sales values increased with a trend growth rate of 0.7. The wars of Louis XIV, particularly the War of the League of Augsburg (1688-1697), when south-western
208
Ulrich Pfister
Germany was a theatre of war, depressed activity in Württemberg’s worsted sector: Values of sales were particularly low in 1695 and continued to be below average during the remainder of the decade. Part of the export growth visible in the early eighteenth century may have resulted from post-war reconstruction of production and market networks. The trend fitted on the sales values from 1711 underestimates the value in 1680 by about 12 per cent, which indicates that the true trend growth rate over the entire period 16801780 may have been a bit lower than 0.7 per cent. To be sure, growth was uneven across sub-periods. Reconstruction after the end of the wars of Louis XIV passed into sustained export growth until the Seven Years’ War; the growth rate of sales values in the five decades from 1711 to 1761 was 1.3 per cent, whereas a declining trend set in after 1761. The parallel fall of Italian GDP in the decade or so following 1762 (Malanima, 2011: 187) indicates that demand failure in a major export market may explain part of the trajectory of the worsted industry in Calw. There are no prices of worsteds that could serve as deflator for sales. Nevertheless, the ratio of purchase value to the number of pieces purchased stays essentially flat between 1711 and 1778, suggesting stability of prices. Furthermore, information concerning the number of pieces of worsteds purchased by the company from weavers, which covers fewer years than sales values but begins in 1705 already, shows a similar trajectory and almost the same long-term trend as the latter, namely, 0.8 per cent. Thus, the conclusions reached at the end of the preceding section concerning linen exports from major regions situated in the northern half of Germany can be generalized for a wider set of textile industries and regions. 7.3. Grain Section 6 ended with the conjecture that in c. 1790-1830 Germany must have experienced a shift of the commodity composition of its exports from semi-finished industrial goods and manufactures to raw materials. The final part of the analysis attempts to shed more light on the pattern and timing of this transition.
The quantitative development of Germany’s international trade
On the one hand, sketchy evidence suggests that textile exports found it difficult to recover from the dislocation suffered during the Napoleonic Wars. In 1815 almost half of the yarn processed by German cotton manufacturers was imported, and the degree of selfsufficiency declined further to a level between a quarter to a third during the 1820s and 1830s (Kirchhain, 1973: 29-30). Given that cotton goods partly substituted linen and since German producers were hesitant regarding the industrialization of linen manufacture this branch entered into decline. Suffice here to say that three Westphalian series underlying Figure 7 above show stagnant or lower levels of linen purchases by export merchants in the 1820s compared to the early 1790s; by 1819 the number of weaving looms in Silesia had fallen to the level prevailing in the 1770s. On the other hand, there is evidence of an increase in grain exports that reaches back into the second half of the eighteenth century. Although regional grain markets were highly fragmented before the age of railway construction it is safe to say that grain imports were of little importance during the eighteenth and early nineteenth century. The only notable exception appears to be Saxony, which imported grain from Bohemia. Quantitative evidence regarding the magnitude of this trade begins to come forward only in the second half of the 1830s, however (Kiesewetter, 2007: 257-60). Two regions are known to have specialized in grain exports. The principal one concerns the southern Baltic and adjacent areas on the shore of the North Sea (Holstein) that exported grain to the Netherlands and increasingly to Britain. Note that the regions east of Pomerania did not belong to the Holy Roman Empire and in their majority formed part of Poland until the divisions of this country in 1772-1795. The smaller grain exporting regions is located in the south and concerns fertile basins specializing in grain exports to nearby northern Switzerland. What follows discusses in turn evidence regarding the extent of export growth in these two regions. Since the rise of the urban economy in Holland at the beginning of the modern era the southern Baltic played an eminent role in provisioning the population of Dutch towns with grain. If Baltic grain trade stagnated after the middle of the seventeenth century it gained new momentum from the middle of the eighteenth century. To some extent this was due to the fact that industrializa-
209
210
Ulrich Pfister
tion and population growth turned Britain from an exporter to an importer of grain (von Tielhof, 2002: 40-66; Ormrod, 2003: 209217). In order to track the implications of this development for Germany’s external trade Figure 10 combines information on British wheat imports from Germany in 1800-1833, grain and wheat exports of Gdansk in 1751/1815-1850, Prussian wheat exports in 1822-1850 and grain exports of Hamburg until 1844. However, information for the latter is confined to decennial averages from 1753-1762 to 1823-1832. Grain exports of Gdansk reached sizeable quantities already by the 1760s, and there was little growth until the 1840s. In addition, however, Hamburg emerged as a major grain exporter after the Seven Years’ War, which implies that commercial production in the south-western Baltic increased – Hamburg handled mostly trade with grain from Mecklenburg and Holstein. If one disregards the fact that data for Hamburg concern ten year averages before 1833 and fits an exponential trend one obtains an annual growth rate of 1.2 per cent (with growth in the eighteenth century probably being stronger than over the whole period). This rate of increase exceeds the one observed earlier for manufacture exports. To be sure, export growth was uneven and characterized by strong fluctuations in the short run. In the long run the expansion of Hamburg’s grain exports took place in two waves. The first occurred during the last third of the eighteenth century. The Napoleonic Wars and the Corn Laws enacted in 1815 led to a temporary slump in German exports, but strong demand in Britain and gradual liberalization led to renewed export growth from the second half of the 18120s onwards. Harvest failures such as those in 1817, 1830 and 1840 were associated with short-run peaks in German grain exports. This suggests a role for demand failure in international grain trade (Sen, 1981): The growth of non-agricultural income relative to non-agricultural incomes on the continent in the wake of the British industrial revolution meant that during a food crisis British consumers were capable to exert an international demand for foodstuffs so that grain exports elsewhere increased despite meagre harvests. Demand for grain exports from south-western Germany was strongly influenced by developments in northern Switzerland. The hilly parts of this area were not self-sufficient in grain at least peri-
211
The quantitative development of Germany’s international trade
odically already by the Late Middle Ages, and proto-industrial development during the early modern period rendered these regions structurally dependent on grain imports from fertile areas situated to the north of the Rhine. Partly since these export regions were not contiguous, trade was highly fragmented, but the small port of Überlingen situated on Lake Constance seems to have handled a major part of Swabian grain exports to north-eastern Switzerland. By the eighteenth century the transaction volume of its market appears to have been on par with major other major grain markets between the Vosges and Bavaria, namely, Strasbourg and Ulm (Göttmann, 1991: 231-235; Brandenberger, 2004: 182-310). Figure 9. Grain exports of northern Germany, 1753-1850 Thousands of metric tons
250
200
150
100
50
0 1750
1760
1770
1780
1790
1800
1810
1820
1830
Gdansk, wheat Gdansk, all types of grain (decennial averages) Hamburg, all types of grain (decennial averages until 1823-1832) Hamburg, wheat (decennial averages until 1823-1832) British wheat imports from Germany
1840
1850
Prussia, wheat
Notes: English prices given by Kutz assumed to refer to quarters; specific weight of both wheat and grain in general assumed to be 0.66. Sources: Soetbeer (1846: 162); Kutz (1974: 276, 287-288); Bass (1991: 320); van Tielhof (2002: 63); wheat price in London 1827-1833 and British conversion ratios from Allen (2001); conversion ratios for Germany from Verdenhalven (1993).
Sales of grain in Überlingen were undertaken in view of exports across Lake Constance, so that the transaction volume can be interpreted as a proxy of exports. Figure 10 shows the transaction volume of two groups of grain types. The first comprises so-called heavy grains, that is, mostly spelt (the principal grain in south-
212
Ulrich Pfister
western Germany) and rye, in metric tons. What follows focuses on this group, because trade with the second group – so-called light grains, consisting of unhusked spelt, barley and oats – was of smaller importance and shows no trend. Since contemporaries measured grain by volume, not by weight, the conversion to modern weight units must make speculative assumptions about the specific weight of traded grain in those days. Assuming a uniform specific weight across different types of grain, as in Figures 9 and 10, at least preserves volume relatives between contemporary figures. Figure 10. Volume of grain sales in the market of Überlingen, 1674-1811 Thousands of metric tons
8 Husked spelt, rye, peas and beans 7
Unhusked spelt, barley and oats
6 5 4 3 2 1 0 1660
1680
1700
1720
1740
1760
1780
1800
Note: Data refer to crop years starting in August. Density is assumed to be 0.66. Exponential trend of turnover of husked spelt, rye spelt peas and beans is 0.8 per cent (R2=0.23), after removal of minima in 1693, 1730 and 1770/ 1 0.7 per cent (R2=0.47); for the sub-period 1750-1791 (1770/71 removed) the exponential trend is also 0.7 per cent (R2=0.19). Transaction volume of unhusked spelt, barley and oats is trendless (slope of exponential trend 0.1 per cent p. a., R2=0.00). Source: Göttmann (1991: 422-5, 485).
Even if grain exports in southern Germany were probably less concentrated on major markets grain their volume remained much smaller than the one of grain trade across the Baltic and the North Sea. British wheat imports from Germany around 1800 exceeded the turnover of Überlingen by a factor of more than 20, and already by 1763-1772 Hamburg handled grain exports that were four times larger than those flowing through Überlingen. Depending on the specification chosen the transaction volume of spelt, rye and legumes at the market of Überlingen increased at
The quantitative development of Germany’s international trade
an annual rate of 0.7 to 0.8 per cent over longer periods between the late seventeenth century and c. 1800 (see note to Figure 10). The conclusion that emerges is that grain exports grew faster than population and not slower than exports of linen from northern Germany and worsteds from Calw. Taken together, the findings concerning the evolution of grain exports from northern and southern Germany suggest that specialization on non-agricultural products failed to develop over the eighteenth and early nineteenth centuries, despite a notable decline of the employment share of agriculture (Pfister 2011: 5). During the second half of the eighteenth century the commodity composition of exports probably remained roughly stable with respect to major categories of products and seems to have shifted towards raw materials in the early nineteenth century. Population growth was not only associated with an expansion of the non-agricultural sectors of the economy but also contributed to an intensification of arable farming whose output was increasingly used to feed the growing non-agricultural populations in other countries experiencing faster industrialization and growth of nonagricultural income.
8. Conclusion Three findings emerge from this study. First, international trade of Germany expanded at an annual rate of 1 per cent or slightly less in real terms between the 1730s and the early 1790s. This rate appears modest but is nevertheless remarkable. Per capita income probably remained more or less stable during this period so that aggregate income moved in parallel with population. Population in turn expanded at an annual rate of about a half per cent. The fact that international trade grew faster, albeit by a modest margin, than national income implies an increase in openness. This process unfolded over more than half a century before Germany’s transition to sustained growth around 1820 Pfister et al. (2012), which provides strong support for the idea that Smithian growth constitutes an important precondition for modern economic growth by shifting factors to more efficient use, by rendering it possible to move along learning curves and by creating scale effects with respect to the application of technological innovations.
213
214
Ulrich Pfister
Second, the movement of principal categories of merchandise informs us about the nature of the gradual increase in openness. Simple manufactures and semi-finished industrial goods dominated Germany’s exports at the end of the eighteenth century. Linen came first, followed by woollens and worsteds, cottons and iron goods. The rapid increase of the weight of cotton goods in Germany’s exports over the final decades of the eighteenth century, which partly compensated for the relatively modest growth of linen exports, sheds new light on the early development of a future industrial leading sector that calls for in-depth research. Growth of manufacture exports should be considered in the context of the parallel fall of day wages of unskilled urban labourers (Pfister, 2014): Expansion of the production of tradables by means of an increasing work effort per capita – which includes work during the slack seasons of the agricultural year as well as the mobilisation of the labour capacity of women and children – constituted a means to compensate for the effect of a rapidly falling marginal product of labour in the sectors producing nontradables on material welfare. Export growth of manufactures thus resolves the contradiction between falling day wages and stagnant per capita income. On the import side the period between the 1730s and the 1790s saw a rapid shift of the commodity composition of trade towards colonial goods, mostly sugar and coffee. Growth of these imports approached an annual rate of 2 per cent in real terms, which roughly corresponds to the long-term rate of increase of crossAtlantic trade during the early modern period. Even if it had no direct access to colonies in the Western Hemisphere before American Independence Germany was intimately linked to the eighteenth-century boom of the Atlantic economy. The strong increase of imports of colonial goods was partly compensated, on the one hand, by a fall of imports of manufactures, in particular of cottons, at least until c. 1780. Since imports of inputs required for cotton manufacture expanded, the decline of manufacture imports was essentially due to import substitution through an increase of the labour effort outside agriculture, which also underlay export growth of manufactures. On the other hand, rising imports of colonial goods partly substituted for declining imports of wine and Mediterranean groceries such as currants and raisins whose price
The quantitative development of Germany’s international trade
rose relative to both non-tradables and colonial goods. To some extent the shift of consumer demand to colonial goods followed changes in relative prices. How do these shifts in the commodity composition of trade relate to the Industrious Revolution and Divergences theses evoked in the introduction to this study? The inference that an expanded production of manufactures for export compensated for a declining day wage of unskilled labourers certainly involves an increase of the work effort per capita. In the strict sense of the term, however, the Industrious Revolution refers to a shift of household preferences implying the readiness to increase the work effort at a given wage. It is problematic to stretch the results of this study beyond the statement that the expansion of the work effort in sectors producing tradables contributed to a compensation of the negative welfare effects of a falling marginal product of labour in the non-tradables sector. In other words, people worked more to cope with need, rather than to increase consumption. A similar statement can be made with respect to the interpretation of import growth with respect to colonial goods, most importantly coffee. Among the small affluent segment of society the consumption of coffee (and tea), in combination with the purchase of porcelain and earthenware, certainly constituted part of an emerging consumer culture. Among the working class, however, coffee constituted a workplace drug that made it easier to endure long hours of monotonous work demanding little physical force but considerable concentration with meagre caloric intake. Thus, import growth of colonial groceries was fuelled by the emergence of an industrial working class diet, which in turn reflects the rising trend of manufacture exports. The prominence of commodities originating in the western hemisphere in eighteenth-century German imports points to the possible role of American resources for European economic growth stressed by the Great Divergence thesis. Support for this thesis is limited to Mediterranean groceries and beverages, which were consumed by the affluent segments of German society rather than the population at large. The relative prices of these goods rose, and cross-price elasticities of demand suggest that Mediterranean and colonial goods tended to be substitutes. As prices of colonial goods rose relative to the domestic price level it is difficult to argue that
215
216
Ulrich Pfister
rising imports of the former relieved land scarcity in Germany proper. In addition, absolute import quantities of sugar and rice were too small to make a relevant contribution to everyday diet in caloric terms. Only to the extent that coffee originating in the Antilles was an important element in the diet of the emerging industrial lower classes do American resources matter in German economic development. The third and final conclusion refers to the commodity composition of exports and the evolution of trade in general during the early part of the nineteenth century. Whereas manufactures dominated exports around 1790 primary commodities were relevant as well. Moreover it does not appear that exports of manufactures grew faster than those of grain and wood during the preceding half-century. In other words, specialization between sectors did not increase, at least during the latter part of the eighteenth century. This also implies that the capacity of export-oriented manufacture production to absorb population growth was limited. The declining land-labour ratio also contributed to an intensification of arable farming, which in turn led to an expansion of commercial grain production. Foodstuff exports went to Great Britain and to a much smaller extent to Switzerland. These were countries with relatively faster growth of industry and non-agricultural incomes compared to Germany. The unfolding of the British industrial revolution exacerbated the effect of differential industrial growth between Germany and her trading partners on export structure in the four decades c. 1790-1830. External trade probably did not grow faster during this period than during the half-century before, and openness seems to have increased slower. This appears to have been the consequence of a decline of manufacture exports in the face of British competition. By 1830 primary commodities dominated German exports. Moreover, short-term fluctuations of grain exports followed harvest failures, with grain exports from German lands peaking in times of harvest failures. This suggests a considerable importance of demand failure in explaining the time pattern of grain exports: British consumers disposing of non-agricultural incomes found it easier to demand basic foodstuffs than rural households in the agrarian parts of the continent. Thus, grain trade may have worsened suffering in export-oriented agrarian regions during harvest
The quantitative development of Germany’s international trade
failures. The adverse conditions prevailing on international markets for manufactures and the limited gains resulting from foodstuff exports underscore the importance of internal market creation epitomized by the formation of the Zollverein in 1834 for German economic development during the first half of the nineteenth century.
References Albrecht, P., (2000), “Wieviel Kaffee tranken die Hannoveraner zwischen 1750 und 1850 denn nun wirklich?”, In Studien zur Gewerbe- und Handelsgeschichte der vorindustriellen Zeit 22, K. H. Kaufhold and M. A. Denzel (eds.). Steiner. 139–179. Allen, R. C., (2001), “The great divergence in European wages and prices from the Middle Ages to the First World War”, Explorations in Economic History 38(4): 411–447. Bass, H.-H., (1991), Hungerkrisen in Preußen während der ersten Hälfte des 19. Jahrhunderts. St. Katharinen. Baasch, E., (1910a), Quellen zur Geschichte von Hamburgs Handel und Schifffahrt im 17., 18. und 19. Jahrhundert. Hamburg. Baasch, E., (1910b), “Hamburg und Holland im 17. und 18. Jahrhundert”, Hansische Geschichtsblätter 16: 45–102. Behre, O., (1905), Geschichte der Statistik in Brandenburg-Preußen. Berlin. Reprint, Vaduz 1979. Brandenberger, A., (2004), Ausbruch aus der “Malthusianischen Falle”: Versorgungslage und Wirtschaftsentwicklung im Staate Bern 1755– 1797. Bern. Broadberry, S. and B. Gupta, (2006), “The early modern great divergence: wages, prices and economic development in Europe and Asia, 1500– 1800”, Economic History Review 59: 1–31. Charles, L. and G. Daudin, (2011), “La collecte du chiffre au XVIIIe siècle: le Bureau de la balance du commerce et la production des données sur le commerce extérieur de la France”, Revue d’histoire moderne et contemporaine 58(1): 128–155. Crafts, N. F. R., (2011), “Explaining the first Industrial Revolution: two views”, European Review of Economic History 15: 153–168. Denzel, M. A., (1998), Professionen und Professionisten: die Dachsbergsche Volksbeschreibung im Kurfürstentum Bayern, (1771– 1781), Vierteljahrschrift für Sozial- und Wirtschaftsgeschichte, Suppl. 139. Stuttgart.
217
218
Ulrich Pfister
Ebeling, D., (1992), Der Holländerholzhandel in den Rheinlanden: zu den Handelsbeziehungen zwischen den Niederlanden und dem westlichen Deutschland im 17. und 18. Jahrhundert. Stuttgart. Engel, A., (2009), Farben der Globalisierung: die Entstehung moderner Märkte für Farbstoffe 1500–1900. Frankfurt a. M. Feldenkirchen, W. P., 1975. Der Handel der Stadt Köln im 18. Jahrhundert (1700–1814), PhD dissertation. University of Bonn. Fertig, G. and U. Pfister, (2010), “The population history of Germany: research agenda and preliminary results”, MPIDR Working Paper WP 2010-035. Flügel, A., (1993), Kaufleute und Manufakturen in Bielefeld: sozialer Wandel und wirtschaftliche Entwicklung im proto-industriellen Leinengewerbe von 1680 bis 1850. Bielefeld. Gerhard, H.-J. and K. H. Kaufhold, 2001. Preise im vor- und frühindustriellen Deutschland. Stuttgart. Göttmann, F., (1991), Getreidemarkt am Bodensee: Raum — Wirtschaft — Politik — Gesellschaft (1650–1810). St. Katharinen. Heeres, W. G., (1988), “Annual values of Amsterdam’s overseas imports and exports, 1697 to 1798”, In From Dunkirk to Danzig: shipping and trade in the North Sea and the Baltic, 1350–1850, Heeres W. G. et al. (eds.). Verloren. 263–279. Jeannin, P., (1971), “Die Hansestädte im europäischen Handel des 18. Jahrhunderts”, Hansische Geschichtsblätter 89: 41–73. Kappelhoff, B. und C. Deggim, (2011), Archivalische Quellen zum Seeverkehr und den damit zusammenhängenden Waren- und Kulturströmen an der deutschen Nordseeküste vom 16. bis zum 19. Jahrhundert: ein sachthematisches Inventar, Teil 1: Archive im Elbe-Weser-Raum und in Bremen. Veröffentlichungen der Niedersächsischen Archivverwaltung 63. Göttingen. Kaufhold, K. H., (1978), Das Gewerbe in Preußen um 1800. Göttingen. Kaufhold, K. H., (1986), “Gewerbelandschaften in der frühen Neuzeit (1650–1800)”, In Gewerbe- und Industrielandschaften vom Spätmittelalter bis ins 20. Jahrhundert, H. Pohl (ed.). Steiner. 112–202. Kellenbenz, H., (1964), “Der deutsche Außenhandel gegen Ende des 18. Jahrhunderts”, In Die wirtschaftliche Situation in Deutschland und Österreich um die Wende vom 18. zum 19. Jahrhundert, F. Lütge (ed.). Fischer. 4–60. Kelly, M., (1997), “The dynamics of Smithian growth”, Quarterly Journal of Economics 112, 3: 939–964. Kiesewetter, H., (2007), Die Industrialisierung Sachsens: ein regionalvergleichendes Erklärungsmodell. Stuttgart.
The quantitative development of Germany’s international trade
Kirchhain, G., (1973), Das Wachstum der deutschen Baumwollindustrie im 19. Jahrhundert: eine historische Modellstudie zur empirischen Wachstumsforschung. PhD dissertation. University of Münster. Reprint, New York 1977. Krauter, G., (1951), Die Manufakturen im Herzogtum Wirtemberg und ihre Förderung durch die wirtembergische Regierung in der 2. Hälfte des 18. Jahrhunderts. Unpublished PhD dissertation. University of Tübingen. Krawehl, O.-E., (1991), “Quellen zur Hamburger Handelsstatistik im 18. Jahrhundert”, In Grundlagen der Historischen Statistik von Deutschland: Quellen, Methoden, Forschungsziele, W. Fischer and A. Kunz (eds.). Westdeutscher Verlag. 47–69. Kresse, W., (1966), Materialien zur Entwicklungsgeschichte der Hamburger Handelsflotte, 1765–1823. Hamburg. Küpker, M., (2008), Weber, Hausierer, Hollandgänger — demografischer und wirtschaftlicher Wandel im ländlichen Raum: das Tecklenburger Land 1750–1870. Frankfurt. Kutz, M., (1974), Deutschlands Außenhandel von der Französischen Revolution bis zur Gründung des Zollvereins. Vierteljahrschrift für Sozial- und Wirtschaftsgeschichte, Suppl. 61. Wiesbaden. Lee, W. R., (1977), Population growth, economic development and social change in Bavaria, 1750–1850. New York. Lemire, B., (1991), Fashion’s favourite: the cotton trade and the consumer in Britain, 1660–1800. Oxford. Malanima, P., (2011), “The long decline of a leading economy: GDP in central and northern Italy”, European Review of Economic History 15: 169–219. Metz, R., (1990), Geld, Währung und Preisentwicklung: der Niederrheinraum im europäischen Vergleich, 1350–1800. Frankfurt. van Nierop, L., (1915-1917), “Uit de bakermat der amsterdamsche handelsstatistiek”, Jaarboek van het genootschap Amstelodamum 13: 104– 172 and 15: 35–110. North, M., (1996), “Hamburg: ‘The continent’s most English city’.” In From the North Sea to the Baltic, M. North (ed.). Variorum. ch. VI. Obal, U., (2000), “Zollregister als Quelle einer Handelsstatistik des Kurfürstentums/Königreichs Hannover”, In Der Handel im Kurfürstentum / Königreich Hannover (1780–1850), K. H. Kaufhold and M. A. Denzel (eds.). Steiner. 139–179. Ogilvie, S., (1997), State corporatism and proto-industry: the Württemberg Black Forest, 1580–1797. Cambridge. Pfister, U., Economic growth in Germany, 1500–1850, Unpublished contribution to the Quantifying long run economic development conference. University of Warwick. Venice, 22–24 March 2011. http://
219
220
Ulrich Pfister
www.wiwi.uni-muenster.de/wisoge/organisation/personen/pfister/ forschung/Growth-Venice-2011.pdf. Pfister, U., (2012), Great divergence, consumer revolution and the reorganization of textile markets: evidence from Hamburg’s import trade, eighteenth century, Unpublished manuscript. http://www.wiwi.uni-muenster.de/ wisoge/organisation/personen/pfister/forschung/Hamburg-trade2012-06.pdf. Pfister, U., (2014), The timing and pattern of real wage divergence in pre-industrial Europe: evidence from Germany, c. 1500–1850, Unpublished manuscript. Pfister, U., J. Riedel and Martin Uebele, (2012), “Real wages and the origins of modern economic growth in Germany, 16th to 19th centuries,” EHES Working Paper 17, 2012-4. Pomeranz, K., 2000. The Great Divergence: China, Europe, and the making of the modern world economy. Princeton. Posthumus, N. W., (1946–1964), Inquiry into the history of prices in Holland, 2 vols. Leiden. van Prooije, L., (1990), “De invoer van Rijns hout per vlot 1650–1795”, Economisch- en Sociaal-Historisch Jaarboek 53: 30–79. Rössner, P. R., (2008), Scottish trade with German ports 1700–1770: a sketch of the North Sea trades and the Atlantic economy on ground level. Stuttgart. Schlumbohm, J., (1994), Lebensläufe, Familien, Höfe: Die Bauern und Heuerleute des osnabrückischen Kirchspiels Belm in proto-industrieller Zeit, 1650–1860. Veröffentlichungen des Max-Planck-Instituts für Geschichte 110. Göttingen. Schneider, J., O.-E. Krawehl und M. A. Denzel (eds.), (2001), Statistik des Hamburger seewärtigen Einfuhrhandels im 18. Jahrhundert nach den Admiralitäts- und Convoygeld-Einnahmebüchern. Quellen und Forschungen zur Historischen Statistik von Deutschland 20. St. Katharinen. Schremmer, E., (1966), “Bemerkungen zur Zahlungsbilanz Bayerns in der zweiten Hälfte des 18. Jahrhunderts (Manufakturperiode)”, In Wirtschaft, Geschichte und Wirtschaftsgeschichte: Festschrift zum 65. Geburtstag von Friedrich Lütge, W. Abel et al. (eds.). Fischer. 227–265. Sen, A., (1981), Poverty and famines: an essay on entitlement and deprivation. Oxford. Soetbeer, A., (1846), Über Hamburgs Handel, vol. 3. Hamburg. van Tielhof, M., (2002), The “mother of all trades”: the Baltic grain trade in Amsterdam from the late 16th to the early 19th century. Leiden. Troeltsch, W., (1897), Die Calwer Zeughandlungskompagnie und ihre Arbeiter; Studien zur Gewerbe- und Sozialgeschichte Altwürttembergs. Jena. Verdenhalven, F., (1993), Alte Meß- und Währungssysteme aus dem deutschen Sprachgebiet. Neustadt a. d. Aisch.
The quantitative development of Germany’s international trade
Vogel, W., (1928-1932), “Beiträge zur Statistik der deutschen Seeschifffahrt im 17. und 18. Jahrhundert.” Hansische Geschichtsblätter 33: 110–154 and 37: 78–151. de Vries, J., (2008), The Industrious Revolution: consumer behavior and the household economy, 1650 to the present. Cambridge. de Vries, J., (2010), “The limits of globalization in the early modern world”, Economic History Review, 2nd ser. 63(3): 710–733. de Vries, J., (1965), “De problematiek der Duits-Nederlandse economische betrekkingen in de negentiende eeuw”, Tijdschrift voor Geschiedenis 78: 23–48. Walter, R., (1990), Die Kommerzialisierung von Landwirtschaft und Gewerbe in Württemberg (1750–1850). St. Katharinen. Weber, K., (2000), “Die Admiralitätszoll- und Convoygeld-Einnahmebücher: eine wichtige Quelle für Hamburgs Wirtschaftsgeschichte im 18. Jahrhundert”, Hamburger Wirtschafts-Chronik, new ser. 1: 83–112; French version (1999): « Les livres douaniers de l’amirauté de Hambourg au XVIIIe siècle: une source de grande valeur encore inexploitée », Bulletin du Centre d’histoire des Espaces atlantiques 9: 93–126. Weber, K., (2004), Deutsche Kaufleute im Atlantikhandel 1680-1830: Unternehmen und Familien in Hamburg, Cádiz und Bordeaux. München. Weber, E. M., (2005), Untiefen, Flut und Flauten: der Güterverkehr auf dem Rhein zwischen 1750 und 1850; die Modernisierung der vorindustriellen Rheinschifffahrt aus einer wirtschafts-, sozial- und umweltgeschichtlichen Perspektive betrachtet. PhD dissertation. University of Bern. von Witzendorff, H. J., (1951), “Beiträge zur bremischen Handelsgeschichte der zweiten Hälfte des 18. Jahrhunderts”, Bremisches Jahrbuch 43: 342–394. van Zanden, J. L., (2002), “The ‘revolt of the early modernists’ and the ‘first modern economy’: an assessment”, Economic History Review 55(4): 619–641. Zimmermann, A., (1885), Blüthe und Verfall des Leinengewerbes in Schlesien: Gewerbe- und Handelspolitik dreier Jahrhunderte. Breslau. Zorn, W., (1961), “Schwerpunkte der deutschen Ausfuhrindustrie im 18. Jahrhundert”, Jahrbücher für Nationalökonomie und Statistik 173, 5: 422–447.
221
Part 2
QUESTIONNAIRES
Austrian Netherlands, 1759-1791 . . . . . . . . . . . . . . . . . . . . . . . . . . 227 Ann Coenen France, c.1713- c.1821 . . . . . . . . . . . . . . . . . . . . . . . . . . . . . . . . . . . 239 Loïc Charles and Guillaume Daudin Genoa, sixteenth century-1797. . . . . . . . . . . . . . . . . . . . . . . . . . . . . 251 Luisa Piccinno and Andrea Zanini Habsburg Monarchy, eighteenth century-1918 . . . . . . . . . . . . . . . . 255 Klemens Kaps Hamburg, 1728-1811 . . . . . . . . . . . . . . . . . . . . . . . . . . . . . . . . . . . . 267 Klaus Weber Ireland, 1698-1829 . . . . . . . . . . . . . . . . . . . . . . . . . . . . . . . . . . . . . . 271 Patrick Walsh, Aidan Kane, and Eoin Tennisman Naples, sixteenth century-1809 . . . . . . . . . . . . . . . . . . . . . . . . . . . . 277 Daniela Ciccolella Livorno, 1680-1845 . . . . . . . . . . . . . . . . . . . . . . . . . . . . . . . . . . . . . 283 Mathieu Grenet Milan, 1762-1790 . . . . . . . . . . . . . . . . . . . . . . . . . . . . . . . . . . . . . . . 291 Giovanna Tonelli Netherlands, 1753-1809 . . . . . . . . . . . . . . . . . . . . . . . . . . . . . . . . . . 297 Werner Scheltjens Norway, 1731-1795 . . . . . . . . . . . . . . . . . . . . . . . . . . . . . . . . . . . . . 303 Ragnhild Hutchinson Papal States, sixteenth-nineteenth centuries . . . . . . . . . . . . . . . . . 309 Donatella Strangio Poland, 1764-1791 . . . . . . . . . . . . . . . . . . . . . . . . . . . . . . . . . . . . . . 313 Szymon Kazusek and Jan Kochanowski
Revue de l’OFCE, 140 (2015)
Portugal, 1775-1831. . . . . . . . . . . . . . . . . . . . . . . . . . . . . . . . . . . . . . 321 Maria Cristina Moreira Romanian Principalities, eighteenth century . . . . . . . . . . . . . . . . . 337 Cristian Luca Russia, 1758-1766 . . . . . . . . . . . . . . . . . . . . . . . . . . . . . . . . . . . . . . . 345 Werner Scheltjens Scotland, 1707-1783 . . . . . . . . . . . . . . . . . . . . . . . . . . . . . . . . . . . . . 347 Philipp Robinson Rössner Spain, 1717-1827 . . . . . . . . . . . . . . . . . . . . . . . . . . . . . . . . . . . . . . . . 357 Javier Cuenca-Esteban Spanish America, 1790-1830 . . . . . . . . . . . . . . . . . . . . . . . . . . . . . . 367 Alejandra Irigoin Sweden and Finland c.1700-1809, Finland 1809-c.1850. . . . . . . . . . 375 Jari Ojala and Jari Eloranta United Kingdom, 1696-1899 . . . . . . . . . . . . . . . . . . . . . . . . . . . . . . . 381 David Jacks United States, 1790-1819 . . . . . . . . . . . . . . . . . . . . . . . . . . . . . . . . . 387 Javier Cuenca-Esteban Missing countries. . . . . . . . . . . . . . . . . . . . . . . . . . . . . . . . . . . . . . . . 393 Loïc Charles and Guillaume Daudin
AUSTRIAN NETHERLANDS, 1759-1791 Ann Coenen University of Utrecht
1. Coverage This questionnaire discusses the Southern Netherlands during the Habsburg period. This overlaps more or less with the area of Belgium, but it leaves out the Prince-Bishopric of Liège. The included departments are: Brussels, St-Philippe (called Lillo, after 1785), Turnhout, Antwerp, Tienen, Ghent, Sint-Niklaas, Ypres, Bruges, Courtrai, Ostend, Newport, Chimay, Charleroi, Mons, Namur, Navagne (called Herve, after 1765), Luxembourg, Marche, Saint Vith and Roermond. Because of political turmoil data collection ended in 1791. There is some fragmentary data available for the period 1792-1794, but afterwards this kind of statistical information has not been collected anymore. 2. Documents The Austrian Netherlands’s customs statistics contain for 3,000 alphabetically listed products handwritten tables with three columns (import, export and transit trade) and 22 rows.1 The first 21 rows present the traded volumes per department; the final row identifies the calculated total volume for the Austrian Netherlands. Unfortunately, the statistics do not account for the origins and destinations of the trade flows. Each year’s information is compiled in a cardboard volume; a more luxurious copy, with a decorative leather and gold-leaf cover, was delivered annually to the monarch. The goods are recorded in different units, including measures of length, weight, monetary value, and even a few units whose exact values are no longer known (namely a lien of glasses and a wiege of monkfish). Some goods were also recorded in several ways (for example partly in ells and partly in Brabantine guilders, depending on the practices of local customs bureaus). 1. Not every year contains exactly the same categories, therefore the total number of goods for the 33 years exceeds that of a single year. The year with the smallest amount of goods is 1779 (846); the year with the largest is 1759 (2001).
Revue de l’OFCE, 140 (2015)
226
Ann Coenen
The so-called Relevés Généraux Des Marchandises, Manufactures et Denrées Entrées, Sorties et Transitées, include import, export and transit data for over a thousand products, rendering the calculation of a balance of trade possible. The originals are available at the National Archives in Brussels, Finance Council, nrs 5748-5805. The data has also been digitized by dr. Ann Coenen and was published in 2014.2
3. Institutional setting The idea for the creation of the customs statistics was launched in 1754 by Patrice de Nény, general treasurer of the Austrian Netherlands and a member of the Finance Council.3 Following his suggestion, the government named Benoît-Marie Dupuy as the first secretary of the new customs bureau, the bureau de la régie des droits d’entrée et de sortie, which was responsible for the customs management. Dupuy was likely a former clerk of the French Fermes Générales. He had arrived in Brussels with the French army during its invasion of the Austrian Netherlands in the War of Austrian Succession; he had been appointed head of the Régie général, established by Louis XV to collect taxes in the territories he occupied. Dupuy worked so efficiently, however, that when the peace was signed, the Habsburgs offered him a position as a special advisor to the government. Dupuy’s work to modernize and reform the tax administration – modelled mainly on the French accounting procedures of the Fermes Générales – was strongly supported by the minister plenipotentiary Karl von Cobenzl.4 The latter regarded the customs administration as a cornerstone of a mercantilist economic policy and thus staunchly advocated careful monitoring of import, export and transit trade.5 Already in the 1750s Dupuy had begun to collect data for a general trade record; de Nény, 2. Ann Coenen, Carriers of Growth? International trade and economic development in the Austrian Netherlands (Leiden, 2014). 3. Jan Blomme and Herman Van Der Wee, “The Belgian Economy in a Long-Term Historical Perspective: Economic Development in Flanders and Brabant, 1500-1812,” Workshop on Quantitative Economic History (Leuven, 1993), Blomme and Van Der Wee, 'The Belgian Economy in a Long-Term Historical Perspective: Economic Development in Flanders and Brabant, 15001812', Cécile Douxchamps-Lefèvre, “La Statistique Douanière Des Pays-Bas Autrichiens,” Annales Du Congrès De La Fédération Cah De Belgique (Brussels, 1969), 123–30, 123. 4. On Dupuy and his career in the Austrian Netherlands’ financial administration, see MarieLaure Legay, “Un Français à Bruxelles: les réformes comptables de Benoît-Marie Dupuy (17461756),” Comptabilités (on line journal), 1, 2010, retrieved on 27th July 2011, http:// comptabilites.revues.org/ 156. 5. Herman Coppens, “Bureau Voor Het Beheer Van De Douanerechten (1737-1794),” in Erik Aerts (ed.), De Centrale Overheidsinstellingen Van De Habsburgse Nederlanden (1482-1795) (2; Brussels, 1995), 523–30, 526.
Austrian Netherlands, 1759-1791
however, wary of the governor’s councillor keeping tabs on him, severely criticized Dupuy’s work and reforms. Dupuy was finally dismissed in July 1756 and departed the Low Countries in 1757.6 He was succeeded by Ferdinand Paradis, who produced the first complete annual record, for the year 1759, and later by Henri Delplancq (director during the period 1765-1787). It was especially under Delplancq’s leadership that the bureau reached its full potential, providing not only data about external trade but also a more extensive expertise on economic and financial matters. The latter aspect likely explains why the bureau’s workforce increased from a dozen clerks in the early 1750s to more than forty at the end of the 1780s.7 4. Motivations Drawing up a relevé général (general record) of all goods that went across the border was part of a broader trade policy; such efforts were intended to render a clear overview of the state of trade and customs revenues so as to develop more efficient customs regulations. It was also used to map out the strengths and weaknesses of the domestic industries. It probably achieved its goals. Customs and trade policy in the Austrian Netherlands was very much ad hoc. A custom-made approach to each different sector or even product was developed. As the customs bureau was able to compute its statistics remarkably quickly these probably served as an efficient tool for policy making. 5. Methods The customs bureau left a large archive of information concerning the organization of its work, including regulations, personnel files, memoranda on the bureau’s founding and numerous letters and decrees.8 These show that each of the 21 départements had a principal 6. Legay, “Un Français,” 9. 7. Coppens, “Bureau Voor Het Beheer Van De Douanerechten (1737-1794),” at 526, Philippe Moureaux, 'Un Organe Peu Connu Du Gouvernement Des Pays-Bas Autrichiens: Le Bureau de Régie des Droits D’entrée et de Sortie,” Belgisch Tijdschrift voor Filologie en Geschiedenis, 44 (1966), 479-99, 490-98. 8. National archive Brussels, Conseil des finances, commerce et douanes. The Finance Council contains detailed personnel files: NAB, FC, 8563-8576, reports on customs organisation: 4294 and countless other sources on the customs administration which are described in: Coppens, “Bureau Voor Het Beheer Van De Douanerechten (1737-1794),” Koen Dries, “Comité Voor De Wederzijdse Handel Tussen De Duitse Erflanden En De Nederlanden (1768-1777),” in Erik Aerts (ed.), De Centrale Overheidsinstellingen Van De Habsburgse Nederlanden (1482-1795) (2; Brussels, 1994), 793-98.
227
228
Ann Coenen
bureau and a variable number of subordinate bureaus.9 The latter were leased by the central administration to local officials. This arrangement, unfortunately, impacted the coherence of the customs registers: as noted below, products are noted alternately in monetary values and in various other units of measurement; however, it also meant that the local staff depended on thorough collecting of taxes to survive, which was an incentive for them to be meticulous. Moreover, the numerous regulations and inspections indicate the accuracy with which the sources were created.10 The government acknowledged that fraud was a serious problem, but took several steps to address it.11 For example, every department included an auditor and guards who were controlled by the central administration, not by the local customs officers.12 The bureau was able to compute its statistics remarkably quickly. The local customs administration forwarded their statistics, without compiling or arranging them, to the Bureau de la Régie, where a large staff was assigned to compose the overall statistics. The process usually took less than six months. In this way the bureau was able to produce a continuous series from 1759 to 1791. An administrative source like the relevé obviously must be approached with great caution. Even though historians do not question the source’s intrinsic value, the customs statistics present various shortcomings. These weaknesses have been discussed by Cécile Douxchamps-Lefèvre, Jules Mees, Greta Devos and more recently Koen Dries and Ann Coenen.13 All the usual methodological suspects – underregistration, contraband, fraud, negligence – are present, and, as Mees and Douxchamps-Lefèvre discovered, a number of tax-exempt goods were simply not included. (It is possible to determine which goods these were, by looking them up in the tariff books.14) Another concern is that local employees were not always up to the task. This is evidenced by the Bureau de la Régie including a considerable number of 9. A list of the secondary customs offices per department can be found in NAB, FC, 4294. 10. NAB, FC, 6399. 11. NAB, FC, 8576. 12. G. Bigwood, Les Impôts Généraux Dans Les Pays-Bas Autrichiens. Étude Historique De Législation Financière (Leuven, 1900), 280. 13. Greta Devos, “Oostenrijkse Douanestatistiek En De Oostendse Handel in De Tweede Helft Van De XVIIIe Eeuw,” Colloquium: Economische Geschiedenis Van België (Brussels, 1972), 335-50, Douxchamps-Lefèvre, “La Statistique Douanière des Pays-Bas Autrichiens,” Dries, “Comité Voor De Wederzijdse Handel Tussen De Duitse Erflanden En De Nederlanden (1768-1777),” Jules Mees, “La Statistique Douanière de la Belgique dans la Seconde Moitié du XVIIIe Siècle,” Revue belge d’histoire, 1 (1914), 72-97. 14. See below. NAB, FC, 8873-8874, “Estat ou Tarif des Droits D’entrée et Sortie sur les Marchandises,” Manufactures et Denrées.
Austrian Netherlands, 1759-1791
misspellings and miscalculations in the tables submitted from the local customs bureaus.15 In any case the statistics cannot be compared to contemporary administrative documents: before 1770 the staff in the regional offices was not even required to be able to read and write.16 Also, changing levels of taxation probably caused bias, since increasing taxes may have led to higher rates of tax evasion. It is even more difficult to establish whether this bias would have affected certain goods more than others (and which goods these would have been). Tax evasion was a problem the customs administration was well aware of (see for instance the chapter on the salt trade).17 Moreover, it is nearly impossible to assess how great the impact of changing tariffs was on this source. All in all, the amounts listed clearly tended to be minima, because when traders saw the chance to avoid customs controls and the accompanying taxes, they probably rarely hesitated to do so. Even though the figures from the source suggest an illusion of exactness, we must remain cognizant that in fact they are merely indications of the magnitude of traded volumes and of the trends in trade. In particular, one should not lose sight of the reality that these customs statistics – however systematic and accurate they may appear to be – were compiled by real persons and with a specific objective, thereby rendering them unavoidably far from exact. In short, extreme caution is warranted when dealing with the quantitative information from the customs statistics. Nonetheless, if the source is used correctly, there are convincing arguments for not ignoring this goldmine of data. The statistics’ eminent importance for uncovering trends and magnitudes in foreign trade is uncontested. That the evolutions do indeed make sense has been substantiated in the work of colleagues such as Dries Lyna, and are corroborated further in my own case studies.18 Moreover, in comparison with the statistical materials available for other countries – for example the Dutch Republic – it is no exaggeration to state that the Habsburg customs statistics are superior.19 This fact did not escape even critics of the 15. Mees, “La Statistique,” (89-91). 16. Christine Piraux and M. Dorban, Douane, Commerce Et Fraude Dans Le Sud De L’espace Belge Et Grand-Ducal Au XVIIIe Siècle (Louvain-la-Neuve: Academia Bruylant, 1998), 136. 17. Smuggling received an enormous deal of attention within the sources of the bureau de la régie. Some more general texts can be found in NAB, FC, 4278, Consultation of August 27th 1753 by the jointe pour le commerce avec les Pays Héréditaires; 4284, memoir concerning smuggling (1780); 8576, notes by Delplancq (1786-1789). 18. Coenen, 2014, Dries Lyna, “The Cultural Construction of Value: Art Auctions in Antwerp and Brussels (1700-1794),” (UA, 2010). 19. Jan De Vries and A. Van Der Woude, Nederland 1500-1815. De Eerste Ronde Van Moderne Economische Groei (Amsterdam, 1995).
229
230
Ann Coenen
customs statistics.20 These statistics, when their limitations are accounted for, provide highly valuable information not just for economic historians but also for researchers investigating material culture, social transformations and eighteenth-century society in general. 6. Information The customs statistics contain import, export and transit volumes for about 3,000 products.21 The goods are recorded in different units, including measures of length, weight, sometimes monetary value (Brabantine guilders), and even a few units whose exact values are no longer known. Some goods were also recorded in several ways (for example partly in ells and partly in Brabantine guilders, depending on the practices of local customs bureaus). The fact that the statistics mainly include volumes, but rarely monetary values, renders aggregation much more complicated. Prices are difficult to find. A very small number of commodity prices can be read directly from the customs statistics, for in a few cases both the volume and the corresponding value were recorded such that the price can be calculated. This is the case for codde (a type of fabric) and for woollen sheets. Apart from these two textile goods, a sample yielded no other examples. Fortunately, however, for about 170 other goods – mostly ones that were traded in small quantities – we do not have to look for prices, because the size of the trade flows was only recorded in monetary value and did not require conversion. Other prices were found in various primary and published sources. Commodity prices can be found scattered throughout the archive fund of the Finance Council and the Secretary of State and War, though it is not always apparent how representative these figures are.22 The customs administration itself also collected price data, in particular on grains and flax.23 However, the largest part of the prices used here is taken from a 20. Mees, “La Statistique,” Philippe Moureaux, “Le Commerce entre la France et les Pays-Bas Autrichiens dans la Seconde Moitié du XVIIIe Siècle. Une Première Approche des Sources Quantitatives,” 144. 21. Not every year contains exactly the same categories, therefore the total number of goods for the 33 years exceeds that of a single year. The year with the smallest amount of goods is 1779 (846); the year with the largest is 1759 (2001). 22. It is also not entirely clear whether these were who sale or retail prices, but since they were used by the customs administration probably the former (and Cost, Insurance and Freight included). NAB, FC, 4289, 4305, 4564, 4571, 4597, 4828 and 5320. NAB, AO, 1266. NAB, SSW, 2153. 23. NAB, FC, 4837-4838 and 4951-4953. Materné, De Prijzenadministratie.
Austrian Netherlands, 1759-1791
published work: “Nederlandsche Prijsgeschiedenis” by Nicolaas Posthumus.24 Posthumus published annual wholesale prices from the Amsterdam stock market. Since our subject is cross-border trade, we can safely assume that the prices in Posthumus’s overview are largely similar to those used for wholesale commerce in the Austrian Netherlands. For grains, this hypothesis holds.25 The prices are published in Dutch guilders though, so they evidently had to be converted to Brabantine guilders.26 Lastly, data from the French trade statistics, which contain both volumes and prices, can also be used. This source includes the destinations and origins of traded goods, and so the bilateral trade flows between both regions can be filtered out. The ongoing digitisation of these statistics is a project led by Guillaume Daudin and Loïc Charles. In the end, the trade balance can be calculated on the basis of data for 272 goods, including wool, wine, salt, cotton, spices, dyes, grain, linen, flax, coal and luxury goods such as fine decorations. In terms of volume these commodities definitely accounted for over 50 percent of total international trade (not surprisingly, goods for which prices have been published are goods that were traded most frequently); in terms of value they likely accounted for an even larger share, as they include a large portion of the most expensive goods (such as silk and spices). To be sure, extra price data would allow for inclusion of more goods and would thus greatly increase the accuracy of these estimations. The current selection, however, unquestionably offers an extensive enough sample of international trade in the eighteenth century to expose accurate trends. The list of goods recorded by the bureau de la régie comprehends around 1,800 items per year. As there were small changes in the nomenclature between different years, even if the larger categories remain the same, the total number of commodities used throughout the 33 years is up to 3,000. The language used was French. The bureau de la régie decided on the designation of categories of goods. Unfortunately, the statistics do not account for the origins and destinations of the trade flows. The department for which they were registered offers clues about the possible final destinations; however, 24. Nicolaas W. Posthumus, Nederlandsche Prijsgeschiedenis, vol. 1 (Leiden: E.J. Brill, 1943). 25. Materné, De Prijzenadministratie. 26. 1 Amsterdam guilder = 1,1 Brabantine guilder: C. Verlinden and E. Scholliers, Dokumenten voor de Geschiedenis van Prijzen en Lonen in Vlaanderen en Brabant (Bruges: 1959-1973), 14.
231
232
Ann Coenen
since goods were not necessarily registered at their points of entry or departure, such indications are far from certain.27 7. Availability The digital databank associated with my 2014 publication can be found here: see: http://www.brill.com/products/book/carriers-growth. 8. Research questions I have used the data to look at the development of trade for 5 sectors (salt, coal, textiles, colonial products and grains), in this way revealing several new elements of the economic development of the Southern Netherlands. To illustrate the relative weight of the 5 chosen cases, I have also estimated the total balance of trade. Because of the enormous variety of products included in this source, it will hopefully prove useful for many historians of the Early Modern period (for example those in the fields of material culture, agricultural and trade history). 9. Bibliography 9.1. Primary sources
National Archives Brussels 1. Finance Council (inventory number I 103) Customs statistics: Relevé Général des Marchandises, Manufactures et Denrées Entrées, Sorties et Transitées Par les Vingt et un Départemens des Pays-Bas Autrichiens. — Number 5748: Relevé Général 1759. — Numbers 5749, 8912 and 8914: Relevé Général 1760. — Numbers 5750 and 5751: Relevé Général 1761. — Numbers 5752 and 5753: Relevé Général 1762. — Numbers 5754 and 5755: Relevé Général 1763. — Numbers 5756 and 5757: Relevé Général 1764. — Numbers 5758 and 5759: Relevé Général 1765. — Numbers 5760 and 5761: Relevé Général 1766. 27. Merchants could apply for a permit to register goods elsewhere, for example in the city where their activities were based. To establish the importance of different trading partners, the customs statistics can be supplemented by local customs data preserved in the National Archives in Brussels for 1791-1794: NAB, FC, 5830-5846: Relevés généraux des marchandises entrées, sorties et Transitées par les différents départements avec l’indication de la provenance ou de la destination des produits.
Austrian Netherlands, 1759-1791
— — — — — — — — — — — — — — — — — — — — — —
Numbers 5762 and 5763: Relevé Général 1767. Numbers 5764 and 5765: Relevé Général 1768. Numbers 5766 and 5767: Relevé Général 1769. Numbers 5768 and 5769: Relevé Général 1770. Numbers 5770 and 5771: Relevé Général 1771. Numbers 5772 and 5773: Relevé Général 1772. Numbers 5774 and 5775: Relevé Général 1773. Numbers 5776 and 5777: Relevé Général 1774. Numbers 5778 and 5779: Relevé Général 1775. Numbers 5780 and 5781: Relevé Général 1776. Numbers 5782 and 5783: Relevé Général 1777. Numbers 5784 and 5785: Relevé Général 1778. Numbers 5786 and 5787: Relevé Général 1779. Numbers 5788 and 5789: Relevé Général 1780. Numbers 5790 and 5791: Relevé Général 1781. Numbers 5792 and 5793: Relevé Général 1782. Number 5794: Relevé Général 1783. Numbers 5795 and 5796: Relevé Général 1784. Numbers 5797 and 5798: Relevé Général 1785. Numbers 5799 and 5801: Relevé Général 1786. Numbers 5800 and 8917: Relevé Général 1787. Number 5802 (and NAB, Manuscripts, number 2780) : Relevé Général 1788. — Number 5803: Relevé Général 1789. — Number 5804: Relevé Général 1790. — Number 5805: Relevé Général 1791. 9.2. Secondary works publishing and commenting the data Bigwood, G., (1900), Les impôts généraux dans les Pays-Bas autrichiens, Étude historique de législation financière (Leuven). Coenen, Ann, (2014), Carriers of growth? International trade and economic development in the Austrian Netherlands, Brill, Leiden. Coppens, Herman, (1995), “Bureau voor het beheer van de douanerechten (1737-1794),” in Erik Aerts (ed.), De centrale overheidsinstellingen van de Habsburgse Nederlanden (1482-1795) (2; Brussels), 523–30. Devos, Greta, (1972), “Oostenrijkse douanestatistiek en de Oostendse handel in de tweede helft van de XVIIIe eeuw,” Colloquium: Economische geschiedenis van België (Brussels), 335–50. Douxchamps-Lefèvre, Cécile, (1969), “La statistique douanière des PaysBas autrichiens,” Annales du congrès de la fédération CAH de Belgique (Brussels), 123–30. Dries, Koen, (1994), “Comité voor de wederzijdse handel tussen de Duitse Erflanden en de Nederlanden (1768-1777),” in Erik Aerts (ed.), De
233
234
Ann Coenen
centrale overheidsinstellingen van de Habsburgse Nederlanden (1482-1795), (2; Brussels), 793–98. Mees, Jules, (1914), “La statistique douanière de la Belgique dans la seconde moitié du XVIIIe siècle,” Revue belge d’histoire, 1, 72–97. Moureaux, Philippe, (1966), Le commerce entre la France et les Pays-Bas Autrichiens dans la seconde moitié du XVIIIe siècle. Une première approche des sources quantitatives. Moureaux, Philippe, (1966), “Un organe peu connu du gouvernement des Pays-Bas Autrichiens: le Bureau de régie des droits d’entrée et de sortie,” Belgisch Tijdschrift voor Filologie en Geschiedenis, 44, 479–99. Piraux, Christine and Dorban, M., (1998), Douane, commerce et fraude dans le sud de l'espace belge et grand-ducal au XVIIIe siècle, (Louvain-la-Neuve: Academia Bruylant). 9.3. Secondary works using the data Coenen, Ann, (2014), “The international textile trade in the Austrian Netherlands, 1750-1791,” in Jon Stobart and Bruno Blondé (eds.), Selling textiles in the long eighteenth century: comparative perspectives from western Europe (Basingstoke: Palgrave Macmillan). Coenen, Ann, (2014), International trade and economic development in the Austrian Netherlands, ed. Peer Vries (Library of Economic History; Leiden: Brill). 9.4. Complementary sources Tariff books: “ESTAT OU TARIF des DROITS d’entrée et sortie sur les marchandises, manufactures et denrées” — Number 8873: tariff book from 1670, with corrections until 1792. — Number 8874: tariff book from 1680, with corrections until 1792. — Number 5606: reprint of the 1670 tariff book (1760). — Number 5607: Receuil général des Marchandises, Manufactures, denrées et matières reprises et non reprises aux tarifs des années 1670, 1680 et 1683 et qui paient les droits d’entrée et sortie suivant les dits tarifs et ordonnances dérogatoires. N° 5. — Number 5608: Copy of the 1680 tariff book. — Number 5591: Remarks on the customs duties, until 1669. — Number 8792: Remarks on the customs duties, until 1680. — Numbers 4278, 4279, 4281, 4283, 4284, 4287, 4289, 4290, 4298 and 4304 : various letters and memoirs on Commerce en général . Sources on prices : — Number 4828: Monthly prices from different markets for grains, seeds, oil, linen, yarn and hops.
Austrian Netherlands, 1759-1791
— Numbers 4818-4838: grain prices, Registre de prix des grains à Amsterdam. — Numbers 4950-4953: flax prices. Sources on customs organisation and staff — Numbers 5853-5854, 5863, 6399, 8576. Dictionnaire de Commerce (by Henri Delplancq) — Number 8580
235
FRANCE, c.1713-c.1821 Loïc Charles1 Université de Paris 8 & INED
Guillaume Daudin2 Université de Paris Dauphine & Sciences Po
1. Coverage This questionnaire discusses the trade statistics available for France over the “long” eighteenth-century. The systematic collection of trade data by a specialized institution – the bureau de la balance du commerce – began in 1713 and continued throughout the whole period. However, information on trade flows was available before this date, and at least one table of imports for the year 1671 has survived in the French national archives.3 Conversely, there are many lacunae. In particular, it seems that several years were never documented in the 1780s and early 1790s (1781, 1783 to 1786, 1790-1791 and 1793-1794).4 Yet even for these years, some tables still survive with detailed data on exchanges with French colonies, the United States of America and England, among other trading partners; and they provide a general estimate of the trade value for each partner as well. Hence, it may be possible to draw on multiple sources and reconstruct satisfactory estimates of French external trade for these years. The geographical unit known as “France” which is covered by the set of data produced by the Bureau changed over time, although marginally. During the Ancien Régime, the fiscal frontiers did not correspond to the political borders of the French kingdom. The main differences were: — Free port trade, such as in Dunkirk, was excluded. Only the general value of exports and imports going through “Dunkerque” was given before 1787.
1. 2. 3. 4.
[email protected] [email protected] Archives Nationales (AN), F12 1834A. AN, F12 1835.
Revue de l’OFCE, 140 (2015)
238
Loïc Charles and Guillaume Daudin
— The provinces réputées étrangères were also excluded: Alsace, Lorraine and Trois-Évêchés. At the end of the Ancien Régime, efforts were made to reintegrate these areas into the French statistics. They were partly successful, since the significant port of Dunkirk was reintegrated in 1787. Alsace as well was at least partly reintegrated at that time, but the move was still incomplete when the French Revolution broke out. It was therefore only when the balance of trade was taken over by the ministère de l’Intérieur, in 1792, that the political and customs frontiers were aligned. Likewise, the designation of the French trade partners evolved over time. Prior to 1733, the “Nord” was a general category that included all trade with locations situated north of the Low Countries on the European continent. In 1733, the category “Danemark” was created to register trade with an area that encompassed modern Denmark and Norway. In 1734, “Suède” was detached from the “Nord” to form a specific geographical unit in the balance of trade records. This territory corresponded more or less to modern Sweden and Finland, as well as a small piece of land in Western Pomerania; however, it is difficult to say if trade with this region was actually included in Swedish trade by French authorities. In 1744, the “Nord” was further disaggregated when the category “Russie” was created. Finally, when the Bureau of the Balance of Trade was reorganized in the early 1780s, the category disappeared altogether and was replaced by three new geographical units: “Royaume de Prusse”, “Les villes Hanséatiques” and “L’Allemagne et la Pologne”. The same process happened in respect to trade between France and Italy. Up to 1757, Italian trade was subsumed under two categories “Savoye et Piémont” and “Italie”. From 1758 on, the Bureau added three more categories: “Naples and Sicile”, “Gênes” and “Venise”. As in the case of the “Nord” category, “Italie” disappeared in the early 1780s and was disaggregated into “États ecclésiastiques” and “Toscane”. Other significant changes throughout the latter part of the eighteenthcentury include the creation of the “Indes orientales” category in the aftermath of the collapse of the French East-India Trading Company (1769) and the creation of the geographical unit “États-Unis d’Amérique” in 1779. The year 1789 is notable as the beginning of a period marked by conflicts and multiple changes in the borders of the French republic (and later in the Empire), that complicate the task of statisticians: the changes are too numerous to be described in detail here. It was only after the Congress of Vienna in 1815 that the list of partners stabilized again to settle on a total number of 21 trade partners.
France, c.1713-c.1821
2. Documents The Bureau of the Balance of Trade managed or produced several series of documents. At the local level, bureaus of the Ferme générale (General Farm), the private company in charge of collecting the customs taxes, sent to the Paris bureau each month a detailed list of the goods that passed through their office, whether they came from or were destined beyond French borders. These documents were usually destroyed after a few months or years, and only a handful of them survived in the French National Archives (such as the one provided in Fig. 1). The Bureau used information provided by the local offices of the Farm to establish documents called récapitulations, which listed all the imports and exports for each Direction de Ferme over the course of a whole year.5 These documents were then forwarded to the Chambers of Commerce, who had to either check the prices given by the General Farm or supply them when none were given.6 A large part of these documents were kept in the Archives of the Chambers of Commerce and are still in existence. As soon as the merchants’ assemblies had finished their task, they sent a copy of the récapitulations to the Bureau of the Balance of Trade. Before 1745, the Bureau did little with them aside from computing the figures for the total balance of trade. From 1745 to 1752, the Bureau added another set of documents that listed exports by partners. They called these exports Objets and assignated one Objet to each partner. From 1752 on, the Bureau replaced the several Objets with an Objet général du commerce de la France avec l’Étranger, which synthesized all trade coming from and going to the metropolitan area. The flows were listed in alphabetical order of commodity names. There was little evolution before 1780, when the Bureau was reformed (see section 3 below). After 1780, the main change was that exchanges were interrupted between the Bureau and the Chambers of Commerce. The General Farm was now in control of the whole process. Until 1788, the form of the main document produced by the Bureau did not change. However, after 1787, it also produced a new synthesis called the Résumé général. This new document was a printed double-entry table that replaced the 5. A Direction de Ferme corresponds more or less to a Généralité, which is the main geographical unit used by the French royal administration. In 1789, there were about 25 Directions. 6. Chambers of commerce (Chambres de commerce) were institutions composed of merchants that regulated and represented the interests of merchant communities at the local level. The first chambers were established in free ports such as Marseille and Dunkerque, but they were subsequently created in most of the important commercial cities such as Amiens, Bayonne, Bordeaux, Le Havre, Lille, Lyons, Nantes, Rouen, etc. The only exception was Paris, which had no chamber of commerce before 1803.
239
240
Loïc Charles and Guillaume Daudin
manuscript one. It did not list all the individual goods, like the Objet général did, but instead bundled goods together under categories such as “Fish of all kinds” (Poissons de toutes sortes) or “Various woods” (Bois divers). From the mid-1780s on, the Bureau started to produce additional statistical documents on specific locations. For instance, they detailed the flows to and from individual colonies, and they specified types of flows such as specie flows and ship movements. In parallel to the Objet and the Résumé, the Bureau also created much more detailed documents that disaggregated flows by points of entry and exit on French territory, and they provided further information on the origins of exported goods. During this period, the Bureau also started collecting very precise information on colonial trade and re-exports. After the 1789 statistics, the Bureau cut through most of this. For 1792 and 1793, it printed documents with detailed information on individual goods and ship movements but provided only limited information on partners or the value of goods. It is only in 1797 that it succeeded in resuming the publication of a yearly Résumé général. However, the Bureau waited until 1816 to once again provide more precise information on individual goods; although it was unable to produce as much data on trade flows as before 1789. The last Résumé général recorded trade for 1821. The publications for the period 1822 to 1826 did not include bilateral trade per product. That information was again provided in the Tableau Décennal du Commerce de la France. 3. Institutional setting The production of information on trade flows was conducted by three different institutions. First, the raw data were collected by 230 local bureaus of the General Farm, a private company to whom the government leased the right to collect duties and taxes. After 1780, the numbers of bureaus went up to 521. By eighteenth-century standards, the Farm was a gigantic organization that employed thousands of men. After 1791 and the suppression of the Farm, the customs administration was taken up by the ministère de l’Intérieur. The second institution that played a role in collecting foreign trade information during the Ancien Régime was the Ministry of the Navy. Foreign trade was formerly under the responsibility of the French Navy. In fact, it played only a limited role in collecting data before the opening of French colonial trade in the mid-1780s. After the French colonies were granted the right to trade directly with the other European American colonies as well as the United States of America in 1784, the Navy took over the task of measuring these exchanges. The
France, c.1713-c.1821
reason is simple: the General Farm did not have any office in the colonies and the flows to and from the American colonies that did not go through metropolitan France could only be measured by the port authorities, who fell under the jurisdiction of the Minister of the Navy. The third institution that played a significant role in the making of the balance of trade was the control-general of finances, which is the central economic administration of the kingdom. Prior to 1777, the Bureau of the Balance of Trade was under the direct stewardship of the Director of Trade. In fact, the director of the Bureau was the first commis (secretary) of the Director of Trade, who was also one of the four Intendants of Finance.7 During this period, the Bureau was a small unit with two to four employees. Necker was the Controller-General of Finances in all but name, and when he terminated the offices of the Intendants of Finance, it was he who took the Bureau under his administrative arm. From 1781 on, the director of the Bureau was the Intendant of Foreign Trade, again someone under the direct supervision of the Controller-General of Finances. In parallel, the size of the Bureau grew steadily from seven individuals in 1784 to about fifteen in 1789. The structure changed again in 1788, and the directorship of the Bureau of the Balance of Trade was now an independent function held by an expert in the production of economic and financial data, but with no significant political role. From 1789 to 1795, the human resources of the Bureau were cut drastically, from fifteen to only five persons. In 1792, the Bureau was put under the sole supervision of the Ministère de l’intérieur. This situation continued throughout the Empire and the Restauration with little change. 4. Motivations Creating a bureau for the balance of trade was a product of Louis XIV’S mercantilist state. During the negotiations of the Treaty of Utrecht (1713), the French diplomats were impressed by the fact that the English (who had been computing their own balance of trade for about twenty years) had a clearer vision of their trade interests than the French. Hence, it was in the aftermath of the War of Spanish succession that the French royal government decided to compute an exact balance of trade on a yearly basis and to create a specific bureau to deal with this task. The Director of Trade also used the statistics produced 7. Intendants of Finance were second only to the Controller-General of Finances in the French economic administration.
241
242
Loïc Charles and Guillaume Daudin
by the Bureau to check the activity of the General Farm, and in particular the prices on which many duties were established. In the 1780s, the agenda of the Bureau changed. Although, it continued to produce a yearly balance of French trade, it functioned more or less as an expert bureau on foreign trade and duties. In that role, it produced several reports throughout the 1780s, e.g. in order to study the French trade relations with the newborn United States of America. These reports were also intended to help prepare and evaluate important commercial policy reforms, such as the partial liberalization of colonial exchanges in 1785 and the free trade treaty with England in 1786. The widening of its expertise was such that it was able to produce detailed data on French navigation as well as to estimate French national revenue in 1789. Moreover, the wealth of data produced by the Bureau allowed Arnould (Vice-Director and then Director of the Bureau after 1792) to produce an impressive three-volume quantitative analysis of French eighteenth-century trade and economy in 1791. After the Revolution, the Bureau resumed its earlier agenda of concentrating most of its resources on measuring France’s external trade balance. 5. Methods The methods used by the Bureau to compute the balance of trade can be detailed as follows. The local employees of the Farm registered the flow of goods on specific sheets. They itemized: individual names; the quantities and values of the commodities; the destinations and origins of the goods; and the foreign partners who imported or exported the goods. At the end of each month, each local bureau forwarded its sheet(s) to a bureau principal, such as Saint-Jean de Luz (which was near the Spanish border and under the Direction of Bayonne), where they synthesized the data into a document like the one shown in Figure 1. This document was sent to the Bureau of the Balance of Trade in Paris, who created Récapitulations, i.e., a small booklet that listed all the flows coming to and going out of a Direction during the course of one year. Up to 1781, the Bureau sent these summaries to the particular Chamber of Commerce pertaining to each Direction, so that they could evaluate the prices of the goods. After this operation, which usually took a few months, the Récapitulations were sent back to Paris, where the Bureau verified and aggregated the regional data in order to produce national documents. During the first period ending in 1751, the Bureau produced several objets, each one of them pertaining to a single country or region. Each objet comprised anywhere from a few to several dozen pages, depending on the impor-
France, c.1713-c.1821
tance of the trading partner. After 1751, the Bureau produced a single yearly synthetic document, an objet général, which compiled all the information on French external trade flows. We have not found any objet that predates those of 1749. After 1781, a gradual change occurred in the Bureau’s procedures and methods. First, beginning in 1782, the merchants were no longer solicited to provide prices: this task was taken over by the General Farm. In 1785, the implementation of a new tax regime in the colonial trade (the so-called exclusif mitigé) resulted in several French Caribbean ports being granted the right to trade directly with other European American colonies as well as with the newborn United States of America. As the General Farm had no bureau in the Caribbean, these flows had to be recorded by the Navy administration. Figure 1. Sheet for Bureau principal de Saint-Jean de Luz, Direction of Bayonne, July 1790
Source: Document from the Archives Nationales de France, F12 1668
243
244
Loïc Charles and Guillaume Daudin
6. Information Except for 1792, all the documents produced by the Bureau of the Balance of Trade convey information regarding: (a) trading partners; (b) the names of the commodities carried; and (c) the total values of the individual flows of goods. The regional récapitulations provide three additional pieces of information, which were: (d) the recorded prices of the exported and imported commodities; (e) the quantities of commodities exchanged; and (f) the French region with which the foreign partner traded. The national Objets did not give the same information. Up to 1751, they did indicate (f), and some documents from a later period (17821790) also conveyed this information.8 However, during the inbetween period, they did not specify regions of departure/arrival for the commodities. Likewise, individual prices and quantities are absent from the national Objets between the years 1752 and 1770. From the early 1780s on, detailed data on navigation was also put on record, as well as details on re-exports of colonial products. Moreover, some information on monetary flows was also provided. After 1790, the information was much less precise, in that it indicated only categories of commodities rather than individual names. Furthermore, flow values were summarized and neither prices nor quantities were specified. Exports were valued free on board, while imports included the cost of freight, insurance and custom duties for the whole period. Some sort of remuneration for the merchant was probably also included, but this issue warrants further research. 7. Availability The sources are widely dispersed throughout France and even Europe. During the Revolution, the General Farm was terminated and its archives almost completely destroyed. Hence, many of the sources of information on the French balance of trade are not in the French National Archives, even though it is one of the primary repositories. All the regional sources were kept in the archives of their corresponding chambers of commerce. Some chambers gave several of them to various departmental archives, such as those in Bayonne, Bordeaux, La Rochelle, Montpellier and Nantes; while in a few other cases, the chambers kept their own archives, such as in Marseille, Rouen and Lyon. The national documents are dispersed in four different locations. First, there 8.
A few of them even gave more precise information.
France, c.1713-c.1821
are those in the F12 series of the French National Archives. This first set has been known by historians for a long time and contains data from the second half of the 1770s onward, but there is little on the earlier period. However, this lack of sources can be partially overcome by using the other three sets of archives. One is the Gournay papers, where there is data on 1749, 1750 and 1751, although only 1750 is complete. Another is the Fonds Montbret at the municipal library of Rouen, which contains papers for several years from the 1750s and 1760s. The third one is a collection deposited in Amsterdam. It contains some of the papers pertaining to Bruyard and his son, who were, respectively, the Director of the Bureau of the Balance of Trade from the 1750s to 1780 and Inspector General of Manufactures in the 1780s. It contains several years from the 1760s and 1770s. Besides those, there are other smaller collections that fill in some of the gaps just mentioned. For example, the French National Library has a small number of 1749 Objets in the Trudaine papers, which complete those found in the Gournay papers. The French National Overseas Archives also has several documents that complete the F12 files. 8. Research questions The economic conditions that allowed France to enter the modern industrial era arose during the period being studied by the project TOFLIT18 (1716-1821).9 Yet we do not know enough about it. For the study of 18th century France, it would be useful to go beyond the strategies employed by ISEA and the Annales tradition by using quantitative data that the Bureau de la Balance du Commerce has produced. The point of using this series is twofold. On the one hand, these data are of a macroeconomic nature: they can supplement the available quantitative macroeconomic reconstructions and allow us to better understand the transformations of the French economy. For example, we can compare the “revealed relative advantages” of the French economy with those of other European countries (e.g., Britain and Belgium/ Austrian Netherlands). On the other hand, a significant part of the local data synthesized by the Bureau de la Balance du Commerce are still available in the regional French Archives (e.g., Bayonne, Bordeaux, La Rochelle, Marseille, Nantes, Rouen, etc.), and they can be used to better understand the economic linkage between local/regional economies, international trade and the national economy. The existence of local data opens up the possibility of providing an economic analysis that 9.
For an overview of the projet TOFLIT18, see: toflit18.hypotheses.org/
245
246
Loïc Charles and Guillaume Daudin
uses a rigorous framework to link different geographical levels: international, national, regional, and local, as well as individual actors. Before the Revolution, France was not a custom union. The Bureau de la Balance du commerce treated the trade statistics of some provinces (especially Alsace and Lorraine) as if they were of foreign countries. This was also the case for the French colonies. Despite not being in the custom union, some other provinces – including most free ports (except Dunkirk) – were treated as domestic French trading partners. This complexity should allow us to deepen our understanding of the specific trade impact of political borders versus custom borders, especially as we might have the occasion to cross-check France’s external trade data with other country statistics (especially Britain and the Austrian Netherlands). Another objective would be to deepen our knowledge of economic phenomena as they pertain to specific issues: economic development, transformation and the determinants of international trade.10 9. Bibliography 9.1. Primary sources Archives départementales (AD) des Bouches-du-Rhône I21-I31. AD de la Charente-maritime, 41 ETP (archives de la Chambre de commerce de La Rochelle). AD de l’Hérault, C5488. AD de la Seine-maritime, 7F Fonds Dardel. Archives Nationales, (2011), series F12, several call numbers. For a detailed listing, see Becchia (2006), Charles and Daudin (2011). Bibliothèque Municipale de Lyon, ms 1490. Bibliothèque Municipale de Rouen, (2006), Fonds Montbret, detailed list in Becchia (2006). Bibliothèque Nationale, département des manuscrits, Man. Fr. 20536 – 20542. Nederlandsch Economisch-Historisch Archief, (1996), Amsterdam. For a detailed list of the items, see Inventaire de la Collection Bruyard concernant le Bureau (de la Balance) du Commerce et l’Inspection des Manufactures sous l’Ancien Régime (1571-1831), Amsterdam. (www.iisg.nl/publications/bruyard.pdf, last accessed 11.03.2015)
10. See "the introduction to this volume" for a more specific discussion of possible research questions linked to these three issues.
France, c.1713-c.1821
9.2. Secondary works publishing and commenting the data Beaud, M., (1964), “La Bureau de la Balance du Commerce (1781-1791)”, Revue d’histoire économique et sociale, 42: 357–377. Charles, L., et Daudin, G., (2011), “La collecte du chiffre au XVIIIe siècle: le Bureau de la balance du commerce et la production des données sur le commerce extérieur de la France”, Revue d’histoire moderne et contemporaine, 58(1): 128–155. Romano, R., (1957), “Documenti e Prime Considerazioni Interno alla Balance du Commerce della Francia dal 1716 al 1780”, in Studi in Onore di Armando Sapori, vol. 2, Milan: Instuto Editoriale Cisaopino. 9.3. Secondary works using the data Arnould, A. M., (1791), De la balance du commerce et des relations commerciales extérieures de la France..., Buisson (Arnould was an employee of the Bureau. His book is based on the Bureau’s data). Becchia, A., (2000), La draperie d’Elbeuf (des origines à 1870), Publications de l’Université de Rouen, Mont-Saint-Aignan. Becchia, A., (2003), « Les exportations de draps normands dans la seconde moitié du XVIIIe siècle », p. 199–227, in Becchia A. (dir.), La draperie en Normandie, du XIIIe au XXe siècle, Mont-Saint-Aignan, Publications de l’Université de Rouen, 544. Becchia, A., (2004), « Importations et exportations françaises de laines dans la seconde moitié du XVIIIe siècle », communication à l’EuroConférence de Schio, Valdagno, Follina et Biella (Italie), 24-27 octobre 2001, préparation au XIIIe Congrès de l’Association Internationale d’Histoire Economique, Buenos Aires, 22-26 juillet 2002, session 16, La laine : produits et marchés (XIIIe-XXe s.), G. L. Fontana et G. Gayot éd., Padoue, CLEUP, 181–204. Becchia, A., (2006), « Approche quantitative du commerce franco-sarde à la fin du XVIIIe siècle », Bolletino Storico-Bibliographico Subalpino, 106: 627–647. Becchia, A., (2008), « Evaluation du commerce entre le Piémont et la France au XVIIIe siècle », in Allio, R. (dir.), Il Piemonte e la frontier. Percosi di storia economica dal Settecento al Novocento, Istituto per la storia del Piemonte Regione d’Europa, Centro Studi Piemontesi, 191–216. Crouzet, F., (2008), La guerre économique franco-anglaise au XVIIIe siècle, Paris, Fayard. Dardel, P., (1963), Navires et marchandises dans les ports de Rouen et du Havre au XVIIIe siècle, Paris : SEVPEN. Daudin, G., (2005), Commerce et prospérité: la France au XVIIIe siècle, Paris, PUPS. Gern, P., (1971), “Les échanges commerciaux entre la Suisse et la France au XVIIIe siècle”, Revue Suisse d’Histoire, 64–95.
247
248
Loïc Charles and Guillaume Daudin
Léon, P., (1974), “Structure du commerce extérieur et évolution industrielle de la France à la fin du XVIIIe siècle”, in Conjoncture économique, structures sociales: Hommage à Ernest Labrousse, Mouton., Paris, La Haye, 407–432. Morineau, M., (1965), “La Balance du commerce franco-néerlandais et le resserrement économique des Provinces-Unis au XVIIIe siècle”, Economisch Historisch Jaarboeck, 30: 170–233. Morineau, M., (1973), “Quelques recherches relatives à la balance du commerce extérieur français au XVIIIe siècle: où cette fois un égale deux”, in P. Léon, Aires et structures du commerce français au XVIIIe siècle, 1–45. Morineau, M., (1978), “Trois contributions au colloque de Göttingen: II. 1750, 1787: Un changement important des structures de l’exportation française dans le monde saisi d’après les états de la balance du commerce”, in Hinrichs E., A. Cremer, R. Vierhaus and E. Schmitt (Éd.), Vom Ancien Régime zur Französischen Revolution : Forshungen und Perspektiven, Göttingen: Vandenhoeck and Ruprecht.
GENOA, SIXTEENTH CENTURY-1797 Luisa Piccinno1 University of Genoa
Andrea Zanini2 University of Genoa
1. Coverage This questionnaire covers the period from the sixteenth- to the end of the eighteenth-century (1797) for the Republic of Genoa. In 1797 the Republic of Genoa was replaced by the Repubblica Ligure (under the influence and the control of Napoleon) and in 1805 it became part of the Napoleonic Empire. Customs rules and the taxation system changed. It is possible to collect data concerning trade in this period (until 1814) in the Departmental statistics (most of them can be found in the Archives Nationales de Paris-ANP). 2. Documents These documents are fiscal records (registers, ledgers). Balances of trade are available only for the last decades of the eighteenth-century.3 3. Institutional setting The institutions involved in the collection, transformation and publication of the data are the Casa di San Giorgio (for taxation purposes), Padri del Comune (the Port authority), Magistrato di Sanità (Health authority). 4. Motivations They were made for a fiscal purpose.
1.
[email protected] 2.
[email protected] 3. See Bulferetti L., Costantini C., Industria e commercio in Liguria nell’età del Risorgimento. 17001861, Milano, Banca Commerciale Italiana, 1966, p. 161, and Grendi E., La Repubblica aristocratica dei Genovesi, Bologna, Il Mulino, 1987, p. 342.
Revue de l’OFCE, 140 (2015)
250
Luisa Piccinno and Andrea Zanini
5. Methods Data were collected for taxation purposes or for sanitary reasons. Usually, the custom officials based the taxation on declarations, but it is probable that they inspected documents on board and checked the goods directly from time to time. The data is supposed to be fairly accurate. However, since the volume of information available in the archive is so great, it has been difficult to cross check them systematically or to add them together in order to obtain a trend of the balance of trade in the long period. Up to now, scholars have calculated a balance of trade only for short periods of time.4 6. Information The data recorded were: number and tons of ships entering and going out of the port of Genoa, taxation revenue on sea trade and on specific categories of goods. For a detailed inventory of fiscal documents available in the Archivio di Stato di Genova and produced by the Casa di San Giorgio see www.lacasadisangiorgio.it. The trade flows were usually recorded both in value and in quantity. Prices are indicated in Lire genovesi (£1 = 20 soldi, 1 soldo = 12 denari) and generally they are based on fixed price lists. These price lists seem to have been computed by making an average between the price of the good at the port of departure and at the port of Genoa. As for quantities, a wide range of measures were used. The custom authorities created the categories into which the flows of goods were recorded. Right now there is no evaluation of the total number of categories used. Goods were classified in several categories (i.e. grain, oat, silk, leather, wax, etc.) and usually without a specific indication of their origin or quality.5 The origin of specific goods was not indicated. Sometime it was included in the name of the goods (i.e., silk from Sicily, cheese from Piacenza). However, the documents indicate the port of origin (first port of call) of the vessel arrived in the port of Genoa. We don’t know exactly how many localities are mentioned in the archive. It has been calculated only for specific periods.6 4. See Felloni G., Organizzazione portuale, navigazione e traffici a Genova: un sondaggio tra le fonti per l'età moderna, in “Atti della Società Ligure di Storia Patria”, XLIII/1 (2003), pp. 337-364, and Bulferetti L., Costantini C., Industria e commercio in Liguria nell’età del Risorgimento. 1700-1861, Milano, Banca Commerciale Italiana, 1966, p. 161; Grendi E., La Repubblica aristocratica dei Genovesi, Bologna, Il Mulino, 1987, p. 342. 5. See Grendi E., La Repubblica aristocratica dei Genovesi, Bologna, Il Mulino, 1987, p. 323.
Genoa, sixteenth century-1797
7. Publication of the data It has been made only for limited periods of time, because the series of registers available are too wide. 8. Research questions The data on trade has been used by to explore the Republic of Genoa’s trading relationship with the Mediterranean as well as Northern European ports in the early modern period. 9. Bibliography 9.1. Primary sources Archivio della Casa di San Giorgio (in Archivio di Stato di Genova) - http:// www.lacasadisangiorgio.it Dogana (Custom. Import: 44 units – 1638-1785, Export, 401 units, 15741791). Portofranco (Dutyfree, 424 units, 1601-1794). Carati (Import: 491 units, 1445-1797, Export, 23 units 1532-1698). Other taxes: (more than 1000 units over the whole period). Archivio Storico del Comune di Genova, Fondo Padri del Comune 9.2. Secondary works publishing and commenting the data Bulferetti, L., Costantini, C., (1966), Industria e commercio in Liguria nell’età del Risorgimento. 1700-1861, Milano, Banca Commerciale Italiana. Costantini, C., (1978), La Repubblica di Genova nell’età moderna, in Storia d’Italia vol. IX, directed by Galasso G. , Torino, Utet. Doria, G., Massa Piergiovanni, P., (eds), (1988), Il sistema portuale della Repubblica di Genova. Profili organizzativi e politica gestionale (secc. XIIXVIII), “Atti della Società Ligure di Storia Patria”, n.s. XXVIII/1. Felloni, G., (2003), Organizzazione portuale, navigazione e traffici a Genova: un sondaggio tra le fonti per l'età moderna, in “Atti della Società Ligure di Storia Patria”, XLIII/1, 337–364. Giacchero, G., (1972), Origini e sviluppo del Portofranco genovese. 11 agosto 1590, 9 ottobre 1778, Genova, Sagep. Giacchero, G., (1973), Economia e società del Settecento genovese, Genova, Sagep. Giacchero, G., (1979), Il Seicento e le compere di San Giorgio, Genova, Sagep. 6. See Grendi E., La Repubblica aristocratica dei Genovesi, Bologna, Il Mulino, 1987; Felloni G., Organizzazione portuale, navigazione e traffici a Genova: un sondaggio tra le fonti per l’età moderna, in “Atti della Società Ligure di Storia Patria”, XLIII/1 (2003), pp. 337-364.
251
252
Luisa Piccinno and Andrea Zanini
Gioffré, D., (1962), Il commercio d'importazione alla luce dei registri del dazio (1495-1537), in Studi in onore di A. Fanfani, V, Milano, Giuffré. Grendi, E., (1968), Traffico portuale, naviglio mercantile e consolati genovesi nel Cinquecento”, in Rivista Storica Italiana, LXXX. Grendi, E., (1971), I nordici e il traffico del porto di Genova: 1590-1666, in Rivista Storica Italiana, LXXXIII. Grendi, E., (1973), Introduzione alla Storia Moderna della Repubblica di Genova, Genova, Bozzi. Grendi, E., (1987), La Repubblica aristocratica dei Genovesi, Bologna, Il Mulino. 9.3. Complementary sources Brusa, A., (1953), Dal Portofranco della Repubblica genovese al deposito franco dei giorni nostri, in Il Porto di Genova nella mostra di Palazzo San Giorgio, Milano, Alfieri. Felloni, G., (1975), Profilo economico delle monete genovesi dal 1139 al 1814, in Felloni G., Pesce G. (eds), Le monete genovesi, Genova, Stringa Editore. Felloni, G., (1989), Inventario dell’Archivio del Banco di San Giorgio (14071805), Roma, Ministero Beni Culturali. Kirk, T.A., (2005), Genoa and the Sea: Policy and Power in an Early Modern Maritime Republic, 1559–1684, Baltimore, Johns Hopkins University Press. Piccinno, L., (2000), Economia marittima e operatività portuale. Genova, secc. XVII-XIX, “Atti della Società Ligure di Storia Patria”, n.s. XL. Podestà, F., (1913), Il porto di Genova dalle origini fino alla caduta della Repubblica Genovese (1797), Genova, E. Spiotti. Van Doosselaere, Q., (2009), Commercial Agreements and Social Dynamics in Medieval Genoa, New York, Cambridge University Press.
HABSBURG MONARCHY, EIGHTEENTH CENTURY-1918
Klemens Kaps1 Universidad Pablo de Olavide, Spain
1. Coverage Information is available from the early eighteenth century to the end of the First World War. Coherent time series for the whole state (albeit taking into account smaller territorial changes) are available for the years 1790 to 1918.2 From 1792 on, the series is quite homogeneous, although occasional geographical changes affect the coherence of the time series: Western Galicia was incorporated in 1796 and left again in 1809, Salzburg was incorporated in 1815, Tyrol in 1825;3 Cracow joined in 1846, Dalmatia was incorporated in 1880 (together with other smaller territories exempt from the joint customs union such as the Adriatic Port cities and Brody). Between 1720 and 1789 several trade statistics exist either for single provinces or politically defined subunits of the composite Habsburg Monarchy in Central Europe. Among them, the trade statistics for the Hungarian territories are the most complete, covering the years 1733– 1739, 1741, 1744, 1748, 1752, and 1767–1780, 1783–1784 before being integrated into the general trade statistics of the Habsburg Monarchy from 1790. In 1775, the Bohemian and Austrian provinces formed a customs union and from 1776 on, trade accounts for the whole union were produced. These statistics (the so called Merkantiltabellen) are available for most years between 1776 and 1789 (there is, however, a gap between 1779 and 1782). 1.
[email protected] 2. However, it must be said that a homogeneous flow of statistical data was not produced before 1792, rather than 1790 as has sometimes been claimed (e.g. Otruba 1950: 4). 3. Together with Venice and Milan, although they have been disclosed separately and can be thus discounted. They left when they were integrated into the independent Italian state in 1859 and 1866 respectively.
Revue de l’OFCE, 140 (2015)
254
Klemens Kaps
Another series starting earlier, although less continuous, is available for Bohemia for the years 1720, 1723, 1732–35, 1755, as well as for Moravia and Silesia (or Austrian Silesia respectively after 1742). Scattered and fragmentary information exists for several Austrian provinces (such as Carinthia between 1756 and 1780). For the Adriatic port cities, most notably Trieste, there are separate statistics registering maritime trade between 1746 and 1847, albeit with gaps. In addition statistics for land trade with the Habsburg territories were kept, although full accounts have been found for 1760– 65 only. After 1776 these trade flows feature in the trade statistics of the Bohemian and Austrian provinces included in the customs union established in 1775 and were separately disclosed in the final account up to 1789. Galicia, annexed upon the First Partition of Poland in 1772, has scattered trade statistics for 1783 and 1784 as well as for 1787. However, the former years register only trade with the Bohemian and Austrian provinces included in the customs union and the latter omits trade with the Western provinces after Galicia was incorporated in the customs union in 1785. 2. Documents The data is usually available in the form of detailed trade accounts, but the original data of customs registers have been preserved in sporadic cases. Each of these accounts was organized as a balance of trade recording individual commodity import and export flows, in both volume and value, although not all statistics always register both units of measurement. Totals were calculated for each product group and for the sum total of trade. Separate documents listing the import and export values were also drafted; they also include the balance of trade for the corresponding year. Balances on customs revenue were also drafted. 3. Institutional setting Before 1776 local institutions drafted the single trade accounts, such as the Bohemian Council of Trade (Kommerz- or Merkantilkollegium) or the Habormaster’s Office in Trieste (Hafenkapitanat). After 1776 a specific section of the Accountancy Office (Banco-Hofbuchhaltung) was responsible for compiling the trade accounts together
Habsburg Monarchy, eighteenth century-1918
with the short-lived Court Auditing Chamber (Hofrechenkammer), the customs administration (Zollregie, Bancogefällenadministration) and the provincial governors’ offices (Landesgubernien). In 1828 a Central Commission of Statistics (Statistische Zentralkommission) was founded. The Bohemian Council of Trade was an advisory board responsible to the Court Commercial Council (Kommerzienkollegium) in Vienna, while the Trieste Harbormaster’s Office was subordinated to the Supreme Commercial Intendancy (Hauptkommerzialintendenz; Suprema Intendanza Commerciale) between 1731 and 1776. In turn, the institutions responsible for compiling the central trade statistics of both the customs union and the whole state (from 1790 on) were subordinated to the Court Chamber (Hofkammer) and for a short period to the ephemeral central governance institution (the so called Hofstelle). Only the provincial governors remained under the Court Chancellery (Hofkanzlei), although they were incorporated into the Hofstelle as well. 4. Motivations The earliest provincial trade accounts for Bohemia were compiled in order to calculate a balance of trade to help establish to what degree Bohemia’s trade was active or passive. Subsequently, this information was used in order to settle conflicts over the external customs policy between regional textile producers seeking protection from abroad and merchants pressing for the removal of trade barriers. The close connection of these statistics with mercantilist and cameralist ideas on the balance of trade is characteristic of the whole period between 1720 and at least 1815. At this time, the governmental authorities including the monarch made use of the trade accounts in order to devise their commercial policies. This was particularly true during the “protectionist period” from 1784 to the 1830s. In addition, there was a fiscal interest in customs revenue although this seems to have been less important than the policy motive. 5. Methods The original information was derived from the customs posts on the borders as well as customs posts within the provinces. The quantities and values registered were based on declarations, although the authorities occasionally checked these declarations by measuring and weighing the commodities. In some cases, discrepancies were reported. However, this issue has not been researched in detail. Hence, more work has to be done on (a) how the customs administration worked on
255
256
Klemens Kaps
the local and regional level and (b) how the information was subsequently transferred to the central authorities. The sources I have found so far reveal that data were cross-checked only at the central level (by the Accountancy Office, the Auditing Chamber and the monarch himself) by comparing customs revenue with the trade statistics (see Kaps 2015). In some cases, provincial governors also raised doubts about the credibility of the collected data. In general the trade accounts provide a credible representation of the flow of goods. However, there are several issues that need to be considered when analysing these figures. The main methodological shortcoming of these statistics is the measurement of prices, both in their spatial and their temporal dimensions. The existing literature (e.g. Otruba 1950: 4; Hassinger 1964: 74-77) assumes that state-wide statistics are more reliable than provincial ones, as the former were compiled according to unified standards that avoid some of the regional biases. The point may be questioned as the Habsburg Empire can hardly be assessed as an integrated national economy. The eighteenth-century Habsburg Monarchy was a fragmented economic space with administrative differences and geographic constraints that drastically hindered market integration until well into the 1760s and 1770s. Hassinger (1964: 76) demonstrates this when comparing Tyrol’s trade statistics with those of the customs union for 1778/79. Hassinger argues that the different prices applied by the authorities of both customs entities resulted in a pronounced overestimation of Tyrol’s external trade flows. However, as the author acknowledges, Tyrol’s prices for colonial goods reflect market prices far better than data from the customs union, whereas the difference in wheat and rye prices simply reflect market price divergences between the two entities. Thus, wheat price in L’viv, the capital of Galicia, amounted to 60.5% (1775-84) and 69.3% (1785–90) of the Viennese price. If the same type of discrepancies existed for other products and regions, this would imply that integrating the single region statistics of the Habsburg Monarchy into a unique document for the whole state constructed according to the Viennese methodology might have distorted considerably the estimated trade volume (Kaps 2015). Standardization and administrative centralization do not necessarily improve the quality and reliability of data. This point requires further research and systematic analysis of prices applied by the regional trade councils before 1775, on the one hand, and prices
Habsburg Monarchy, eighteenth century-1918
applied by the Customs and Bank Administration between 1776 and 1827, on the other hand. Apart from different regional price levels, one also needs to take into account the matter of price changes over time. Here the problem is not that the statistics were quantified according to current or fixed prices, but rather that the authorities mixed both methods. This had to do with the practice of the customs administration: every time a new customs tariff was implemented, new prices were adopted, causing severe distortions in relative prices. For instance, new prices were fixed when establishing the customs union in 1775, and again following the introduction of the protective tariffs in 1784 and 1788, and also during the period of state-wide statistics in 1803 and 1810, but only for those goods for which modified customs tolls were adopted (Zizius 1811: 170; ÖstA, FHKA, NHK, Kommerz, 144, 39 ex Aug. 1786, folio 739.). As the data obtained by comparing the customs base export prices with the average market prices between 1782 and 1784 indicate, the difference between the two price levels for a wide range of goods was rather limited, with the notable exception of woollen goods, seeds, and linen. Hence, the impact of introducing new prices on cumulative trade values seems to have been rather small in the short run, although it did influence the value of some individual goods. This preliminary finding is consistent with the assumed low level of inflation in the course of the eighteenth century. That changed in the 1780s and 1790s, thus also augmenting the impact of adapted customs base prices. The problem is exacerbated by the fact that prices for imports and exports were adapted separately, thus producing a bias when measuring import and export values. This bias was further reinforced by the greater emphasis the authorities laid on registering imports rather than exports, due notably to customs exemptions for the export of several commodities. The difference in import value deriving from these distortions was estimated as amounting to 5,503,803. fl 11 kr in the year 1803, that is, 12% of the total balance (Zizius 1811: 170-171). Taking these shortcomings into account, it can be seen that Otruba’s (1950) compilation of the official trade statistic is of limited use, because the series ignores the price changes and continues until 1839. Hence, it fails to take into account the parallel set of data compiled by the Commission for Statistics starting in 1831. The total trade volume in monetary values clearly demonstrates the impact of adopted prices on the development of the Habsburg Monarchy’s external trade, putting into context the pronounced rise of imports in
257
258
Klemens Kaps
1804 and their sharp decline in 1811 – both movements seem to have been influenced by price changes. More information about the administrative setting of prices is needed to construct a satisfactory time series, hence the Banco-Hofbuchhaltung’s administration files need to be systematically researched. To correct these distortions, one should take into account both the temporal discontinuity of price adaptations and its selective scope. The first issue is quite difficult to address since no price series exists for a wide range of products, a fact that has prevented the calculation of inflation rates for the eighteenth century. The only price index available starts in 1800 and runs to 1913 for a few Austrian cities (Vienna, Innsbruck, Linz, Salzburg, Graz) (Mühlpeck et al. 1979). Sources for the eighteenth century are scarce because the official price statistics only list grain prices starting with five-year averages in 1775 and yearly values from 1796. Price series for other foodstuffs were only registered from 1828 on. Series of prices for the cities of Vienna (Pribram 1938), Cracow (Górkiewicz 1950), and L’viv (Hoszowski 1934) with a wider temporal coverage were published, but they list the prices for a limited range of products only. The construction of a complete series of prices would have to address two different issues. First, the prices for the products, whose prices were fixed may be adjusted by calculating an individual price increase index and applying it to them. Second, for products which are registered in official price series or in the source editions just mentioned (Hoszowski 1934; Pribram 1938), these price indexes may be used. However, additional information is probably necessary, e.g. in international price statistics from border regions and states. Thus, the bias apparent in the official trade statistics could only be corrected by a very time-intensive approach. Further shortcomings of the statistics such as the omission of trading partners and transit trade should be mentioned here, although they do not question the reliability of the quantitative material, but limit the scope of analysis. 6. Information The accounts register all commodities, classifying external and internal trade flows separately and summing them up in 21 main groups of commodities (capi). As mentioned before, these categories were stable up to the reorganization of the trade statistic in 1827/28. Only the sporadically available customs extracts give more detailed
Habsburg Monarchy, eighteenth century-1918
information on traders or transporters of the goods and their places of origin and destination. The information on trade flows was usually recorded in weight/ volume/quantity and in money values. Prices were given in Austrian Florins (Gulden) and Kreuzer in the CM standard (CM = Conventionsmünze, 1 Gulden = 60 Kreuzer, valid between 1753 and 1857). Hassinger (1964) states that Viennese prices were used from 1776 on, but the method of establishing commodity prices has not been studied so far. Scattered evidence suggests that prices were determined by the Accountancy Office. It seems that the latter tried to mitigate local prices with international prices. This is certainly an area in which indepth studies are badly needed. Quantities were predominantly given in hundredweights (Zentner) and pounds (Pfund), but, depending on the product registered, a wide range of quantity measures was used such as the bushel (Metzen, Scheffel), piece (Stück), pair (Paar), dozen (Dutzend), box (Kiste), bolt (Ballen), cask (Fassl, Fass), or bucket (Eimer). Weight was given in gross value (so called sporco). From at least 1788 on, the classification had to be made according to a detailed instruction manual drawn up by the Central Customs Administration in German. This nomenclature listed all goods and their corresponding prices. The number of categories of products used in the statistics differed from year to year. The trade accounts for the Bohemian-Austrian customs union for 1783 and 1784 listed 265 individual goods, summing them up into 41 subgroups and 21 main groups. The statistics for Galicia for 1787, in turn, registered 864 products, although this large number is in part due to different attributes of some products. Trading partners were registered starting in 1820, but the data mainly reflect the borders crossed by commodities leaving and entering the territory and therefore do not always identify the real trade partners. 7. Availability A detailed record of Habsburg trade statistics before 1831 does not exist in print form. While Kaltenstadler (1967, 1968), Erceg (1970), and Panjek (2003) give a partial compilation of commodity data in their works, they were more interested in the aggregate data on trade volume. Hassinger (1964) provides data for the Habsburg dominions as a whole, but he focuses on the aggregate level and calculates trade structures broken down into raw materials, foodstuffs, and manufac-
259
260
Klemens Kaps
tures. Complete accounts have only been published for Bohemia in 1720 and 1723 (Pribram 1898) and Hungary for the second half of the eighteenth century (Wellmann 1984, using already published sources). In turn, Otruba’s compilation of foreign trade statistics for the whole Monarchy, covering the period 1790–1839, gives the values of trade for the 21 groups of commodities recorded by the Habsburg administration, aggregate values by single provinces and, from 1820 on, for single external trading partners. The statistics of the Customs Union between 1776 and 1789 have not been published at all and they have not been digitized either. For single years, I have collected data for the Customs Union (1783, 1784), Galicia (1783, 1787), and the whole Monarchy (1791, 1800, 1807) in Excel files. However, for an in-depth analysis original accounts still have to be accessed in order to recompile data. The scattered character of the statistics before 1775 and 1790 respectively means that this task implies accessing a broad range of sources in different archives. For regional statistics, this means making use not only of the Financial and Court Chamber Archive (Finanz- und Hofkammerarchiv, FHKA) section within the Austrian State Archives (Österreichisches Staatsarchiv, ÖStA) in Vienna, for accessing the statistics for Bohemia. A range of regional archives such as the archives of the Austrian provinces (Landesarchive) have to be accessed in order to collect complementary information. For Bohemia, Czech archives will have to be accessed, while the data for Trieste are stored in the Trieste State Archive (Archivio di Stato di Trieste, ASTr) for the years 1752–1770 and the Austrian State Archive, where the much used source for 1760–65 is stored, published in particular by Erceg (1970). In turn, for the years after 1775 sources are mainly stored in the Finance and Court Chamber section of the Austrian State Archives, in particular the series from 1790 is accessible in a homogeneous collection of sources, albeit with gaps for some years. The Hungarian statistics are stored in the Austrian State Archives in Vienna. The accounts from 1831 have been published in print and are accessible in the Library of Austria’s Central Office of Statistics, currently named Statistik Austria.
8. Research questions So far studies have used either aggregate data or numbers of single commodities to investigate the structural dimensions of the Habsburg Monarchy’s trade. Thus, most research has been dedicated to grouping the traded items in order to construct a structural balance of imports
Habsburg Monarchy, eighteenth century-1918
and exports. While much effort has been made here to understand the quality of commodities and original nomenclature, hardly any attempts have been made to correct trade balances for their multiple biases mentioned in this questionnaire. Similarly, so far no studies have been published trying to contribute to the Habsburg Monarchy’s balance of trade by using trade statistics of other European countries, in particular neighbouring states. Studies like the ones on Hungarian-Polish trade relations in 1764 (Lech/Stępkowski 1988) and on Polish-Austrian trade (Kazusek 2007) indicate the benefits that might be gained by using a comparative approach and cross-checking trade data from the Habsburg Empire against data of its trading partners. International comparative studies, so far largely lacking and suggested by Kazusek (2007) for Polish-Austrian trade, could be a first step towards an integrated European trade history. In the case of the Habsburg Monarchy trade with the Ottoman Empire, Italy, Poland, and also the integration in overseas trade via Hamburg, Danzig, and the Italian ports could be promising research topics. Nevertheless, the most urgent task would be to systematically compile original data in a dataset, starting from regional trade accounts and finishing with the better accessible and organized statistics of the late eighteenth century. Once this data collection is completed, the multiple corrections, addressing the problems of nomenclature, prices, weights, etc., might be undertaken. In particular, an attempt might be made to calculate foreign trade balances from regional data, although with great caution concerning the points mentioned earlier in this questionnaire. In fact, this calculation needs a more in-depth analysis. Only in the last step should use be made of statistics from different countries in order to cross-check the credibility of data, but also to add to the geographical dimension of Habsburg Central Europe’s external trade, which is not recorded in most of the original statistics. 9. Bibliography 9.1. Primary sources Österreichisches Staatsarchiv, Finanz- und Hofkammerarchiv Alte Hofkammer, Hoffinanz: Patente 120.10. Merkantil-Tabelle für Böhmen, 30.12.1755 SUS Oberster Rechnungshof Nr.109: Bankale Sign. C34 und 38
261
262
Klemens Kaps
Handschriften 1018, 1019 Neue Hofkammer: Kommerz Nr. 143–146, 856, 1723–1725 Bankale: Akten Bankaldirektion 2968, 2977, 2982 Österreichisches Staatsarchiv, Haus-, Hof- und Staatsarchiv (HHStA) Kabinettsarchiv: Nachlass Zinzendorf, Handschriften Bände 117–120 Archivio di Stato di Trieste C.R. Suprema Intendenza Commerciale: filze 587-590: Tabelle e statistiche commerciale del Litorale, 1750/62-1770 9.2. Secondary works publishing and commenting on the data Erceg, I., (1968), « Außenhandel der Nordadriatischen Seestädte als Faktor im Entstehen der kapitalistischen Beziehungen in Österreich im 18. und 19. Jahrhundert », Vierteljahresschrift für Sozial- und Wirtschaftsgeschichte 55, 464–480. Erceg, I., (1970), Trst i bivše habsburške zemlje u međjunarodnom prometu: (Merkantilizam u drugoj polovici 18. stoljeća), Zagreb. Grossendorfer, E., (1979), Österreichisches Statistisches Zentralamt, (ed.), 1831–1978, Geschichte und Ergebnisse der zentralen amtlichen Statistik 1829–1979, Wien, 627–648. Grossmann, H., (1913), « Die amtliche Statistik des galizischen Außenhandels 1772–1792 », Statistische Monatsschrift, 222–233. Hassinger, H., (1964), « Der Außenhandel der Habsburgermonarchie in der zweiten Hälfte des 18. Jahrhunderts », in: Lütge, Friedrich (ed.), Die wirtschaftliche Situation in Deutschland und Österreich an der Wende vom 18. zum 19. Jahrhundert, Stuttgart, 61–98. Kaltenstadler, W., (1969), « Der österreichische Seehandel über Triest im 18. Jahrhundert », Vierteljahresschrift für Sozial- und Wirtschaftsgeschichte 55 (1968), 481–500 (part 1) & 56, 1–104 (part 2). Mikoletzky, H. L., (1961), « Kärntner Kontributionen », Carinthia, 151, 786–789. Otruba, G., (1950), Der Außenhandel Österreichs unter besonderer Berücksichtigung Niederösterreichs nach der älteren amtlichen Handelsstatistik (Der niederösterreichische Arbeiter 1), Wien. Panjek, G., (2003), « Una “commercial officina” fra vie di mare e di terra », in: Finzi, Roberto – Panariti, Loredana – Panjek, Giovanni, La citta’ dei traffici 1719-1918. Storia economica e sociale di Trieste, Vol.II, Trieste, 235–348. Pribram, A. F., (1898), Das böhmische Commerzcollegium und seine Thätigkeit. Ein Beitrag zur Geschichte des böhmischen Handels und der böhmischen Industrie im Jahrhunderte nach dem westfälischen Frieden, Prag (Beiträge zur Geschichte der deutschen Industrie in Böhmen VI).
Habsburg Monarchy, eighteenth century-1918
Wellmann, I., (1984), « Maria Theresias Handelspolitik mit besonderer Rücksicht auf die Agrarproduktion », in: Mraz, Gerda (ed.), Maria Theresia als Königin von Ungarn (Jahrbuch für Österreichische Kulturgeschichte 10), Eisenstadt, 257–318. 9.3. Secondary works using the data Grossmann, H., (1914), Österreichs Handelspolitik mit Bezug auf Galizien in der Reformperiode 1772–1790 (Studien zur Sozial-, Wirtschafts- und Verwaltungsgeschichte X), Wien. Myška, M., (1994), « Proto-Industrialisierung in Böhmen, Mähren und Schlesien », in: Cerman, Markus and Ogilvie, Sheilagh C. (ed.), Protoindustrialisierung in Europa, Wien (Historische Sozialkunde 5), 177–191. Kaps, K., (2008), « Gescheitertes Aufholen in Zentraleuropa. Der Abstieg der Habsburgermonarchie zu einem semiperipheren Wirtschaftsraum im Spiegel ihrer Außenhandelsstruktur 1791-1880 », Zeitschrift für Weltgeschichte 9/1, 103–122. Kaps, K., (2013), « Galizisches Elend revisited. Wirtschaftsentwicklung und überregionale Arbeitsteilung in einer Grenzregion der Habsburgermonarchie (1772-1914) », Zeitschrift für Weltgeschichte 14/2 (Herbst), 53–80. Kaps, K., (2015), « Ein Messinstrument für Güterströme: Die Merkantiltabellen der Habsburgermonarchie unter besonderer Berücksichtigung des galizischen Außenhandels im späten 18. und frühen 19. Jahrhundert », in: Rauscher, Peter and Serles, Andrea (eds.), WiegenZählen-Registrieren. Massenquellen als Herausforderung der spätmittelalterlichen und frühneuzeitlichen Handelsgeschichte, Wien, 481–505. Sauer, M., (1981), « Aspekte der Handelspolitik des Aufgeklärten Absolutismus », in: Matis, Herbert (ed.), Von der Glückseligkeit des Staates. Staat, Wirtschaft und Gesellschaft in Österreich im Zeitalter des Aufgeklärten Absolutismus, Berlin, S.235–265. 9.4. Complementary sources Beer, Adolf, (1899), «Die österreichische Handelspolitik unter Maria Theresia und Joseph II.», Archiv für Österreichische Geschichte, 86: 1–204. Beer, Adolf, (1893), «Die Zollpolitik und die Schaffung eines einheitlichen Zollgebietes unter Maria Theresia», Mitteilungen des Instituts für Österreichische Geschichtsforschung, 14: 277–326. Beer, Adolf, (1894), « Die Finanzverwaltung Österreichs 1749-1816 », Mitteilungen des Instituts für Österreichische Geschichtsforschung, 15: 237–366. Dickson, P. George Mullaire, (1987), Finance and Government under Maria Theresia 1740–1780, Vol. 2, Oxford. Górkiewicz, M., (1950), Ceny w Krakowie w latach 1796-1914, Poznań.
263
264
Klemens Kaps
Guldon, Z. and Stępkowski, Lech, (1988), « Polnisch-ungarische Handelsbeziehungen um die Mitte des 18. Jahrhunderts », Studia Historiae Oeconomicae, 19: 101–118. Hoszowski Stanisław,(1934), Ceny we Lwowie w latach 1701-1914, Lwów. Kazusek, Szymon, (2007), « Handel an der polnisch-österreichischen Grenze nach 1772 (bis 1815) », in: Augustynowicz, Christoph and Kappeler, Andreas (eds.), Die galizische Grenze 1772-1867: Kommunikation oder Isolation? (= Europa Orientalis Band 4), Wien, 51–64. Komlosy, A., (2003), Grenze und ungleiche regionale Entwicklung. Binnenmarkt und Migration in der Habsburgermonarchie, Wien. Komlosy, A., (2004), « State, Regions and Border. Single Market Formation and Labor Migration in the Habsburg Monarchy », 1750-1918, Review XXVII/2: 135–177. Mühlpeck, V., Sandgruber, R. and Wojtek, Hannelore, (1979), « Index der Verbraucherpreise 1800–1914. Eine Rückberechnung für Wien und den Gebietsstand des heutigen Österreichs », in: Österreichisches Statistisches Zentralamt (ed.), Geschichte und Ergebnisse der zentralen amtlichen Statistik 1829–1979, Wien, 649–688. Pribram, A. F., (1938), Materialien zur Geschichte der Preise und Löhne in Österreich. (Veröffentlichungen des Internationalen Wissenschaftlichen Komitees für die Geschichte der Preise und Löhne), Wien. Sandgruber, R., (1978), Österreichische Agrarstatistik 1750-1918 (=Wirtschaftsund Sozialstatistik Österreich-Ungarns, Teil 2), Wien. Zizius, J., (1811), Oeconomisch-politische Betrachtungen über die HandelsBilanz, Wien/Triest.
HAMBURG, 1728-1811 Klaus Weber1 Europa-Universität Viadrina
1. Coverage This questionnaire discusses Admiralitätszoll- und ConvoygeldEinnahmebücher: Hamburg’s records on Port Duties and Duties levied for the Maintenance of Convoy Ships. Hamburg never had more than three Convoys ships in service. These warships were meant to protect convoys of merchantmen; the major threat was North African corsairs. The Convoy duty was maintained even when the last of these ships was sold. The source tells us, in a narrow sense, about the trade of Hamburg, because it reflects maritime trade of the city-state of Hamburg. In a wider sense, it also tells us about the trade of the whole Holy Roman Empire because Hamburg was Germany’s major seaport, channelling imports and exports of many regions of the Holy Roman Empire. The duties were abolished under Napoleonic rule and no comparable data were collected after 1811. 2. Documents The records include approximately 50 volumes that survived in the Staatsarchiv in Hamburg. Each is a very bulky annual volume on duties paid on maritime exports and imports. The first one covers 1728 and the last one 1811. No contemporary synthesis has survived. 3. Institutional setting The Hamburg’s port authority (Admiralität) was responsible of the collection of the data. 1.
[email protected]
Revue de l’OFCE, 140 (2015)
266
Klaus Weber
Traders and commission agents declared import and export merchandise at the scribe’s desk. The harbour master checked the ships, and the Admiralität’s scribes kept the books. 4. Motivation The data were collected in order to register the revenue generated from the duties. The aim of the duty was to distribute the burden of financing the escorting warships relative to the costs caused by each ship. Small ships that were not sailing far, e.g. the Netherlands, were exempt. Ships going to the Baltic paid minimal duties. Ships going to France paid according to the distance between the French destination port and Hamburg. Ships going to Portugal and Spain paid higher duties and ships going to the Mediterranean paid the highest duties. 5. Methods All non-exempt traders (or commission agents who acted on behalf of third parties) were supposed to declare all their non-exempt exports and imports. Contemporary sources (including French observers of Hamburg trade) emphasised that declarations were treated confidentially, and that the traders were generally trusted for the declarations they made. Port authorities did not double-check, e.g. by opening the packaging. This seems strange, but considering that Hamburg merchants were making the law in Hamburg, this may indeed have been the practise. There were many exemptions, for example: — since 1713, all transit trade (those goods not processed in Hamburg, and reshipped within 6 months) — since 1727, all exports handled by burghers of the City of Hamburg — since 1764, all exports of linen, yarns, ironware, copper Subject to duties was all factorage trade (including the portion handled by burghers) and all the trade handled by non-burghers (Dutch, Sephardim, Huguenots, traders from German hinterlands …). Even so, the records offer important insights into structures of trade and shifts over time, and the names of the major (and minor) traders. I cross-checked them with reports from French envoys (e.g. reports from Gérard L. Champeaux, Archives Diplomatiques Paris, CP Hambourg, 73, vol. suppl. 6 …), which offer figures coming close to those I generated from the port duty records. This may indicate that
Hamburg, 1728-1811
Champeaux obtained his figures from the very persons keeping the books – but Champeaux himself assumed these figures were not complete, because of exemptions, fraud, smuggling etc. Besides the merchandise the books also kept record of the ships, with information on tonnage, armament and destination. 6. Information The records include information both on the merchandises: name of receiving/dispatching trader, type of merchandise with vague information on quantity (package, bale, box, bundle …), value of item (in Mark banco), duty paid; and information on ships: name of the captain, duties paid on the ship (the amount depended on its destination), tonnage, and number of guns (a ship sailing far with poor guns paid more than a ship with strong armament). Yet, the source does not allow to attribute any merchandise to the ship transporting it. This was of no interest to the port authorities, and therefore not recorded. Both values and quantities of goods were recorded. The values were accepted on trust from the declaring merchant. The information on quantities was vague and unreliable: it cannot be used to check the values. There was no standardisation in quantity units nor in the name of goods (which depended, presumably, on what the merchant declared). Textiles, for example, were quantified in pieces, bales, boxes, chests, etc. There are many hundreds of different goods mentioned, all in German. The port of call of each item (which is not necessarily the product’s place of origin) had to be declared in order to determine the percentage to be paid, the data include geographical information. Hundreds of European ports are mentioned. 7. Availability A larger research project has produced a database (on the imports only, 1733-98); for availability please contact Prof. Markus Denzel, Universität Leipzig (
[email protected]) 8. Research questions The data have not been used to answer any significant research question treated on a larger scale, as far as I can judge. They could be used to assess:
267
268
Klaus Weber
— Hamburg’s role as a neutral port city in European maritime trade — The role of the Holy Roman Empire in eighteenth century Atlantic trade — The range & volume of goods imported & exported from German lands of the eighteenth century — The short-term variations (e.g. at breakout and end of war) in the turnover of port cities (and of maritime trade of entire nations) all over Europe. 9. Bibliography 9.1. Secondary works publishing and commenting the data Weber K. (1999), “Les livres douaniers de l’Amirauté de Hambourg au XVIIIe siècle, une source de grande valeur encore inexploitée,” Bulletin du Centre d’Histoire des espaces atlantiques, Nouvelle série, 9, 93–126. (a slightly extended German language version of this: “Die Admiralitätszoll- und Convoygeld-Einnahmebücher: Eine wichtige Quelle für Hamburgs Wirtschaftsgeschichte im 18. Jahrhundert”, Hamburger Wirtschafts-Chronik (2000), 1: 79–108. Schneider J., O.-E. Krawehl, M.A. Denzel, F. Schulenburg, (2001), Statistik des Hamburger seewärtigen Einfuhrhandels im 18. Jahrhundert, Nach den Admiralitäts- und Convoygeld-Einnahmebüchern, St. Katharinen, (contains many detailed tables, but few overviews).
IRELAND, 1698-1829 Patrick Walsh1 University College Dublin
Aidan Kane National University of Ireland, Galway
Eoin Tennisman InterTrade Ireland
1. Coverage Ireland over the period 1698-1829. Ireland and Britain entered a Customs union after the creation of the United Kingdom in 1801 a process only completed in 1826. As Peter Solar has noted, “whatever its economic advantages or disadvantages, it was a disaster for historians” (Solar, 277), removing one of the key long-run data series. Detailed agricultural statistics survive from 1847 onwards, while good figures for the linen trade are also available from the mid-nineteenth century onwards. 2. Documents The original data is available in a continuous series of 140 import and export ledgers detailing incoming and out going trade by out-port (Irish) and foreign countries incl. England, Scotland, East Country, France, United Provinces, Spain & Portugal, North American Plantations. These ledgers are found in the UK National Archives in London and have reference no. CUST15/1-140. We are currently digitising these volumes and creating an online database at www.duanaire.ie/ trade which will make them accessible to researchers and other interested parties. Unlike for England and Scotland, there are very few surviving Irish port books. There was no synthetic document produced at that time, but it will be possible to recreate the balance of trade from the CUST15 series. An attempt to do this has been made by Truxes for the period up to 1783.
1.
[email protected]
Revue de l’OFCE, 140 (2015)
270
Patrick Walsh
3. Institutional setting The Irish Revenue Commissioners collected and recorded this data, which was initially stored in Dublin and then transferred to London following the Customs Union of the 1820s. Various contemporary commentators published selections extracted from this material during the course of the eighteenth and early nineteenth centuries, but it has mostly remained unpublished in the original ledgers. As far as we understand the data were based on declarations at the port. These were then subject to checking by customs officers, although it is impossible to know how rigorous/accurate these ‘checks’ really were. The available Irish statistics like the Scottish and English/ British data should be regarded as a good representation of the flow of goods in and out of Irish ports.
4. Motivation As with the English records, the primary consideration lying behind the collection of this data was to understand the outflow/inflow of goods for revenue purposes. Accurate figures were necessary for this purpose, and the beginning date of the CUST15 series correlates with the beginning of the impressive CUST1 series of Irish revenue minutes, indicating that both exercises were linked to an increasingly professionalised bureaucracy (Walsh, 2013). The secondary purpose behind the collection of these statistics was to ascertain a better picture of the balance of trade as a measure of the wealth of the nation. Polemical economic commentators who sought to bemoan the state of the Irish economy, on occasion, used this data in their writings. See for example Arthur Dobbs, An Essay on the Trade and Improvement of Ireland (Dublin, 1729)
5. Methods Much has been made in some of the historical literature about the detrimental impact of smuggling on Irish eighteenth-century trade but Louis Cullen’s research, especially in French archives, has suggested that accounts based on contemporary comment (printed or otherwise) need to be treated with caution. Instead we would argue that like the British case, the increasing administrative capacity of the Irish state over time more than compensates for the losses incurred by smuggling or under declaration of goods.
Ireland, 1698-1829
In the absence of surviving port books it is impossible to completely cross-check the data. Some cross-checking is possible, especially with regard to the aggregate figures. Here we have been able to use other contemporary accounts, but this can only be done in a partial unsystematic way. Finally the prices used to measure value do not change sufficiently over time to be used as an accurate measure of price movements. 6. Information Each ledger contains a line-by-line account of the commodity level bilateral trade between Ireland and each of its trading partners. There are separate columns for each customs out-port recording the out/ inflow of each individual commodity. Each commodity is recorded in terms of its value and its quantity. Official prices were listed in Irish pounds [£1 (Irish) = 12/13 £1 (English)]. They were calculated on the basis of the price of Irish exports in the home ports and the supposed prices at which imports were purchased in ports abroad (Cullen, 1968, p. 182). However, foreign destinations/ports of entry are not listed systematically in the ledger. When it is mentioned, it is the first port of call/country, which is given. Also, values recorded did not include freight, insurance etc. A very wide range of measures were used, we have yet to codify these. Some comparison could be made with the price series created by Kennedy and Solar for Irish agricultural prices (Kennedy and Solar, 2007), which begin in the late eighteenth century. The list of goods changes over time, and we have as yet not had sufficient time to enumerate these and to measure their change over time. This however is possible to do. The Commissioners of the Revenue designated the categories of goods recorded and their names. Individual in-ports/out-ports are listed for the whole period. These changed very slightly over time as new customs posts were established/ old ones were abolished. 7. Projects We are currently digitising this data. In 2014 we received funding from the Irish Research Council to conduct a pilot study, which in turn led to the award of further funding from NUI Galway to digitise all the records up to c. 1783. Our intention is not only to digitise the original ledgers but also to create a freely accessible online database. The ulti-
271
272
Patrick Walsh
mate objective is to produce a digitally curated edition of the Irish import and export ledgers. Our work in progress can be seen at www.duanaire.ie/trade 8. Research This data has been used by to explore in detail Ireland’s trading relationship with Britain in Cullen’s path-breaking 1968 study, and with the American colonies in Truxes’ Irish American Trade. Historians of consumption have also used these records to good effect, to trace the import of luxury and other goods into Ireland. The wealth of data available in these records (one of the richest in Europe) offers the interested researcher a wealth of opportunities to study not only the Irish economy, Irelands role in the Atlantic imperial system, consumption patterns, but also to locate Ireland within a comparative context. We also hope that by digitising these records and making them available in a more usable format new research questions will emerge. 9. Bibliography 9.1. Primary sources UK National Archives, Kew, London CUST15 Irish Import and Export ledgers, 1698-1829 (140 volumes). CUST1Minutes of the Irish Revenue Commissioners, 1698-1823. National Library of Ireland Ms 353-76 Abstracts of Irish exports and imports, in 24 vols., for the period 1764-1823. Ms 689 Abstract of the trade of Ireland, 1698-1767. Ms 5584 Abstract of Trade between Great Britain and Ireland, 1698-1768. 9.2. Secondary works using the data Cullen, Louis, (1968), Anglo-Irish Trade, 1660-1800, Manchester. Cullen, Louis, (1972), An Economic History of Ireland Since 1660, London. Cullen, Louis, (2000), The Irish Brandy Houses of Eighteenth-Century France, Dublin. Cullen, Louis, (2013), Shovlin, John and Truxes, Thomas (eds) The Bordeaux-Dublin Letters, 1757: Correspondence of an Irish Community Abroad, Oxford. Dickson, David, (2005), Old World Colony: Cork and South Munster, 16301830, Cork.
Ireland, 1698-1829
Dickson, David, Ohlmeyer, Jane and Parmentier, Jan (eds), (2007), Irish and Scottish Mercantile Networks in Europe and Overseas in the Seventeenth and Eighteenth Centuries, Ghent. Gavin, Robert, Kelly, W.P., and O’Reilly, Dolores (eds), (2009), Atlantic Gateway: The Port and City of Londonderry since 1700, Dublin. Lammey, David, (1986), “The Irish-Portuguese Trade Dispute”, Irish Historical Studies, 25: 29–45. Legg, Mary Lou, (2012), “Irish wine: the import of claret from Bordeaux to provincial Ireland in the eighteenth century”, in Roy Foster and Raymond Gillespie (eds), Irish Provincial Cultures in the Eighteenth Century: Making the Middle Sort, Dublin. Leydon, Joseph, (1993-1994), “A Study of the Irish Cattle and Beef Trades in the Seventeenth and Eighteenth Centuries”, Journal of History and Politics, 11: 1–34. Mannion, John, (1988), “The Maritime Trade of Waterford in the Eighteenth Century”, in W.J. Smyth and Kevin Whelan (eds), Common Ground: Essays on the Historical Geography of Ireland Presented to T. Jones Hughes, Cork, 208–33. Nash, R.C., (1985), ‘Irish Atlantic Trade in the Seventeenth and Eighteenth Centuries’, in William and Mary Quarterly, 42: 329–56. Ó’Gráda, Cormac, (2001), Ireland: A New Economic History, 1780-1939, Oxford. O’Hearn, Denis, (2000), The Atlantic Economy: Britain, the U.S. and Ireland, Manchester. Solar, Peter M., (2003), ‘Irish Trade in the Nineteenth Century’ in David Dickson & Cormac Ó’Gráda (eds), Refiguring Ireland: Essays in Honour of L.M. Cullen, Dublin. Truxes, Thomas, (1988), Irish-American Trade, 1660-1783, Cambridge. Walsh, Patrick, (2013), “The Fiscal State in Ireland, 1691-1769”, Historical Journal, 56: 629–656. 9.3. Complementary sources Kennedy, Liam and Peter M. Solar, (2007), Irish Agriculture: A Price History from the Mid-Eighteenth Century to the end of the First World War.
273
NAPLES, SIXTEENTH CENTURY-1809 Daniela Ciccolella1 Consiglio Nazionale delle Ricerche - Istituto di Studi sulle Società del Mediterraneo
1. Coverage This questionnaire concerns the Kingdom of Naples over a period that goes from the sixteenth century to 1809, when the customs system changed completely. In 1806 (under French rule) private duties were taken over by the state and managed together with other duties by a new unified customs administration. In 1809 all the traditional duties were abolished and replaced by a single import/export duty that applied universally to the whole Kingdom. 2. Documents No documents (certificates, registers…) have been found to date concerning individual import-export operations of each consignment of goods (customs, date, name of trader/dealer, quantity and/or value of the imported/exported goods, duty collected). We do not know whether the records still exist because many archives are inaccessible to researchers or are simply unknown. The “original data” available include the annual documents (“statements” or rendiconti) which customs officials presented to the tax magistrate (Tribunale della Sommaria) for periodical administrative checks. These statements report the total revenue from the duties under their jurisdiction with, sometimes, further information as well. The revenue from specific duties (related to a single product category) makes it possible to estimate the quantity of imported/exported goods (with a certain margin of error since several regulations and customs practices allowed for customs exemptions for certain categories of shopkeeper/trader). For instance, Montaudo (2005) has reconstructed 1.
[email protected]
Revue de l’OFCE, 140 (2015)
276
Daniela Ciccolella
the export of olive oil during the eighteenth century; Ciccolella (2004) has reconstructed the imports of sugar to Naples during the period 1737–1797 using this kind of sources. However, tracing the latter poses numerous problems. The customs archives that have been discovered so far (and which can be consulted by researchers) concern certain customs authorities only and are extremely fragmentary. Even in the archives of the Tribunale della Sommaria the statements were not presented and/or kept properly/ systematically. Summary reports of annual imports/exports of single products were occasionally prepared (e.g. to plan customs duty reforms or to establish whether to forbid or encourage the trade of foodstuff). This information can be occasionally found in the numerous documentary sources of the secretaries of state and the consultative bodies of the Kingdom. Foreign trade balances were only produced for the years 1771 and 1772 at the request of an intellectual who intended to publish the data in his work entitled Nuova descrizione delle Sicilie. They were published in 1788 (cf. Galanti 1788; Ciccolella 2010). In it, detailed figures are given for 1771, while only totals of import/export values are given for 1772. Later on, periodic trade statistics were produced beginning only in 1810. Those have been partly rediscovered and published recently in Ciccolella (2013). 3. Institutional setting Until 1809: 1) There were hundreds of customs duties that varied by product and province. 2) Some customs duties were levied by the state, others privately. 3) The customs duties were levied by several authorities, which were completely independent of each other. Three large institutions had regional jurisdiction (the Customs Authorities of Naples, Apulia, and Calabria). They controlled numerous import and export duties of several types of products, but only in the provinces under their jurisdiction. Other administrative bodies were responsible for individual import/export duties on specific products (e.g. silk, oil, iron, etc.), for certain provinces or for the entire Kingdom. The individual customs authorities collected the information. Brief summaries were probably made by the general director of the Customs Authority of Naples, but they were not published.
Naples , sixteenth century-1809
4. Motivations The data was collected to: 1) ensure customs revenue and to restrict smuggling through extensive checks on the circulation of goods; 2) check the accounts of the customs authority. The customs data were used (and are occasionally available) in legal disputes (between owners/administrators of customs duties and tax authorities, between owners/administrators of customs duties and tax payers, etc.). 5. Methods The power of customs officials to check goods, especially for imports, varied according to the nationality of the shopkeepers/ traders: in some cases, they merely had to record specifications, while in others they could inspect documents on board ship and check the goods directly. On the basis of the customs data, only a few series of foreign trade statements for specific categories of products have been reconstructed. It is impossible to say whether they are truly representative of actual trade flows, because the data has not been cross-checked against other sources, but according to all contemporary observers smuggling was widespread (cf. Clemente 2013). The customs data can certainly not be used to reconstruct a series of prices because the customs operated according to constant values (see below). 6. Information The customs authorities recorded trade flows in quantity. Health and port officials (Health department and Harbor office) recorded the type of goods being transported by vessels but not their quantity or value (Damiani 2002). The value was calculated according to an old fixed tariff. It did not include transport costs and insurance. Prices have been reconstructed, but only for certain periods and products (e.g. Romano 1964). A dozen units were used in the records, including weight units and measurement units. There was no coherent list of categories of goods used to register the flows. The schedule of values/duties lists 2250 products. Customs officials probably “simplified” the recording of goods; in other words, they did not always take account of the differences in quality or provenance of similar products. For example, the tariff included 11 entries for sugar
277
278
Daniela Ciccolella
but in the customs records only a distinction between “white” and “red” (brown) sugar was made (Ciccolella 2004). Customs officials did not record the provenance/destination of the goods (unlike health and port officials). However, different duties were paid for some goods according to their provenance/area of production. In these cases, the provenance was recorded as being “incorporated” with the name of the goods (e.g., “cheese from Sardinia”, “cheese from Rome”, etc.). 7. Availability The data have not been digitized. 8. Bibliography 8.1. Primary sources Archivio di Stato di Napoli, Arrendamenti (archives of the authorities of several types of customs duty). Archivio di Stato di Napoli, Regia Camera della Sommaria, Dipendenze (archive of the auditors’ board of the customs authorities). Archivio di Stato di Napoli, Regia Camera della Sommaria, Dipendenze, II s., vol. 74 (Tariff of values of imported and exported products). 8.2. Secondary works publishing and commenting on the data G.M. Galanti (1788), Nuova descrizione storica e geografica delle Sicilie, t. II, nel Gabinetto Letterario, Napoli. D. Ciccolella (2010), “Statistica e riforme tra ancien régime e rivoluzione. Giuseppe Maria Galanti e il Bilancio del commercio esterno del Regno di Napoli”, Storia economica, XIII, (3): 265–318. 8.3. Secondary works using the data D. Ciccolella (2004), “Un genere pressocché necessario”. Consumo, politiche e industria dello zucchero nel Regno di Napoli in età rivoluzionaria e napoleonica”, Storia economica, VII, (2-3): 263–314. D. Ciccolella (2013), “Il commercio estero”, in Il Mezzogiorno prima dell'Unità. Fonti, dati, storiografia, (eds.) P. Malanima and N. Ostuni, Rubbettino, Soveria Mannelli: 231–256. A. Di Vittorio (1969-1973), Gli Austriaci e il Regno di Napoli 1707-1734, 2, Giannini, Napoli. G. Fenicia (1996), Politica economica e realtà mercantile nel Regno di Napoli nella prima metà del XVI secolo (1503-1556), Bari. M. Gangemi (1991), Esportazioni calabresi nel XVIII secolo. Le tratte di « seccamenti salumi tavole legnami ed altro », Esi, Napoli. A. Montaudo (2005), L’olio nel regno di Napoli nel XVIII secolo, Esi, Napoli.
Naples , sixteenth century-1809
8.4. Complementary sources A. Clemente (2013), “Quando il reato non è ‘peccato’ : Il contrabbando nel Regno di Napoli tra conflitti diplomatici, pluralismo istituzionale e quotidianità degli scambi (XVIII secolo)”, Quaderni storici, XLVIII, (2): 359–394 (about smuggling). C. Damiani (2002), Il movimento mercantile del porto di Napoli nella seconda metà del XVIII secolo, PhD on Economic history, 12th cycle, Naples (about institutions involved in collecting data on navigation). L. De Rosa (1958), Studi sugli arrendamenti del Regno di Napoli. Aspetti della distribuzione della ricchezza mobiliare nel Mezzogiorno continentale (16491806), L’arte tipografica, Napoli. R. Romano (1965), Prezzi, salari e servizi a Napoli nel secolo XVIII (17341806), Banca Commerciale Italiana, Milano (on prices).
279
LIVORNO, 1680-1845 Mathieu Grenet1 CUFR Jean-François Champollion – Albi
1. Coverage This questionnaire discusses Livorno (Leghorn in 18th century English spelling), the main port-city of the Grand Duchy of Tuscany. The first registries of entries in the port of Livorno date back to 1680 – while Braudel and Romano 1951 reconstructed reliable data for 12 years in the second half of the 16th century (1573-74, 1577-85, and 1590-93). According to Filippini (vol. I, p. 23), the post-1737 (that is, the transfer of Tuscany to the Lorraine family after the Medici dynasty was extinct) registries went lost, “maybe due to negligence or lack of interest on the part of the new administration”. However, Filippini was able to retrieve two tables summarizing the information for the years 1737-1750. He then used “general tables of the merchant ships entering the port of Livorno” for the years 1751-1843, which he crossed-checked with Repetti 1833-1846, as well as with other data series related to freights and insurance of ships entering the port of Livorno (mainly “portate di mercanzie” e “portate di sanità”). There are no data for exports. 2. Documents 1680-1737: 49 registers of “Avvisi di mare e portate dalla bocca del porto”, kept in the Archivio di Stato di Firenze (Mediceo del Principato, 1542-1561, 1612-1626, 1627-1632, 2301-2309). The period from April 1720 through December 1722 is missing. 1737-1750: 2 tables kept in the Archivio di Stato di Firenze (Reggenza, 800). 1751-1843: “Prospetto generale dei bastimenti mercantili giunti nel porto di Livorno dal 1751 a tutto il 1843” (Archivio di Stato di Livorno) and Repetti 1833-1846 (vol. II, p. 768, “Nota sommaria dei bastimenti a vela quadra e latina entrati nel Porto di Livorno”). 1.
[email protected]
Revue de l’OFCE, 140 (2015)
282
Mathieu Grenet
Synthetic tables were produced on a yearly basis for the years 1700-1737.
3. Institutional setting For the period 1680-1737, the Capitano della Bocca del Porto and the Provveditore della Dogana in Livorno, and the Segretario di Stato alla Guerra in Florence were responsible for the registers. Their relative responsibilities are still to be clarified. The Capitano del porto presided over the Ufficio della Bocca del porto, and exercised government and police functions in the port. The Provveditore della Dogana was in charge of all matters related to the custom system of the port, and was considered one of the city’s first-rank officials. The function of Provveditore della Dogana disappeared in 1740, following the subcontracting of the states revenue: the contractors took over the Provveditore’s administrative duties, and the Auditore his judiciary ones. As the subcontracting system came to an end in 1768, Livorno’s custom was placed under the supervision of the General Administrators (Amministratori generali) in Florence.
4. Motivations During the Medici period, registers were sent to the Segretario di Stato alla Guerra in Florence, who headed the department in charge (among other things) of Livorno’s administration – which in turn testifies for the mostly military interest the city had in the eye of the Grand Duchy’s ruling family. Under the Lorraine dynasty, relationships between Livorno and Florence became somewhat more articulate, with administrative registers being sent to specific magistratures instead of being centralized by the Segretaria di Guerra.
5. Methods For the period 1680-1737, the data was collected by the Capitano della Bocca del Porto in Livorno, on the basis of estimates from the stagliatore, an official in charge of assessing the type of ships and the value of goods entering the port. By the end of the 18th century, the Dogana printed daily avvisi reporting on port arrivals and exchange rates. And every year, the Provveditore della Dogana sent to the Grand Duchy’s Segretario di Stato alla Guerra in Florence reports and tables synthesizing the data, as well as other information related to Livorno’s custom system.
Livorno, 1680-1845
Historians working on this material (Filippini 1998, Addobbati 2007) have established its fairly good reliability to calculate the volume of trade entering Livorno during the period under consideration. There are some discrepancies between the original material from the late 18th century and the figures produced by Repetti for the period 17661837 (vol. II, p. 768, “Nota sommaria dei bastimenti a vela quadra e latina entrati nel Porto di Livorno”). However, most of Filippini’s series are convergent with the numbers produced in the 18th century by Pietro Bernardo Prato in his 63-volumes manuscript Giornale della Città e del porto di Livorno (Biblioteca Labronica, Livorno), in which the author kept track of the entries of ships in the port of Livorno on a daily basis between 1764 and 1813 (in turn relying on the Dogana’s printed avvisi). Eventually, Andrea Addobbati’s analysis of data related to the maritime insurance market (mostly drawn from the Archivio di Stato di Livorno’s Sicurtà series) constitute a major breakthrough in the city’s maritime business history (Addobbati 1996 and 2007). Most prominently, Addobbati produced a complete, year-by-year series of insurance prices for the period 1693-1815, which allows for a unique perspective over Livorno’s maritime business during the 18th century. 6. Information The registers include information on the number, type, port of departure, flag and freight of the ships entering the port of Livorno. Depending on the period, we have information on the values and quantities of traded goods, but most of the data are related to ships. Values were assessed by the stagliatore (see above); according to one source, the stagliatore based his estimates on his measurement of the ship’s dimensions in cubic feet2. However, further research is required about how this work was carried out, and what kind of expertise was required in case one or more party disagreed with the estimate. There are no convenient price source that could be used to check his assessments. Many different currencies and units were used. Filippini (1998, vol. I, p. 25-26) suggested to convert them all into one unit, so as to be able to compare the different values; yet his system remains rather empirical. 2. Lorenzo Cantini and Domenico Nenci, Tesoro del Foro Toscano, o sia Raccolta delle decisioni del Supremo Consiglio di Giustizia e delle Regie Ruote civili, Florence, Stamperia del Giglio, 1825, vol. XI, p. 448.
283
284
Mathieu Grenet
The names of the goods were given in Italian. Some categories varied from one period to the next, while some remained rather stable (grano/wheat, cotone bianco/white cotton, cotone greggio/raw cotton, etc.). Several dozens of different goods are mentioned. It is not clear who decided on the designation. Presumably the stagliatore, but merchant-captains might have played a role too. Dozens of different geographical entities are mentioned in the data: see an example in Figure 1. Figure 1. The source for Livorno in 1795
7. Availability The data were first collected by Jean-Pierre Filippini, who published several figures synthesizing the original data (Filippini 1998, vol. I, p. 21-73, and vol. II, p. 149-153). Addobbatti 2007 and Tazzara 2011 also contain useful figures to balance Filippini's estimates. 8. Research questions Filippini’s main interest was to calculate the volume of maritime trade entering the port of Livorno in the 18th century. He therefore primarily used the data in a “quantitativist” perspective, paying scant attention to individual figures.
Livorno, 1680-1845
It would be extremely useful to cross-check the data with the few surviving archives of the Livorno customs, that kept track of commercial transactions in the port-city (for instance to calculate the fiscal benefits of maritime trade). Unfortunately, the rich Dogana series from the Archivio di Stato di Livorno were lost in the 19th century, probably on the occasion of a partial reorganization of the city archives in 1877. However, we can use the statistical series elaborated by Andrea Addobbati and Lucia Frattarelli Fischer on the basis of the archives of the Soprassindaci e Sindaci poi Ufficio delle revisioni e sindacati (kept in the Archivio di Stato di Firenze), a magistrature in charge of controlling the activities and accounts of the Dogana. In particular, the series of the stallaggio duty3 were published by historian Andrea Addobbati (2007, especially the tables p. 88, 92 and 99), and recently used by Corey Tazzara (2011).
9. Bibliography 9.1. Primary sources Archivio di Stato di Firenze, Mediceo del Principato, “Lettere ricevute da Livorno dai Segretari di Stato alla Guerra”, n. 1542-1561 (years 16741699), 1612-1626 (1698-1713), 1627-1632 (1714-1720), and 2301-2309 (1723-1737), “Avvisi di mare e portate dalla bocca del porto”, 16801737. Archivio di Stato di Firenze, Reggenza, n. 648 (1745-1763) and 800 (17371750). Archivio di Stato di Firenze, Appalto generale delle regie rendite (1740-1768). Archivio di Stato di Livorno, Dogana, “Rescritti e ordini”, 26 files for the period 1633-1799, with gap 1654-1701. Archivio di Stato di Livorno, Sanità, “Miscellanea di Sanità”, f. 333, ins. 620, “Prospetto generale dei bastimenti mercantili giunti nel porto di Livorno dal 1751 a tutto il 1843”. Archivio di Stato di Livorno, Ufficio di Sicurtà, n. 1-148 (Scritte di Sicurtà, 1763-1861; very thorough information on insurance prices for the years 1763-1861), and n. 149-159 (Riscontro delle Sicurtà e delle Polizze, rather incomplete data for the years 1729-1762). 3. LoRomer 1987, p. 20-21: “A series of peacemeal customs’ reforms which began in 1451 culminated in a decree by Cosimo III (11 March 1675) abolishing the gabelles on most goods entering Livorno by sea and instituting in their place a small, fixed duty called the stallaggio. Having paid this charge, a merchant could introduce his goods into the city and sell, store, or refine them, then reexport them by sea without undergoing any further fiscal obligation. This provision provided the juridical basis for Livorno’s existence as a free port.”
285
286
Mathieu Grenet
Biblioteca Labronica (Livorno), Giornale della Città e del porto di Livorno by Pietro Bernardo Prato (63 volumes, 1764-1813). Repetti, E., Dizionario geografico, fisico, storico della Toscana: contenente la descrizione di tutti i luoghi del Granducato, ducato di Lucca, Garfagnana e Lunigiana, Florence, presso l’autore e editore, 1833-1846, 6 vol. (especially, Vol. II, p. 768). 9.2. Secondary works publishing and commenting the data Addobbati, A., (1996), “Il negozio della ‘Sicurtà’ marittima a Livorno (sec. XVIII)”, Nuovi Studi Livornesi, 4, 9–63 (the appendix features year-byyear tables of insurance coverage). Addobbati A., (2007), Commercio rischio guerra. Il mercato delle assicurazioni marittime di Livorno (1694-1795), Rome, Edizioni di Storia e Letteratura. Braudel, F. and R., Romano, (1951), Navires et marchandises à l’entrée du port de Livourne (1547-1611), Paris, Armand Colin (especially tables 98–132). Filippini, J.-P., (1998), Il porto di Livorno e la Toscana (1676-1814), Naples, Edizioni Scientifiche Italiane, 3 vol. (especially Vol. I: 21–73, and Vol. II: 149–153). LoRomer, D. G., (1987), Merchants and Reform in Livorno, 1814-1868, Berkeley, University of California Press. 9.3. Secondary works using the data Baruchello, M., (1932), Livorno e il suo porto. Origine, caratteristiche e vicende dei traffici livornesi, Livorno, Soc. An. Editrice Riviste Tecniche, 1932. Carranza, N., (1970), “La crisi del porto di Livorno nel periodo del dipartimento del Mediterraneo”, Bollettino Storico Pisano, 39: 173–188. Ciano, C., (1969), “A proposito della ‘Fortuna di mare’ e delle origini delle assicurazioni marittime”, Economia e storia, 4: 373–397. Ciano, C., (1976), La sanità marittima di Livorno nell’età medicea, Pisa, Pacini. Frattarelli Fisher, L., (1997), “Merci e mercanti nella Livorno seicentesca, ‘Magazzino d’Italia e del Mediterraneo’”, in Silvana Balbi De Caro (dir.), Merci e monete a Livorno in età granducale, Milan, Silvana, 65–90. Frattarelli Fischer, L., (1993), “Livorno 1676: la città e il porto franco”, in Franco Angiolini, Vieri Becagli and Marcello Verga (dir.), La Toscana nell’età di Cosimo III, Florence, Edifir, 45–66. Marzagalli, S., (1999), “Les Boulevards de la fraude”. Le négoce maritime et le Blocus continental, 1806-1813. Bordeaux, Hambourg, Livourne, Villeneuve d’Ascq, Presses Universitaires du Septentrion. Tazzara, C., (2011), The Masterpiece of the Medici: Commerce, Politics, and the Making of the Free Port of Livorno, 1574-1790, Ph.D. diss., Stanford University.
Livorno, 1680-1845
10. Complementary sources Notarial records might of course be of great help in assessing the value of goods that entered Livorno by ship, although it is unlikely they can ever help to reconstitute the whole volume of trade that transited through the city-port. A list of some of the most prominent notaries active in 18th century Livorno is available in Filippini 1998, vol. I, p. 256.
287
MILAN, 1762-1790 Giovanna Tonelli1 University of Milan
1. Coverage The archives concern Western part of Lombardy (one of the administrative regions of the Italian Republic): the State of Milan during the Modern Age (capital Milan; cities of the State: Como, Pavia, Lodi, Cremona) over the second half of the eighteenth-century. 2. Documents Balances of trade are available for the following years: 1762 (published in 1765; available); 1766 (available); 1767 (available); 1769 (published in 1773; available); 1778 (published in 1783; available); 1790 (published in 1791; available). 3. Institutional setting Before 1771 in the State of Milan there was no institution that registered the flows of goods at the entry and exit. From 1771 on there was a State office (l’Ufficio di revisione daziaria) that checked the customs’ account books. From the Middle Age to 1750 the collection of customs’ duties was rented to private collectors, from 1750 to 1770 to a company that mixed private collectors and the state. There are no archives left from the private collectors (only a section of one of the companies is still in existence). The customs’ account books were usually thrown away after a few years. The balance of trade of 1762 was published by Pietro Verri. He used the information on trade from the employees who worked for the private collectors. The relationship between the private collectors and Pietro Verri was of “odio cortese”: kind hatred. They had to work together, but: — Pietro Verri wrote about the dishonesty of the private collectors that gained staggering amounts of money in the business; 1.
[email protected]
Revue de l’OFCE, 140 (2015)
290
Giovanna Tonelli
— of course, the private collectors were against him; they called him “il Contino”: the little Count. The balances of trade of 1766 and 1767 were published by Gian Rinaldo Carli while he was working in a State institution: the Supremo Consiglio di Economia. The balance of trade of 1769 was published by Pietro Verri when he worked in another administration: the Magistrato Camerale. The balances of trade of 1778 and 1790 where published by State employees who worked for the private collectors. The institutions involved were: Magistrato Camerale, Camera dei Conti, Intendenza di Finanza. The relations between the State institutions involved in the publication of the balances of trade of 1766-67, 1778 and 1790 were good. 4. Motivations The balances of trade from the 1760s and 1770s were drawn with the purpose of reforming the custom duties. The 1790 balance of trade was made to check the results of this reform. 5. Methods The data were collected from the customs’ account books. From what the producers of the balances of trade said, several problems seems to have been existed:
1. Some customs’ account books were lost; 2. Some goods were not registered because some goods were duties free. Only the import and export of goods that pay the “Datio della Mercantia” (duties on import and export) were recorded. Important goods were excluded such as salt, tobacco, several live animals (they paid local duties) and grains, the most important good for the Milanese trade. Until 1786, grains were exported only under licence from the State office of food supply; after 1786 without licence only for short periods. For all these goods the State employees who produced the balances of trade used sources produced by State offices or by the municipalities of the State. With these sources, they could do only rough estimates. 3. The customs agents were ignorant and sometimes corrupt.
Milan, 1762-1790
4. Smuggling is assessed at rough one quarter of the total amount of goods, but it is by nature difficult to specify. Also, before 1770 the official customs tariffs were the highest duties collected and there were paid only by occasional travellers. Merchants usually negotiated a flat tariff with the tax collector and they paid by the terms of their specific agreement. The quality of the balances of trade documents was checked by Moioli who made a comparison of the data in 1769, 1778 and 1790. Moioli worked on the goods whose value (import or export) was 50.000 lire milanesi or more. 139 categories of goods matched his criteria: their value represented more than 90% of the value of the whole balance. 6. Information For 1762, the data on imports to the State of Milan are available both in quantity and value. The price (or better the value) of the goods was fixed by the employee who produced the balance of trade. Four merchants checked it. It was the average prices of the last 10 years “at the borders of the State”, meaning according to Pietro Verri, “the selling price without the taxes and the gain of the merchant”. A comparison between these values used in the balance and the selling prices tell us that values used in the balance are 1/3 of the selling prices2. For 1766 and 1767, bilateral flows to and from the State of Milan (in value) are available for: — Tuscany; — France; — Parma and Modena; — Piedmont; — Mantua; — Republic of Venice; — Republic of Genoa; — Romagna; — Oltremonte and Oltremare; — Switzerland and Grigioni. 2. Sources for the selling prices are the receipts of payment of the expenses of Pietro Verri’s family, the employee who produced this balance of trade, preserved in his private archive: Fondazione Raffaele Mattioli per la Storia del Pensiero economico – Milano – Archivio Verri, cart. 2.
291
292
Giovanna Tonelli
For 1769, data on import and exports from and to the State of Milan (without information on countries and ports) are available in value only. For 1778 (both value and quantities): — Import and export data: State of Milan/rest of the world; — Transit; — Import and export between the provinces of the State of Milan. — According to Baldassarre Scorza, the prices were the average price of the last 10 years. For 1790, data on import and exports from and to the State of Milan (without information on countries and ports) are available. Only quantities were recorded. The method used to compute prices is unknown for 1767-1769. Values are expressed in Lira Milanese throughout. The quantity units are numerous such as braccio, rubbo, libbra grossa, libbra piccola and so on3. The categories of goods were defined by the state institutions and the employees that produced the balances of trade. Their number is quite high. There are some indications on the origins or the destinations of the goods in the preface of the various balances of trade, in the archives of Pietro Verri and in some documents preserved in the State Archives of Milan, the Archives of the Chambers of Commerce of Milan or in the Archive of the Municipalities of Milan. Besides this, there are some information available on the trade between the State of Milan and the ports of Trieste and Nice in the state archives as well. 7. Publication All the balances, with the exception of that of 1790, were published at least in part.
8. Research questions The balances of trade were used to document the economy and the trade of the State of Milan and, more specifically, the luxury trade. 3. The main resource to compute these units into modern measures is: A. Martini, Manuale di metrologia ossia misure, pesi e monete in uso attualmente e anticamente presso tutti i popoli, Loescher, Torino 1883.
Milan, 1762-1790
9. Bibliography 9.1. Primary sources Verri, P., (1932), Bilanci del commercio dello Stato di Milano, a cura di L. Einaudi, La Riforma Sociale, Torino. — (1938a) Discorsi inediti di Baldassarre Scorza sui bilanci commerciali dello Stato di Milano e sui porti di Trieste e di Nizza, Biblioteca Ambrosiana, Firenze. — (1938b), Compendiosa relazione del Commercio dello Stato di Milano, col confronto della attività, e passività di esso, apparente nei Generali Bilanci degli anni 1762, e 1766 umilissimamente rassegnate alla S.C.M. dal Presidente G.R.Carli col permesso della medesima M.S., in Saggi inediti di Gian Rinaldo Carli sull’economia pubblica dello Stato di Milano, a cura di C.A. Vianello, Olschki, Firenze, 143–162. — Rapporto al Governatore di Milano sul Bilancio di esportazione e importazione del 1767, ivi, 165–172. Verri, P., (2006-2007), Bilanci del commercio dello Stato di Milano, a cura di G. Tonelli, in Edizione nazionale delle opere di Pietro Verri, Edizioni di Storia e Letteratura, Roma 2003-, prima serie, 6 voll., vol. II: Scritti di economia, finanza e amministrazione, a cura di G. Bognetti, A. Moioli, P. L. Porta, G. Tonelli, (2)I: 487–648. 9.2. Secondary works publishing and commenting the data The prefaces by the editors of the balances of trade published from the 1930s to 2006. 9.3. Secondary works using the data Moioli, A., (1983), Note sulla struttura del commercio estero dello Stato di Milano nella seconda metà del Settecento, in Studi in onore di Gino Barbieri, IPEM edizioni, Pisa, (3)II: 1049–1082. Capra, C., (1984), Il Settecento, in Il Ducato di Milano dal 1535 al 1796, a cura di D. Sella – C. Capra, Utet, Torino, 471–473. Tonelli, G., (1997), “Baldassarre Scorza e la riforma daziaria nella Lombardia asburgica”, Nuova economia e storia, I: 25–68. Moioli, A., (1999), “Pietro Verri e la questione della riforma daziaria nello Stato di Milano”, in Pietro Verri e il suo tempo, a cura di C. Capra, Cisalpino, Bologna, (2)II: 853–933. Moioli, A., (2006-2007), Nota introduttiva alla sezione II: Bilanci del Commercio dello Stato di Milano, in Edizione nazionale delle opere di Pietro Verri, Edizioni di Storia e Letteratura, Roma 2003-, prima serie, 6, II: Scritti di economia, finanza e amministrazione, a cura di G. Bognetti, A. Moioli, P. L. Porta, G. Tonelli, (2)I: 457–486. Tonelli, G., (2007), “Commercio di transito e dazi di confine nello Stato di Milano fra Sei e Settecento”, in Per vie di terra. Movimenti di uomini e di
293
294
Giovanna Tonelli
cose nelle società di antico regime, a cura di Angelo Torre, FrancoAngeli, Milano, 85–108. Tonelli, G., (2009), “Considerazioni sul lusso» nella riforma daziaria dello Stato di Milano (seconda metà del XVIII secolo)”, in Modelli da imitaremodelli da evitare. Discussioni settecentesche su ricchezza e povertà, morale e commercio negli antichi stati italiani, a cura di A. Alimento, Edizioni di Storia e Letteratura, Roma, 271–293.
NETHERLANDS, 1753-1809 Werner Scheltjens Universität Leipzig
1. Coverage This questionnaire discusses the Northern Netherlands from 1753 to 1809. The polities governing this region were first the Dutch Republic, then the Batavian Republic and finally the Kingdom of Holland. Data collection on that region resumed after 1815 by StatesGeneral. For details, see: Dutch National Archives (further NA), Staatssecretarie, No. 6551 (1817/1819); NA, Staatssecretarie, No. 6441 (1822); Drieling, Bijlagen, appendices; Verzameling van Staten (1827, 1829, 1843); Handelingen van de Staten-Generaal (1839-1844); Statistiek van den Handel en de Scheepvaart (1846-1850).1 2. Documents Three types of data are commonly used to describe the economic history of the Dutch Republic: 1) Statistieken van in- en uitvoer (import and export trade statistics); 2) Convooien en Licenten (convoy and licent duties); 3) registrations of ships arriving at or departing from ports in the Dutch Republic. The first type is the least often available, yet represents in fact the only available ‘real’ trade statistics.2 The second type covers longer periods of time, but has strong limitations regarding its use and reliability.3 The third type is more abundantly available but again has strong limitations regarding its use and reliability.4 Regardless of their limitations, these are the statistical data that are used most frequently. 1. 2. 3. 4.
Based on E. Horlings, The Economic Development, 70. Joh. De Vries, De economische achteruitgang der Republiek in de achttiende eeuw, 1959, 24. For a description, see: Joh. De Vries, De economische achteruitgang, 19–24. For a description, see: Joh. De Vries, De economische achteruitgang, 24–29.
Revue de l’OFCE, 140 (2015)
296
Werner Scheltjens
In this questionnaire, I will limit the focus to the ‘real’ external trade statistics. The following statistics, which have been published more or less extensively, are available: 1753: The Meuse, published in Dobbelaar (1921). Statistics of imports and exports via the towns that fell under the jurisdiction of the Admiralty of The Meuse in 1753. These towns are: Rotterdam, Dordrecht, Schiedam at the sea side, and Nijmegen, Den Bosch and Lillo at the land side. It contains a breakdown of goods, the quantities that entered and left the ports of the Admiralty of the Maas and their respective values. It does not contain information about the origin or destination of goods. 1753: Amsterdam, published in Nanninga (1952). Statistics of imports and exports via the towns that fell under the jurisdiction of the Admiralty of Amsterdam in 1753 (Amsterdam and other offices or buiten-comptoiren). Contains a breakdown of goods and the quantities or values that entered and left the ports under jurisdiction of the Admiralty of Amsterdam. It does also contain information about the origin or destination of goods. It contains a 'totals' column per product. Totals are specified separately for Amsterdam and the other offices of the Admiralty. 1774: Amsterdam, published in Posthumus (1913). Products and their quantities imported and exported from the port of Amsterdam in 1774, as registered by the Office of Convoy and Licent duties (Comptoir van Convooien en Licenten). This includes neither directions, origins, nor values. 1784-1793: The Meuse, published in Joh. De Vries (1961/62-1963/ 64). Statistics of imports and exports via the towns that fall under the jurisdiction of the Admiralty of The Meuse in 1784-1793. It contains a breakdown of goods and the quantities or values that entered and left the ports under jurisdiction of the Admiralty of The Meuse. It also contains information about the origin or destination of goods, and a 'totals' column per product. 1789-1793 and 1796-1799: Amsterdam, published in Van Nierop (1915 and 1917). Statistics of imports and exports via the towns that fall under the jurisdiction of the Admiralty of Amsterdam (Amsterdam and other offices or buiten-comptoiren). Contains a breakdown of goods and the quantities or values that entered and left the ports under jurisdiction of the Admiralty of Amsterdam. Does also contain information about the origin or destination of goods. Contains a 'totals' column per
Netherlands, 1753-1809
product. Totals are separately specified for Amsterdam and other offices of the Admiralty. 1803-1809: Batavian Republic, Kingdom of Holland, published in Alphonse (1900). The original can be found in Gogel, Memoriën, supplement. These are the only import and export trade statistics that cover the entire territory of the Batavian Republic (later Kingdom of Holland). The tables only contain aggregated values, in francs, per product. No origins or destinations are mentioned. The original data for these publications are available in the form of archival records. 1753 Rotterdam: National Archives, 1.01.46 Admiraliteitscolleges, I Archief van het College der Admiraliteit op de Maze, Inv. Nr. 1892 (old number). 1753 Amsterdam: National Archives, 1.01.46 Admiraliteitscolleges, II Archief van het College der Admiraliteit te Amsterdam, Inv. Nr. 1795. 1774: Royal Library Copenhagen, Sign. Ny Kgl. S., 8, 178b, Lijst der ingekomen en verzonden goederen volgens de aangevinge daarvan gedaan ten Comptoire der Convoyen en Licenten binnen Amsteldam, in den jaare 1774. Gebragt op eene alphabetische orde, zijnde de goederen, die bij de waarde betaalen, bij de waarde, en die, welke bij het gewigt betalen, bij het gewigt gesteld.5 1784-1793: National Archives, 1.01.46 Admiraliteitscolleges, I Archief van het College der Admiraliteit op de Maze, Inv. Nrs. 691–703. 1789-1793 and 1796-1799: National Archives, Archief der Admiraliteitscolleges, II Archief van het College der Admiraliteit te Amsterdam 1795-1799. 1803-1809: See: Gogel, Memoriën, supplement. As far as I know, no separate balances of trade were produced at the time. 3. Institutional setting The different responsible institutions were: 1753: Admiralty of Amsterdam; Admiralty of The Meuse 5.
Signature and title of the document are taken from Posthumus, “Statistiek,” 517–519.
297
298
Werner Scheltjens
1774: Office of Convoy and Licent Duties of Amsterdam 1784-1793: Admiralty on The Meuse 1789-1793; 1796-1799: Admiralty of Amsterdam (Collegie ter Admiraliteit te Amsterdam en de buiten-comptoiren onder het ressort van denzelven) 1803-1809 : The customs office of Holland at the Ministry of Finance (of the Kingdom of Holland). Evaluation of each good was done by the Chamber of Commerce of the City of Amsterdam. 4. Motivations The goal of the Admiralties was to get a better insight into the structure and volume of Dutch commerce, which could be used to take appropriate fiscal measures as well as to improve the Republic’s economic policies.6 1803-1809 : These data were collected during the time of the Batavian Republic (1795-1806) and the Kingdom of Holland (1806-1810). The goal was to get an insight in Dutch commerce in the first decade of the nineteenth century. 5. Informations Only the 1803-1809 statistics are measured in values of individual goods. The other statistics contain either values or quantities, measured in different units of measurement, depending on the type of product that is being measured. Only the 1753 Meuse register contains both values and quantities for some of the listed goods. The classical source for finding comparable prices still is: N.W. Posthumus, Nederlandsche Prijsgeschiedenis, Leiden 1943. The number of different goods mentioned by each source is as follows: 1753 Meuse: 463 ; 1753 Amsterdam: imports 213 and exports 231; 1774 Amsterdam: 224; 1784-1793 Meuse: no visu; 1789-1799 Amsterdam: imports 241 and exports 235 and 1803-1809: 315. The goods are all listed in Dutch and were probably chosen by the Admiralties. There does not seem to be any a priori coherent list. 6. Van Nierop, “Uit de bakermat der Amsterdamsche handelsstatistiek,” // Jaarboek van het genootschap Amstelodamum, 1915, XIII, 109.
Netherlands, 1753-1809
The 1753, 1784-1793, 1789-1793 and 1796-1799 registers include broad geographical categories (ten in the case of the Amsterdam Admiralties). No geographical classification is included in the 1774 and 1803-1809 registers. There is a separation in the 1753, 1774, 17841793, 1789-1799 registers between the main office and the outer offices (buitencomptoiren) of the respective Admiralties.
6. Availability Dobbelaar P.J., (1921), “Een statistiek van den in- en uitvoer van Rotterdam c.a. in 1753,” Economisch-Historisch Jaarboek, 7: 210–230. Nanninga, (1952), Bronnen tot de geschiedenis van den Levantschen handel III 1727-1765, Hoofdstuk XII: De in- en uitvoer van Amsterdam in 1753, 650–701. Posthumus N.W., (1913), “Statistiek van den in- en uitvoer van Amsterdam in het jaar 1774,” Bijdragen en Mededelingen van het Historisch Genootschap, 516–528. Van Nierop L., (1915), “Uit de bakermat der Amsterdamsche handelsstatistiek,” Jaarboek van het genootschap Amstelodamum, XIII, 105–172. Van Nierop L., (1917), “Uit de bakermat der Amsterdamsche handelsstatistiek,” Jaarboek van het genootschap Amstelodamum, XV, 35–110. De Vries, Joh. (ed.), (1961-1962), “De Statistiek van in- en uitvoer van de Admiraliteit op de Maaze, 1784-1793,” Economisch-Historisch Jaarboek, 29, 188–259; 1963-1964, 30, 236–307. D’Alphonse F.J.B., (1900), “Eenige hoofdstukken uit het Aperçu sur la Hollande,” Bijdrage tot de Statistiek van Nederland. Nieuwe Volgreeks 1, Chapitre VI: Commerce, Importations et Exportations (1803-1809), 384–401. J.M. Gogel, Bijvoegsel bij I.J.A. Gogel, (1844), Memoriën en Correspondentiën, bevattende de algemeene Staten van den aangegeven in-, uit- en doorvoer van de jaren 1802-1809 en 1814-1816, s.l. Some of these are readily available in MDB or DBF format. editor: G.M. Welling downloadable at: www.let.rug.nl/~welling/paalgeld/appendix.html note: The names that Welling gave to these databases are somewhat confusing. Rather than covering 'The Netherlands', they cover Amsterdam.
299
300
Werner Scheltjens
7. Bibliography 7.1. Secondary works using the data Morineau M., (1965), “La Balance du commerce franco-néerlandais et le resserrement économique des Provinces-Unies au XVIIIe siècle,” Economisch-Historisch Jaarboek, 30, 170–235. Horlings E., (proefschrift 1995), The economic development of the Dutch services sector 1800-1850. Statistics of imports and exports from the port of Rotterdam in the years 1762-1764 may be added to the list.7 However, these statistics are incomplete. Another possible source is: Brugmans et al., Statistieken van de Nederlandse nijverheid uit de eerste helft der negentiende eeuw, ’s-Gravenhage 1956 (RGP 98-99). [digitized], from which trade statistics may possibly be extracted. The logical starting point for any statistical research in the first half of the nineteenth century is Horlings’ study on The economic development of the Dutch services sector 1800-1850. Prices: References for the period after 1800 can be found in Horlings, The Economic development, 76–77.
7. Nationaal Archief, XXXVII no. 477: Statistiek van in- en uitvoer van Rotterdam voor de jaren 1762-1764 (incomplete).
NORWAY, 1731-1795 Ragnhild Hutchinson1 The Norwegian Institute of Local History
1. Coverage This questionnaire discusses the historical trade statistics available in Norway. They can be found for each of the 27 or so ports (the number varies through the period). They are not available for the national level. Only the towns of Christiania (Oslo), Bergen, Trondheim, and Kristiansand had full import and export rights. Smaller towns were limited to trading only with other parts of the dual Kingdom of Denmark-Norway, though some (those along the southern and eastern coast) had extended privileges to export timber and to some degree to import goods. The statistics are available from 1731 to 1795, however, there are several lacunas for the ports. These are most notable between 1733 and 1750, and 1760 to ca. 1780. After 1795, the trade statistics continue although the record keeping was changed and simplified; the origin/ destination of the goods was no longer noted and the goods were increasingly lumped together in categories. From 1828 trade statistics were collected and published by Statistics Norway for the national level. (available on http://www.ssb.no/a/histstat/publikasjoner/) 2. Documents The original data are available as at least 25 shelf meters of ledgers. They describe seagoing trade with other parts of Denmark-Norway, as well as with foreign states and regions. The ledgers are in the Royal Norwegian Archives. All have been scanned, and will be made available in full online in 2014/ 2015. No synthetic document has survived, either for Norway on its own, or for Denmark-Norway as a state. It may be possible to recreate an estimate of the balance of trade using import/export values from harbors with such rights. 1.
[email protected]
Revue de l’OFCE, 140 (2015)
302
Ragnhild Hutchinson
3. Institutional setting The data was collected by the Generaltollkammeret. This was the Danish-Norwegian customs commissioner. The central office was located in Copenhagen, with representatives in ports throughout the country. It was responsible for collecting the state’s customs duties. For parts of the eighteenth century, most notably ca. 1755 to the 1780s, customs (and tax) collection was farmed out to private collectors in the different Norwegian regions. Data for these years are largely lacking because customs records were destroyed or the customs revenue not reported in detail. 4. Motivation The primary consideration behind the collection of the original data was to provide an overview of the flow of goods by sea, chiefly to and from foreign states. Tax was levied on trade with foreign states. The data collected thus provide an overview of the total revenue from imports and exports. Customs duties on domestic trade were largely removed from the 1730s onwards, however, a consumption tax had to be paid on all domestic goods arriving at a port. Both values and amounts are noted for goods traded with foreign states, while only quantities were noted for all goods 5. Method The data were based on declarations at the port and inspection by customs officials. Separate books were kept for officials responsible for weighing and measuring. In this way, the state tried to control and limit illegal trade through parallel checks. This was insufficient to catch illegal trade, and for this reason care should be taken when using the data. Calculating the balance of domestic trade is difficult since the value of the goods traded is not noted. The make-up of the goods traded domestically nevertheless enables the identification of more overall trends. 6. Information Each ledger covers one year of incoming or outgoing sea trade for the respective ports. Most ledgers are organized in the same way; starting with (a) a chronological list, sorted by month, of the ships arriving/ departing and what they contained. This is followed by (b) a
Norway, 1731-1795
summary extract of the amount and value (of that traded with foreign places) of goods. These are plotted in columns for origins/destinations noted as states. Then (c) a “ports of call” list indicating each ship’s previous and next destination, its owner and captain, as well as its size. Also noted are tables summing up confiscations of contraband, totaling general and more specific tolls (e.g. on timber exports, coffee imports, or for financing lighthouses). Both values and quantities are indicated, though it is not yet known how prices were computed. Studies of grain imports in the eighteenth century indicate that the values used for grain in the customs records were based on monthly average sales prices in the port. It is not known whether this was also the case for other goods. The domestic trade data could draw on the values provided by the trade data for foreign countries. This is nevertheless fraught with difficulties, as frequently the goods were not directly comparable. A wide range of units of measurement was used. There are no overall categories of goods, only a running list. The country of origin is noted in several harbors, though in many cases foreign ports are combined as “foreign”. The name of the foreign ports of entry are not listed for the specific goods, but can be found in the “ports of call” list. The export and import data are only available for individual ports. 7. Availability The original material is stored at the National Archives of Norway. Large sections of the material are presently being scanned and will become available online at: http://arkivverket.no/Digitalarkivet. The Historiske toll- og skipsanløpslister project is transcribing a selection of the customs records and making them available in a database http://toll.lokalhistorie.no/. So far data for the ports of Christiania (Oslo), Bergen, Trondheim, Kristiansand, Tønsberg, and Risør are available transcribed in a database online for the years 1786, 1788, 1790, 1792, and 1794, but more will be put online in 2015. Also trade statistics for 1835 are available as part of the database. The ultimate objective is to have transcribed the summary tables of the goods for all Norwegian ports in the years 1731, 1756, 1786, and 1794 by the summer 2015. The database will contain full transcriptions of the data, however, the spelling of the goods names will be modernized to contemporary Norwegian, and, funding permitting, also English. This will make the database a better teaching aid for school history
303
304
Ragnhild Hutchinson
teachers, as requested by the educational institutions collaborating on the project.
8. Research questions The data have so far been used to explore the economic consequences of Norway’s constitution and change of union in 1814 for the development of Christiana and Bergen. By comparing the two towns’ trade in the 1780/90s and in 1835 it became clear that Bergen, which in the eighteenth century was the dominant trading town, was overtaken by Christiania in the wake of the changes caused by the events of 1814. The data have also been used to study how the Norwegian timber trade adapted to the new international conditions brought about by the end of the Napoleonic wars. The database has also been used in a PhD thesis studying the spread of British textiles in Norway. A study of urban theater in the late eighteenth century has also used the values of goods in the database to compare theater prices and expenses. Also, biologists have used it to study the spread of different animals. This is done though mapping changes in the make-up of fur and hide exports. The wealth of data available in the records opens up several lines of study – regional, national, European, and global – into trade and economic development in the eighteenth century. Examples of lines of study that are possible are the development of and change in bilateral trade relations between Norway and other countries. This would be especially fruitful if combined with trade data from other countries. Studies of European market integration may also be possible using the values put on goods in the different countries. More general trends such as the spread of consumer fashions and a possible consumer society can also be studied by following a selection of goods in several countries. Local variations in these trends may also be identified through the trade data. The wealth of data available in these records offers interested researchers many opportunities to study the Norwegian economy both in a national and international context. Studies can cover, for example, bilateral trade or Norway’s consumption patterns. The material also enables the study of wider issues such as mapping the spread of consumption, or even changing fauna.
Norway, 1731-1795
9. Bibliography 9.1. Primary sources The National Archives of Norway, Generaltollkammeret 9.2. Secondary works publishing and commenting on the data http://toll.lokalhistorie.no/ 9.3. Secondary works using the data Jørgensen, Hans-Jørgen, (1969), Det Norske Tollvesens historie. Fra middelalderen til 1814, Tolldirektoratet, Oslo. Lund, Carl, (1977), Det Norske Tollvesens historie. Fra 1814 til 1940, Direktoratet for toll og særavgifter, Oslo. Grøndahl, Øyvind N., (2004), Det Norske Tollvesens historie. Tiden eter 1940, Tollog avgiftsdirektoratet, Otta.
305
PAPAL STATES, SIXTEENTH-NINETEENTH CENTURIES Donatella Strangio1 University of Sapienza
1. Coverage This questionnaire discusses the data available for the Papal States between the sixteenth and nineteenth centuries. In 1798–1799 the Repubblica Giacobina replaced the Papal States and in 1808–1814 became part of the Napoleonic Empire. Taxation and customs were transformed: trade data on this period might be found in the Archives Nationales de Paris.
2. Documents Summary reports of annual imports and exports of single products were occasionally prepared, for example to plan customs reforms or to establish whether to forbid or encourage specific trades. These can occasionally be found in the numerous documentary sources of the secretariats of state and the consultative bodies of the states. Annual balance of trade statements only exist after 1850. Bonelli [1961] has partly rediscovered and published them.
3. Institutional setting Individual customs authorities were responsible for data collection. The data were not published.
4. Motivation Data were collected for taxation purposes or for sanitary reasons only.
1.
[email protected]
Revue de l’OFCE, 140 (2015)
308
Donatella Strangio
5. Method The data provide a good representation of the actual flow of goods and prices, but they are so diverse that it is very difficult to collate and cross check them in order to obtain a long-term trend in the balance of trade. Balances can only be computed for short periods. 6. Information Custom authorities recorded trade flows for taxation purposes only. At present there are no data compilations before the nineteenth century. The records use a money of account, the scudo romano d’argento. It contained 26.4 grams of silver. All the documents are in Italian The origins of specific goods were indicated and incorporated in the name of the goods in only a few cases. The documents indicated the port of origin of the vessels, but they mentioned different numbers of geographical entities depending on the periods. 7. Availability The data have not been published. No one has conducted a systematic study. There are many studies on the Middle Ages and the Renaissance, but they are local and circumscribed. For the eighteenth century there are several studies on the wheat trade (see Strangio (1999)). There is little information on prices. Recently Alfani and Strangio have been rebuilding a series of wheat prices throughout Italy but there are several gaps. For the early industrial age, Bonelli has produced the only systematic work. 8. Bibliography 8.1. Primary sources Archivio di Stato di Roma (now ASR) Bandi; ASR Dogane; ASR Presidenza dell’Annona e Grascia; ASR, Miscellanea statistica, 25; ASR, Ministero dei lavori pubblici, commercio, belli arti, industria e agricoltura, b. 441; ASR, INVENTARIO: Dogane, amministrazione Roma secc. 17 e 18 – fonti archivistiche. Belloni G., (1750), De commercio dissertatio, Romae.
Papal States, sixteenth-nineteenth centuries
Belloni G., (1757), Del commercio, Livorno, Venezia. Belloni G., (1965), Scritture inedite e dissertazione “Del commercio”, a cura di A. Caracciolo, Roma. Lo Sardo E., (a cura di), (1994), Le gabelle e le dogane dei Papi in età moderna: inventario della serie Dogane della Miscellanea camerale per materie, Archivio di Stato di Roma. Various manuscripts by Belloni were republished in: Del Pane, L., (1959), Lo Stato pontificio e il movimento riformatore del Settecento, Milano, 651–60. Caracciolo, A., (1971), “Alcune fonti archivistiche inglesi per la storia del Banco Belloni nel Settecento”, in Scritti in memoria di Leopoldo Cassese, Vol. 1, Napoli, 253–70. Mattioli, R., (dir.), (1978), La letteratura italiana. Storia e testi, Vol. 44, Dal Muratori al Cesarotti, t. 5, Politici ed economisti del primo Settecento, a cura di R. Ajello, M. Berengo, A. Caracciolo et al., Milano-Napoli, 653–94. 8.2. Secondary works commenting on the data Ait, I., (1981), “La dogana di S. Eustachio nel XV secolo”, in Aspetti della vita economica e culturale a Roma, Roma, 81–147. Arnaldi, G., (1986), “L’approvvigionamento di Roma e l’amministrazione del “Patrimonio di S. Pietro” al tempo di Gregorio Magno”, in Studi Romani, 34, 25–39. Bonelli, F., (1961), “Il commercio estero dello Stato Pontificio nel secolo XIX”, Archivio economico dell'Unificazione Italiana, I, vol. XI, 2, Roma. Capalbo, C., (1999), L’economia del vizio. Il tabacco nello Stato ponti-ficio in età moderna fra produzione e consumo, Napoli. Canaletti Gaudenti, A., (1920), “Esportazioni, censimenti agrari e requisizioni nel Settecento a Roma”, Giornale degli economisti e Rivista di Statistica, novembre, 461–487. Canaletti Gaudenti, A., (1947), La politica agraria e annonaria dello Stato Pontificio da Benedetto XIV a Pio VII, Roma. D’Amelia, M., (1975), “La crisi di un mercato protetto: approvvigionamento e consumo della carne a Roma nel XVIII secolo”, in Mélanges de l’École française de Rome. Moyen-Age, Temps Modernes, 87: 495–534. De Tournon-Simiane, M. C., (1831), Études statistiques sur Rome et la partie occidentale des États romains, II, Paris. Esch, A., (1994), “Importe in das Rom der Renaissance. Die Zollregister der Jahre 1470 bis 1480”, in Quellen und Forschungen aus italienischen Archiven und Bi-bliotheken, 74, 360–453, trad. ital.: “Le importazioni nella Roma del primo Rinascimento (il loro volume se-condo i registri doganali degli anni 1452-1462”, in Aspetti della vita economica e culturale a Roma, Roma, 1981, 7–79. Esch, A., (1994), “Roma come centro di importazioni nella seconda metà del Quattrocen-to ed il peso economico del papato”, in Roma capitale
309
310
Donatella Strangio
(1447-1527), Centro di Studi sulla Civiltà del Tardo Medioevo di San Miniato, 5, Pisa, 107–143. Esch A., (1995), “Roman Customs Registers 1470-80: Items of Interest to Historians of Art and Material Culture”, Journal of the Warburg and Courtauld Institutes, LVIII, 72–87. Friz, G., (1974), “La popolazione di Roma dal 1770 al 1900”, Archivio dell’Unificazione Italiana, serie II, Vol. XIX, Roma. Gross, H., (1990), Roma nel Settecento, Roma-Bari. Martinat, M., (1995), « Le marché des céréales à Rome au XVIIe siècle », Histoire and Mesure, X(3/4): 313–338. Mira, G., (1948), Commercio e consumo del frumento in Roma nel XVIII secolo, Bari. Lombardo, M. L., (1970), La Camera Urbis. Premesse per uno studio sulla organizza-zione amministrativa della città di Roma durante il pontificato di Martino V, Roma. Lombardo, M. L., (1978), Camera Urbis. Dohana Ripe et Ripecte. Liber Introitus 1428, Roma. Lombardo, M. L.,(1983), Camera Urbis. Dohana minuta Urbis. Liber Introitus 1422, Roma. Lombardo, M. L., (1983), La dogana minuta a Roma nel primo Quattrocento. Aspetti istituzionali, sociali, economici, Roma. Nicolai, N. M., (1803), Memorie, leggi ed osservazioni sulla campagna e l’Annona di Roma, Roma, III. Palermo, L., (1979), Il porto di Roma nel XIV e XV secolo. Strutture socioeconomiche e statuti, Roma. Palermo, L., (1990), Mercati del grano a Roma tra medioevo e rinascimento, vol. I, Il mercato distrettuale del grano in età comunale, Roma. Strangio, D., (1999), Crisi alimentari e politica annonaria a Roma nel Settecento, Roma. Reinhardt, V., (1991), Überleben in der frühneuzeitlichen Stadt. Annona und Getreideversorgung in Rom 1563-1797, Bibliothek des Deutschen Historischen Instituts in Rom, 72, Tübingen. Revel, J., (1972), « Le grain de Rome et la crise de l’Annone dans la seconde moitié du XVIIIe siècle », Mélanges de l’École Française de Rome. MoyenAge, Temps Modernes, 84: 201–281. Revel, J., (1975), « Les privilèges d'une capitale: l'approvisionnement de Rome à l'époque moderne », Mélanges de l'École Française de Rome. Moyen-Age, Temps Modernes, 87: 460–493.
POLAND, 1764-1791 Szymon Kazusek, Jan Kochanowski1 University Poland
1. Coverage This questionnaire discusses Poland from 1764 to 1795. After 1795 the Polish state did not exist. The responsibility for preparing documentation about the flow of traded goods was taken up by administration of countries that had taken part in the partition of the Polish-Lithuanian state. 2. Documents Annual registers on foreign trade were prepared separately for Poland and Lithuania on the basis of the detailed data gathered from customs registers during the second half on the eighteenth century. Many documents were destroyed during the Second World War. The custom registers for 1764 to 1767 have survived, along with summaries for 1786-1790. They are currently available both on paper and on microfilm. 3. Institutional setting The Crown Treasury Committee and Lithuanian Treasury Committee controlled trade and customs. Both Committees were created in 1764. The institutions worked in strict cooperation with the Grand Treasurer of the Crown and Grand Treasurer of Lithuania respectively. In some specific cases concerning trade a Treasurer issued documents called proclamations. 4. Motivations Data collection was linked to a general movement of reform of the customs system, and the trade and customs policy. The existing customs system was very complicated. For example, there were three 1.
[email protected]
Revue de l’OFCE, 140 (2015)
312
kinds of customs duties: state, royal, and private. The collection of customs was leased out. The most important motivation was to determine the amount of customs and state revenue from customs fees. The documents were also used to establish a trade balance. The information about goods flow was also supposed to encourage national production of some products currently imported from other countries. 5. Methods Customs declarations by traders and the examination of their paperwork were the basis for the establishment of the customs registers. These were checked in the customs houses. The statistical data from customs houses was sent to a lease owner of the customs province, and then, after careful checking, to the Crown Treasury Committee. The data gathered in customs registers as well as in their surviving summary records might not be fully adequate. Duty-free products, including goods owned by noblemen and the clergy and not intended for distribution, were not registered. However, the estimation of the trade of peasants and townsmen seems to be quite trustworthy. The value of goods was determined by the Crown Treasury Committee which was in the habit of understating the value of goods. Hence, the global value of exported and imported goods is also understated. There is no perfect method to estimate by how much. The actual value of products might be estimated thanks to research in prices in the biggest towns in Poland, or by looking closely at trade along some important trade routes, e.g. through Gdańsk or Kraków. 6. Information The detailed data include the type, value, amount, and quality of imported and exported products. The summary records provide the destination of exports and the origin of imports. In many cases there are precise notes about the origin of the products. The customs registers also include information about the place of origin of the ship or the merchant. The summary records prepared for the Crown Treasury Committee provide the quantity of traded goods. The custom registers contain information about both quantities and value, expressed in the current accounting currency, the zloty.
313
The system of weights and measures was in accordance with the reform carried out in Poland in 1765. Values are probably approximate. The goods are listed according to a list in Polish and Latin compiled by the office of Grand Treasurer of the Crown and Grand Treasurer of Lithuania. The summary records from 1786-1790 list about 1286 different export products and about 2550 import ones. The summary records from 1786-1790 contain notes about the destinations of exports and imports. The names of some products that these notes include give us clear tips as to their origin. They indicate trade with five different countries (Austria, Germany, Russia, Turkey, Wallachia) and “other countries”, including the United States, Great Britain, France, the Netherlands, Scandinavian countries, Spain, Portugal, Italy, and Far Eastern countries. These “other countries” are not associated to any direct import. Information about final recipients is very rare. The customs registers from 1764-1767 give more detailed information about the places of origin of some products and their destination. Quite often they include information about the transport of goods to a well-known foreign fair. Furthermore, because they are broken down by place of dispatch/landing in the reporting territory, they provide additional information. The data from customs houses located on the borderland make it possible to determine directions of export and import. Even for customs houses from the center of the country we may infer with some confidence the country which participated in the trade. The registers tell us about direct trade with five countries (Germany, Austria, Russia, Turkey, and Wallachia).
7. Availability I have published the data from the summary records of foreign trade of the Crown (S. Kazusek, Handel zagraniczny Korony w końcu XVIII wieku. Tabele statystyczne, vol. 1: Eksport w latach 1786-1790, Kielce 2012; vol. 2: Import w latach 1786-1790, part. 1: Zestawienia roczne, Kielce 2012; vol. 2, part. 2: Zestawienie sumaryczne, Kielce 2013). I am currently working on the customs registers from 1764-1767. My aim is to create a huge database that will provide us with the detailed information about national and foreign trade of Poland in the years 1764-1767.
314
8. Research questions The materials from summary records from 1786-1790, will be used in preparing the trade balance of Poland at the end of the eighteenth century. The data informs us about the range of Polish trade connections, mainly with Austria, Germany, Russia, Turkey, and Wallachia, but also with countries from western and northern Europe and the Far East. There are other potential research questions:
— What was the balance of Polish trade with Germany, Austria, Russia, Turkey, and Wallachia at the end of the eighteenth century? — What was the range of imports from countries from western and northern Europe (indirectly from America and the Far East) in comparison with Polish imports from Russia, Germany, Turkey, and Wallachia at the end of the eighteenth century? — What was the range of Polish re-exports at the end of the eighteenth century? — What was the percentage of agricultural and industrial products in foreign trade? — When the statistical sources are missing, can the profits from customs fees be the basis for determining the range of foreign trade in the second half of the eighteenth century? — What was the participation of foreign merchants in the trade with Poland in the second half of the eighteenth century? — The studies over the customs registers from 1764-1767 should put emphasis on establishing the structure and direction of foreign trade, merchants’ activity, seasonal character of land and water transport, activity of merchants and participation of townsmen, noblemen, and clergy in trade, as well as on the influence of natural disasters and development of agriculture and industry in Poland on the foreign trade. — Registers are a good basis for further studies on the route specific products took, the size of means of transport, the seasonal character of trade, and the influence of international fairs on foreign trade.
315
9. Bibliography 9.1. Primary sources Archiwum Główne Akt Dawnych w Warszawie. Archiwum Lubomirskich z Małej Wsi, sygn. paczka 33/1113 ; sygn. paczka 33/1114; sygn. paczka 33/1115; sygn. paczka 33/1116; sygn. paczka 33/ 1117 ; sygn. 33/1118; sygn. paczka 33/1119; sygn. paczka 33/1120; sygn. paczka 33/1121 ; sygn. paczka 34/1122. Archuwum Kameralne, Dział III, sygn. 1490-1727. Biblioteka Czartoryskich w Krakowie. Rękopisy, sygn. 1076. 9.2. Secondary works publishing and commenting on the data Biernat Czesław, (1962), Statystyka obrotu towarowego Gdańska w latach 1651-1815, Warszawa. Cieśak Edmund, (1973), “Wybrane problemy handlu Gdańska w okresie rozbiorów Polski,” Rocznik Gdański, 33: 5–21. Gierszewski Stanisław, (1957), “Statystyka handlu zbożowego Elbląga w latach 1642-1795,” Zapiski Historyczne, 23(1-3): 157–174. Gierszewski Stanisław, (1963), Statystyka żeglugi Gdańska w latach 16701815, Warszawa. Groth Andrzej, (2002), “Handel morski Elbląga w latach 1772-1815,” Rocznik Gdański, 62(1-2): 15–33. Guldon Zenon, (1995), “Handel Polski z Mołdawią, Nowoserbią i Chersoniem w końcu XVIII w.,” in: Polska, Prusy, Ruś, ed. Błażej Śliwiński, Gdańsk, 57–61. Guldon Zenon, Kazusek Szymon, (2009), “Eksport Korony w 1786 roku,” Kwartalnik Historii Kultury Materialnej, 57(2): 193–214. Guldon Zenon, Stępkowski Lech, (1988), “Polnisch-ungarische Handelsbeziehungen um die Mitte des 18. Jahrhunderts,” Studia Historiae Oeconomicae, 19: 101–118. Guldon Zenon, Stępkowski Lech, (1986), Statystyka obrotów towarowych na komorach celnych województwa sandomierskiego 1764-1766, Kielce. Guldon Zenon, Stępkowski Lech, (1980), Z dziejów handlu Rzeczypospolitej w XVI-XVIII wieku. Studia i materiały, Kielce Hoszowski Stanisław, (1956), “Polski eksport wiślany w 1784 roku,” Kwartalnik Historyczny, 63(4-5): 64–80. Kazusek Szymon, (2012), “Handel zagraniczny Korony w końcu XVIII wieku,” Tabele statystyczne 1: Eksport w latach 1786-1790, Kielce. ——, (2012), “Handel zagraniczny Korony w końcu XVIII wieku,” Tabele statystyczne 2: Import w latach 1786-1790, part. 1: Zestawienia roczne, Kielce. ——, (2013), “Handel zagraniczny Korony w końcu XVIIII wieku,” Tabele statystyczne 2, part. 2: Zestawienie sumaryczne, Kielce.
316
Korzon Tadeusz, (1897), Wewnętrzne dzieje Polski za panowania Stanisława Augusta (1764-1794), Kraków-Warszawa 2. Kulczykowski Mariusz, (1960), “Handel Krakowa w latach 1750-1772,” Zeszyty Naukowe Uniwersytetu Jagiellońskiego 26, Prace historyczne, 4, 79–105. Kulczykowski Mariusz, (1963), Kraków jako ośrodek towarowy Małopolski Zachodniej w drugiej połowie XVIII wieku, Warszawa. Kuklińska Krystyna, (1976), Handel Poznania w drugiej połowie XVIII wieku, Warszawa-Poznań. Motylewicz Jerzy, (2000), “Wymiana towarowa w rejonie środkowego biegu Dniestru w połowie XVIII wieku w świetle rejestru komory celnej w Kamieńcu Podolskim,” in: Kamieniec Podolski, Studia z dziejów miasta i regionu, ed. Feliks Kiryk 1, Kraków, 257–270. Truska L.S, Jasas R.W., (1970), “Vnesniaja torgovla V.Kn. Litovskogo v poslednie gody jego suscestvovanija (1785-1792),” in: Lietuvos TSR Mokslu Akademijos Darbai, seria A 1 (32): 23–53 Trzoska Jerzy, (1966), “Gdańsk jako port drzewny w II połowie XVII i XVIII wieku,” Rocznik Gdański, 25: 73–113. Trzoska Jerzy, (1984), “Wywóz zboża i towarów spożywczych z Gdańska do Szwecji podczas wojny rosyjsko-szwedzkiej 1741-1745,” Zapiski Historyczne, 49(4): 51–67.
Żytkowicz Leonid, (1976), “Kilka uwag o handlu Wielkiego Księstwa Litewskiego w ostatnich latach Rzeczypospolitej,” Zapiski Historyczne, 41: 87–101. 9.3. Secondary works using the data (please be selective) Baszanowski Jan, (1977), Z dziejów handlu polskiego w XVI-XVIII wieku. Handel wołami, Gdańsk. Bieniarzówna Janina, (1997), “Związki handlowe Krakowa z Krems od XVI do XVIII wieku,” Zeszyty Naukowe Uniwersytetu Jagiellońskiego’, 1195, Prace historyczne, 121: 97–109. Cieślak Edmund, (1970), “Struktura i rola dostaw francuskich w wymianie handlowej Gdańska w drugiej połowie XVIII wieku,” Roczniki Dziejów Społecznych i Gospodarczych, 31: 143–164. Cieślak Edmund, (1998), “The 18th Century Gdańsk-Europe Trade Relations,” Studia Maritima, 11: 52–64. Drozdowski Marian, (1975), Podstawy finansowe działalności państwowej w Polsce 1764-1793, Warszawa-Poznań. Dziubiński Andrzej, (1998), Na szlakach Orientu. Handel między Polską a Imperium Osmańskim w XVI-XVIII wieku, Wrocław. Gaziński Radosław, (2000), Handel morski Szczecina w latach 1720-1805, Szczecin. Gaziński Radosław, (1997), “Handel morski małych portów Zalewu Szczecińskiego w XVIII wieku,” Nautologia, 32(3-4): 7–13.
317
Hoszowski Stanisław, (1960), “Handel Gdańska w okresie XV-XVIII wieku,” Zeszyty Naukowe Wyższej Szkoły Ekonomicznej w Krakowie 11: Prace z zakresu historii gospodarczej, 3–71. Hoszowski Stanisław, (1960), “The Polish Baltic Trade in the 15th-18th Centuries, in: Poland at the International Congress of Historical Sciences in Stockholm,” Warszawa, 117–154. Kaps Klemens, (2008), “Gescheitertes Aufholen in Zentraleuropa. Der Abstieg der Habsburgermonarchie zu einem semiperipheren Wirtschaftsraum im Spiegel ihrer Aussenhandelsstruktur 1791-1880,” Zeitschrift fur Weltgeschichte, 9.1: 103–122. Wojtowicz Jerzy, (1965), Z problematyki stosunków handlowych Rosji z Bałtykiem i Europą zachodnią w XVIII stuleciu,” Zapiski Historyczne, 30(4): 37–72. Żytkowicz Leonid, (1976), “Kilka uwag o handlu zewnętrznym Wielkiego Księstwa Litewskiego w ostatnich latach Rzeczypospolitej,” Zapiski Historyczne, 41(2): 87–101.
PORTUGAL, 1775-1831 Maria Cristina Moreira12 Department of Economics, School of Economics and Management, University of Minho, Interdisciplinary Centre of Social Sciences (CICS.NOVA.UMinho), Portugal
1. Coverage Series for Portuguese foreign trade are available from 1775 to 1831. The statistics were interrupted in 1832 because of the Portuguese civil war between liberals and absolutists. They were resumed in the 1840s, but with gaps and a different structure. 2. Documents Annual balances of trade were produced from 1775 to 1831. These synthetic documents were assembled mostly in three separate books: — The first concerned trade with the Portuguese Empire (“Balança do Comercio deste Reyno com Os Seus Dominios – Balance of Trade of the Kingdom with its Domains”); — the second detailed trade with external markets (“Balança Geral do Commercio do Reyno de Portugal com as Naçoens Estrangeiras – Balance of Trade of the Kingdom of Portugal with Foreign Nations”); — and the third book presented the same information as collected in the first two books but in summary form (“Resumo da Balança Geral do Commercio do Reino de Portugal com o Brazil, Dominios Portuguezes e Nações Estrangeiras” – “Synopsis of the Balance of Trade of the Kingdom of Portugal with Brazil, Portuguese Domains, and Foreign Nations”). — There are, however, a few years for which this information is compiled in one single book (“Balança geral do Commercio do Reyno de Portugal com os seus Dominios e Naçoens Estrangeiras – Balance of Trade of the Kingdom of Portugal with its Domains and Foreign Nations”). 1. Funding for this project was provided by the Fundação para a Ciência e Tecnologia, FEDER, PTDC 2010 project PTDC/HIS-HIS/118984/2010: Trade Networks of Small and Neutral States before, during, and after the Revolutionary and Napoleonic Conflicts (1750–1850). 2.
[email protected].
Revue de l’OFCE, 140 (2015)
320
Maria Cristina Moreira
— The statistical series available cover the years 1776, 1777, 1783, 1787, 1789, and 1796–1831. However for 1783, 1787, and 1789 only the balances of trade with external markets are given. An early nineteenth-century source indicates that balances of trade for the years 1775, 1780, and 1790 were also produced.3 However they were either lost or – more likely – destroyed by fire in 1821.4 — There are also the balances of trade with Great Britain alone for the period between 1775 and 1785 (“Balança Geral do Commercio Do Reyno de Portugal Com Inglaterra Pelo Calculo do valor da Importação e Exportação das suas Praças desd’o Anno de 1775 [Até] 1785 – The Balance of Trade of the Kingdom of Portugal with England by the calculation of the value of Imports and Exports with its cities since 1775 [until] 1785”). — Most of these annual registers include an introduction that expresses an array of ideas based upon the data collected.
3. Institutional setting The institution that registered the entry and exit of goods in Portugal was the Contadoria da Superintendência Geral dos Contrabandos, e Descaminhos dos Reaes Direitos (General Superintendence Accounting of Smuggling and Embezzlement of Royal Rights). The man who signed the balances of trade between 1800 and 1825 was Maurício José Teixeira de Moraes. He had worked in the Contadoria since 1774. He was promoted to contador by royal decree of March 4, 1802. From 1826 on, balances were signed by Jacinto Teixeira de Azevedo due to the illness of Maurício José who died on 29 December 1832.
4. Motivation The decree that decided on the creation of a balance of trade was dated 20 May 1774 and signed by the First Marques of Pombal. The balances were intended to: 3. “Ayant entre les mains (…) les bilans du commerce du Portugal des annés 1775, 1880, 1790 et ceux de 1796 a 1820 si savamment rédigés par M. le chevalier Mauricio José Teixeira de Moraes (…)”, in Balbi, (1822: 401). 4. “Since I have nothing more to add, I will demonstrate (…) the total of Portuguese wine exported (…) only for the years 1816 to 1824 (due to the fact that many balances of trade were consumed in the great fire of June, 1821)”. Balança Geral do Commercio do Reino de Portugal com o Reino do Brazil, Dominios, e Nações Estrangeiras No Anno de 1824.
Portugal, 1775-1831
(a) elaborate on and create an annual and systematic record relating to Portuguese trade over the years; (b) determine the resources of the Portuguese Empire;5 (c) accurately determine the export and import flows for each and every market; (d) determine the qualities, quantities, and prices of the goods traded by the Portuguese Empire; (e) identify signs of smuggling in foreign trade and its consequences for the state, in particular the losses in state revenues;6 (f) inform the king and his ministers about the state of Portuguese foreign trade;7 (g) better understand Portugal’s position in international trade and the way foreign imports might contribute to the betterment of Portugal’s economy;8 (i) provide conclusive evidence on the economic consequences of international treaties.9 5. Methods The information contained in the balance of trade registers was based on declarations collected from documents issued by several administrative bureaus. The latter were responsible for the accuracy of data which was collected in “Books, Deals, Maps, Customs dispatch manifests of all the Kingdom’s Customs Houses and tax bureaus of this city”.10 5. “… to know the nations resources as soon as its potential is calculated”. Balança Geral do Commercio do Reyno de Portugal com Os Seus Dominios, No Anno de 1805. 6. “… the legitimate balance of all imports and exports, may not be so much benign to this Kingdom, due to the present smuggling of this nation [England], which, every year, causes a downfall of State revenues”. Balança Geral do Commercio do Reino de Portugal com os seus Dominios e Nações Estrangeiras, No Anno de 1805. 7. “… the actual balance of trade was extremely important to the supreme ruler [refers to the most important person of the Portuguese empire at the time, Prince D. João] and to his Ministers of State”. Balança Geral do Commercio do Reyno de Portugal com Os Seus Dominios, No Anno de 1805. 8. “Grain every year compounds us with large sums to this [Prussia], and other nations, which deserves all of our attention since it increases our agriculture productivity and we’d be with all kinds of grain, linen and hemp to fill our factories of Beira and Minho, as well with wool production from livestock, which will give us fabrication from wool, mulberry cultivation and silkworms breeding, from what we can say that our factories from years to years always provided us with such elegant upholstery design and beautiful colors.”, Balança Geral do Commercio do Reino de Portugal com as Nações Estrangeiras No Anno de 1805. 9. “… until this baneful Trade Treaty of 1810 endures,[England] will introduce in Portugal as much cloth it could produce. This trade deserves our most serious thought.” Balança Geral do Commercio do Reino de Portugal com o Reino do Brazil, Provincias Ultramarinas, e Nações Estrangeiras No Anno de 1821.
321
322
Maria Cristina Moreira
Other sources used by the Contadoria include “Merchant Shipping Books, confronted with maps, by the Ultramar ports and isles that will be submitted to the General Superintendence Accounting of Smuggling and Embezzlement of Royal Rights (…) and other important documents which every year have been asked for from other offices to achieve perfection”.11 Data were checked by comparing the information displayed in each of these documents. Bearing in mind that smuggling and tax evasion are a necessary evil in a protectionist setting, the existence of a statistical series provides a reliable approximation of the actual flow of goods and prices. Moreover, preliminary results from the trade database currently under construction show that the calculations made in the balances of trade are coherent.12
6. Information The information collected encompasses prices, quantities, units, goods, classes, origins, and ports of entry of goods, exchange rates (for some years and markets), number of Portuguese and foreign ships that entered and exited the country (for some years and markets). The books also contained significant introductions, contextualizing and interpreting the quantitative data. Each flow of imports and exports was measured in value. In general, it is possible to identify for each register the product, quantity, price, and unit of account used. The currency unit was the real and prices varied over the years. Export prices are FOB (free on board) and import prices are CIF (cost, insurance, and freight).13 Numerous units were used for physical quantities. So far we have identified around 70 different quantity units. There are about 13 000 different types of goods, individual products mainly; the rest being registered as sets of aggregated products. Commodities were classified in several categories, but they are not coherent: a given product may often belong to different categories. Some of those categories include both raw materials and transformed goods. 10. “Livros, Relações, Mappas, e Manifestos dos Despachos de todas as Alfandegas do Reyno, e Mezas Fiscáes desta Cidade”. Balança Geral do Commercio do Reyno de Portugal, com as Nações Estrangeiras No Anno de 1800. 11. Balança Geral do Commercio do Reyno de Portugal com Os Seus Dominios e Nações Estrangeiras, No Anno de 1802. 12. Project Trade Networks of Small and Neutral States before, during, and after the Revolutionary and Napoleonic Conflicts (1750–1850). Reference PTDC/HIS-HIS/118984/2010. Principal Investigator: Maria Cristina Moreira.
Portugal, 1775-1831
With the exception of the years 1776, 1777, and 1783, balance of trade records classified Portuguese imports from its domains and foreign nations and Portuguese exports to its domains.14 The books provide accurate information of both the external market15 and Portuguese empire market16 from or to which the commodities flowed. Moreover, they indicate the Portuguese administrative region where the trade was registered.17 Finally, the geographical origins of Portuguese or colonial imports and the origin of Portuguese exports to colonial markets are specified as well. As for the imports from foreign nations, it is possible to identify the market from which the goods were imported. Moreover, for exports to foreign nations its possible to identify their origin: the Portuguese Empire (Africa, Asia, Atlantic Isles, Brazil, Kingdom) or re-exports.18 7. Availability Some of the data have already been digitized and are currently being processed into a database. 8. Research questions Thus far the information extracted from the balance of trade books has been used in works analyzing trade in the Portuguese Empire and Portuguese trade with Britain, Spain, Hamburg, and the United States of America. However, one can easily think of other issues that can be addressed with these data for instance: (1) Was Portugal’s dependence on exports to settle imports inherent in economic growth? 13. “In each of these important articles we can see the quantities and sorts of imported and exported commodities, the average calculated price, with the difference however that the price regarding imports would be the cost and expense regarding the goods that arrived to the ports of Portugal before paying the custom fees; on the other hand, the exports price will have an inflated cost upon the value-based pricing of the current year, exports fees and commission. The knowledge about the quantity and quality of the genres by Entrance or Exit was extracted from the Book of Shipments Relations of customs all around the kingdom and fiscal documentation of this city [Lisbon], even the ones that were tax-free” and “… For the construction of the balance the prices of the first cost from the port of origin were examined; to the exports, the commissions and rights of export will be added; to know these prices, some traders of the market were consulted; from those conversations, and with other well thought speculations, the medium prices were extracted””. The former citation is from: Balança Geral Do Commercio do Reyno de Portugal com as, Nações Estrangeiras, Em o Anno de 1796 and Balança Geral Do Commercio do Reyno de Portugal com Os Seus Dominios Em o Anno de 1796 for the latter.
323
324
Maria Cristina Moreira
(2) How did prices and quantities of the principal goods change in the foreign market? (3) How can foreign trade data contribute to constructing an index of industrial and agriculture productivity over the period? (4) Will we be able to see export and import price fluctuations parallel to what we know about the markets? (5) How elastic were the supply of and demand for Portuguese imports? (6) Would Portugal fit in with the international market as a reexport platform? Would the benefits and profits cover all the involved partners? (7) To trace the trade flows between the Portuguese Empire and foreign markets, especially whether the pressure of the war effort allowed more latitude for Portugal (and other small and/or neutral states) to explore its trade options. (8) To assess the changes in the types of goods exchanged over this complex period. 14. For Portuguese exports to its domains: Drogas (drugs), Lanifícios (wool industry – includes raw material and manufactured goods), Linifícios (linen industry – includes raw material and manufactured goods), Madeira (wood), Mantimentos (provisions), Manufacturas de Algodão (cotton objects – discriminated between British and foreign cotton objects), Produções da Ásia (Asia products), Metais (metals), Ouro e Prata (gold and silver – for a few years we have the values of silver alone and gold alone), Sedas (silks – includes raw material and manufactured goods), Produções das fábricas do reino (goods from the Kingdom factories – this class includes some of the Kingdom’s manufactured goods, however there are other classes that also include national manufactured goods) and Vários Géneros (miscellaneous goods). For Portuguese imports from its domains: Algodão (cotton – includes raw material and manufactured goods), Courama (leather), Drogas (drugs), Géneros extrangeiros reexportados do Brasil (Foreign goods reexported from Brazil), Madeira (wood), Mantimentos (provisions), Ouro e prata (gold and silver – for a few years we have the values of silver alone and gold alone) Produções da Ásia (Asia products), Vários Géneros (miscellaneous goods). For Portuguese imports from foreign nations: Algodão (cotton – includes raw material and manufactured goods; sometimes there is additional information regarding cotton fabric and British cotton products), Drogas (drugs), Lanifícios (wool industry – includes raw material and manufactured goods), Linifícios (linen industry – includes raw material and manufactured goods), Madeira (wood), Mantimentos (provisions), Metais (metals), Sedas (silks – includes raw material and manufactured goods) and Vários Géneros (miscelaneous goods). 15. Austria, Barbary Coast, Denmark, England, France, Germany, Hamburg, Italy, Malta, Netherlands, Prussia, Russia, Spain, Sweden and United States of America. 16. Atlantic Isles: Madeira and Azores, Africa: Angola, Cape Verde, Guinea and Mozambique), Brazil, Asia: India, Batavia (Indonesia) and Macau. 17. Algarve, Aveiro, Caminha, Figueira da Foz, Lisbon, Porto, Setubal, Viana do Castelo and Vila do Conde, Alentejo, Beira, Minho, and Trás-os-Montes, the four latter regions being grouped into one region, “Provinces” since 1799. 18. África (Africa), Ásia (Asia), Ilhas (Atlantic Isles), Brasil (Brazil), Reino (Kingdom) and Fora do Reino Reexportados (Re-exports).
Portugal, 1775-1831
(9) To determine the significance of this trade for the war effort of the major participants, i.e., the scale and scope of this trade, both in the short and the long term. (10) To analyze the response of the small/neutral states’ foreign trade during the Revolutionary and Napoleonic Wars in relation to military needs. (11) To understand the effects of the war which spilled over to influence the relations between neutrals. (12) To analyze new outlets and sources, alternative trading partners and networks for the trade of many countries which had seen an impact on trade relations as a result of war, an impact which affected all nations. (13) To analyze the relationship between external trade in a wartime and dumping. 9. Bibliography 9.1. Primary sources of the Portuguese balances of trade (1775–1831)19 Arquivo Histórico do Ministério das Obras Públicas, Lisbon, Portugal PT/AHMOP/SGC/05/01 Balança geral do Commercio do Reyno de Portugal com os seus Dominios e Naçoens Estrangeiras no Anno de 1776; PT/AHMOP/SGC/05/02, Balança Geral do Commercio do Reyno de Portugal com os seus Dominios e Naçoens Estrangeiras No Anno de 1777; PT/AHMOP/SGC/05/04 Balança Geral do Commercio do Reino de Portugal com os seus Dominios e Nações Estrangeiras 1796-1820; PT/AHMOP/SGC/06 Alfabeto Das Importaçoens e Exportaçoens Do Reyno de Portugal Com As Naçoens Estrangeiras Em o Anno De 1789; PT/AHMOP/SGC/05/06 Balança do Comercio deste Reyno com Os Seus Dominios No Anno de 1798; PT/AHMOP/SGC/05/07 Balança Geral do Commercio do Reino de Portugal com Os Seus Dominios, e Naçoens Estrangeiras, No Anno de 1808 (book in summary form); 19. The Arquivo Nacional da Torre do Tombo, Lisbon, Portugal has also almost all the years of the Portuguese balances of trade, PT-TT-JC/C/1 to 30. The Fundação da Biblioteca Nacional, Rio do Janeiro, Brasil has some copies of the Portuguese balance of trade that can be found in the Arquivo Histórico do Ministério das Obras Públicas, Lisbon, Portugal. Furthermore, some of the Portuguese balances of trade in Instituto Nacional de Estatística Lisbon, Portugal can be found in Arquivo Histórico do Ministério das Obras Públicas, Lisbon, Portugal, in Fundação da Biblioteca Nacional, Rio do Janeiro, Brazil and in Instituto Histórico e Geográfico Brasileiro, Rio do Janeiro, Brazil.
,
325
326
Maria Cristina Moreira
PT/AHMOP/SGC/05/08 Balança Geral do Commercio do Reino de Portugal com o Reino do Brazil, Dominios, e Nações Estrangeiras, No Anno de 1822. Instituto Nacional de Estatística, Lisbon, Portugal INEG2448, years: 1796, 1797, 1799 to 1807, 1809 to 1821 and 1823 to 1831. Fundação da Biblioteca Nacional, Rio do Janeiro, Brazil Cód. 17, 4, 27, Balança Geral do Commercio Do Reyno de Portugal Com Inglaterra Pelo Calculo do valor da Importação e Exportação das suas Praças desd’o Anno de 1775 [Até] 1785 (Arquivo Nacional da Torre do Tombo, Lisboa, Portugal, Projecto Reencontro, Biblioteca Nacional, F 0110 P); Cód. 18, 4, 1, Balança Geral do Commercio Do Reyno de Portugal com as Nações Estrangeiras no Anno de 1783 (Arquivo Nacional da Torre do Tombo, Lisboa, Portugal, Projecto Reencontro, Biblioteca Nacional, F 0110 P); Cód. 11, 4, 7, Balança Geral do Commercio Do Reyno de Portugal com as Nações Estrangeiras Em o Anno de 1787 (Arquivo Nacional da Torre do Tombo, Lisboa, Portugal, Projecto Reencontro, Biblioteca Nacional, F 0110 P); Cód. 11, 4, 11, Balança Geral do Commercio Do Reyno de Portugal com as Nações Estrangeiras no Anno de 1798 (Arquivo Nacional da Torre do Tombo, Lisboa, Portugal, Projecto Reencontro, Biblioteca Nacional, F 0105 P). Instituto Histórico e Geográfico Brasileiro, Rio do Janeiro, Brazil: ARQ 1.5.23, Balança Geral do Commercio do Reino de Portugal com Os Seus Dominios, e Nações Estrangeiras, No Anno de 1808. 9.2. Secondary works publishing and commenting on the data Alexandre, V., (1993), Os sentidos do Império. Questão Nacional e Questão Colonial na crise do Antigo Regime Português, Porto, Edições Afrontamento. Arruda, J. A. (1980), O Brasil No Comércio Colonial, São Paulo, Editora Ática. Balbi, A., (1822), Essai statistique sur le Royaume de Portugal et d'Algarve, comparé aux autres états de l’Europe, et suivi d'un coup d'oeil sur l’état actuel des sciences, des lettres et des beaux-arts parmi les portugais des deux hémisphères, Vol. 2, Paris, Rey et Gravier Libraires. Caetano, A. A., (2001), “O comércio da Ásia e as invasões francesas (encontros e desencontros com o Brasil (1803-1821)”, Revista de História Económica e Social, n.º 2, 2.ª série, Âncora Editora, 35–74. Capela, J. V., (1987), “O porto de Viana no contexto do comércio externo português (análise à balança comercial de 1783)”, Viana – o mar e o porto, Viana do Castelo, Junta Autónoma dos Portos do Norte, 83–114. Carvalho, R., (1979), Relações entre Portugal e a Rússia no Século XVIII, Lisboa, Sá Costa.
Portugal, 1775-1831
Godinho, V. M., (1955), Prix et Monnaies au Portugal, 1750-1850, Armand Colin, Paris. Macedo, J. B., (1990), O Bloqueio Continental: Economia e Guerra Peninsular, 2.ª ed., Gradiva, Lisboa. Macedo, J. B., (1982), Problemas de História da Indústria Portuguesa no século XVIII, 2.ª ed., Querco, Lisboa. Moreira, M. C., (2006), “La Importancia del Mercado Español en el Comercio Exterior Portugués (1796-1831)”, Hispania Nova Revista de Historia Contemporánea, 167–191. Moreira, M. C., (2007), “The role of Quality: Spanish wool in Portuguese Trade in the Early 19th Century”, Essays in Economic and Business History, The Journal of the Economic & Business Historical, vol. XXV, United States of America, Chapman University Society’s Argyros School of Business and Economics, 95–103. Moreira, M. C., (2013), Relaciones comerciales luso-españolas, 1774-1860. Madrid: Editorial Académica Española. Novais, F. A., (1986), Portugal e o Brasil na crise do antigo sistema colonial (1777-1808), São Paulo, Editora Hucitec. Neves, J. A., (1820), Memória sobre os meios de melhorar a industria portuguesa, considerada nos seus diferentes ramos. Reimpreso por Custódio, Jorge (ed.) (1983), Lisboa, Querco. Pedreira, J. M., (1994), Estrutura industrial e Mercado Colonial Portugal e Brasil, 1780-1830, Lisboa, Difel. Ribeiro, J. M., (1997), Comércio e Diplomacia nas Relações Luso-Americanas (1776-1822), Ph.D dissertation, Faculdade de Letras, Universidade do Porto. Ribeiro, M. A., (1972), As relações comerciais entre Portugal e Brasil segundo as “Balanças de Comércio” (1801-1821), Lisboa, Faculdade de Letras de Lisboa. Weber, A., (2008), O Comércio Brasil, Portugal, Hamburgo entre a Colônia e a Nação, Ph.D dissertation, Universidade de São Paulo, São Paulo. 9.3. Secondary works using the data Arruda, J. A., (1978), O comércio entre Portugal e a Itália (1796-1811), São Paulo, USP Arruda, J. A., (2008), Uma colônia entre dois impérios: abertura dos portos brasileiros. A abertura dos portos brasileiros 1800-1808, Brasil, EDUSC. Capela, J. V., (1990), “O Comércio Galaico-Minhoto pela fronteira terrestre análise do movimento da Alfândega de Vila Nova de Cerveira de 1788 a 1833: breve nota”, Braga, Cadernos do Noroeste, vol. 3 (1-2), 65–79. Costa, L. F., (2005), “Relações económicas com o exterior” in História Económica de Portugal (1700-2000), Vol. I, séc. XVIII, Pedro Lains e Álvaro Ferreira da Silva (org.), Lisboa, 263–298.
327
328
Maria Cristina Moreira
Maria, F. J., (1784), Arte e dicionário do commercio, e a economia portuguesa, para que todos negoceen, e governeem os seus bens por calculo e não por conjectura, ou para que todos lucrem mais ou menos risco, Lisboa. Martins, C. A., (1998), Vinha, Vinho e Política Vinícola em Portugal: Do Pombalismo à Regeneração, Ph.D dissertation, Universidade de Évora, Évora. Mata, E. and Valério, N., (1994), História económica de Portugal: Uma Perspectiva Global, Presença, Lisboa. Mata, M. E. and Valério, N., (2011), The Concise Economic History of Portugal: A Comprehensive Guide, Almedina, Lisboa. Moreira, C. and Eloranta, J., (2011), “Importance of «weak» states during conflicts: Portuguese trade with the United States during the Revolutionary and Napoleonic wars”, Revista de Historia Económica – Journal of Iberian and Latin American Economic History, vol. 29, December, 393–423. Moreira, M. C. and Weber, A., (2008), “A importância do mercado brasileiro no comércio externo luso-hamburguês (1796-1831)”, Jahrbuch fuer Geschichte Lateinamerikas Anuario de Historia de América Latina, 45, 325-341. Sideri, S., (1978), Comércio e Poder. Colonialismo Informal nas Relações AngloPortuguesas, Lisboa, Edições Cosmos. Sousa, F. de, (1995), História da estatística em Portugal, Instituto Nacional de Estatística, Lisboa. Sousa, R. M., (2006), Moeda e Metais Preciosos no Portugal Setecentista, 16881797, Imprensa Nacional-Casa da Moeda, Lisboa. Valério, N. (ed.), (2001), Estatísticas Históricas Portuguesas, Vol. 2, Lisboa, Instituto Nacional de Estatística. 9.4. Complementary sources
9.4.1. Primary sources The balances of trade are the most reliable source for studying and quantifying Portuguese external trade from the last quarter of the eighteenth century until 1831. For previous periods there is no one such consistent source. Nevertheless, there is a fairly wide array of sources in the Portuguese national, regional, district, and municipal archives and libraries that can provide data about trade for the seventeenth, eighteenth and earliest nineteenth centuries, such as: a) For Lisbon, the letters of City Hall (published in the work of Freire de Oliveira, Elementos para a História do Municipio de Lisboa); b) the Corpo Cronológico, Ministerio do Reino e Inquisição (kept in the Arquivo Nacional Torre do Tombo); c) the Coleção Pombalina, Memória Feita e Publicada pelos Ingleses em Lisboa em Julho de 1729 (Biblioteca Nacional de Portugal, codex, 638);
Portugal, 1775-1831
d) the freight contracts registered by Portuguese notaries; e) for the trade based on Porto, one can also count on the records of the customs house since 1639, which allow research into quantities imported and exported, something that the contracts do not show; f) the records of the Conselho de Fazenda or the Conselho Ultramarino (useful for clarifying the contexts surrounding freight contracts); g) the Gazeta de Lisboa, a newspaper published between 1715 and 1833; h) the Reflexões geraes sobre o mapa do comercio de Portugal com as nações estrangeiras em 1777 (Biblioteca da Ajuda, códex 52-IX-26(1)), i) consular sources, like the Mémoire sur le commerce de la France en Portugal par le chevalier de Saint Priest, 13 mars 176420, État du Portugal en 1778 – Responses du Consul de France a Lisbonne aux questions envoyées de Paris,21 and Notions générales sur le commerce de Portugal, 178622. j) the Arquivo Histórico do Ministério das Obras Públicas also provides a set of documentation that can shed some light on Portuguese commerce in the eighteenth and nineteenth centuries, namely the following collections: Documentos respeitantes a comércio, 1743-1747, 17891791 e 1795, 1822-183023; Índices dos registos de decretos, alvarás, consultas, ordens e outros documentos respeitantes à Junta do Comércio, 1755-175724; Registos de decretos, alvarás, consultas, ordens e outros documentos respeitantes à Junta do Comércio, 1755-1757, 1755-180225; Documentos acerca de assuntos alfandegários, 1766-178526; Avisos e ordens recebidas, 1757-183427; Consultas da Junta do Comércio, 1763 a 181828; Mesa do Bem Comum dos Mercadores29; Registo dos papéis extraídos da Mesa para a Junta do Comércio 1758-1828, 2 volumes30.
9.4.2. Works on complementary foreign sources Labourdette, J.-F., (1988), La nation francaise a Lisbonne de 1669 a 1790. Entre colbertisme et liberalisme, Paris, Calouste Gulbenkian. (French trade sources) 20. Godinho, 1955: 323-336. 21. Godinho, 1955: 336-341. 22. Godinho, 1955: 341-371. 23. Documents regarding trade, 1743-1747, 1789-1791 and 1795, 1822–1830. 24. Index of the records of decrees, charters, advice, orders and other documents regarding the Trade Board, 1755–1757. 25. Records of decrees, charters, advice, orders and other documents regarding the Trade Board, 1755–1757, 1755–1802. 26. Documents about custom houses matters, 1766–1785 27. Warnings and orders received, 1757–1834. 28. Counsels of the Board of Trade, 1763 to 1818 29. Board of Merchants Common Good. 30. Records of the documents extracted from the Board of Trade, 1758–1828, 2 volumes.
329
330
Maria Cristina Moreira
Fisher, H. S., (1981), “Lisbon, its English merchant community and the Mediterranean in the Eighteenth Century” in P. L. Cottrell and D. H. Aldcroft (eds), Shiping, Trade and Commerce. Essays in Memory of Ralph Davis, Leicester, Leicester University Press, 23–44. (English trade sources) Fisher, H. S. (1984), De Methuen a Pombal: o comércio anglo português de 1700 a 1770, Lisboa, Gradiva. (English trade sources)
9.4.3. Main works about the historical background of Portuguese trade 1750–1850 Alexandre, V., (1979), Origens do colonialismo português moderno (18221891). Portugal no século XIX. Antologia de textos históricos, Vol. III, Lisboa, Sá da Costa Editora. Alexandre, V., (1986), “Um momento crucial do subdesenvolvimento português: Efeitos económicos da perda do Império Brasileiro”, Ler História, 7: 3–45. Alexandre, V., (1989), “Um passo em frente, vários à retaguarda: resposta à nota crítica de Pedro Lains”, Penélope, 3: 103–110. Alexandre, V., (1991), “Resposta à Segunda Nota Crítica: Lains no País das Adivinhas”, Penélope, 5: 165–178. Almeida, L. F., (1981), “Problemas do comércio luso-espanhol nos meados do século XVIII”, Revista de história económica e social, 8: 95–131. Amorim, I., (1996), Aveiro e a Sua Provedoria no século XVIII (1690-1814): Estudo Económico de Um Espaço Histórico, Ph.D dissertation, Faculdade de Letras Universidade do Porto. Amorim, I., (2001), Aveiro e os caminhos do sal: da produção ao consumo (sécs. XV a XX). Aveiro: Câmara Municipal. Bonifácio, M. F., (1987) “Comércio externo e política pautal na 1ªmetade do século XIX”, Ler História, 10: 75–108. Caetano, A. A., (2004), O Porto De Lisboa E O Bloqueio Continental (18061812): Ensaio De História Económica. Academia da Marinha, Lisboa. Capela, J. V., (1986,1987), “O tratado de 1810 com a Inglaterra e a ruína das indústrias nacionais. Uma crítica de António de Araújo Azevedo, Conde da Barca”, Separata de Bracara Augusta, Vol. XL: 1–121. Capela, J. V., (1993), Política, Administração, Economia e Finanças Públicas Portuguesas (1750-1820), Braga, Universidade do Minho. Cardoso, J. L., (1987), Memórias Económicas Inéditas (1780-1808), Lisboa, Academia das Ciências. Cardoso, J. L., (2001), A Economia Política e os Dilemas do Império LusoBrasileiro (1790-1822), Lisboa, Comissão Nacional para as Comemorações dos Descobrimentos Portugueses. Cordeiro, J. L., (1999), “Economia e guerra no período napoleónico”, Ler História, 36: 63–82.
Portugal, 1775-1831
Costa, C. A., (1855), Do contrabando dos cereaes em Portugal, Lisboa, Typographia de José Baptista Morando. Costa, L. F., (2000), “Pernambuco e a Companhia Geral do Comércio do Brasil”, Fazer e Desfazer a História, Penélope, 23, 41–6\6. Costa, L. F., Lains, P. and Miranda S. M., (2011), História Económica de Portugal 1143-2010. Lisboa: A Esfera dos Livros. Costa, L. F. and Rocha, M. M., (2009), «Nas margens do lcontrabando: estrangeiros e comissários volantes no século XVIII em Portugal », in Jorge Braga de Macedo et al. (org.), Nove Ensaios na Tradição de Jorge Borges de Macedo, Lisboa, Tribuna da História, 55–82. Costa, L. F. and Rocha, M. M., (2012), « Merchant networks and Brazilian gold: reappraising colonial monopolies », in Nikolaus Bottcher et. al., (coords.), Redes y Negocios Globales en el Mundo Ibérico, Siglos XVI-XVIII, Instituto Ibero-Americano de Berlin y el Colegio de México, 143–169. Costa, L. F. and Rocha, M. M. and Araújo, T., (2011), “Social capital and economic performance: trust and distrust in eighteenth-century gold shipments from Brazil”, European Review of Economic History, vol. 15 (1): 1–27. Costa, L. F.; Rocha, M. and Sousa, R. M., (2013), O ouro do Brasil, Imprensa Nacional da Casa da Moeda, Lisboa Francis, A. D. (1966), The Methuens and Portugal, 1691-1708, Cambridge, Cambridge University Press. Frutuoso, E.; Guinote, P. e and Lopes, A., (2001), O Movimento do Porto de Lisboa e o Comércio Luso-Brasileiro (1796-1836), Lisboa, Comissão Nacional para as Comemorações dos Descobrimentos Portugueses. Godinho, V. M., (1955), Prix et Monnaies au Portugal, 1750-1850, Paris, Armand Colin. Justino, D., (1988, 1989), A Formação do Espaço Económico Nacional. Portugal 1810-1913. 2 vols., Lisboa, Edições Vega. Lains, P. (1989), “Foi a perda do império brasileiro um momento crucial do subdesenvolvimento português?”, Penélope, 3, 92–102. Lains, P. and Silva, Á. F. (orgs.), (2005), História Económica de Portugal, 1700-2000, Séc. XVIII, Lisboa, Imprensa de Ciências Sociais, Vol. 1. Macedo, A. C., and Pacheco, J. B., (1987), “Os negócios de uma casa de comércio bracarense segundo o copiador de correspondência (17901805)”, Bracara Augusta, vol. XL, n.º 89-90, Braga, Editora Correio do Minho, 293–354. Macedo, J. B., (1989a), A Situação Económica no Tempo de Pombal. Alguns aspectos, 2.ª ed., Lisboa, Moraes Editores. Macedo, J. B., (1989b), “Diplomacia, agricultura e comércio transitário: factores subalternizados no estudo do Tratado de Methuen”,en Alfredo de Sousa et al. (orgs.), Nova Economia em Portugal. Estudos em Homenagem a António Manuel Pinto Barbosa, Lisboa, Universidade Nova de Lisboa, 75–93.
331
332
Maria Cristina Moreira
Macedo, M. R., (2004), “Contratos e Contratadores Régios. Açores na segunda metade do século XVIII”, Revista Arquipélago, História, 2.ª série, Vol. VIII. Macedo, M. R., (2006), Uma Fortuna do Antigo Regime: A Casa Comercial de Nicolau Maria Raposo (1769-1816), Cascais, Edição Patrimónia. Magalhães, J. R., (1988), O Algarve Económico, 1600-1773, Lisboa, Estampa. Martins, F. F., (1987), “Os 150 anos da promulgação da Pauta Geral das Alfândegas de 1837”, separata de la Revista Aduaneira Alfândega, Lisboa, 4, 86 y 5, 87. Melon Jiménez, M. Á., (1999), Hacienda, comercio y contrabando en la frontera de Portugal (siglos XV-XVIII), Cáceres, Cicon Ediciones. Ministério dos Negócios Estrangeiros, ed. (2004), Relações Diplomáticas Luso-Russas. Colectânea Documental Conjunta (1722-1815), Lisboa, Instituto Diplomático Moreira, M. C., (2005), “Fiery Debate: The Need to Use the Portuguese Dry Ports as a Way of Channeling Consular Duties to Spanish Consuls Based in Portugal (1722-1841)”, in Michael Aradas y Nicholas C. J. Pappas (eds.), Themes in European History: Essays from 2nd International Conference on European History, Athens, Athens Institute for Education and Research, 363–370. Morineau, M., (1985), Incroyables gazettes et fabuleux métaux: le retour des trésors américains d´après les gazettes hollandaises (XVI-XVIIIe siècles), Paris-Cambridge, Maison de Sciences de l´Homme-Cambridge University Press. Pedreira, J. M., (1995), Os Homens de Negócio da Praça de Lisboa de Pombal ao Vintismo, 1755-1822: diferenciação, reprodução e identificação de um grupo social, Ph.D dissertation, Universidade Nova de Lisboa, Lisboa. Pedreira, J. M., (2000), “From growth to collapse: Portugal, Brasil, and the breakdown of the old colonial system, 1760-1830”, Hispanic American Historical Review, 80(4): 839–864. Pinto, V. N., (1979), O Ouro Brasileiro e o Comércio Anglo-Português, São Paulo, Companhia Editora Nacional. Pijning, E., (1997), Controlling Contraband: Mentality, Economy and Society in Eighteenth-Century Rio de Janeiro, Baltimore, Ph.D. dissertation, Johns Hopkins University Polónia, A., (2006), “Dinâmicas comerciais e interacções sociais: os portos de Lisboa e Porto nos séculos XVIIe XVIII”, in Fortea Pérez y Gelabert, González ed, La ciudad portuaria atlántica en la Historia. Siglos XVI-XIX, Santander, Universidade de Santander/ Autoridad Portuaria de Santander, 243–280. Polónia, A. and Barros, A., (2012), Articulações Portugal/Brasil: redes informais na construção do sistema atlântico (séculos XVI-XVIII), in Almeida, Suely Creusa Cordeiro de...[et al.] (org.) - Políticas e estratégias administrativas no mundo atlântico. Recife: Editora Universitária da UFPE, 19–48.
Portugal, 1775-1831
Ratton, J., (1813), Recordaçoens de Jacome Ratton sobre occurrências do seu tempo em Portugal durante o lapso de sesenta e tres annos e meio, aliás de Maio 1747 a Setembro de 1810 que rezidio em Lisboa: acompanhadas de algumas subsequentes reflexoens suas, para informaçoens de seus proprios filhos: com documentos no fim, Londres, H. Bryer. Rau, V., (1984), Estudos sobre a história do sal português, Presença. Santos, M. B. and Rodrigues, T. F., (1983), “As Alfândegas de Trás-osMontes: anos de 1791 a 1801”, Estudos Transmontanos, Biblioteca Pública e Arquivo Distrital de Vila Real, 1: 165–236. Schneider, S., (1980), O Marquês de Pombal e o Vinho do Porto. Dependência e Subdesenvolvimento em Portugal no Século XVIII, Lisboa, Regra do Jogo. Schwartz, S. (1985), Sugar Plantations in the Formation of Brazilian Society. Bahia, 1550–1835, Cambridge, Cambridge University Press. Shaw, L. E., (1998), The Anglo Portuguese Alliance and the English Merchants in Portugal, 1654–1810, Aldershot, Brookfield-Ashgate. Silbert, A. (1972), Do Portugal de Antigo Regime ao Portugal Oitocentista, Lisboa, Livros Horizonte. Silbert, A., (1998), Portugal na Europa Oitocentista, Lisboa, Edições Salamandra. Soares, R. M., (1855), Duas Palavras acerca do Opúsculo Intitulado do Contrabando de Cereais em Portugal publicado por Cláudio Adriano da Costa, Lisboa, Tipografia do Jornal do Comércio.
333
ROMANIAN PRINCIPALITIES, EIGHTEENTH CENTURY Cristian Luca1 Lower Danube University of Galaţi (Romania)
1. Coverage This questionnaire discusses the customs data for Wallachia, Moldavia, and Transylvania during the eighteenth century. 2. Documents None of these states drew up a balance of trade from the information collected by their customs institutions. Still, a few overall annual revenue estimates are preserved from customs duties in Wallachia and Moldavia. These data were collected by officers and civil servants working for the Habsburgs. However, their results are doubtful. They suggested an annual revenue of only 30,000 Thalers (approximately 12,000 Venetian gold ducats) in 1716, under the ad valorem taxation of 3%. After 1733, with the generalized system of excise by specific duties applied on each product, the increase in overall revenues was of course substantial; therefore it is impossible to accept annual revenues from customs duties of approximately 11,000 Venetian gold ducats for the year of 1759 for Wallachia, or of 46,000 Venetian gold ducats for Moldavia and Wallachia together. Customs registers are another potential source. In Wallachia and Moldavia, until the customs regulations of 1733, goods were registered by their quantity and value, the basis on which they were taxed. Thus the “Great Excise” was the duty imposed on the quantity of goods (calculated in okas, a capacity unit representing 1.272 kg, or one burden/bale, named after the goods’ place of origin: from Adrianople, from Brusa, from Venice), and the “Little Excise” was imposed on the estimated market value of goods. Most of these registers have been lost.
1.
[email protected]
Revue de l’OFCE, 140 (2015)
336
Cristian Luca
In Habsburg Transylvania, the imperial bureaucracy established a thorough record of customs duties receipts as the eighteenth century represented a distinct stage of administrative modernization. The preservation of registers and of receipts issued to merchants who paid the customs duty allows some accuracy in reconstituting the customs revenues to the Treasury. Tariff lists are another potential source. Habsburg rule in Oltenia (Lesser Wallachia) for two decades from 1719 introduced detailed lists of goods and products subject to customs clearance, setting out in minute detail the tolls to be paid in florins and their subdivision, the dinars (a silver coin equivalent to the money of account named ban or leu). These existed also in Transylvania throughout the period. The same model was followed by the authorities in Wallachia and Moldavia, who during the eighteenth century introduced detailed lists of goods subject to customs clearance; those lists included hundreds of product names. There is no information on detailed lists of goods categories subject to customs clearance in Wallachia and Moldavia before the end of the seventeenth century. The lists became more detailed during the eighteenth century. At the end of the seventeenth century these category lists for taxable goods encompassed some dozens of products, and in the eighteenth century several hundred goods were listed. Such tariffs are widespread in Wallachia and Moldavia after 1733. On the basis of these sources, we know the variety of goods imported and exported. One can notice, for example, the exponential growth of cereal exports from the Romanian Principalities after 1774, when the Ottoman Empire had to accept the opening of the Black Sea Basin for international maritime trade, at first under the Russian flag and then under the flags of Austria and other Western states. However, we can only guess the revenues resulting annually from excise or trade. For maritime and fluvial trade, neither the customs registers of the ports nor the written record of commercial shipping entering or leaving ports have survived for Wallachia and Moldavia. In the Danube ports under direct Ottoman rule, such data were assiduously collected and are still held in archives in Turkey. Some sources touching on the situation in the fifteenth and sixteenth centuries in the Bulgarian ports and in Dobrudja have been published. It is unlikely that we will be able to reconstruct the missing information, since in the case of Wallachia and Moldavia customs registers do not even survive for the cities where goods were subject to internal
Romanian Principalities, eighteenth century
customs duties; here too the extant sources are mostly price lists of goods. So we know the variety of imported and exported goods, and can only guess at the customs revenues resulting from excise on those goods. Given the current state of preservation and the statistical data we possess, it would be impossible to reconstitute the balance of trade of the Romanian Principalities and Habsburg Transylvania during the eighteenth century. 3. Institutions During that period, border customs points registering the flow of goods in and out of the Romanian Principalities were entrusted to the Treasury of Wallachia and Moldavia. Thus, the central authority, represented by the Grand Exciseman, a great state officer appointed by the Prince himself and responsible to him alone, could control the revenues due both to the Prince, namely to his personal Treasury, and to the state Treasury. The Treasury centralized and annually checked the flow of goods into and out of the country through records kept by the Exciseman’s secretaries at every border customs office. In Transylvania, which became a province of the Habsburg Empire at the end of the seventeenth century, records concerning the collection of duties were delivered to the Regio Thesauriatu Magni Principatus Transylvaniae, which was thus also an over-arching institution also, although in this case it was a more local institution under the Imperial governor. In the case of Wallachia and Moldavia, as in the case of Transylvania, there were no central institutions other than the Treasury tasked with establishing trade statistics. 4. Motivation In Wallachia and Moldavia, when the Treasury was directly controlling the customs, there was of course an administrative logic in collecting data, because duty revenue was to a certain extent directed towards the personal Treasury of the Prince, who was therefore directly interested, personally and as head of State, in the high customs officials delivering the total amounts received. Where the customs were leased to merchants, the Prince would appoint his own customs officers to shadow those of the leaseholder and guarantee the proper functioning of the customs, to prevent abuses by the leaseholder, and to collect part of the duties that were due to the Treasury of the state.
337
338
Cristian Luca
5. Methods For goods subjected to ad valorem customs duties, the value in tariff lists was established by a committee of experts, made up of merchants and high officials, mostly nobles who were active in the central and local administration. This committee would draw up lists of goods mentioning the value of each item, to be taxed at a customs duty of 3%. 6. Information Values are given in various monetary units. Twenty-two different foreign currencies were in circulation in Wallachia and Moldavia in the eighteenth century, with the following most commonly used: the lion dollar issued by the Republic of the United Provinces, which entered Romanian as the leu (from the original Leeuwendaalder), the Ottoman piastre (guruş), the Imperial Thaler (Reichsthaler) and the florin issued by various German cities, and after 1754 the Austrian Gulden. Edmund Chishull (1671–1733), one of the attendants of Lord William Paget, the British Ambassador to Constantinople, wrote in 1702: “[…] the one that usually circulates in this country [Wallachia] is either the Dutch Thaler or the Venetian Thaler with the lion, together with the quart of Poland and a Transylvanian Saxon coin named ban, of which 132 make one leu” (Holban et al., 1983, p. 201). In 1711, the customs duties for sable, fox, and wolf furs brought from Transylvania south of the Carpathians were paid in these currencies (Hurmuzaki, 1913, doc. MMDCCCXLV, p. 1511 and Iorga, 1937, p. 5). In 1717 the customs at Vâlcan took tariffs on goods imported from Wallachia (grain, cattle, pigs, goats, sheep, wine, raw wax, Danube fish, salted fish, pelts of wolf, bear, fox, and polecat, butter, whey cheese, wool, smoke tree bark, hemp, cordovan) and on goods exported to the south of the Carpathians (iron farm tools and quicksilver) (Giurescu, 1913, doc. 117 and Iorga, 1937, p. 8). Commodity names in the tariff lists were mostly names that are found in the commercial terminology of the entire Balkan region. Such names were also used for animal materials (cattle hides), raw and processed: for instance cordovan, used for the production of footwear and harness components. Less often, local names were also listed. As long as the goods were charged for by quantity rather than by their market value, the origin of goods was mentioned: from Constantinople, from Brusa, from Adrianople, from Venice and so on. In the tricesimal registers (for the collection of tricesimal excise tariffs – 3% –
Romanian Principalities, eighteenth century
for goods sold in the cities of Transylvania) in Cluj, Braşov, Sibiu etc., there was only a general mention of the point of origin: “Oriental goods” came from the Ottoman Empire, with no further detail given; even carpets generically called “Persian” or Iznik pottery could not be considered as being made in Persia or Iznik/Nicaea. As for their place of destination, the markets targeted by merchants can be guessed depending on the customs points where goods were taken out of the country. The transit trade through Wallachia and Moldavia was destined for the Polish city of Lwów, in the north, a centre for the redistribution of goods throughout Poland and to the shores of the Baltic. Transit trade through Transylvania aimed either at the German cities, if we consider the cattle exported on those markets from Moldavia, or Lwów again, for goods coming from the north of Italy and Hungary, in the latter case during the Venetian-Ottoman Wars in the seventeenth and eighteenth centuries.
7. Research questions A first possible area of research is customs policies. In Wallachia and Moldavia, tariffs had been fixed since 1691 (this included customs duties ad valorem 3% imposed for every 125 kg of goods, depending on their place of origin: 250 bani for goods from Adrianople; 166 for goods from Brusa; 166 for goods from Persia; 333 for goods from Venice; at the time, one United Provinces leeuwendalder = 133 bani = 133 Ottoman silver akçe; 330 akçe = 1 Venice gold ducat), and a few taxes imposed per product: 1000 akçe to the oka of saffron; 140 akçe/the raw cotton oka; 168 akçe/the cotton yarn oka; 80 akçe/the rice oka; 150 akçe/the olive oil oka etc. With the establishment of a protectionist economic policy, especially in Transylvania, following a decision of the Court in Vienna, imports for some finished products were either forbidden or subject to huge duties of 100–200%, to discourage imports and steer the market towards the consumption of internal products from the Habsburg Empire. The authorities in Wallachia and Moldavia prohibited imports of salt, raw wax, cattle, wool, and grain (except during periods of critical food shortage). The small amount of information on the functioning of the customs in this part of Eastern Europe means that we cannot use methodologies that could provide a set of data comparable to what is available in Western Europe. For the Romanian Principalities, we can only make informed guesses with a high margin of error.
339
340
Cristian Luca
The situation in the Romanian Principalities concerning customs, excise, and the revenues resulting from duties is complex, given the lack of sources; this is where the gaps in the documentation hit hardest. At the present stage of research, we can record goods imported and exported goods in the case of Wallachia and Moldavia, with product categories and typical products; we can track the evolution of prices for those goods alongside detailed tariffs and profiles of the moneys of account and currencies circulating in this part of Europe. Hence, we can trace differences and similarities in relation to other economies on the continent, both part of the periphery and the core. Still, the statistical-mathematical method represents the most suitable tool for comparative analysis of the evolution of the economy in the Romanian Principalities in the eighteenth century. A European or global database is viable as long as scholars bear in mind each national historiography’s potential to analyse its sources and evaluate the results in a general framework. A register of the goods imported and exported from certain areas of Europe would shed light on the specificity of various economies and their stages of development, but also on the complementarity between economic systems and at the core and at the periphery of the World Economic System; for example, the economies exporting raw materials imported finished products in the seventeenth century, progressively importing technology and know-how from the mid-eighteenth century and over the next century. Although internal statistical data based on external sources from foreign archives are missing, surprising new data may come to light to clarify, for example, the increasing importance of grain exports from Wallachia and Moldavia to Western Europe starting in the last quarter of the eighteenth century and increasing thereafter. The preponderance of a certain type of export goods and the scale of those exports (as in the case of the grain trade) led to changes in the local economy, influencing the regional economic situation, then regional geopolitics, given that Europe’s more economically developed states had an interest in restricting Russia’s influence in the Black Sea area and in defeating Russian attempts to control the Mouths of the Danube, a significant outlet for grain during the nineteenth century. 8. Bibliography Bogdan, N. A., (1925), Din trecutul comerţului moldovenesc şi mai ales al celui ieşan, Iaşi. Ciobotea, D., (1984), “Vămile din Oltenia în secolul al xvii-lea şi [la] începutul secolului al xviii-lea,” Arhivele Olteniei, New Series, 3: 89–94.
Romanian Principalities, eighteenth century
Demény, L. A., (1970), “Relaţiile comerciale ale Transilvaniei în lumina veniturilor vamale din anii 1717–1724,” Studii. Revistă de istorie, XXIII, 5: 989–998. Demény, L. A., (1975), “Le régime des douanes et des commerçants grecs en Transylvanie au cours de la période de la principauté autonome (1541–1691),” Makedonika, 15: 62–113. Giurescu, C., (1913), Material pentru istoria Olteniei supt austrieci,, Vol. I, 2: 1716–1725, Bucharest. Gonţa, A., (1989), Legăturile economice dintre Moldova şi Transilvania în secolele XIII-XVII, edited, foreword, bibliography and index by Ioan Caproşu, Bucharest. Holban, M., M. M. Alexandrescu-Dersca Bulgaru and P. Cernovodeanu (editors), 1983, Călători străini despre Ţările Române, Vol. VIII, Bucharest. de Hurmuzaki, E., (1913), Documente privitoare la istoria românilor, Vol. XV/ 2, Bucharest. Iordăchescu, V. T., (1934), Evoluţia politicei şi legislaţiei vamale a României, Vol. I: 1408–1886, Bucharest. Iorga, N.,(1937), Istoria comerţului românesc. Epoca mai nouă, Bucharest. Pap, F., (1980), “Orientarea central–europeană a comerţului clujean în prima jumătate a sec. XVII,” Acta Musei Napocensis, XVII: 209–218. Pap, F., (1982), “Orientarea balcano-otomană şi mediteraniană în comerţul clujean (prima jumătate a sec. xvii),” Acta Musei Napocensis, XIX: 98–103. Şerban, C., (1961), “Sistemul vamal al Ţării Româneşti în secolul al xviiilea”, Studii şi articole de istorie, III: 119–143. Tofan, C., (2002), “Consideraţii istorice asupra evoluţiei vămilor pe teritoriul Ţării Moldovei în secolele XIV-XVIII,” Carpica, XXXI, 111–122. Vasilescu, Al. A., (1924), “Vămile Olteniei supt austrieci,” Arhivele Olteniei, III, 15: 370–381.
341
RUSSIA, 1758-1766 Werner Scheltjens Universität Leipzig)
F
rom the early eighteenth century onwards, several scattered records regarding the trade of individual Russian ports in single years have been preserved. Excerpts of some of these records have been published here and there, but most of them are only accessible at the Russian State Archive of Ancient Documents (Rossijskij Gosudarstvennyj Archiv Drevnich Aktov) in Moscow. The first Russian trade statistics that deliberately aimed at covering the entire Russian empire, are kept in the collections of College of Manufactures (Manufaktur-Kollegija)1. These statistics cover imports and exports the years 1758, 1759 (only imports), 1762, 1763 (only imports) and 1764-17662. The earlier records contain less detail than the later ones and mainly provide aggregated figures of the values of goods imported to and exported from the Russian Empire. From 1764 onwards, the trade statistics comprise separate lists of imports and exports for each of the 28 toll stations of the Russian Empire, ranging from Riga and St. Petersburg on the Baltic coast, to Archangel and Onega on the coast of the White Sea, Moscow and several other toll stations in the Russian heartland and Astrachan’ on the Caspian Sea. Although there are differences between the amount of information provided by each toll station, most of the statistics of imports and exports between 1764 and 1766 contain information about the goods, their weight, value, origin and taxation. Sometimes, the final destination of the goods passing the toll is registered as well. Thus, these trade statistics provide a wealth of information about trade streams in the 1. Of particular importance are the collections of the College of Commerce (KommertsKollegija) and the College of Manufactures (Manufaktur-Kollegija). 2. RGADA, fond 277 (Manufaktur-Kollegija), opis’ 3, dela 619-631. mail:
[email protected]
Revue de l’OFCE, 140 (2015)
344
Werner Scheltjens
Russian Empire around the mid-eighteenth century. Until now, only the import and export statistics for St. Petersburg in 1764 have been published3. After 1766, the early effort of Russian tax officials to draw up trade statistics comparable to those of France was abandoned until the end of the eighteenth century4. In 1802, the collection of Russian trade statistics took a new start5. For the years between 1802 and 1807, only aggregated trade statistics for the entire country are preserved, which hardly contain any geographical information. After a brief interruption during the Napoleonic Wars, the gathering of Russian trade statistics took its regular course in 1812, when the import and export statistics of the different Russian toll stations were gathered and published in annual overviews of the Russian empire’s trade6. The statistics of Russia’s external trade in the first half of the nineteenth century were used extensively by Nebol’sin7. Recently, the annual publications of nineteenth-century Russian trade statistics have been used as an additional source of information in a project on the dynamics of economic and social development in Russia during the nineteenth and early twentieth century8, which insofar as foreign trade is concerned, relies largely on Pokrovskij’s 1902 survey of the history and statistics of Russia’s foreign trade9. 3. Demkin, A.V., Vnešnjaja torgovlja Rossii čerez peterburgskij port. 1764 god. Vedomost’ ob importe inostrannyx tovarov, Moskva 1996; Ibidem, Vnešnjaja torgovlja Rossii čerez peterburgskij port. 1764 god. Vedomost’ ob ėksporte rossijskix tovarov, Moskva 1996. 4. Nevertheless, here and there, some statistical information regarding Russia’s foreign trade can be found. For example in: Storch, Heinrich von, Historisch-statistisches Gemälde des Russischen Reichs am Ende des achtzehnten Jahrhunderts, Leipzig 1797-1803; Čulkov, M.D. Istoričeskoe opisanie rossijskoj kommercii pri vsech portach i granicach ot drevnich vremjan do nyne nastojaščego i vsech preimuščestvennych uzakonenij po onoj gosudarja imperatora Petra Velikago i nyne blagopolučno carstvujuščija gosudaryni Imperatricy Ekateriny Velikija, Moskva 1781-1788. 5. See: Rumjancev, N. Gosudarstvennaja torgovlja 1802 goda v raznych ee vidax, Sankt-Peterburg 1802. A summary in French of the trade statistics for the years between 1802 and 1805 was published in 1808. See: Rumiantsev, N., Tableau du commerce de l’empire de Russie: Années 1802, 1803, 1804, 1805. St. Pétersbourg 1808. 6. An uninterrupted series of Russian trade statistics is available from 1812 up to 1915. During this century, the precise format of the annual publications was changed several times, adding and removing particular tabular visualisations of Russian trade streams. The annual statistics were published under slightly different names. Until 1864, their publication was executed by the Department of Foreign trade; after 1864, it was handed over to the Ministry of Finance. For a brief introduction to these series (in Russian), see: T.Ja. Valetov, “Vnešnjaja torgovlja. Dinamičeskie rjady,” retrieved from http://www.hist.msu.ru/Dynamics/10text.htm. 7. Nebol’sin, G. Statističeskoe obozrenie vnešnej torgovli Rossii, Sankt-Peterburg 1850. 8. For more information (in Russian) about the project “Dinamika ėkonomičeskogo i social’nogo razvitija Rossii v XIX – načale XX vv.,” see the project website: http://www.hist. msu.ru/Dynamics/index.html. 9. Pokrovskij, V.I. Sbornik svedenij po istorii i statistike vnešnej torgovli Rossii, Sankt-Peterburg 1902.
SCOTLAND, 1707-1783 Philipp Robinson Rössner1 University of Manchester and Universität Leipzig
1. Coverage This questionnaire discusses trade statistics available for Scotland. I have only examined records for the time between 1707 and 1783 but the General Accounts of the Scottish Board of Customs (from 1707, National Archives of Scotland/NAS, E501 series) as well as the customs accounts or ‘port books’ (NAS, E504) run well into the nineteenth century. I have shown in my 2008 book2 that total yields of the Old Subsidy – the major customs duty which all imports that were not generally freed from duty had to pay – give an accurate approximation of the overall trend in Scottish imports, 1707–1783. Thus you can ‘reconstruct’ or rather extrapolate the cyclical pattern of total imports in a very speculative-approximate way for the gap in the series between 1707 and 1755. From 1755 to 1800, we have trade statistics (total volume of imports and exports) (TNA, P.R.O., CUST14). From 1743 we have the port books, from which we may back-project / ‘reconstruct’ trade statistics, CUST14 between 1743 and 1755. But that would be of little use as Scotland contributed less than one per cent to European foreign trade 2. Documents From 1755 onwards, when the office of the Inspector General of Imports and Exports was established in Scotland (by Treasury order dating from 1754), detailed trade statistics have survived, which break down Scotland’s gross total trade by (1) imports, (2) exports, and (3) reexports in time (re-exported within three years after import, drawback of import duty), as well (4) as re-exports out of time (no draw-back). These tables were broken down alphabetically, starting with country 1.
[email protected] 2. Philipp Robinson Rössner, Scottish Trade in the Wake of Union. The Rise of a Warehouse Economy (Stuttgart, 2008), p. 318, Fig. 4.4.
Revue de l’OFCE, 140 (2015)
346
Philipp Robinson Rössner
(“Africa”, then “America” etc.) and then commodity. This is what they look like (Fig. 1).
alphabetically,
by
Figure 1. Ledger of Imports and Exports (TNA, P.R.O., CUST 14, imports, 1755)
© National Archives of Scotland
3. Institutional setting The Board of Customs was responsible for the production of these documents. It was established 1707 and situated at Edinburgh – with an intermezzo between 1723 and 1742 when the Board was dissolved and administrative capacity regulating trade and customs relocated to London.3 Upon the Union of the Kingdoms in 1707 separate government departments were established in England and Scotland, mainly the Board of Customs and Excise, as well as a few other institutions. The office of Inspector General of Imports and Exports was created as late as 1755. From that date onwards we have official and full trade statistics for Scotland. For England (statistics: TNA/P.R.O., Customs 3 series) and Ireland (CUST 15) such an inspector general had been instituted in 1696.
3. Rössner, Wake, ch. 3 for full discussion of sources and ch. 2 for a discussion of the taxation framework.
Scotland, 1707-1783
The first Scottish inspector, Archibald Campbell, held office until 1764/5, succeeded by Robert Menzies of Coulterallars, who continued to work as a clerk for his successor John Wightman from 1769 on. In 1754, Campbell was advised to follow English practice and precedent. So in terms of content and design the CUST14 series is comparable to the English series.
4. Motivations The English and Irish offices of inspector general of imports and exports had been established in 1696.4 Scotland, however, with a considerably lower per capita trade volume than England and minuscule net taxation yields – most of the taxes generated within Scotland were spent and thus remained within Scotland – was of no major interest to the Treasury and thus remained left without such statistics until 1755. The available circumstantial evidence suggests that the establishment of the Scottish office in 1755 was the result of the Treasury’s concern about a depression in the Scottish tobacco trades in 1754-55 which came after a continuous and rapid expansion between 1736 and 1753.5
5. Methods The methods used are difficult to ascertain, as no immediate documents relating to either the establishment of the Inspector General’s office, nor its subsequent practice of compiling and presenting the data have survived. I did a sample of cross-checks of the Scottish customs accounts with Hamburg and Bremen imports, as well as a select cross-examination of a series of private merchant papers from Buchanan&Simson6, a tobacco import-export partnership flourishing in Glasgow between 4. I am following Rössner, Wake, 112. 5. Rössner, Wake, statistical appendix. Also: Philipp Robinson Rössner, ‘New Avenues of Trade. Structural Change in the European Economy and Foreign Trade as Reflected in the Changing Structure of Scotland’s Commerce’, Journal of Scottish Historical Studies, XXX1/1 (2011), 1–25; id., ‘Structural Change in European Economy and Commerce, 1660–1800. Lessons from Scotland’s and Hamburg’s Overseas Trades’, The Bulletin of the Institute for World Affairs, Kyoto Sangyo University, XXVII (2011), 25–62; Thomas M. Devine / Philipp Robinson Rössner, ‘Scots in the Atlantic Economy 1600–1800’, in: John MacKenzie / Thomas M. Devine (eds.), Scotland and the British Empire (Oxford, Oxford University Press, 2011), 30–54. 6. Rössner, Wake, ch. 8; Philipp Robinson Rössner, Scottish Trade with German Ports, 1700–1770. A Study of the North Sea Trades and the Atlantic Economy on Ground Level (Stuttgart, 2008), ch. 2.
347
348
Philipp Robinson Rössner
1759 and 1763 when the firm went bankrupt and their records were ordered into the Court of Session for bankruptcy procedures. The question of reliability is philosophical and I am not qualified to answer it as my background is in economic history. The Scottish sources and trade statistics are the best you can possibly get for the period. Yet scholars have estimated the level of smuggling in certain commodities such as tobacco at up to 50 or 60 per cent of factually declared cargoes. And if we compare private merchants’ records, such as letter books, ledgers, journals and account books with the declarations they made in the ports – for those stray cases for which we have both sides of the evidence – the result is often depressing: merchants clearly tended to under-state real amounts shipped in the ports, so as to minimize their liabilities – under-declaration was also a form of smuggling, alongside the more obviously incriminatory strategy of full concealment (i.e. no declaration). We find such deviances even in the trade of low-duty low-value bulk goods such as timber. Sometimes they may even have overstated amounts so as to distort market information (on supply) to rivals – the customs books were potentially accessible by the public and used by rival merchants to get information on markets, prices and volumes. On the other hand there are not better sources at hand. If you bear in mind all possible biases and adjust your perspective accordingly the Scottish sources – in my opinion – give away a reliable indication of overall commercial fluctuations. In very general terms it should be noted that a mismatch between customs accounts of several countries in terms of export declarations in, say, country (port) x for country (port) y deviating from import declarations in country (port) y indicating country (or port) x as country (port) of origin and vice versa, are somewhat expectable given the design of the macro-institutional framework, i.e. the English Restoration Customs System of Charles II and the Navigation Acts of 1660, which set a framework to the merchants of incentives, costs and rewards to customs evasion. This cost-benefit schedule obviously differed from commodity to commodity. But due to the peculiar structure of duties post-1707, especially the fact that merchants got a full drawback of import duties on tobacco upon re-export to Europe, customs evasion became increasingly costly over time (given the risks) and, increasingly, legal trading under the mercantilist umbrella complying to the rules set by the state paid off, as is borne out by the commercial boom in terms of legal (i.e. declared) figures of the Glaswe-
Scotland, 1707-1783
gian tobacco imports and exports between 1736 and 1776.7 We need to keep in mind, however, that the Scottish trade statistics – as any other contemporary material – merely represent contemporary estimates of the intended trade flows, rather than accounts of the factual amounts traded. Merchants could and would conceal, re-direct cargoes and under-, or sometimes even overstate the factual size and direction of trade flows, wherever they thought it appropriate, feasible or worth the potential cost. But in terms of trade theory or the heuristic value of the present project it makes no radical difference whether some cargoes were only intended to be shipped without the final implementation of the intention, or whether they were shipped in reality as intended, as it was the a priori consideration of price differentials resulting from productivity and labor cost differentials and different economic structures and wealth differentials prevailing in the several trading countries, which led to a particular structure of the trade volume between Scotland and the rest of the world in the longer run. The Scottish customs accounts are therefore quite indicative of general trends and structures in Scotland’s overseas trade volume and economic trends in the period under consideration.
6. Information CUST14 conveys information regarding (a) country of origin (imports) / destination (exports); (b) specification of commodities carried; (c) quantities in British ships, or (d) quantities in foreign ships (important for monitoring the enforcement of the Navigation Act 1660); (e) valuation (price interval given in minimum and maximum prices; the actual valuation that was applied was the arithmetic mean of the two); (f) total value (quantities in (c) and (d) multiplied by the arithmetic mean of starting and ending point of the interval in (e)). Generally, imports were valued free on board (in the exporting country); (b) exports were also valued free on board, in this case Scotland (called in the sources “estimate of the first cost or value”); (c) reexports were valued in ‘estimate of the value in Scotland after the duties are drawn back’-terms, which in this instance, as the export of a previously imported product was concerned, must have covered cost, insurance, freight upon import plus the share of customs duties which could not be drawn back upon re-export, plus some allowance for 7. I have discussed this mechanism in Rössner, Wake, ch. 2 as well as in my chapter Devine/ Rössner, ‘Scots in the Atlantic Economy.’
349
350
Philipp Robinson Rössner
a profit mark-up. The export/re-export pricing did apparently not include the costs of re-shipping the goods from Britain (transport and insurance). I have examined the Scottish statistics until the 1780s and found them to be “quasi-volumetric” as for all but a very minor number of goods (less than 1 per cent in terms of number/type of good) the 1755 ‘price’ (interval) was kept as a valuation until the American War in 1776/83. Only grain prices (imports) were subject to minor subsequent alterations which seems a somewhat random strategy, as other goods’ prices – especially for tobacco, Scotland’s main import and export commodity at the time – were exhibiting violent year-to-year fluctuations if private merchant records are to be believed. The English trade statistics (CUST3) turned into a volumetric series by c.1709.8 If therefore the 1755 prices in any way correspond to contemporary commercial reality, this volumetric schedule would represent a useful tool for the analysis of real (or commodity) fluctuations, being a readymade physical index for weighing commodities that entered the trades in differing measures, which otherwise would have to be computed by an extremely tedious procedure. This is because the changing valuations for grain imports (a low-cost bulk good) do not influence the overall Sterling value of the trade flows in any statistically significant way, in particular as they were not yet regular nor large (Scotland was until the 1760s a net exporter of grain on average and in most years apart from harvest crises).9 Invisibles were not recorded at the time. Likewise, bullion transfers and flows of precious metals, which were recorded into the English ledgers (CUST3), were not recorded in the Scottish ledgers. To compute the actual value of trade flows, between 1742 and 1755 we have the port books or customs accounts (NAS, E504) from which a full series of imports and exports may be reconstructed but that would take years and you would need a whole army of research assistants. That is probably not worth it as Scotland was a small and fairly insignificant player in European trade. I did a full reconstruction of such a set of import-export statistics for 1754; it took me more than six months of full-time research (five days per week, about seven hours per day typing in data), and I arrived at somewhere near 130,000 single entries for an SPSS database. I also did this for 1755, the year the 8. “Quasi-volumetric” because some valuations were altered in subsequent years. 9. See Philipp Robinson Rössner, ‘The 1738–41 Harvest Crisis’, The Scottish Historical Review XC/1 (2011), 27–63, and id., Wake, Appendix, 324 (Fig. 4.15).
Scotland, 1707-1783
CUST14 series started, in order to check where there were matches as well as gaps / mismatches between the disaggregate data given in the port records (customs accounts, NAS, E504) and the official statistics (Inspector General’s Ledgers of Imports and Exports, TNA, P.R.O./ CUST 14). Apparently the match was quite close; I broke down the figures by commodity groups based on the 1972 Brussels Customs Classification for the Foreign Trades, and found that in each group the mismatch in value terms (I valued the differences in amounts shipped using the official valuations in TNA, CUST 14 given in £Sterling) to be usually around 5 per cent. I have published a full discussion of this and tables in an article for the Scripta Mercaturae in 2009.10 For a statistical institution of that time, i.e. the Inspector General who was in charge for collection of trade data, this was not too bad, meaning that the information flow between the outports and their officials (Collectors of Customs) and the Board of Customs in Edinburgh, to which the Inspector General belonged, was actually quite good! However, the exercise is circular-tautological to an extent because any bias resulting from smuggling that went into the outport records (customs accounts/ port books) also found its way into the national statistics. Prior to 1743 we have select Treasury accounts deposited in the National Archives (TNA) in Kew/London, chiefly on Scottish wine imports, tobacco imports and re-exports, grain and fish exports from Scotland – but no national aggregates for trade flows whatsoever. I have discussed these sources and possibilities in Rössner, Wake, ch. 3 and reproduced figures for tobacco and wine imports/exports in the statistical appendix to that monograph. The goods were apparently classified according to a template sheet (copies/examples of which have not survived) that was sent out by the Inspector General from Edinburgh to all 28 or so out ports in Scotland in 1755. The schedule of data gathering was standardized (as standardized as you could get at that time). Some ports provided bad data; some ports better quality figures, depending upon training, financial infrastructure and time the outport collector had for doing these things for the Board in Edinburgh. Many collectors, especially in the smaller ports, were ‘habitually drunk’ or incapacitated for other reasons, as the contemporary sources frequently state11, and they did not necessarily 10. Philipp Robinson Rössner, ‘Weights and Measures in Early Modern Taxation and Accounting Procedures – The Example of Eighteenth-century British Customs Statistics’, Scripta Mercaturae, 43 (1/2009), 1–72. 11. Rössner, Wake, ch. 2 and 3 for examples.
351
352
Philipp Robinson Rössner
produce what we would nowadays call ‘statistical’ material, as there was, on top of the smuggling bias, a lot of fiction in ‘statistical’. Overall, however, the rhythms and patterns of Scottish overseas trade in the eighteenth century can be more or less reliably covered, arguably much better than for any other country in Europe at that time. The declared origin always was the last port of call, and as far as I can determine, customs officials tried to get hold of the original certificates of lading upon the ship’s anchoring at a Scottish port. The destinations were, as you can imagine, more fictional, giving the next – i.e. intended – port of call. But there were occasions when customs officers from Scotland were actually put on board the ship, travelling until the next port of call so as to witness due discharge of the goods as declared in Scotland. This was only very infrequently and irregularly done, as you can imagine, as it was obviously ridiculously costly to monitor customs evasion that way. Sometimes it was done in the case of ports relatively close-by as Bergen in Norway (from which the officers could return on another ship quite quickly), in the case of high value and high-duty goods (such as brandy or tobacco) which would have paid a high duty upon import into Britain. There obviously would have been an incentive by merchants to ‘run’ these goods, i.e. reimport them illicitly without declaration and payment of the import duty. These indications are not very reliable from a modern statistical viewpoint (see preceding paragraph); but they were consistent. They can be checked against the Sound Toll Registers for transit into / from the Baltic and the respective mirror sources in other countries. Data are broken down by port of dispatch/landing, but only in the case of the port books (NAS, E504). Figure 2 gives an example of the first page of the port book / customs account for the port of Aberdeen, Ladyday (first quarter) 1755, for imports.
7. Availability The port books (National Archives of Scotland, E504 series) are available on a quarterly basis (with only less than a handful of gaps) from Christmas Quarter 1743 onwards. The trade statistics (The National Archives, P.R.O., CUST 14) begin in 1755 and are fully preserved (microform and printed copies in the NAS; originals in TNA, England).
Scotland, 1707-1783
Figure 2. Customs Account / ‘port book’, Aberdeen, January 1755
NAS, E504/1/1 © National Archives of Scotland.
8. Research questions We should have more bilateral studies between countries to see what the differences were in terms of statistical concept, the concept of recording commercial data and monitoring trade flows, the techniques at hand, the financial infrastructure etc. The problem is that contemporaries recorded the data for purposes that were very different from ours. To give but one example: Customs accounts or ‘port books’ which were widely known across north-west Europe do – contrary to the interpretation of some historians – not represent import-export accounts, but rather accounts of taxes paid, their allocation and share which was remitted to the central institution that was in charge with administering fiscal yields (i.e. the Treasury in Britain’s case). Therefore imports or exports that took place within a certain year but which were either withheld from the market (e.g. put into a warehouse) or else not yet assessed, did not find their way into aggregate trade statistics for the year in which they took place; they were only recorded when customs duty was actually paid which could take years after the cargo had been shipped in. I have researched this in detail, see my Wake, ch. 3.
353
354
Philipp Robinson Rössner
9. Bibliography Cochran, L. E., (1985), Scottish Trade with Ireland in the Eighteenth Century. Cole, W. A., (1957), “Trends in Eighteenth Century Smuggling”, Economic History Review, Second Series, 359–410. Conseil de Cooperation Douanière and Customs Co-operation Council (1972), Nomenclature for the Classification of Goods in Customs Tariffs 1972. McNeill P.G. B. and MacQueen, H. L., (1996), Atlas of Scottish History to 1707. Nash, R. C., (1982), “The English and Scottish Tobacco Trades in the Seventeenth and Eighteenth Centuries: Legal and Illegal Trade”, Economic History Review, Second Series, XXXV, 354–372. Price, J. M., (1973), France and the Chesapeake. A History of the French Tobacco Monopoly 1674-1791, and of its Relationship to the British and American Tobacco Trades, 2 Vols. Price., J. M., (1975), “New Time Series for Scotland’s and Britain’s Trade with the Thirteen Colonies and States, 1740 to 1791”, William and Mary Quarterly, XXXII, 307–325. Rössner, Philipp Robinson, (2008), Scottish Trade in the Wake of Union 1700–1760. The Rise of a Warehouse Economy. Rössner, Philipp Robinson, (2008), Scottish Trade with German Ports, 1700– 1770. A Study of the North Sea Trades and the Atlantic Economy on Ground Level. Rössner, Philipp Robinson, (2011), “The 1738–41 Harvest Crisis”, The Scottish Historical Review XC-1, 27–63. Rössner, Philipp Robinson, (2011), “New Avenues of Trade. Structural Change in the European Economy and Foreign Trade as Reflected in the Changing Structure of Scotland’s Commerce”, Journal of Scottish Historical Studies, XXX1-1, 1–25. Rössner, Philipp Robinson, (2009), “Weights and Measures in Early Modern Taxation and Accounting Procedures – The Example of Eighteenth-century British Customs Statistics”, Scripta Mercaturae, 43: 1–72. Rössner, Philipp Robinson and Devine Thomas M., (2011), “Scots in the Atlantic Economy 1600–1800”, in: John MacKenzie-Thomas M. Devine (eds.), Scotland and the British Empire, 30–54. Smout, T. C., (1963), Scottish Trade on the Eve of Union 1660-1707. Smout, T. C., (1983), “Where Had the Scottish Economy got to by the Third Quarter of the Eighteenth Century?” in: I. Hont-M. Ignatieff (eds.), Wealth and Virtue. The Shaping of Political Economy in the Scottish Enlightenment, 45–72.
SPAIN, 1717-1827 Javier Cuenca-Esteban1 University of Waterloo
1. Coverage This questionnaire refers to trade statistics available for Spain from 1717 to 1827. Spain’s colonial trade can be quantified at some levels of aggregation for 1717-1820 and 1827. Spain’s foreign (and overall) trade in this period is far more poorly documented, and only for occasional years in the 1780s and in 1792, 1795, 1826, and 1827. Earlier Spanish trade statistics for 1504-1700 do not allow for credible estimates of import and export values: see the major works by Chaunu, Lorenzo Sanz, and García Fuentes. Relatively detailed and homogeneous trade accounts, covering both colonial and foreign trade, were published in scattered years after 1827, and annually since 1850. The meaning and the reliability of the official trade values in these documents have been a subject of controversy. Also note that all former Spanish colonies except Cuba, Puerto Rico and the Philippine islands had become independent by 1826. 2. Documents The documents covering Spain's colonial trade include (A) cargo inventories for convoyed fleets and individual ships; (B) the occasional Balanza (synthetic documents itemizing import and export quantities and/or values by commodities and geographic areas); and (C) certain tax proceeds including those from consular duties. The documents covering Spain's foreign trade include some contemporary publications and the occasional Balanza. The only extant Balanzas for the period considered here are those for 1792, 1795, 1826, and 1827. 3. Institutional setting The institutions involved in data collection were the Casa de Contratación, subsequently also the Consulados de Comercio – first in 1.
[email protected]
Revue de l’OFCE, 140 (2015)
356
Javier Cuenca-Esteban
Cadiz and later at major port cities – and eventually the Oficina de la Balanza de Comercio. Initially, ship captains submitted cargo inventories to the Casa de Contratación which in turn authorized and ordered customs inspection at the ports: see the major works by Chaunu, Lorenzo Sanz, García Fuentes, and García-Baquero González. The Oficina de la Balanza de Comercio was set up in the late 18th century to receive and to aggregate trade data.
4. Motivations The initial and sustained purpose for the gathering of trade data was tax collection. Official efforts to ascertain the composition of external trade go back to 1623, when Philip IV ordered that detailed records of all commodities exported and imported be kept at all customs offices in Spanish ports. These and subsequent official efforts did not yield a full Balanza until 1792.
5. Methods The cargo declarations submitted by ship captains to the Casa de Contratación, first as lists of “bundles” and eventually commodity by commodity, were later checked and verified at the customs. For Spain's colonial trade, there seems to be no such thing approximating an official balance-of-trade statement other that the Balanzas for 1792 and 1827. As noted below the valuation procedures involved are hard to verify. But the import values for 1792 tally tolerably well with independent calculations that ultimately rest on cargo-inventory evidence. In this writer's view, the annual estimates of import and export values now available for 1782-1820 are reasonable approximations to the elusive truth on the standards allowed by the extant sources: see Cuenca Esteban, “Statistics” (2008). For Spain’s foreign (and overall) trade, again only a few published accounts for the 1780s, and the foreign-trade tables within the official Balanzas for 1792, 1795, 1826, and 1827, come close to balance-oftrade statements, in the limited sense that they give export and import values. Such values were presumably calculated at market prices; no attempts have been made so far to confirm this point, perhaps because the Balanzas are so scattered in time that any such exercise would serve little more than a purely technical purpose.
Spain, 1717-1827
6. Information The only information initially collected was tons of shipping, but this was replaced with records of actual trade flows as indicated below. There were a host of taxes and customs duties – the yields from those on colonial trade in particular are available in serial form. But such was the variability of tax incidence, and of commodity coverage over time, that efforts to draw on such revenue series as proxies for trade flows are thought unreliable. Prior to 1778, reliable export values cannot be calculated from the extant sources. The available data cover largely import and export quantities in trade with the Spanish colonies, both in periodic, convoy-protected fleets and in separately sailing ships. No import values were collected in the period 1717-38; but García-Baquero proxied these values, with due caution, with the proceeds of the avisos duty (1%). Import values in pesos for 1747-78 can and have been calculated from quantity data and independently compiled prices. More generally, a large variety of price sources can and have been used to compute current values from the extant quantity evidence: see the relevant references under 9-d below and Cuenca-Esteban, “Statistics” (2008), Appendix 1: “Import prices at Spanish and European ports: constructed annual series, 1747-1820”. Most of the trade values given in reales de vellón since 1778 were officially calculated at the fixed prices specified in a major tariff document that was published in that year (Reglamento). The cargoinventory data also provide current import values for Cadiz only through 1790-96. The import quantities of precious metals, largely silver, were valued in various descriptions of silver coin (pesos) or in reales de vellón. For a constructive synthesis of recent work on Spanish colonial trade, with new annual estimates of current import values through 1747-1820, see again Cuenca Esteban, “Statistics” (2008). No information on transport cost is given in the sources, but estimates for Spain's colonial trade in selected sub-periods within 17841820 are attempted in Cuenca Esteban, “Statistics” (2008), Table 3. For Spain's foreign (and overall) trade, the extant sources do not indicate which prices were used for valuation. Given the cryptic nature of the published information, and the enormous variety of commodities mentioned in the Balanzas, it is next to impossible to verify the accuracy of the valuation procedures. Each of the Balanzas is systematically organized around commodity categories, types, and varieties by geographic origin and destination.
357
358
Javier Cuenca-Esteban
But these classifications changed substantially between Balanzas. When working with cargo inventories, coherent overall series can and have been reconstructed with enormous expense of time and effort. The commodity descriptions were probably made by the ship captains who prepared the cargo inventories. Large numbers of goods were listed, often distinguishing grades and varieties within broad commodity categories. In the 1792 Balanza alone, this writer has counted 961 separate goods exported and 170 imported, respectively to and from Spain's colonial territories. The published Balanzas provide the origin and destination of itemized goods by Spanish ports, by American and Asian colonies, and by foreign countries – all, apparently, according to the last/first port of call. Geographic distinctions are seemingly exhaustive and remarkably homogeneous. For instance the 1792 Balanza lists, for each commodity exported to the Spanish American colonies, 17 separate American destinations from 13 different Spanish ports; similar distinctions are made for imports from Spanish America into Spain. The 1795 Balanza lists 30 different foreign countries for both exports and imports, again to and from 13 different Spanish ports. 7. Availability Only some import and export quantities up to 1778, and a few constructed series of trade values thereafter, have been published in secondary sources so far. The accuracy and robustness of some of the published value series have been questioned. This writer contemplates making available a number of trade and price series in digitized form, but this project is not a priority at this time. 8. Research questions The data have been used (A) as a basis to quantify the cost to Spain of the loss of the colonies in 1808-26 (Fontana Lázaro: 1970; Prados de la Escosura: 1978); (B) to calculate the Spanish terms of trade (Prados de la Escosura: 1985; Delgado Ribas: 1986; Cuenca-Esteban: 2008); (C) as a proxy (in the case of exports) for trends and cycles in domestic production (García-Baquero González: 1774, 1776); and (D) to compare Spain's external position with Great Britain's (CuencaEsteban: 2008). All these themes can benefit from further work, but one major obstacle stands in the way: as noted, the extant Spanish figures of trade with foreign countries appear to be limited to some cursory and unreli-
Spain, 1717-1827
able accounts for the 1780s and to the Balanzas for 1792, 1795, 1826, and 1827. The long gaps and inconsistencies involved can be addressed only by way of aggregation of other countries' trade with Spain. So far, foreign trade statistics have been drawn upon to estimate Spain's trade with Great Britain (Prados de la Escosura: 1984; Cuenca-Esteban: 2004), with the United States of America (Cuenca Esteban: 1984), and with France (Cuenca Esteban: 1987). George M. Welling's major ongoing project has already produced values and quantities of Amsterdam's imports from Spain in 1742, and also annually through 1771-87; these series should reach well into the 19th century once the relevant figures in the Paalgeld records are fully processed and digitized. It should also be possible to draw on Portugal´s detailed, annual trade figures since 1796. Judging from the Spanish Balanza for 1795, the largest components of Spanish trade that are yet to be proxied with foreign figures include, in this order, imports from “Germany”, Hamburg, Genoa, Portugal, Switzerland, and Toscany; and exports to Genoa, Hamburg, “Germany”, Portugal, and Denmark. 9. Bibliography 9.1. Primary sources AGI (Archivo General de Indias, Seville): Contratación, legajos 1196-1264, 1451, 1453-55, 1459, 1474-77, 1483, 1590, 1613, 1617-20, 1635, 1675, 1679, 1683, 1697-98, 1787, 1950-67, 2145, 2360-99, 2425-28, 2451-58, 2461-62, 2466-67, 2470, 2492, 2596-97, 2614, 2617, 2619, 2673, 267778, 2683-86, 2716, 2725, 2835-39, 2848-51. AGI (Archivo General de Indias, Seville): Indiferente General, legajos 217396, 2209A, 2209B, 2210-12, 2397, 2398-2401, 2441-61. AGS (Archivo General de Simancas, Valladolid): Dirección General de Rentas, 2a remesa, legajos 169, 568–79. AHN (Archivo Histórico Nacional, Madrid), (1795): Consejo de Estado, libro 7 (mfm: “positive” reel 2983): “Representación y Estado de la Balanza favorable... 1787-92”, referring to the Consejo of 16 May 1794, El Conde de Montarco, Aranjuez. Almanak mercantil ó Guia de comerciantes, Madrid: Viuda de D. Joaquín Ibarra, 1795-1803; Madrid: Imprenta de Vega y Compañía, 1804–07. Balanza del comercio de España con las potencias estrangeras en el año de 1792..., Madrid: Imprenta Real, 1803: copy in AMH (Archivo del Ministerio de Hacienda, Madrid), O.P. 4569 [bound with Balanza... India, 1792]; also separate MSS book in ibid, O.P. 4569: Explicación de los estados que forman la balanza del comercio recíproco que hizo España con sus colonias en América y con las potencias estrangeras de Europa, Asia y Africa en el año de 1795.
359
360
Javier Cuenca-Esteban
Balanza del comercio de España con los dominios de S.M. en América y en la India en el año de 1792..., Madrid: Imprenta Real, 1805. [see also a relevant reference under AMH above] Balanza del comercio exterior de España en el año 1795, introd. Antonio Matilla Tascón, Madrid: Instituto de Estudios Fiscales, 1965. Balanza del comercio de España con las potencias estranjeras en el año de 1826..., Madrid: Imprenta de Miguel de Burgos, 1828. Balanza del comercio de España con nuestras Américas y las potencias extrangeras en el año de 1827..., Madrid: Imprenta de Miguel de Burgos, 1831. Correo Mercantil de España y de sus Indias, Madrid: Imprenta de Vega y Compañía, 1792-1808. Estado que manifiesta los valores que produgeron a la Real Hacienda los derechos que se exigían en la contratación del puerto de Cádiz de ida y venida de América y también en la Aduana... en los últimos cuatro años del antiguo sistema de comercio..., 3 hojas en folio, Cádiz: 11 de enero 1790 [MSS in Biblioteca Nacional, Madrid]. Reglamento y aranceles reales para el comercio libre de España a Indias 12. de octubre de 1778, Madrid: Imprenta de Pedro Marín. [also eds. Bibiano Torres Ramírez and Javier Ortiz de la Tabla, Seville: Facultad de Filosofía y Letras de la Universidad, 1978]. 9.2. Secondary works publishing and commenting the data Belloto, Manoel Lelo, (1971), Correio maritimo Hispano-Americano. A carreira de Buenos Aires (1767-1779), Assis (Brasil): Facultade de Filosofia, Ciências e Letras. Bourgoing, Jean-François, (1803), Tableau de l’Espagne moderne, 3 tomes, troisième édition, Paris: Levrault frères. Chaunu, Huguette and Pierre, (1956), Séville et l'Atlantique, 1504-1650, 11 Paris: Lib. Armand Colin, 1955–59. Cuenca Esteban, Javier, (1981), “Statistics of Spain's Colonial Trade, 17921820: Consular Duties, Cargo Inventories, and Balances of Trade”, Hispanic American Historical Review, 61: 381–428. Cuenca-Esteban, Javier, (2008), “Statistics of Spain's colonial trade 17471820: New estimates and comparisons with Great Britain”, Revista de Historia Económica / Journal of Iberian and Latin American Economic History, XXVI, 3: 323–54. Delgado Ribas and Josep María, (1978), “Comercio colonial y fraude en Catalunya. Algunas consideraciones en torno a los registros del libre comercio a Indias (1778-1796)”, Estudios Históricos y Documentos de los Archivos de Protocolos, VI: 311–326. Fábregas Roig, Josep, (2005), “El primer año del libre comercio en Cataluña”, in El sistema Atlántico español (siglos XVII-XIX), eds. Carlos Martínez Shaw and José María Oliva Melgar, Madrid: Marcial Pons, 285–309.
Spain, 1717-1827
Fisher, John Robert, (1981), “Imperial 'Free Trade' and the Hispanic Economy, 1778-1796”, Journal of Latin American Studies, 13, 1, 21–56. Fisher, John Robert, (1985), “The Imperial Response to 'Free Trade': Spanish Imports from Spanish America, 1778-1796”, Journal of Latin American Studies, 17(1): 35–78. Fontana Lázaro, Josep, (1970), “Colapso y transformación del comercio exterior español entre 1792 y 1827. Un aspecto de la crisis de la economía del Antiguo Régimen en España”, Moneda y Crédito, 115: 3–23. García-Baquero González, Antonio, (1972), Comercio colonial y guerras revolucionarias, Sevilla: Escuela de Estudios Hispano-Americanos. García-Baquero González, Antonio, (1974), “Comercio colonial y producción industrial en Cataluña a fines del siglo XVIII”, in Agricultura, comercio colonial y crecimiento económico en la España contemporánea, eds. J. Nadal and G. Tortella, Barcelona: Ariel, 268–94. García-Baquero González, Antonio, (1976), Cádiz y el Atlántico (1717-1778). El comercio colonial español bajo el monopolio gaditano, 2, Sevilla: Escuela de Estudios Hispano-Americanos [Cadiz: Diputación Provincial]. García-Baquero González, Antonio, (2003), “Los resultados del libre comercio y 'el punto de vista': una revisión desde la estadística”, in García-Baquero González, A., El comercio colonial en la época del absolutismo ilustrado: problemas y debates, Granada: Universidad de Granada, 187–216. García-Baquero González, Antonio, (2003), “De la mina a la plantación?: La nueva estructura del tráfico de importación de la Carrera en la segunda mitad del siglo XVIII”, in García-Baquero González, A., El comercio colonial en la época del absolutismo ilustrado: problemas y debates, Granada: Universidad de Granada, 59–102. García Fuentes, Lutgardo, (1980), El comercio español con America 16501700, Sevilla: Diputación Provincial and Escuela de Estudios HispanoAmericanos. Izard, Miguel, (1974), “Comercio libre, guerras coloniales y mercado americano”, in Agricultura, comercio colonial y crecimiento económico en la España contemporánea, eds. J. Nadal and G. Tortella, Barcelona: Ariel, 295–321. Lorenzo Sanz, Eufemio, (1979), Comercio de España con América en la época de Felipe II, 2 vols., Valladolid: Diputación Provincial. Prados de la Escosura, Leandro, (1978), “El comercio exterior español, 17901830. Una reconsideración”, Hacienda Pública Española, 55: 339–49. Prados de la Escosura, Leandro, (1981), “Las estadísticas españolas de comercio exterior 1850-1913: El problema de las 'valoraciones”, Moneda y Crédito, 156: 43–60. Prados de la Escosura, Leandro, (1984), “La evolución del comercio exterior, 1790-1929”, Papeles de Economía Española, 20: 133–150. Prados de la Escosura, Leandro, (1993), “La pérdida del Imperio y sus consecuencias económicas”, in La independencia americana: consecuen-
361
362
Javier Cuenca-Esteban
cias económicas, eds. Leandro Prados de la Escosura and Samuel Amaral, Madrid: Alianza Editorial, 253–300. Valera Marcos, J., (1990), “Estado de la cuestión sobre el comercio castellano-americano por Santander, 1765-1778”, Revista de Indias, 188: 171–182. 9.3. Secondary works Cuenca Esteban, Javier, (1982), “Comercio y Hacienda en la caída del Imperio español, 17781826”, in La economía española al final el Antiguo Régimen, III. Comercio y Colonias, ed. J. Fontana, Madrid, Bank of Spain/ Alianza Editorial, 389–453. Cuenca-Esteban, Javier, (2008), “Statistics of Spain's colonial trade 17471820: New estimates and comparisons with Great Britain”, Revista de Historia Económica / Journal of Iberian and Latin American Economic History, XXVI, 3: 323–54. Cuenca-Esteban, Javier, (2014), “British 'Ghost' Exports, American Middlemen, and the Trade to Spanish America, 1790-1819: A Speculative Reconstruction”, William and Mary Quarterly, 3rd series, 71, 1: 63–98. Fontana, Josep, (1971), La quiebra de la monarquía absoluta, 1814-1820. La crisis del Antiguo Régimen en España, Barcelona: Ediciones Ariel. López Martínez and Antonio Luis, (2010), “Cádiz y el comercio entre Europa y América a finales del siglo XVIII. Una aproximación a partir de las pólizas de seguros marítimos”, Jahrbuch für Geschichte Lateinamerikas, 47: 213–246. Martínez Shaw, Carlos, (1981), Cataluña en la Carrera de Indias, Barcelona: Editorial Crítica. Prados de la Escosura, Leandro, (1988), De Imperio a Nación. Crecimiento y atraso económico en España (1780-1930), Madrid: Alianza Editorial. Vilar, Pierre, (1962), La Catalogne dans l'Espagne moderne. Recherches sur les fondeménts économiques des structures nationales, 3, Paris: S.E.V.P.E.N., III. 9.4. Complementary sources Ardoin, Blanqui, Burat et al., Diccionario Universal del Comercio, de la Banca, de las manufacturas y de las mercaderias, Málaga: Imprenta y Librería de Martínez de Aguilar, 2, 1845–46. Cuenca Esteban, Javier, (1984), “Trends and Cycles in U.S. Trade with Spain and the Spanish Empire, 1790-1819”, Journal of Economic History, XLIV, 521–543. Cuenca Esteban, Javier, (1987), “Fundamentos para una interpretación de las estadísticas comerciales francesas, 1787-1821, con referencia especial al comercio franco español”, Hacienda Pública Española, 108-109: 221–251.
Spain, 1717-1827
Cuenca Esteban, Javier, (1991), “Precios y cantidades en el comercio español con Francia y Gran Bretaña, 17971807: Coyuntura internacional y opciones imperiales”, Revista de Historia Económica, IX, 127–163. Cuenca Esteban, Javier, (2004), “Comparative patterns of colonial trade: Britain and its rivals”, in Exceptionalism and Industrialisation. Britain and its European Rivals, 1688-1815, ed. Leandro Prados de la Escosura, Cambridge: Cambridge University Press, 35–66. Delgado Ribas and Josep María, (1986), “Libre comercio: mito y realidad”, in T. Martínez Vera, ed., Mercado y desarrollo económico en la España contemporánea, Madrid: Siglo XXI de España, 69–83. Delgado Ribas and Josep María, (1989), Comercio colonial y crecimiento económico (1776-1808). Una interpretación a partir de los precios, Bellaterra: Institut d'Anàlisi Econòmica. Feliu, Gaspar, (2004), “Aproximació a un índex del cost de la vida a Barcelona, 1501-1807”, in Josep Fontana, ed., Història i projecte social. Reconoixement a una trajectòria, 2 vols., Barcelona: Crítica, I, 151–70. Gallo, Andrés and Carlos Newland, (2004), “Globalización y convergencia de precios en el imperio español 1660-1810”, Revista de Historia Económica, XXII, 2: 573–96. Hamilton, Earl J., (1988), Guerra y precios en España 1651-1800, Madrid: Alianza Editorial, [1947]. Marién y Arróspide, Tomás Antonio de, (1789), Tratado general de monedas, pesas, medidas y cambios de todas las naciones, reducidas á las que se usan en España, 2, Madrid: Imprenta de D. Benito Cano. Martínez Vara, Tomás, (1997), “Una estimación del coste de la vida en Santander, 1800-1860”, Revista de Historia Económica, XV, 1: 87–124. Morilla Critz, José, (1972), Introducción al estudio de las fluctuaciones de precios en Málaga (1787-1829), Málaga: Diputación Provincial de Málaga. Prados de la Escosura, Leandro, (1984), “El comercio hispano-británico en los siglos XVIII y XIX. I. Reconstrucción”, Revista de Historia Económica, Año II, 2: 113–162. Prados de la Escosura, Leandro, (1985), “Las relaciones reales de intercambio entre España y Gran Bretaña durante los siglos XVIII y XIX”, in La nueva Historia Económica en España, eds. Pablo Martín Aceña and Leandro Prados de la Escosura, Madrid: Editorial Tecnos, 119–165. Reher, D.S. and E. Ballesteros, (1993), “Precios y salarios en Castilla la Nueva: la construcción de un índice de salarios reales, 1501-1991”, Revista de Historia Económica, XI, 1: 101–151.
363
SPANISH AMERICA, 1790-1830 Alejandra Irigoin1 London School of Economics
1. Coverage This questionnaire discusses the state of the commercial data in the former Spanish Empire in mainland South America (exclusive of Brazil) and includes some general references to the new republics that emerged in the disintegrating Empire (exclusive of islands like Cuba and Puerto Rico in the Caribbean). It covers the period from 1790 to 1830. When war that broke in Europe by 1793 prejudiced the regular commerce on Spanish ships, the Spanish King allowed trade on Neutrals ships – mainly North American – which thereafter intermediated up to a third or more of the overseas trade of these colonies according to estimates and informed guesses of historians of individual national economies. US merchants and shippers added to active significant intermediation by Genoese and Portuguese in already in place in the Southern Cone during the late 18th century and took over a sizable share of freight from the long time declining Spanish fleet. More often than thought the odd British or French ship which by means of a paying a surtax were always allowed to dock at Spanish American ports alleging (averias, lit: damage or malfunction on the ship) downloaded goods in the main ports as Buenos Aires, Montevideo, Valparaiso as in several lesser ports on the coast of Venezuela, Colombia in the Caribbean and along the Atlantic coast all the way to the river Plate, (often en route from Brazil) and the South Pacific. Navigation around Cape Horn was probably at its peak over this period of time as shown in the US commercial statistics. Following the French invasion of Spain in 1808 and the end of the Spanish rule in America local elites took over the control – political and economic – of each fiscal district. Politically, but also in fiscal and monetary regards the former empire fragmented in more than twenty autonomous units. Difficulties to establish a successor political regime with some legitimacy opened a period of civil war and fuelled political 1.
[email protected]
Revue de l’OFCE, 140 (2015)
366
Alejandra Irigoin
instability until the 1850s or even later in some places. This process severely disrupted any administrative capacity of the state throughout South America. The imperial structure of revenue collection imploded as well and provisional republican governments struggled to expand their fiscal base and collect more revenues. As part of major institutional reforms most of the new republics in the1820s attempted to detach state income from trade – since customs (almojarifazgo) and excise (alcabalas) had been the main source of colonial revenues – and to collect further revenues from direct taxes. The level of tariff estimated at 33% for most of the imperial ports was initially lowered but widespread monetary and political turmoil altered exchange rates locally and whichever expected benefits for commerce from lower fiscal burden was immediately distorted. Fast rising public deficits brought the tariff back to previous levels or higher as Customs became the single source of fiscal revenues feasible in the context or turmoil and civil war. Notwithstanding political independence the fiscal structure the Spanish Empire based on taxing trade and consumption remained in place and was further reinforced in the post colonial period with the quick failure of the first fiscal reforms.
2. Documents In spite that Customs (mainly from taxes on imports) made between 60 and 90% of revenues in these republics, there was no systematic production of documents on trade – and far less on imports. Both aspects are the effect of the institutional weakness and generalized administrative disarray of the period. There are however numerous periodical publications of the time, gazettes, journals, newspapers, consular reports and travelers accounts printed in Europe and at each of the main ports engaged in overseas trade (with Spain and beyond) which offer good detailed but unfortunately partial statistical information so by no means they allow an idea of totals, or annual stocks or flows with which to reconstruct a balance of trade. The weak integration of domestic markets resulting from the end of the Spanish government distorts any commercial information derived from trade data recorded at ports; this information encompasses very limited coverage of the actual geographical consumption of imports and of the origin of commodities for exports.
Spanish America, 1790-1830
3. Institutional setting Despite the importance of trade taxes there was no centralized institution tasked with registering trade, either in the colonial or republican period. Taxes on overseas trade and on overland (intraregional) commerce were farmed to the Merchants guilds (Consulados) during the period of Spanish period; and in most places the structure for the assessment and collection persisted under different name. After 1820s although most of the new republics established Customs Houses and legislation, assessment of prices for the valuation of the advalorem tariff was done by the individual merchant and its collection remained farmed out in practice. Customs made (on paper) 60% and more of the Revenues in most of the former colonies; the administrative capacity was so limited that no registration of trade flows was possible. There is nearly no statistical account of the volume, value and composition of imports into any of the South American ports from local sources. Furthermore, as legacy of the colonial taxation of separate treasury districts internal customs remained in place – or emerged – often within the jurisdiction of the same country, e.g. imports paid taxes at the port in Valparaiso and again when entering Santiago de Chile; Veracruz and populous cities in the interior of Mexico, or Buenos Aires and the more populated inland towards Bolivia are similar cases. Run as a private purse by regional elites, the internal custom houses were even less capable to produce information. There is absolutely no systematization of the information or even summaries. Only when the financial standing of the government improved in the late 19th century – usually associated with the renewal of foreign lending and favorable international commodity prices – there was greater administrative capacity by central governments to set a proper collection mechanism of data and of taxes. Hence the quality of information improved after the 1870s Data on export are more frequently cited in compilations and reports of the time, newspapers, pamphlets, possibly because these were fewer and more standardized goods. But it is uncertain how systematic the compilation and the publications were. Generally exports were lightly taxed and often with specific taxes (a fix amount per unit or quantity) thus only major exports were recorded. Export of specie, gold silver bullion, was highly taxed or outright prohibited, yet outflow of bullion are ever present in the historical literature of each individual country. It is assumed – as it was at the time – that outflows of silver mainly (coined and in bars) were massive through contraband so they escape the (whichever) statistics. Partial data available and
367
368
Alejandra Irigoin
occasional reports for different regions show consistently a substantial commercial disequilibrium which was met with specie. Figments of what ought to be the trade balance intimates a slow decrease in the volume of imports (despite falling values) over the long run. The conventional historiography has quickly concluded this was originated in the specie outflows to balance trade. However because there is no means to estimate neither volume nor values of imports it is difficult to establish the real extent of this shrinking import capacity in the light of increasingly booming new export commodities by the 1840s, in some countries like Argentina, (rather Buenos Aires), and Chile and after the 1850s in other countries like Peru and Colombia.
4. Information When available, the data for exports usually state quantities, values and destination per each commodity. Any value expressed in local currencies needs to be adjusted by one or another deflator otherwise stated amounts would be meaningless. Each political and fiscal unit emerging from within the Spanish empire issued or minted her own currency at different point in time and there were long periods of repeated debasement, multiple coinages within one single country and various attempts with paper currency. Hence the fragmentation of the colonial monetary union added to ongoing market disintegration. Whereas the region was drained of old Spanish American silver pesos – which increasingly performed more as unit of account, i.e. the peso fuerte – the multitude of bad and worse monies affected real exchange rates by distortions from local monetary circumstances. By the 1820s increasing volume of transactions were priced in sterling or equivalent in gold ounces as the silver standard used for the 18th century disintegrated. As data on local exchange with sterling is common this should be used a deflator to capture incidents in the local currencies purchasing power – yet data series need to be constructed.Problems of interpreting nineteenth-century trade statistics can be found in Platt, D. C. M. (1971). “Problems in the Interpretation of Foreign Trade Statistics before 1914.” Journal of Latin American Studies 3 (2):119-30 which is particularly valuable for the period covered in this essay. The most comprehensive list of goods available – for imports – can be derived for the tariff lists in the various customs laws discussed in congress (to no much avail). They tend to list several thousands of items individualized by particular details and some of which, particularly manufactures were aggregated in the occasional published
Spanish America, 1790-1830
summary according to the rate at which they were taxed, irrespective of qualities, origin and price. Because for both export and imports data refers to ports of call, substantial re-exports overland go missing. 5. Research questions Scholars have made different attempts to reconstruct balance of trade with very limited information and very often have derived the data from country of origin / or destination. Yet those estimates maybe misleading as they count trade by ship flags and port of arrival / departure and not necessarily final destination. A massive re-exports trade, particularly imports further inland where population was largest, goes missing or it is wrongly assigned to the first port of call. The reconstruction of balance of trade in this period is impossible for all of the above. Evidence of this is the unsatisfactory state of the research on economic and commercial issues of South America in the time period. Generally speaking the statistics age come to being in South America by the 1870s. The most compelling reconstruction has been made by Javier Cuenca Esteban in his various articles after a very long time devoted to mine data from archives of European trading partners. Of those which I have seen they tend not to distinguish among ports in South America and probably only list the first port of call. Data thus is lumped in broad regional categories for the destination – it is particularly so the earlier the period of the data. 6. Bibliography Below I have listed titles which may offer some information but as for the overall commerce they only have partial data according to the national (bilateral) trade they have focused on. 6.1. Spanish American trade with Spain Coatsworth, J., (1967), “American Trade with European Colonies in the Caribbean and South America, 1790-1812” The William and Mary Quarterly 24(2): 243-266. Fisher, John R., (1993), El Comercio entre España e Hispanoamérica: 17971820. [Madrid]: Banco de España, Servicio de Estudios. (available online). This accounts, in Spanish, for partial statistical information, (e.g only the permitted trade on ships to and from Spain).
369
370
Alejandra Irigoin
Nichols, R. F., (1933), “Trade Relations and the Establishment of the United States Consulates in Spanish America, 1779-1809”. The Hispanic American Historical Review. 13 (3): 289-313. Hispanic American Historical Review 13(3): 289-313 Ortíz de la Tabla Ducasse, Javier, (1978), Comercio exterior de Veracruz: 1788-1821, Crisis de dependencia. Sevilla: Escuela de Estudios Hispanoamericanos. CSIC. 6.2. Spanish American trade with the US American state papers documents, legislative and executive, of the Congress of the United States (1832). IV. Commerce and Navigation. Washington: Gales and Seaton. 2. Barbier, J. and A. Kuethe, (1984), The North American Role in the Spanish Imperial Economy, 1760-1819. Manchester, Manchester University Press. Cuenca Esteban, J., (1984), “The United States balance of payments with Spanish America and the Philippines Islands, 1790-1819: estimates and analysis of principal components”. In J. Barbier and A. Kuethe. The North American role in the Spanish Imperial economy, 1760-1819. Manchester, Manchester University Press: 28–70. Cuenca Esteban, J., (1984), “Trends and Cycles in US trade wtih Spain and the Spanish Empire, 1790-1819.” Journal of Economic History, 44(2): 521–543. Cuenca-Esteban, J., (2014), “British ‘Ghost’ Exports, American Middlemen, and the Trade to Spanish America, 1790-1819. A Speculative Reconstruction.” William & Mary Quarterly 71(1): 63–98 6.3. British trade with South America (in English) Humphreys, R. A., (1940), British consular reports on the trade and politics of Latin America, 1824-1826. London: Offices of The Royal historical Society. Fisher, John R., (1992), Trade, war, and revolution: exports from Spain to Spanish America, 1797-1820. Liverpool: Institute of Latin American Studies, University of Liverpool. Fisher, J., (1993), El comercio entre Espana e Iberoamerica, 1797-1820. Madrid, Banco de Espana. Pearce, Adrian J., (2007), British trade with Spanish America, 1763-1808. Liverpool [England]: Liverpool University Press. Platt, D. C. M., (1972), Latin America and British trade, 1806-1914. London: A. and C. Black. Llorca-Jaña, Manuel, (2012), The British textile trade in South America in the nineteenth century. Cambridge: Cambridge University Press. Greenhill, Robert G., (1973), British shipping and Latin America, 1840-1930: the Royal Mail Steam Packet Company. Exeter: University of Exeter.
Spanish America, 1790-1830
6.4. Trade with France Various years, starting in 1839 for South America with acceptable level of geographical disaggregation. Tableau décennal du commerce de la France avec ses colonies et les puissances étrangères... 1827 à 1836 (1887 à 1896). Documents relatifs au commerce des nouveaux États de l’Amérique, communiqués par le bureau de commerce et des colonies, aux principales chambres de commerce de France. (Publié par le journal du Commerce). 1825. Librairie de l’industrie (Paris). http://gallica.bnf.fr/ark:/12148/ bpt6k1417509 (online) Say, Horace, (1839), Histoire des relations commerciales entre la France et le Brésil et considérations générales sur les monnaies, les changes, les banques et le commerce extérieur. Paris: Guillaumin. Schneider, Jürgen, (1975), Handel und Unternehmer im französischen Brasiliengeschäft 1815-1848: Versuch e. quantitativen Strukturanalyse. Köln: Böhlau. Schneider, Jürgen, (1981), Frankreich und die Unabhängigkeit Spanisch-Amerikas: zum französischen Handel mit den entstehenden Nationalstaaten (1810-1850). Stuttgart: Klett-Cotta [in Komm.]. Schneider, Jürgen, (1981), “Terms of Trade between France and Latin America, 1826-1856” in International Economic History Congress, Paul Bairoch, and Maurice Lévy-Leboyer. Disparities in economic development since the industrial revolution. New York: St. Martin's Press. 110–119. 6.5. Trade with other European countries Berliner colonisations-gesellschaft für Central-Amerika, (1850), Die deutsche ansiedelung in Mittel-Amerika. Berlin: Im selbstverlage des Comité der Berliner Colonisations-Gesellschaft für Central-Amerika. Schneider, Jürgen, Karl Erich Born and Hermann Kellenbenz, (1978), Wirtschaftskräfte und Wirtschaftswege: Festschrift für Hermann Kellenbenz I, I. Wirtschaftskräfte Und Wirtschaftswege. [Stuttgart]: in Kommission bei Klett-Cotta. Oskar, Schwarzer, 1983. “Der Hamburger Exporthandel mit der Karibik und Mexiko (1814-1838)”. Scripta Mercaturae, 17(1): 45–88. 6.6. For Mexico Alvarado Gómez, Armando and Inéz Herrera Canales, (1985), Principales productos del comercio exterior mexicano del siglo XIX: recopilación de estadísticas económicas del siglo XIX en México. México: INAH, Dirección de Estudios Históricos. López Rosado and Diego G., (1980), Fuentes para el estudio del comercio interior y exterior. México: Universidad Nacional Autónoma de México. See ch 3 Abastecimiento de carne en la Ciudad de México, 1714-1811, por Aida Castilleja González.
371
Cruz Barney, Oscar, (2005), El comercio exterior de México, 1821-1928 sistemas arrancelarios y disposiciones aduanales. México, D.F.: Instituto de Investigaciones Jurídicas-UNAM, Instituto de Investigaciones Jurídicas. Customs Legislation. Herrera Canales, Inés, (1977), El comercio exterior de México, 1821-1875. México, D.F.: Colegio de México. Chávez Orozco, Luis, (1966), El comercio exterior y la expulsión de los españoles. México: Banco Nacional de Comercio Exterior. Mexico, (1827), Balanza general del comercio marítimo por los puertos de la República Mexicana en el año de 1825. México: Impr. del Aguila, dirigida por José Ximeno.
SWEDEN AND FINLAND c.1700-1809, FINLAND 1809-c.1850 Jari Ojala1 University of Jyvaskyla, Finland
Jari Eloranta2 Appalachian State University, USA
1. Coverage This questionnaire discusses trade statistics for both Sweden and Finland (1700–1809) and Finland (c. 1809–1850). After that period, official state statistical compilations are available for both Sweden and Finland. 2. Documents The local custom offices reported exports and imports to the capital, Stockholm, since the 1630s. National summaries based on these reports were compiled rather sporadically, and from the 1720s onwards the Swedish Board of Trade (Kommercekollegium, Kammarkontoret) compiled more precise annual reports on foreign trade. The local customs office reports were also standardized during the early eighteenth century; thus, the data from then onwards is more reliable. Annual statistics on foreign trade were compiled from 1739. Statistics on shipping were compiled more accurately from the 1760s onwards. The shipping data, however, include only ships carrying export and import goods and those laying at home port during the winter time. Thus, these statistics do not include “tramp” shipping between third countries. These series became more accurate during the course of eighteenth century. The data are provided on exports and imports and shipping, summarized from all towns in the Swedish realm (including Finland up to 1809). The published Swedish Historical Statistics (1972) include a summary of the data. Data can also be found in Vallerö (1969), 1. 2.
[email protected] [email protected]
Revue de l’OFCE, 140 (2015)
374
Jari Ojala and Jari Eloranta
Högberg (1969), and Heckscher (1936–1949) and on the Swedish statistics website. Additional data on trade and shipping can also be found in the local archives. Namely, the data compiled by the governmental authorities was first collected in each town, then sent over to the provincial level, and finally to the national government. Thus, more detailed data on foreign trade – and also details about domestic trade (which is rarely reported in statistical compilations) may be found from the local magistrate archives. Furthermore, the Seamen’s House institution was introduced in Sweden in the 1740s. From that period on, towns established Seamen’s Houses that kept records of seamen and shipping. This data, however, gains in accuracy, both in Sweden and in Finland only from the early nineteenth century onwards. This Seamen’s House data has also partially been made into a database (Arkion) and can be found via the Swedish National Archives website. Finland was annexed to imperial Russia in 1809. However, Finland was an autonomous part of the empire, and thus the Russian type of administration was not imposed on the region. The information about trade and shipping was compiled much as it had been during the Swedish period. This time, though, the Finnish Senate gathered the data and the original documents are kept in the Finnish National Archives. The original documents are in the Swedish and Finnish National Archives as well as provincial archives. The 18th century Swedish data covering certain Finnish towns can also be found on microfilm in the Finnish National Archives and also in certain provincial archives. A balance of trade was produced in Sweden from the early eighteenth century on (to a certain extent also before). It is available in archives and also in published format in Swedish historical statistics. 3. Institutions The data were first compiled by local authorities at the town level, then sent to the provincial level, and finally to the national government. The data were compiled annually (basically, at the beginning of each year, accounting for the trade and shipping during the previous year) by the Swedish Board of Trade, and in Finland from 1809 onward the Finnish Senate.
Sweden and Finland c.1700-1809, Finland 1809-c.1850
4. Motivations For some, the system was established in a rather mercantilist way so that the state could “organize” the trade. The state, however, was interested in this type of data for a variety of reasons, including military considerations. 5. Methods As far as it is possible to tell, the data were based purely on declarations. It is not clear whether the officials actively checked them or had a strategy for doing so, but there were obvious mistakes time and again suggesting that any checking did not work properly. Many studies that have utilized these data, however, suggest that they are reasonably accurate. Moreover, this is confirmed by our research that cross-checked the data against the Sound Toll Registers online compilation (http://www.soundtoll.nl/index.php/en/over-hetproject/str-online). 6. Information Quite detailed data were collected on the volume and value of trade in each commodity, the location the goods were shipped to and from, customs duties, etc. The number and tonnage of ships in each town, the number of seamen and number of ships abroad at the end of the year, and other similar details were recorded. However, there is no information on where exactly the ships visited, nor about tramp shipping between third countries. Trade flows were measured in values and quantities. The value was determined by the local custom houses (which then sent the data to local town magistrates). C.i.f was not included. There are some sources that might enable prices to be checked, although such checking would be difficult to implement. One might also consult the website http:// www.historia.se/ for further information. The monetary units were typically Swedish and later either Russian or Finnish monetary units. Dozens of different quantity units were used and dozens of different goods are mentioned in the sources. The language used was Swedish (even in Finland in 1809–1850 as neither Finnish nor Russian was used). When Finland was annexed to Russia in 1809, and Finland gained autonomous status, the lists of trade and shipping were compiled by the Board of Trade or Finnish Senate. At the local level, though, the same procedures continued as during the Swedish era.
375
376
Jari Ojala and Jari Eloranta
The data are available at the partner country level, again using dozens of different entities. 7. Availability Swedish data can be found at a summary level in the Swedish historical statistics. The Seaman’s House data has been compiled into a database (only from selected towns). See also data compiled by Rodney Edvinsson, Johan Söderberg, Bo Franzen, Daniel Waldenström, and others on macro-economic data on prices, wages, exchange rates, monetary values, consumer price indexes, etc. (available at http://www.historia.se/). 8. Research questions These data have been used to answer basic questions pertaining to shipping, trade, and economic history, such as what was transported, where, when, how, etc. Potentially, they could also be used to look into why the goods were transported to specific countries? What was the extent of bilateral trade flows? What about multilateral trade flows, i.e. did a “system” of trade exist between Sweden/Finland and other similar sized nations (or Great Powers)? 9. Bibliography 9.1. Primary sources Swedish National Archives, Kommercekollegiets Arkiv, Kammarkontoret. Finnish National Archives, Archives Finnish Senate. Historisk statistik för Sverige. Utrikeshandel 1732-1970. (Vol. 3), Stockholm. 9.2. Secondary works publishing and commenting on the data Vallerö, R., (1969), Svensk handels- och sjöfartsstatistik 1637-1813, Stockholm: Statistiska centralbyron. 9.3. Secondary works using the data Alanen, A. J., (1957), Der Aussenhandel und die Schiffahrt Finnlands im 18 Jahrhundert. Helsinki Heckscher, E. F., (1936), Sveriges ekonomiska historia från Gustav Vasa. I-II, Stockholm. Högberg, S., (1969), Utrikeshandel och sjöfart på 1700-talet. Stapelvaror i svensk export och import 1738-1808, Lund.
Sweden and Finland c.1700-1809, Finland 1809-c.1850
Jörberg, L., (1972), A History of Prices in Sweden 1732-1914 Volume I. Sources, Methods, Tables. Lund. Kaukiainen, Y., (1993), A History of Finnish Shipping. London: Routledge Ojala, J., (2011), Productivity Change in Eighteenth Century Finnish Shipping, in Richard W. Unger (ed.), Shipping and Economic Growth 13501850. Leiden-Boston: Brill, 167-188. Ojala, J., Pehkonen, J., & Eloranta, J. (2013), Desertions in nineteenthcentury shipping: modelling quit behaviour. European Review of Economic History, 17(1), 122-140 Vattula, K., (Ed.), (1983), Suomen taloushistoria 3. Historiallinen tilasto (Economic History of Finland 3. Historical Statistics). Helsinki: Tammi. 9.4. Complementary sources
http://www.historia.se/ http://sok.riksarkivet.se/ http://www.historicalstatistics.org/ http://www.riksbank.se/en/The-Riksbank/Research/Historical-Monetary-Statistics-/Exchange-rates/ http://www.riksbank.se/en/The-Riksbank/Research/Historical-Monetary-Statistics-/Prices/ http://www.riksbank.se/en/The-Riksbank/Research/Historical-Monetary-Statistics-/Historical-Monetary-and-Financial-Statistics-forSweden-Exchange-Rates-Prices-and-Wages-1277-2008/ http://www.historicalstatistics.org/htmldata3/index.html http://www.historicalstatistics.org/htmldata12/index.html http://www.historicalstatistics.org/htmldata13/index.html
377
UNITED KINGDOM, 1696-1899 David Jacks1 Simon Fraser University and NBER
1. Coverage The British archives hold a set of customs ledgers that variously covers the external trade of England, Great Britain, and the United Kingdom from 1696 to 1899. It is unclear what accounts replaced the customs ledgers from 1900, but presumably equivalent records exist. 2. Documents It is made of a series of ledgers. Balances of trade were made, but not on a fully consistent basis. 3. Institutional setting Clark (1938) provides a very nice detailed account of the origins of the Customs and Excise Department in general and of the commercial statistics described here in particular. 4. Motivations The first objective was likely in the accurate determination of export and import flows for revenue purposes. When the records began to be collected, there was already an extensive set of excises and tariffs in place governing the English external economy. There was also a fairly wide appreciation of the role of the external economy in partially determining the fortunes of the domestic economy. Thus, a secondary objective was in determining the gross balance of trade as a vital sign for the English economy. 5. Methods The information gathered was based on individual declarations, which were, at times, physically verified by customs officials. To the 1.
[email protected]
Revue de l’OFCE, 140 (2015)
380
David Jacks
extent that any trade data is accurate in the presence of smuggling and over/under declaration of exports and imports, I believe the data is a good representation of the actual flow of goods. Notably, these are the same data used by a previous generation of economic historians including Boody-Schumpeter (1960), Davis (1954, 1962 and 1979), and Deane and Cole (1967). British data is clearly privileged with respect to the administrative capacity of the state at this time and its unique geographic circumstances of being an island nation. At the same time, there is a large historical literature on the prevalence of smuggling. I would suggest that this concern while valid is likely a small one: the scale of smuggling in this period was almost certainly dominated by the volume of trade legitimately recorded and, more importantly, nothing in the historical record suggests that any related bias is systematic across nations. A straightforward means of assessing the quality of bilateral trade data at the commodity-level would come from comparing across national accounts on a good-bygood basis. This has been attempted for English trade with the colonies of North America reported by Mancall, Rosenbloom, and Weiss (2008). Although this avenue needs to be more systematically explored, the initial comparisons are very encouraging with high levels of Pearson and rank correlations. An indirect and admittedly imperfect means of assessing the reliability of aggregated bilateral trade flows would be use them in order to estimate a standard gravity equation. The main purpose of this exercise is to simply detect any gross outliers, that is, any nation whose level of output and distance from England would suggest a higher or lower level of trade than that which is recorded in the ledgers. Again, much more work needs to be done in this regard, but the preliminary results for the eighteenth century are reassuring: output enters positively and distance enters negatively with no clear outliers evident.
6. Information The ledgers contain a line-by-line account of the commodity-level bilateral trade flows of England with the rest of the world, ranging from the prosaic – wool to Holland – to the exotic – “Ellephants teeth” from Africa. The data is further disaggregated by making a distinction between trade centered on London versus the “outports” and between trade carried out on English versus foreign ships. The data is reported in both quantity and value terms.
United Kingdom, 1696-1899
The underlying prices used to value imports and exports were fixed from 1702 to 1813 in the case of exports and from 1702 to 1853 in the case of imports based on declared prices prevailing in or around 1700. The prices were determined by the Customs and Excise Department and were stated in Great British Pounds. There a very wide range of measures used for quantities across goods. With respect to individual years and categories, imports in 1700 contain the largest number of different units at 67. There is sufficient information from various sources on detailed commodity prices or generic export and import price indices to carry out such a reconstruction. One of our longterm goals is to do this, but it will take much more work than we initially thought. For any particular year, there is long list of goods detailed for exports, imports, and re-exports produced by the UK Customs Office. This ranges across year and across trade type (that is, exports, imports, and re-exports). In 1700, there were 211 export goods, 324 import goods, and 231 re-exports goods. In 1899, the respective numbers were 106, 181, and 180. There is also a lot of change in the categories of goods reflecting the evolving structure of the British economy. Some goods categories emerge and some disappear while new trading partners are also registered in the data. The chief obstacle in this respect is not in assessing the reliability of the data but in assigning consistent goods categories both within and across years. The trade flows are reported on a bilateral basis, so the stated origin/ destination is always known. Until the late eighteenth century, the ledgers distinguish between London and the “outports”. There is no further information on foreign ports. Some over/under-reporting is inevitable due to the nature of British data collection. Before 1904, exports were reported as such for those countries to which they were directly shipped while imports were reported as such for those countries from which there were directly shipped. Thus, the transshipment of traded goods is unreported and land-locked nations are absent in the data. It is only after 1904 that the British began to collect information on the country of original dispatch or ultimate destination. This number of geographical entities mentioned grows considerably over time. In 1700, there were 41 export countries, 43 import countries, and 35 re-exports countries. In 1899, the respective numbers were 119, 120, and 118.
381
382
David Jacks
7. Availability We have collected data from 1700 to 1899 at the frequency of every decade; that is, 1700, 1710,…, 1880, 1899 in a series of 21 Excel files for the 21 decades from 1700 to 1899. This is also being compiled and cleaned in single STATA file. Unfortunately, our efforts have been almost exclusively devoted to collecting and cleaning the data, so the short answer is none.
8. Research questions One way forward would be in confronting the dominant literature on the British industrial revolution and its relation to the external sector. Thus, was the composition of British bilateral trade flows distinguished from those of the French in a way which reflects of the highwage, cheap-energy gradient suggested by Allen (2009)? Was the constancy of chief exports as documented by Temin (1997) indicative of trade throughout Europe in the long-run? If so, what does this suggest about the implicit and explicit assumptions Temin uses by invoking a simple Ricardian model of trade?
9. Bibliography Boody-Schumpeter, E., (1960), English Overseas Trade Statistics, 1697-1808, Clarendon Press, Oxford. Clark, G. N., (1938), Guide to English Commercial Statistics, 1696-1782, : Royal Historical society, London. Davies, R., (1954), “English Foreign Trade, 1660-1700”, The Economic History Review, VII, 2: 150–166. Davies, R., (1962), “English Foreign Trade, 1700-1774”, The Economic History Review, XV, 2: 285–303. Davies, R., (1979), The Industrial Revolution and British Overseas Trade, Leicester University Press, Leicester. Deane, P., and W. A. Cole, (1967) British economic growth, 1688-1959: trends and structure. Cambridge University Press, Cambridge. Imlah, A. M., (1948), “Real Values in British Foreign Trade”, Journal of Economic History, VIII, 2: 133–152. Imlah, A. M., (1950), “The Terms of the Trade of the United Kingdom, 1798-1913”, Journal of Economic History, X, 2: 170–194. Imlah, A. M., (1958), Economic Elements in the Pax Britannica. Studies in British Foreign Trade in the Nineteenth Century, Harvard University Press, Cambridge, Mass.
United Kingdom, 1696-1899
Mancall, P. C., J. L. Rosenbloom and Thomas Weiss, (2008), “Exports and the Economy of the Lower South Region”, Research in Economic History, 25: 1–68. Mitchell, B. R. (with the collaboration of Deane, Phyllis), (1962), Abstract of British Historical Statistics, Cambridge University Press, Cambridge. Patnaik, U., (2000), “New estimates of 18th century British Trade and their relation to Transfers from Tropical Colonies”, in T.J. Byres, K.N. Panikkar and U. Patnaik (eds), The Making of History – Essays presented to Irfan Habib, Tulika Books, Delhi, 359–402.
383
UNITED STATES, 1790-1819 Javier Cuenca-Esteban1 University of Waterloo
1. Coverage This questionnaire discusses the U.S. Treasury Department´s annual trade statements from 1790 to 1819. In 1821 these statements were replaced with similar though increasingly more detailed annual accounts – now, for the first time, with official calculations of current import values. 2. Documents The documents considered here are annual accounts, all printed and bound in 2 volumes dated 1832 and 1834 (see American State Papers [ASP] in 9-a below). No synthetic statement of the U.S. trade and services balance was officially produced at the time. Export values at U.S. ports of departure were given for each year; but import values for goods subject to specific duties were not calculated at the time. For each of the years in the period 1795-1801, Mr. Joshua Dobson of the Treasury Department unofficially estimated the total import values at current prices by geographic origins (see Seybert, Statistical Annals..., pp. 266-78); but these values were thought to fall short of the true import values at U.S. ports: see U.S. Congress, “Report... 1819,”, p. 393. Modern reconstructions of the U.S. balance of payments for this period include North, “The United States Balance of Payments, 1790-1860”, 1960 (U.S. totals only for trade, invisibles, and other flows); and Cuenca-Esteban´s 2014 Working Paper “Financing U.S. External Trade” (here also including breakdowns by foreign countries, foreign countries´ colonies, and other geographic areas). 3. Institutional setting “Manifests” supplied by ship masters to U.S. Customs “collectors” at the ports were elaborated by the U.S. Treasury Department into offi1.
[email protected]
Revue de l’OFCE, 140 (2015)
386
Javier Cuenca-Esteban
cial statements for annual submission to Congress, to “be laid before the public”. 4. Motivations The central motivation for data collection on imports was tax collection and administration; but all data were explicitly meant to serve the broader purpose of informing policy makers and the general public. 5. Methods The official export values were at times those furnished by the ship masters. In most cases, however, the figures in question were valuations made by the “collectors” themselves. Export quantities were accepted as such from the ship masters, who had no motive to misrepresent the facts. Only the import quantities – not the values – of goods subject to specific duties were ascertained by the Customs officers, “with entire accuracy by the entry of the exporter, and by reference to the importation”. Imports subject to ad valorem duties were valued at the U.S. customs at ports of origin; apparently, only the sub-totals for such articles charged with the same rate of duty were submitted to the Treasury. No record was kept of tax-free imports. The export and import figures described here on the whole appear to convey a fair representation of the actual flow of goods. To be sure, informed contemporaries believed that the official export values were overrated in some degree; they were particularly critical of the official import values (see U.S. Congress, “Report... 1819”). But Douglass North found the subsequently corrected totals tolerably reliable – even though he advisedly warned that his balance-of-payments estimates should be used as 5-year averages only (“The United States Balance of Payments, 1790-1860”, pp. 573, 587-601). Drawing on large samples of commodity breakdowns in the official accounts, Javier CuencaEsteban has come to tentative but encouraging results. Certainly the unofficial contemporary estimates of U.S. import values for each of the years 1795 to 1801 are consistent with independent price data now available to us. Allowing for freight, marine insurance and other costs, U.S. export values to Great Britain are tolerably close to estimates of British imports from the United States by the Inspector General of the British customs. Further allowing for travel times and other inevitable sources of error, commodity quantities said to have been exported to Britain often closely match those officially arrived in British ports (see Cuenca Esteban, “Current values...”, 2009). Similar tests with French
United States, 1790-1819
data of trade with the United States are less conclusive, but discrepancies are predictable in a wider context (see Cuenca Esteban, “Fundamentos...”, 1987). Seemingly large gaps in British exports to the United States over U.S. imports from Britain through 1790-1811 are contextually intelligible and open up intriguing avenues of research (see Cuenca-Esteban, “British 'Ghost' Exports...”, 2014). 6. Information The data officially collected and processed include, on the export side, quantities and values by geographic destination for all years 179099 and values only for 1800-19. Export data for the principal commodities by geographic destination from 1800 to 1816 are given in Pitkin, A Statistical View..., 1816, 1835. Only through 1803-19 do the given export values distinguish between domestic and foreign goods. On the import side, data officially collected and processed include values by geographic origin of goods subject to ad valorem duties and commodity quantities by geographic origin of goods subject to specific duties – all covering every year through 1790-19 except 1792-94. For 1797-98 and 1800-19 only, the import data are given in two separate accounts for goods carried in U.S. and foreign ships respectively. For each of the years in the period 1795-1801 only, total export and import values at current prices by geographic origins were unofficially calculated by Mr. Joshua Dobson of the Treasury Department (see Seybert Statistical Annals..., pp. 266-78). The official export values were at times those furnished by the ship masters; in most cases, however, the figures in question were valuations made at market prices by the “collectors” at the U.S. customs. Import values of goods subject to ad valorem duties were determined at the U.S. customs in U.S. dollars from the original invoices at foreign ports of departure; the resulting sums were compounded by 10 or 20 percent depending on geographic distance to account for transport costs. The quantity unit specified for most commodities is pounds of weight. Also used were gallons, barrels (pickled fish), bushels (salt, coal), quintals (dried fish), pairs (of shoes), dozens (or beer bottles), and packs (of cards). Convenient price sources are available to compute trade values based on these quantities: see “Complementary Sources” below. Javier Cuenca-Esteban, in his Working Paper “Financing U.S. External Trade” (2014), has estimated current import values for all documented geographic areas by multiplying large samples of the given official quantities by separately compiled prices.
387
388
Javier Cuenca-Esteban
Data collection and rendering changed, but coherent series through the 1790-1819 period can and have been re-constructed. The standard official lists were presumably set up by the Customs officers. They include 40 imported commodities in 1790-91 and 1795-1803, rising to 52 from 1804 onwards. Imported goods subject to ad valorem duties were valued in dollars but not itemized at the commodity level. Also 72 exported commodities in all years through 1790-99. Annual data on 11 exported goods from 1800 to 1816 are given in Pitkin, A Statistical View (1816 and 2nd. ed., 1835). Using the last/first port of call rule, all the data are broken down geographically by some 42 foreign countries and their colonies where relevant, for both imports and exports: a nearly comprehensive list is given in Cuenca-Esteban’s working paper “Financing U.S. External Trade” (2014), Table 1. Some of the original data are also broken down by U.S. states. 7. Availability Javier Cuenca-Esteban has digitized much of the ASP data for 17901819 and will supply selected series and his own estimates upon request. 8. Research questions The data have been used to look into U.S. merchants' middleman role, the country´s gains from trade, and external indebtedness during the neutrality years 1793-1807 (North, “The United States Balance of Payments, 1790-1860”, 1960). The figures have also been drawn upon to reconstruct the U.S. trade and payments balances with Spanish America, Spain, and Great Britain through 1790-1819 (see CuencaEsteban's relevant publications since 1984). We have much to learn on how U.S. merchants managed to secure the Spanish dollar-coins they required to cover large trade deficits in China and the Far East during the neutrality years 1793-1807 in particular (see Cuenca-Esteban, “British 'Ghost' Exports...”, 2014). 9. Bibliography 9.1. Primary sources American State Papers (ASP), Class 4, (1973), Commerce and Navigation (CN), vol. 1 (annual accounts for 1790-1813), vol. 2 (annual accounts for 1814-19), Washington D.C.: Gales and Seaton, 1832, 1834. More accessible reprints are available in The New American State Papers.
United States, 1790-1819
Commerce and Navigation, Wilmington, Delaware: SR Scholarly Resources Inc., 1–7. Pitkin, Timothy, A Statistical View of the Commerce of the United States of America..., 1st and 2nd editions, New Haven: Durrie and Peck, 1816, 1835. Seybert, Adam, (1818), Statistical Annals..., Philadelphia: T. Dobson and Son. U.S. Congress, (1819), “Report to the Senate of the Committee of Commerce and Manufactures” in American State Papers as above, Class 4, CN, 2, 391–403. 9.2. Secondary works publishing and commenting the data Buron, Edmond, (1931), “Statistics on Franco-American Trade, 17781806”, Journal of Economic and Business History, IV, 571–580. Cuenca Esteban, Javier, (1984), “The United States Balance of Payments with Spanish America and the Philippine Islands, 1790-1819: Estimates and Analysis of Principal Components”, in The North American Role in the Spanish Imperial Economy, 1776-1819, eds. J. Barbier and A. Kuethe, Manchester: Manchester University Press, 28–70 and 198–209. Cuenca Esteban, Javier, (1984), “Trends and Cycles in U.S. Trade with Spain and the Spanish Empire, 1790-1819”, Journal of Economic History, XLIV, 521–543. Cuenca-Esteban, Javier, (2014), Financing U.S. External Trade. The U.S. balance of payments by geographic areas, 1790-1819, Working Paper available from the author upon request. Evans, Charles H., (1884), Exports, domestic and foreign, from the American colonies to Great Britain from 1697 to 1789, inclusive exports, domestic from the United States to all countries from 1789 to 1883, inclusive, Washington: U.S. Government Printing Office. [reprint ed. by Arno Press, A New York Times Company, 1976]. Homans, Isaac Smith, (1857), An historical and statistical account of the foreign commerce of the United States..., New York: G.P. Putnam and Co. [reprinted in N.Y.: G.P. Putnam and Co., 1976]. North, Douglass C., (1960), “The United States Balance of Payments, 17901860”, in Trends in the American Economy in the Nineteenth Century, Studies in Income and Wealth of the National Bureau of Economic Research, 24, Princeton: Princeton University Press, 573–627. 9.3. Secondary works using the data Bullock, Charles J., Williams J.H. and R.S. Tucker, R. S., (1919), “The balance of trade of the United States”, Review of Economic Statistics, I, 215–266. Cuenca Esteban, Javier, (1987), “Fundamentos para una interpretación de las estadísticas comerciales francesas, 1787-1821, con referencia especial al comercio franco español”, Hacienda Pública Española, 108-109, 221–251.
389
390
Javier Cuenca-Esteban
Cuenca-Esteban, Javier, (2009), “Current values of British imports from the United States, 1790-1820: Estimates and independent tests”, in Worlds of History and Economics. Essays in Honour of Andrew M. Watson, ed. Brian A. Catlos, Valencia: Universitat de València, 191–207. Cuenca-Esteban, Javier, (2014), “British 'Ghost' Exports, American Middlemen, and the Trade to Spanish America, 1790-1819: A Speculative Reconstruction”, William and Mary Quarterly, 3rd series, 71(1): 63–98. Shepherd, James F. and Walton, Gary M., (1972), Shipping, Maritime Trade, and the Economic Development of Colonial North America, London: Cambridge University Press. Shepherd, James F. and Walton, Gary M., (1972), “Trade, Distribution, and Economic Growth in Colonial America”, Journal of Economic History, 32: 128–145. 9.4. Complementary sources Bezanson, Anne, Gray, R. D., and Hussey, M., (1936), Wholesale Prices in Philadelphia, 1784-1861, 2 volumes, Philadelphia: University of Pennsylvania Press. Buck, Norman Sydney, (1925), The Development of the Organisation of Anglo-American Trade 1800-1850, New Haven, Conneticut: Yale University Press. Cole, Arthur H., (1938), Wholesale Commodity Prices in the United States 1700-1861, Cambridge, Mass.: Harvard University Press. DeBow, J.D., (1854), Encyclopaedia of the trade and commerce of the United States. Dresner, Stephen, (1971), Units of Measurement, Aylesbury, Bucks.: Harvey Miller and Medcalf Ltd.: Appendix 4: “Obsolete and Old-Fashioned Units”. Grotjan's Philadelphia Public Sale Report and General Price Current, New York: The American Antiquarian Society, Readex Microprint Corporation, 1978. Homans, Isaac Smith, (1858), A cyclopedia of commerce and commercial navigation, 2 volumes, New York. New York Price Current, 1796-1817, New York: The American Antiquarian Society, Readex Microprint Corporation, 1978. Price, Jacob, (1975), “New Time Series for Scotland's and Britain's Trade with the Thirteen Colonies and States, 1740 to 1791”, The William and Mary Quarterly, 3rd series, XXXII, 2, 307–325. Sterns, Worthy P., (1898), “The Beginnings of American Financial Independence”, Journal of Political Economy, VI, 187–208.
MISSING COUNTRIES
Loïc Charles1 Université de Paris 8 & INED
Guillaume Daudin2 Université de Paris Dauphine & Sciences Po
This volume covers most of Europe, along with European colonies in America. This section provides the information we have on the places that are not treated elsewhere. 1. Asia To our knowledge, there are no trade statistics on Asia before the nineteenth century. China was closed to trade with Europe, except through Guangzhou (Canton) up to 1843. Regular trade statistics were published only on 1859 by the Western-led Imperial Maritime Customs Service (Chinese Maritime Customs, 2001; Hsiao, 1974; Keller, Li, & Shiue, 2013). For the period before that, Dermigny’s masterpiece provides data on navigation and trade in cotton, tea, opium and precious metals in Guangzhou (Dermigny, 1964), but he did not work from original Chinese sources. This means that there is potentially more information available in the Chinese archives. For a long time Japan was closed off to foreign trade, except for Dutch trade in Nagasaki. According to Louis M. Cullen, local Japanese statistics on foreign trade consisted of business accounts rather than a quantitative record of trade itself: there is much more information on internal coastal trade (Cullen, 2009). Dutch records allow some exploration of early Japanese foreign trade (Nagazumi, 1987). After the opening of ports in 1859, the Japanese taught themselves the art of producing foreign trade statistics throughout the 1860s and 1870s (Cullen, 2010).
1. 2.
[email protected] [email protected]
Revue de l’OFCE, 140 (2015)
392
Loïc Charles and Guillaume Daudin
2. Switzerland Even thought Switzerland was dependent on foreign trade for many goods, little is known about it before the 1840s (Bairoch, 1990; Veyrassat, 1990). The only eighteenth-century trade statistics in Bergier’s Histoire Économique de la Suisse come from the French sources (Bergier, 1984; Gern, 1971). A balance of trade document exists for the canton of Bern in 1785 (Radeff, 1996), and perhaps other cantons produced comparable information. 3. Venice For Venice, a comprehensive source covering the period 1713-1800 exists: the Registri of the Cinque Savi alla mercanzia (Campos, 1936). It is kept in the Archivio di Stato de Venise. It was partly digitized in the 1990s by a team headed by Massimo Constantini and Alessandra Sambo. The project was interrupted and the survival of the data is in doubt (Sambo, 2012). Other data exist that cover trade flows from as early as 1684 (Sambo, 2012). In the next paragraph, we summarize the information contained in Sambo’s paper, which is the best available reference on this subject. The source consists of 151 pieces: 132 volumes on the period 17701800, and the rest cover the earlier period. The Cinque Savi alla mercanzia collected the data. This body was an important part of the central administration, with a large remit concerning trade and production in Venice. The aim of the collection was to provide statistical input into the economic and financial decision-making process of the Venetian state. As a result, the registri are an elaboration on the declarations made by merchants (or their agents) at the customs offices. Information is included on the merchandises, the customs offices in Venice that registered the trade flow, whether the goods were for transit or not, the quantity, the value and the origin/destination (as last/next port of call). 4. Ottoman Empire During the eighteenth century, “Apart from the ecnebi defterleri [registers of foreigners], no Ottoman archival series refers directly and exclusively to foreign trade and implantation” (Eldem, 1999). Researchers have found interesting data in Western consular reports. Bruce McGowan has used them to construct reference-year estimates of the total size, geography and composition of Ottoman trade (McGowan, 1981). N. G. Soronos has produced a precise study of
Missing countries
Salonika’s external trade in the eighteenth century based on these sources. Their comparison with Ottoman tax-farmer reports confirms their reliability (Genç, 1976; McGowan, 1994). 5. Kingdom of Sardinia To the best of our knowledge, there are no synthetic works on the kingdom of Sardinia’s trade (including Savoy and Piemont). Taxes on trade were important for the kingdom, and researchers have looked into individual tolls (Dace de Suse, Verceil and Villefranche toll) (Bottin, 2011). 6. Other We could not find any information or experts on the Italian states of Parma, Modena and Lucca, nor on most states in the Holy Roman Empire. Dantzig trade statistics were published in the 1960s (Biernat, 1962). It seems that French consular reports may be able to complement a number of local sources, especially in the case of the Hanseatic towns, Russia, or the Ottoman empire (Eldem, 1999; Jeannin, 2002). There are navigation sources for Denmark3, but as far as we know there is a “lack of even semi-reliable data year-by-year trade statistics” (Andersen, 2006). We were unable to find any author to write on this subject. 7. Bibliography Andersen, D. H., (2006), “Denmark-Norway, Africa, and the Caribbean, 1660-1917: modernisation financed by slaves and sugar?”, in P. C. Emmer, O. Pétré-Grenouilleau, & J. Roitman, A Deus Ex Machina Revisited. Atlantic Colonial Activities and European Economic Development., 291-315, Leiden: Brill. Bairoch, P., (1990), “La Suisse dans le contexte international aux XIXe et XXe siècles”, in P. Bairoch & M. Körner, La Suisse dans l’Économie Mondiale, Genève: Droz. Bergier, J. F., (1984), Histoire économique de la Suisse, Payot. Biernat, C., (1962), Statystyka obrotu towarowego Gdańska w latach 16511815, Warsaw: Państwowe Wydawnictwo Naukowe. Bottin, M., (2011), “Le système douanier des États de Savoie et le régime dérogatoire niçois”, in M. Ortolani, Actes du colloque Commerce et communications maritimes dans les États de Savoie, 95–105, Nice: Serre Éditeur. 3. See for example the data on merchant ships in Danish Provincial Towns from 1720 to 1832 by Anders Monrad Møller: http://dendigitalebyport.byhistorie.dk/provinsens_soefart/
393
394
Loïc Charles and Guillaume Daudin
Campos, G., (1936), “Il commercio esterno veneziano della seconda metà del’ 700 secondo la statistiche ufficiale”, Archivio Veneto, 19: 145–183. Chinese Maritime Customs, (2001), Chinese Old Customs Documents (Zhongguo jiu hai guan shi liao) 1859-1948, Beijing: Jinghua Chuban Sho. Cullen, L. M., (2009), “Statistics of Tokugawa Coastal Trade and Bakumatsu and Early Meiji Foreign Trade”, Japan Review, 21: 183–223. Cullen, L. M., (2010), “Statistics of Tokugawa Coastal Trade and Bakumatsu and Early Meiji Foreign Trade, Part 2: Trade in Bakumatsu and Early Meiji Times”, Japan Review, 22: 59–102. Dermigny, L., (1964), La Chine et l’Occident : le commerce à Canton au e XVIII siècle, 1719-1833, Paris: SEVPEN. Eldem, E., (1999), French trade in Istanbul in the eighteenth century, Leiden: Brill. Genç, M., (1976), “A comparative study of the life-term tax farming data and the volume of commercial and industrial activities in the Ottoman Empire during the second half of the eighteenth century’(trans.)”, in the Actes of the Symposium on South-eastern European and Balkan cities and the Industrial Revolution in Europe, Hamburg, 278–314. Gern, P., (1971), “Les échanges commerciaux entre la Suisse et la France au XVIIIe siècle”, Revue Suisse d’Histoire, 64–95. Hsiao, L., (1974), China’s foreign trade statistics, 1864-1949, Harvard University Asia Center. Jeannin, P., (2002), “Les villes hanséatiques dans le commerce européen du XVIIIe siècle”, in Marchands d’Europe, 79–107. Keller, W., Li, B., et Shiue, C. H., (2013), “Shanghai’s Trade, China’s Growth: Continuity, Recovery, and Change since the Opium Wars”, IMF Economic Review, 61(2): 336–378. McGowan, B., (1981), Economic life in Ottoman Europe: taxation, trade, and the struggle for land, 1600-1800, Cambridge University Press. McGowan, B., (1994), “The Age of the Ayans, 1699-1812”, in H. Inacılk & D. Quataert, An economic and social history of the Ottoman Empire, 2: 637–758. Nagazumi, Y., (1987), “Tosen yushutsunyuhin suryo ichiran, 1637–1833Nen (Summary of imports and exports on Chinese ships for the years 1637-1833)”, Tokyo: Sobunsha. Radeff, A., (1996), Du Café dans le chaudron?: économie globale d’Ancien Régime, Suisse Occidentale, Franche-Comté et Savoie, Lausanne: Société d’Histoire de la Suisse Romande. Sambo, A., (2012), “La balance de commerce de la République de Venise: sources et méthodes”, Cahiers de la Méditerranée, 84: 381–410. Veyrassat, B., (1990), “La Suisse sur le marchés du monde. Exportations globales et répartition géographique au XIXe siècle. Essai de reconstitution”, in P. Bairoch & M. Kröner, La Suisse dans l’Économie Mondiale, Genève: Droz.
INDEX TABLES
Coverage of the volume . . . . . . . . . . . . . . . . . . . . . . . . . . . . . . . . . . . . 21 Summary of the questionnaires . . . . . . . . . . . . . . . . . . . . . . . . . . . . . . 24 Extract from Statistische Uebersichten über Waaren-Verkehr und Zoll-Ertrag im Deutschen Zoll-Vereine für das Jahr 1852 . . . . . . . . 75 Extract from Statistische Uebersichten über Waaren-Verkehr und Zoll-Ertrag im Deutschen Zoll-Vereine für das Jahr 1858. . . . . . . . . 76 Trade composition, measured from tonnage . . . . . . . . . . . . . . . . . . . 101 Trade between Portugal and Sweden, 1776–1800 . . . . . . . . . . . . . . . 102 Share of Swedish trade in Portuguese foreign trade . . . . . . . . . . . . . . 103 Ports in the Baltic, as mentioned as first and second destinations in the muster rolls, 1770-1800 . . . . . . . . . . . . . . . . . . . . . . . . . . . . . . 127 Most named persons and firms in muster rolls of ships to the Baltic, 1770-1800 . . . . . . . . . . . . . . . . . . . . . . . . . . . . . . . . . . . 129 Most named persons and firms in muster rolls of ships to Riga, 1770-1800 . . . . . . . . . . . . . . . . . . . . . . . . . . . . . . . . . . . . . . 129 Most named persons and firms in muster rolls of ships to St. Petersburg, 1700-1800 . . . . . . . . . . . . . . . . . . . . . . . . . . . . . . . 129 Most named persons and firms in muster rolls of ships to Danzig, 1700-1800 . . . . . . . . . . . . . . . . . . . . . . . . . . . . . . . . . . . . 130 Most named persons and firms in muster rolls of ships to Narva, 1700-1800 130 The division of cargo descriptions in STRO into their constituent parts . 143 The conversion of wine loads in fad or barrique to a metric equivalent . 147 The conversion of product registrations in dusin (12 pieces) to a metric equivalent . . . . . . . . . . . . . . . . . . . . . . . . . . . . . . . . . . . . 148 Statistical overview of the results of the conversion of cargo registrations in STRO to their metric equivalents . . . . . . . . . . . . . . . . . 149 Average annual volume of French imports to the Baltic, selected products . . . . . . . . . . . . . . . . . . . . . . . . . . . . . . . . . . . . . . . . 166 Weights and measures used for French imports to the Baltic . . . . . . . 171 (continued) . . . . . . . . . . . . . . . . . . . . . . . . . . . . . . . . . . . . . . . . . . . . 172 (continued) . . . . . . . . . . . . . . . . . . . . . . . . . . . . . . . . . . . . . . . . . . . . 173 Import values and derived indicators of openness, c. 1753-1830 . . . . 182 Structure of external trade of Prussia, 1795/6 . . . . . . . . . . . . . . . . . . . 197 Structure of imports of Amsterdam from Germany, 1789-1791 . . . . . 199
Revue de l’OFCE, 140 (2015)
396
INDEX FIGURES
Coverage of the volume (excluding countries discussed in the “missing countries” section) . . . . . . . . . . . . . . . . . . . . . . . . . . . .21 Trade data availability . . . . . . . . . . . . . . . . . . . . . . . . . . . . . . . . . . . . . .22 Example of cargo items on the Charlotte . . . . . . . . . . . . . . . . . . . . . . .56 Dealing with commodities in Navigocorpus From sources to standardization through flexibility . . . . . . . . . . . . . . . .59 Composition of permanent coding. The example of eighteenth-century white sugar imported from Saint-Domingue . . . . . . . . . . . . . . . . . . . . .61 German exports, 1834-1889 (current values, million Marks) . . . . . . . . .80 German exports, 1836-1889 (volume indices, 1913=100) . . . . . . . . . .80 Germany's trade openness (X/PIB, current prices, in %), 1850-1913 . . .81 France and United Kingdom trade openness (X/PIB, current prices, in %), 1850-1913 . . . . . . . . . . . . . . . . . . . . . . . . . . . . . . . . . . . . . . . . . . . . . .81 Overall trade volume via the Danish Sound, based on the number of passages, 1634–1857 . . . . . . . . . . . . . . . . . . . . . . . . . . . . . . . . . . . .97 Share of Portugal in Swedish trade (right axis) and the number of Swedish merchant vessels traveling to Portugal (left axis), 1686–1815 . . . . . . . .98 Share of Sweden in Portuguese trade (right axis) and the number of Portuguese merchant vessels traveling to Sweden (left axis), 1686–1800 . . . . . . . . . . . . . . . . . . . . . . . . . . . . . . . . . . . . . . . . . . . . .100 Portuguese imports and exports with Sweden, 1776–1800 . . . . . . . . .102 Portuguese imports and exports with Sweden, 1776-1800 . . . . . . . . .103 The collection of the ‘convooien en licenten’ duty, 1725-1796 . . . . . .115 The collection of the ‘veil- en lastgeld’ duty, 1725-1796 . . . . . . . . . . .116 The collection of the ‘paalgeld’ duty, 1725-1796 . . . . . . . . . . . . . . . .117 Overall traffic from Amsterdam to the Baltic, based on recorded eastbound passages through the Danish Sound, 1700-1800 . . . . . . . .118 Number of muster rolls, 1747-1852 . . . . . . . . . . . . . . . . . . . . . . . . . .123 French imports to the Baltic, 1670-1850 . . . . . . . . . . . . . . . . . . . . . . .150 French salt imports to the Baltic, 1670-1850 . . . . . . . . . . . . . . . . . . . .151 The geography of salt imports to the Baltic, 1670-1850 . . . . . . . . . . .152 French imports of wine, brandy and vinegar; fruits, nuts and syrup; overseas products, 1670-1850 . . . . . . . . . . . . . . . . . . . . . . . . . . . . . .155 Geography of imports of overseas goods to the Baltic, 1670-1850 . . .157 Share of “new” products in French imports to the Baltic, 1815-1849 .159 Relation between “taux d'évaluation” and share in total exported value of main products exported from France to Russia, 1840 . . . . . . . . . . .162 Return of the crane tax of Cologne in kilograms of silver, 1690-1794 .184
INDEX FIGURES
Export and import values in Bavaria, 1765-1799 . . . . . . . . . . . . . . . . 187 Implied export and import quantities in Bavaria, 1765-1799: index of toll and excise revenues . . . . . . . . . . . . . . . . . . . . . . . . . . . . 187 Indices of real overseas imports of Hamburg, 1736-1798 . . . . . . . . . . 191 Real imports of major commodity groups, Hamburg 1736-1798 . . . . 194 Real exports of linen, 1748-1787, and number of weaving looms in Silesia, 1748-1795 . . . . . . . . . . . . . . . . . . . . . . . . . . . . . . . . . . . . . 203 Purchases of linen in Westphalian linen markets, 1740s to 1795 . . . . . 204 Activity of the worsted trading company of Calw, 1680-1778 . . . . . . 207 Grain exports of northern Germany, 1753-1850 . . . . . . . . . . . . . . . . . 211 Volume of grain sales in the market of Überlingen, 1674-1811 . . . . . . 212 Sheet for Bureau principal de Saint-Jean de Luz, Direction of Bayonne, July 1790 . . . . . . . . . . . . . . . . . . . . . . . . . . . . . . . . . . . . . . . . . . . . . . 243 The source for Livorno in 1795 . . . . . . . . . . . . . . . . . . . . . . . . . . . . . . 284 Ledger of Imports and Exports (TNA, P.R.O., CUST 14, imports, 1755) 346 Customs Account / ‘port book’, Aberdeen, January 1755 . . . . . . . . . . 353
397
Réalisation, composition : Najette Moummi
Achevé de rédiger en France Dépôt légal : juillet 2015 Directeur de la Publication : Xavier Ragot Publié par les Éditions du Net SAS 92800 Puteaux
Revue de l’OFCE
EIGHTEENTH-CENTURY INTERNATIONAL TRADE STATISTICS SOURCES AND METHODS edited by Loïc Charles and Guillaume Daudin
Trade statistics are a unique source to broaden our understanding of early-modern economies and their evolution. Still, they have been under-utilized by researchers. This volume features a detailed panorama of early-modern trade statistics’ sources and discusses some of the ways they can be used to study the transformation of European commerce and economies in the late-eighteenth and early nineteenth century. It is of special interest for both economists and historians interested in the period of the first Industrial Revolution. In this special issue, Loïc Charles and Guillaume Daudin have gathered an wide-ranging list of scholars, experts in the economic history of early-modern trade from several countries. This volume include twenty-three short essays discussing the various available sources on trade data, as well as seven additional research papers. In total, it provides information on thirty five countries or areas. As to the research articles, three of them discuss methodological issues regarding the use of early trade statistics, and the remaining four others actually use some of these trade statistics to produce new insights. The contributors to this volume are: Loïc Charles, Daniela Ciccolella, Ann Coenen, Javier Cuenca-Esteban, Guillaume Daudin, Béatrice Dedinger, Jean-Pierre Dedieu, Jari Eloranta, Hubert Escaith, Mathieu Grenet, Ragnhild Hutchinson, Alejandra Irigoin, David Jacks, Aidan Kane, Klemens Kaps, Szymon Kazusek, Lauri Karvonen, Jan Kochanowski, Cristian Luca, Silvia Marzagalli, Maria Cristina Moreira, Jari Ojala, Ulrich Pfister, Luisa Piccinno, Philipp Robinson Rössner, Werner Scheltjens, Donatella Strangio, Eoin Tennisman, Giovanna Tonelli, Jeroen van der Vliet, Patrick Walsh, Klaus Weber, and Andrea Zanini.
24 €
ISBN 978-2-312-03378-5
REVUE DE L’OFCE / (2015) www.ofce.sciences-po.fr