Effects of weather conditions on agricultural crop production in Austria between 1869 and 2003 A.-M. Soja and G. Soja
Witterungseinflüsse auf die landwirtschaftliche Pflanzenproduktion in Österreich zwischen 1869 und 2003
1 Introduction
to a great deal on weather conditions. To which extent this influence on the yield of the predominantly grown agricultural plants has been given, is yet not systematically investigated. Knowledge about the dimension of vulnerability of agricultural production in past and present will serve to enhance accuracy of assessment of effects of future meteorological scenarios.
Agricultural production is both dependent and endangered by weather conditions. Although today measures against various hazards are possible, temperature, water supply and radiation can only be controlled on the greenhouse scale. So plant product quantity and quality in the field is depending
Zusammenfassung Welche Art extremen Wetters verursacht Missernten? Dieser Frage wurde bei sieben landwirtschaftlichen Kulturpflanzenarten in drei Regionen Österreichs nachgegangen. Die Datenbasis bestand aus den agrarstatistischen Erhebungen der Flächenerträge sowie den Monatsmitteln der meteorologischen Parameter im Zeitraum 1869 bis 2003. Aus den ermittelten Zusammenhängen sind folgende Schlüsse für die Auswirkungen möglicher zukünftiger Klimaentwicklungen in Österreich zu ziehen: • Mildere Winter ohne das Auftreten von Extremtemperaturen im Februar würden besonders vorteilhaft sein. Davon würden hauptsächlich Wintergetreide und Wein profitieren. • Trockene Frühjahrswitterung ist besonders nachteilig für Sommergetreide. • Trockene Witterung in den Erntemonaten von Getreide vermeidet Verluste bei der Ernteeinbringung. • Trockene, heiße Sommer sind ungünstig für Zuckerrübe und Mais, in geringerem Ausmaß für Kartoffel. • Der Weinbau könnte bei Eintreten der wahrscheinlichsten klimatischen Veränderungen in Österreich zu den Gewinnern gehören. Schlagworte: Wetter, Klimawandel, Missernte, Ertrag, Österreich.
Summary Which kind of extreme weather causes bad harvests? This question was analysed for seven agricultural crop species in three regions of Austria. The data consisted of the area-based agro-statistical surveys and the monthly means of meteorological parameters from 1869 to 2003. The resulting relations are summarised in the following conclusions about the effects of future possible climatic developments in Austria: • Milder winters will be especially advantageous if no extreme temperatures occur in February. This would be beneficial mainly for winter cereals and grapevine. • Dry weather in spring is especially disadvantageous for spring cereals. • Cereals require dry weather in the harvest months to avoid yield losses. • Dry, hot summers are unfavourable for sugar beet and corn, to a lesser extent for potato. • Viniculture could be among the winners if modelled climatic shifts for Austria turn into reality. Key words: Weather, climate change, bad harvest, crop yield, Austria.
Die Bodenkultur
95
58 (1–4) 2007
A.-M. Soja and G. Soja
2 Material and Methods
Our investigations have the aim to demonstrate whether the meteorological situation in years with exceptionally low yields can serve as an explanation for the causes of these bad harvests. This contribution deals with arable crops such as cereals and root/tuber crops, as well as with pomiculture and viticulture. Various agricultural production regions of these crops were examined because Austria shows great climatic differences between various regions. In the overview about climate change by KROMP-KOLB AND FORMAYER (2005) significant trends of individual meteorological parameters are reported. An overall increase of mean temperature by 1.8 °C in Austria has been observed since 1860 (BÖHM et al., 2001). This is about three times the average global temperature increase for this period. Precipitation per year has decreased in southern and eastern Austria for this period. The trend in occurrence of extreme weather events is not so clear (BLÖCHLIGER and NEIDHÖFER, 1998; SCHORER, 2000; FOELSCHE, 2003, LUTERBACHER et al., 2004; BÖHM, 2006). But as it has been shown by SCHÖNER et al. (2003) extreme summer temperatures have increased significantly during the last 5 decades at Wien – Hohe Warte, whereas the change in winter minimum temperatures was much weaker. The investigations of this study include analyses to which extent these modifications of weather conditions have affected crop yields. The results of this evaluation and the derived conclusions could be used for assessments which crops are at risk by which kind of meteorological extremes. In synopsis with potentially occurring climate change conditions it shall be evaluated which of the investigated crops could benefit and which were the most important risk factors for bad harvests.
2.1 Data Basis and Investigated Parameters The meteorological stations were selected according to the existence of long homogenized historical time series (AUER et al., 2001). Table 1 shows the chosen stations and the beginning of weather recordings for the investigated parameters. The station Wien – Hohe Warte was considered as representative for the study region Lower Austria, GrazUniversität for the selected region Styria, and Kremsmünster for the Upper Austrian agro region. We used homogenized monthly mean data of mean daily maximum and minimum temperatures, precipitation sums, and sunshine duration. The monthly data were the finest resolution level we could derive for the investigated period. Records of hailstorms were not available for prolonged periods; besides hail is a local event that cannot be extrapolated to the regional level that has been used for the yield assessments. The selection of the analyzed regions was made dependent on the availability of historical yield data. Additionally the regions should be representative and characteristic for agricultural production and management techniques. Because of data gaps in district level agricultural statistics (see this chapter later) the focus was put on province level (Lower Austria, Styria, and Upper Austria). We concentrated on arable crops supplemented in some regions by perennial crops as vine and apple. The criteria for the selection of crops were the agronomic importance combined with time series for harvest data as long as possible, sensitivity to weather effects, and the variation of crop growth characteristics (spring- versus winter crop, annual versus perennial, cereals versus root/tuber crops). So we focused on winter wheat, spring barley, maize, potato, sugar beet, vine, and extensive apple production. Yield data were obtained from sources which differed in the depth of the data, their reliability and in the recording constancy. Only yield data related to acreage were used. The
Table 1: Begin of recording data of indicated meteorological parameters at the chosen meteorological stations Tabelle 1: Aufzeichnungsbeginn verschiedener meteorologischer Parameter an ausgewählten Wetterstationen Year of first record
meters above sea-level
mean daily minimum resp. maximum temperature
monthly sum of precipitation
monthly sunshine-duration
Graz-Universität
366
1881
1864
1922
Kremsmünster
383
1836
1820
1884
Wien – H. Warte
203
1836
1845
1881
Station
Die Bodenkultur
96
58 (1–4) 2007
Effects of weather conditions on agricultural crop production in Austria between 1869 and 2003
most important sources were the official statistical publications, which could be used for this study beginning with the recordings of the year 1869 (K.-K. ACKERBAUMINISTERIUM, 1869–1870; K.-K. ACKERBAUMINISTERIUM, 1871). It was not possible to derive earlier harvest data by deduction from the fiscal land registers (SANDGRUBER, 1978). From 1874 till 1917 there existed an agrostatistical yearbook (K.-K. ACKERBAUMINISTERIUM, 1874–1914, K.-K. ACKERBAUMINISTERIUM, 1915–1918). Then data were published by the Federal Ministry for Agriculture and Forestry (BMLFW, 1919–1924, BMLFW, 1925, BMLFW, 1926– 1937). From 1937 onwards the Central Agency of Statistics, later on Statistik Austria, was responsible for the publication of official agricultural statistics (ÖSTAT 1937/44, 1946/49, 1950–1998; STATISTIK ÖSTERREICH 2000; STATISTIK AUSTRIA, 2001–2004). One of the difficulties that had to be resolved was the use of different units for the production measures during our study period of 134 years. Till the nineties of the 19th century Metzen and Eimer were used as measures of capacity, then for some years Viennese Zentner, and finally metric centner. Area measures were in the beginning Joch or Quadratklafter; conversion followed the tables of SANDGRUBER (1978). The differentiation between winter and spring cereals was not always consistent in the 19th century; only from 1922 onwards the tables contained both forms. As from 1995 the differentiation was no longer between winter and spring wheat but between soft and hard wheat, however the amounts of spring soft wheat are negligible in the investigated regions. Potatoes have been referred to after 1922 as early and late cultivars, after 1960 as early, medium early and late. Sugar beets were not distinguished from fodder beets in the first years of recording. The provinces were graded into economic subdivisions from the beginning of the agrostatistical analyses, from the middle 90ies of the19th century till World War I yields were also shown on a district level. During war there only existed the province level. Then for some years “natural” areas were introduced. From 1929 till 1974 (except 1945) there always existed records for the districts. Unfortunately from 1975 till now there are only a few years with district data, therefore an analysis on district level was not possible for the whole period. Vine yields are shown till 1936 as fully fermented; after SANDGRUBER (1978) there is to be considered a loss of approximately 20 %. After 1946 yields were indicated as unfermented juice. There are no indicators of grape quality Die Bodenkultur
recorded in the official statistics. Provinces were subdivided from the beginning of the records into regions or districts. Till 1874 fruit was not differentiated, then pomes were discerned, but yields were not ascribed to areas or trees only to economic regions (upper, middle and lower Styria till World War I). Apples were first mentioned in federal statistics 1923, after 1930 apples for cider production were quoted separately. After World War II the number of trees was also given and in the 1950ies summer and winter apples were additionally mentioned. After 1975 a differentiation between intensive and extensive production was introduced. In order to derive a longer time of observation we decided to investigate only extensively managed apple production. Yield data from big estates such as monasteries, experimental stations, or private owners were not available because of data privacy or loss. Only for vine some additional records were accessible, but they consisted mostly of verbal, qualitative descriptions, without quantitative records (ANONYM, 1803; BITTMANN, 1879; LÖSCHNIG and STEFL, 1935; STRÖMMER, 2003).
2.2 Data Analysis 2.2.1 Definition of “extremely bad harvests” Table 2 shows the familiar picture that yields have risen several fold during the investigated period. Therefore it was not useful to examine the absolute values of yield for our investigation. By normalizing to short-term mean values the long term trend of rising yields could be eliminated from the data without loosing the extreme deviations on an annual basis. These variations could have been caused by errors in gaining harvest data, by diseases or pests, and by weather extremes. In our analyses we postulate that the direct and indirect meteorological effects are the major reason for annual yield variations. This simplification cannot rule out the occasional occurrence of other causes, but the lack of records does not allow for other explanations. We choose normalization periods of 5 and 10 years; longer periods would have been affected by the progress in breeding and agronomy, in shorter periods two neighbouring extreme years would not have been recognized. Because of the big absolute increases of yield especially in the second half of the 20th century, the relative deviations of the mean became smaller. We therefore considered also the absolute deviations from the normalized mean. 97
58 (1–4) 2007
A.-M. Soja and G. Soja Table 2:
Yield increase for the investigated crops in Lower Austria, Upper Austria, and Styria between the average of the first three years (1869–1871) and the average of the last three years (2001–2003) of the investigation (apple: yield per tree starting with 1946) Tabelle 2: Ertragsanstieg bei den untersuchten Kulturen in Niederösterreich, Oberösterreich und Steiermark zwischen den ersten drei Jahren (1869–1871) und den letzten drei Jahren (2001– 2003) der Untersuchung (Apfelertrag pro Baum ab 1946)
percentile. The 134 years-period of analysis was divided into two or three sub-periods to check the existence of a trend in weather extremes; these investigations were done with the 10th percentile to increase the data basis.
Crop
3.1 Effects on Wheat Production
3 Results and Discussion
Rise of Yield in % Lower Austria Upper Austria
Styria
Wheat
430
510
560
Barley
350
320
500
Grain Maize
680
Potato
500
Sugar Beet
480
Vine
220
Before World War I grain yield of winter wheat was on a constant level between 1000 and 1500 kg.ha-1 for decades. During the interwar years the first advances in breeding and mechanization of agriculture raised yields to a level of 1500 to 2000 kg.ha-1. Increasing use of mineral fertilizer, chemical plant protection, plant growth regulators, high yielding cultivars, and improved soil tilling techniques enhanced productivity (SANGAKKARA, 2001) to an actual average level of 5000 to 6000 kg.ha-1 (see also Table 2). National averages are generally lower than the yield potential of plants assessed in field experiments – this would be 11000 kg.ha-1 for winter wheat (DIEPENBROCK et al., 2005). According to the definition of bad harvest years used for this study, in Lower Austria 15 years, in Upper Austria 11 years, and in Styria 13 years could be identified as bad harvest years for winter wheat (Table 3). For Upper Austria there were four years in common with Lower Austria; Styria showed three years in common with Upper Austria and two with Lower Austria. This low frequency of co-occurrence shows that the separate analysis of the provinces with different weather conditions is justified. As demonstrated in Figure 1 the months of the selected bad harvest years showed different deviations from the monthly means. February in Lower Austria and Styria (Figure 1a and 1c) exhibited the most noticeable deviation in temperature with 1 to 1.5 °C lower monthly means. A cold February means that soil takes longer for warming in spring and sometimes snow cover may be prolonged. This can stand for a shortening of the vegetation period. A delayed begin of vegetation cannot be balanced by postponing the subsequent growth and developmental stages, because some of the developmental processes do not only need a certain amount of degree days but day length may also play a key role. In such cases there is less time for dry matter accumulation until senescence and maturity. Additionally in February, at the end of winter, hardening gets weaker and damage by frost may occur more easily (DIEPENBROCK et al., 2005). The comparison of regression coefficients (Table 4)
550 630
Apple (for table/cider)
680
260 110/250
For the identification of extreme values standard deviations were less useful because of the sensitivity to data variation, however percentiles which are not influenced by spread of data, gave a constant number of extreme years. By using the 5th percentile of relative as well as absolute deviations from the 5 and 10 years’ normalized means, we identified about 10 % of all analysed years as extremely bad harvest years. 2.2.2 Relating agricultural to meteorological data For each year with an extremely bad harvest for a crop in one of the provinces, the deviations of the monthly parameters from the standard reference period of the WMO (1961–1990) were checked. For temperature values absolute differences in °C, for precipitation and sunshine relative differences from the standard were obtained. Then the significance of the deviations was tested by comparison with ± one 95 % confidence interval. To decide the question if either water or temperature requirements were more important for affecting yield a multiple regression analysis was calculated. Yield (normalised to the mean of 5 years) was considered as dependent variable and the monthly means of meteorological data as independent variables. Single and combination effects were expressed as beta-coefficients, i. e. normalised regression coefficients, and the corresponding error probabilities. Additional questions were investigated in wheat and vine in Lower Austria. Bad respectively super harvests were differentiated by using the 5th and 10th, resp. the 90th and 95th Die Bodenkultur
98
58 (1–4) 2007
Effects of weather conditions on agricultural crop production in Austria between 1869 and 2003 Table 3:
Years with “bad harvests” (yield shows relative or absolute deviations from the normalization period of 5 or 10 years in the 5th percentile (bold letters 1st percentile) in the provinces Lower Austria (a), Upper Austria (b), and Styria (c) for winter wheat, spring barley, maize, late potato, sugar beet, grape and apple Tabelle 3: Missjahre (Ertrag weist relative oder absolute Abweichung vom 5- oder 10-jährigen gleitenden Mittel im 5. Perzentil (fett gedruckte Jahre 1. Perzentil) auf ) in den Bundesländern Niederösterreich (a), Oberösterreich (b) und Steiermark (c) bei Winterweizen, Sommergerste, Körnermais, Spätkartoffel, Zuckerrübe, Wein und Apfel a) Lower Austria winter wheat 1873 1879 1910 1916 1918 1940 1946 1947 1970 1979 1981 1986 1993 2000 2003
spring barley 1879 1889 1917 1931 1946 1947 1948 1958 1975 1979 1981 1987 1993 2000
grain maize 1882 1887 1904 1911 1916 1917 1952 1971 1974 1976 1983 1992 1994 2003
late potato 1879 1884 1896 1904 1910 1919 1926 1959 1965 1977 1992 1994 2003
sugar beet 1876 1879 1886 1914 1915 1917 1921 1947 1952 1956 1961 1962 1994 2003
grape 1876 1880 1907 1910 1914 1916 1927 1956 1974 1981 1985
apple
spring barley 1873 1896 1897 1916 1947 1965 1979 1987 1991 2000
grain maize 1935 1936 1939 1943 1965 1970 1992
late potato 1897 1903 1906 1916 1920 1926 1936 1994
sugar beet 1923 1926 1936 1947 1965 1972 1979 1980 1991 1996
grape
apple
spring barley 1869 1870 1875 1896 1917 1920 1936 1972 1975 1979 1986 1987 1999
grain maize 1870 1877 1899 1905 1911 1920 1926 1959 1965 1970 1972 1992 1996 2001 2003
late potato 1870 1874 1896 1898 1901 1918 1926 1936 1959 1965 1972
sugar beet 1914 1915 1948 1965 1972 1979
grape 1876 1899 1904 1907 1910 1920 1924 1926 1959 1962 1981
apple 1876 1879 1897 1910 1916 1921 1925 1933 1951 1953 1954 1957 1959 1965 1972
b) Upper Austria winter wheat 1873 1886 1897 1916 1926 1947 1954 1965 1966 1979 1987 c) Styria winter wheat 1875 1895 1896 1897 1918 1920 1932 1972 1979 1987 1991 1996 1999
Die Bodenkultur
99
58 (1–4) 2007
A.-M. Soja and G. Soja b)
2 1 0 -1 -2
Tmin
-3 -4 DEC
JAN
FEB
MAR
APR
MAY
JUN
1 0 -1 -2
Tmin
-3 -4
JUL
OCT
NOV
DEC
JAN
FEB
3 2 1 0 -1
Tmax
-2 -3 -4 OCT
NOV
DEC
JAN
FEB
MAR
APR
MAY
JUN
50
Prec
0 FEB
0
-2
Tmin
-3 -4
JUL
OCT
NOV
DEC
JAN
FEB
0 -1
Tmax
-2 -3 -4 NOV
DEC
JAN
FEB
MAR
APR
MAY
JUN
JUL
MAR
APR
MAY
JUN
100 50
Prec
0 DEC
JAN
FEB
MAR
Month
Month
MAY
JUN
JUL
2 1 0 -1
Tmax
-2 -3 -4 OCT
NOV
DEC
JAN
FEB
MAR
APR
MAY
JUN
JUL
Month
150
NOV
APR
3
JUL
200
OCT
MAR
Month
1
OCT
% deviation from 1961-1990
% deviation from1961-1990
100
JAN
JUN
1
-1
Month
150
DEC
MAY
2
JUL
200
NOV
APR
3
Month
OCT
MAR
2
Month
°C deviation from 1961-1990
°C deviation from 1961-1990
Month
°C deviation from 1961-1990
NOV
2
3
APR
MAY
JUN
JUL
% deviation from 1961-1990
OCT
c)
3
°C deviation from 1961-1990
°C deviation from 1961-1990
°C deviation from 1961-1990
a) 3
200 150 100 50
Prec
0 OCT
NOV
DEC
JAN
FEB
MAR
APR
MAY
JUN
JUL
Month
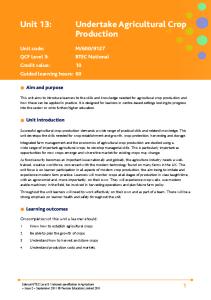
Figure 1:
Winter wheat, a) Lower Austria, b) Upper Austria and c) Styria. Deviation from standard (1961–1990) of mean monthly minima (Tmin) and maxima (Tmax) of temperature (upper graphs) resp. of precipitation sums (Prec) (lower graphs) of years with bad harvests in °C resp. in %. Values and antennae are means of bad harvest years ± 95 % confidence interval Abbildung 1: Winterweizen, a) Niederösterreich, b) Oberösterreich und c) Steiermark. Abweichung der mittleren monatlichen Temperaturminima (Tmin), Temperaturmaxima (Tmax) (oben), bzw. der Niederschlagssummen (Prec) (unten) der Missjahre vom Standard (1961–1990) in °C bzw. in %. Werte und Antennen sind die Mittel der Missjahre ± 95 % Konfidenzintervall
confirms the significance of adverse effects of low temperatures in February. In Upper Austria, the province with the lowest average temperatures for May of the three regions, bad harvest years were characterized by an additional lowering of temperatures by approximately 1 °C in May (see Figure 1b). Apparently heat requirements of winter wheat during shooting are important for yield formation. Too low temperatures in November (Upper Austria) or December (Styria) can also be detrimental for successful winter wheat cropping. As shown by HEIN (2001) thermal requirements of winter wheat are higher than that of other temperate cereals. Although extreme drought affects the productivity of all agricultural crops negatively, there also exists sensitivity to high precipitation sums. Bad harvest years in Lower Austria (Figure 1a) are characterised by an exceedingly wet February, which stands for slow soil warming in spring. In Upper Austria and Styria, which are usually more humid than Lower Austria, high precipitation sums in April and May have more negative consequences than in Lower Austria that is more endangered by drought. EITZINGER et al. Die Bodenkultur
(2001) stressed the importance of soil water availability in these regions for wheat productivity. But in all provinces high amounts of rain are disadvantageous in the harvest month July, because they bring about delayed harvest, as well as the danger of lodging, Fusarium and pre-harvest sprouting. As shown in the regression analysis in Table 4, too high precipitation during June too endangers wheat yield formation in Lower Austria. Sunshine duration in bad years for winter wheat did not differ significantly from average (data see SOJA and SOJA, 2003). Winter wheat as a C3-plant has a light saturation level at about 50 % of maximum solar radiation (DIEPENBROCK et al., 2005), therefore moderate cloudiness would not affect carbon fixation negatively. Years with extremely low yields of winter wheat have the following characteristics in common: a very cold February and/or a very wet July. For the individual provinces the subsequent traits were disadvantageous: in Upper Austria low monthly temperature means in November and May, in Styria in December, and in Upper Austria and Styria higher than average rainfall amounts in April and May (in Upper Austria also June).
100
58 (1–4) 2007
Effects of weather conditions on agricultural crop production in Austria between 1869 and 2003 Table 4:
Single and combination effects of various meteorological monthly (average temperature minima, -maxima, and sums of precipitation) on yields of winter wheat, spring barley, and maize in Lower Austria from 1869 to 2003 and during the periods 1869 to 1914, 1915 to 1959, and 1960 to 2003 Tabelle 4: Einzel- und Kombinationswirkung verschiedener meteorologischer Monatsmittel (Temperaturminima, -maxima und Niederschlagssummen) auf den Ertrag von Winterweizen, Sommergerste, und Mais in Niederösterreich von 1869 bis 2003 und während der Perioden 1869 bis 1914, 1915 bis 1959 und 1960 bis 2003 winter wheat 1869–2003 temp min Feb temp max Jun prec Feb prec Jun 1869–1914 temp min Feb temp max Jun prec Feb prec Jun 1915–-1959 temp min Feb temp max Jun prec Feb prec Jun 1960–2003 temp min Feb temp max Jun prec Feb prec Jun
single effects p
0,175 -0,214 -0,092 -0,268
0,051 0,017 0,305 0,003
0,217 -0,356 -0,090 -0,393
0,009 < 0,001 0,272 < 0,001
0,126 -0,191 -0,122 -0,238
0,403 0,205 0,419 0,112
0,156 -0,238 -0,065 -0,304
0,287 0,136 0,676 0,047
0,218 -0,136 0,034 -0,329
0,208 0,437 0,846 0,053
0,277 -0,454 -0,090 -0,585
0,093 0,017 0,580 0,003
0,210 -0,375 -0,141 -0,274
0,171 0,012 0,361 0,072
0,211 -0,559 -0,201 -0,437
0,099 < 0,001 0,118 0,002
spring barley 1869–2003 temp max May temp max Jun prec May prec Jun 1869–1914 temp max May temp max Jun prec May prec Jun 1915–1959 temp max May temp max Jun prec May prec Jun 1960–2003 temp max May temp max Jun prec May prec Jun
Die Bodenkultur
combination effects beta-coeff.
beta-coeff.
single effects
combination effects beta-coeff.
p
beta-coeff.
p
-0,258 -0,304 0,008 -0,197
0,004 0,001 0,927 0,028
-0,205 -0,370 -0,111 -0,320
0,030 < 0,001 0,221 < 0,001
-0,171 -0,331 -0,096 -0,058
0,256 0,025 0,527 0,702
-0,239 -0,327 -0,156 -0,134
0,151 0,035 0,360 0,368
-0,481 -0,294 0,155 -0,311
0,003 0,087 0,375 0,069
-0,403 -0,585 -0,147 -0,544
0,010 0,001 0,318 0,002
-0,240 -0,339 0,038 -0,306
0,117 0,024 0,805 0,043
-0,045 -0,487 0,011 -0,476
0,783 0,004 0,940 0,002
101
p
58 (1–4) 2007
A.-M. Soja and G. Soja maize
single effects beta-coeff.
1869–2003 temp max Jul temp max Aug prec Jul prec Aug 1869–1914 temp max Jul temp max Aug prec Jul prec Aug 1915–1959 temp max Jul temp max Aug prec Jul prec Aug 1960–2003 temp max Jul temp max Aug prec Jul prec Aug
p
p
-0,361 -0,182 0,260 0,174
< 0,001 0,042 0,003 0,052
-0,326 0,035 0,138 0,215
0,001 0,717 0,142 0,017
-0,538 -0,080 0,220 0,005
< 0,001 0,598 0,141 0,973
-0,596 -0,050 -0,117 0,022
< 0,001 0,754 0,497 0,883
-0,219 -0,173 0,278 0,343
0,205 0,320 0,105 0,044
-0,124 0,042 0,287 0,384
0,548 0,835 0,108 0,030
-0,237 -0,397 0,335 0,285
0,121 0,008 0,026 0,060
-0,090 -0,254 0,279 0,253
0,576 0,108 0,062 0,092
3.2 Effects on Spring Barley Production Progress in agriculture also raised the yields of barley considerably during the study period. Before World War I the yield level was similar to wheat in a range of 1000 to 1500 kg.ha-1. During the interwar period sometimes almost 2000 kg.ha-1were reached. After war a large increase to today’s 4000 to 5000 kg.ha-1 began (see Table 2). In Lower Austria 14 years, in Upper Austria 10 years, and in Styria 13 years (Table 3) could be identified as bad harvest years for spring barley. Generally barley yields were more similar in the three provinces than wheat yields. Two years (1979 and 1987) were bad harvest years in all provinces, four resp. three years were in common for two of the provinces. The investigation of meteorological parameters showed an average increase of temperatures in May and June of 1 to 2 °C for the negative extreme years compared to the reference period in Lower Austria (Figure 2a). In Styria (data not shown) the differences were less pronounced, but still significant for May. Only in Upper Austria (data not shown) this trend could not be verified. This could be caused by the generally lower temperatures and the consequent temperature deficit in this province. Barley seems to be very sensitive to super-optimal temperatures after shooting. Table 4 Die Bodenkultur
combination effects beta-coeff.
underlines the importance of too high maximum temperatures for causing low yields. SCHELLING et al. (2003) describe the eminent role of temperature during grain filling in barley: 1 °C above-optimal day-temperatures reduced grain yield by approximately 5 %. According to PASSARELLA et al. (2005) this is especially true for high yielding modern cultivars. Too cold and too humid conditions in March significantly affected the final spring barley yield. A delay of sowing and early development plays a key role for not realising the yield potential of barley. Drought in spring is more disadvantageous for spring barley in Lower than in Upper Austria and Styria, because in the latter provinces more humid conditions prevail. Plants sown in spring cannot develop a far reaching root system as soon as winter cereals – therefore the sensitivity to low precipitation is higher. High amounts of rainfall in July can be disastrous for spring barley as the optimal harvest time lasts only 5 to 7 days (DIEPENBROCK et al., 2005). Summarising, the relatively high sensitivity to wet and cold weather in March is characteristic for spring barley. However weather in May and June should not be too dry and too hot for good harvests. If it is too wet in July lodging and harvest losses may occur.
102
58 (1–4) 2007
Effects of weather conditions on agricultural crop production in Austria between 1869 and 2003 b)
2 1 0 -1 -2
Tmin
-3 -4 MAY
JUN
2 1 0 -1 -2
Tmin
-3 -4
JUL
APR
MAY
JUN
JUL
3 2 1 0 -1 -2
Tmax
-3 -4 MAR
APR
MAY
JUN
0 -1 -2
Tmin
-3 -4 MAR
APR
MAY
JUN
0 -1 -2
Tmax
-3 -4 APR
MAY
JUN
JUL
100
Prec
50 0
AUG
SEP
JUN
JUL
100
Prec
50 0 MAY
JUN
JUL
Month
SEP
2 1 0 -1 -2
Tmax
-3 -4 MAR
APR
MAY
JUN
JUL
AUG
SEP
Month
150
APR
AUG
3
OCT
200
Month
JUL
Month
1
% deviation from 1961-1990
% deviation from 1961-1990
1
Month
150
MAY
2
OCT
2
JUL
200
APR
SEP
3
Month
MAR
AUG
3
Month
°C deviation from 1961-1990
°C deviation from 1961-1990
Month
°C deviation from 1961-1990
APR
3
AUG
SEP
OCT
% deviation from 1961-1990
MAR
c) °C deviation from 1961-1990
3
°C deviation from 1961-1990
°C deviation from 1961-1990
a)
200 150 100
Prec
50 0 MAR
APR
MAY
JUN
JUL
AUG
SEP
Month
Figure 2:
Spring Barley (a), Grain Maize (b), and Potato (c), Lower Austria. Deviation from standard (1961–1990) of mean monthly minima (Tmin) and maxima (Tmax) of temperature (upper graphs) resp. of precipitation sums (Prec) of years (lower graphs) with bad harvests in °C resp. in %. Values and antennae are means of bad harvest years ± 95 % confidence interval Abbildung 2: Sommergerste (a), Körnermais (b) und Kartoffel (c), Niederösterreich. Abweichung der mittleren monatlichen Temperaturminima (Tmin), Temperaturmaxima (Tmax) (oben), bzw. der Niederschlagssummen (Prec) (unten) der Missjahre vom Standard (1961–1990) in °C bzw. in %. Werte und Antennen sind die Mittel der Missjahre ± 95 % Konfidenzintervall
3.3 Effects on Maize Production Maize, a C4-cereal which differs from wheat and barley in its light and temperature requirements, has its main vegetation period during summer months when C3-cereals have already been harvested. These characteristics are reflected also in a different distribution in the investigated provinces: Maize was not recorded in the official harvest statistics of Upper Austria until the 1930ies, whereas in Lower Austria and Styria some districts showed a maize area of up to 10 % of arable land already before World War I. Before 1914 maize yielded 1.5 to 2 t.ha-1 grain, nowadays average hectare yields of 10 t are not unusual. The increase in grain yield of maize was considerably higher than for the other cereals, especially in Lower Austria (Table 2). 14 bad harvest years could be identified in Lower Austria, 7 in Upper Austria and 15 in Styria (Table 3). There were two years in common for Lower Austria and Upper Austria, Styria showed three bad years simultaneously with Lower Austria and three years in common with Upper Austria. So two years proved to be extremely disadvantageous in all of the investigated provinces. But one must consider that for Upper Austria the time series was only approximately half Die Bodenkultur
of that for the other provinces and so there were less possibilities of overlapping. In spite of the thermophile characteristic of maize the average monthly temperatures in Lower Austrian (Figure 2b) and Styrian (data not shown) July and August followed by bad harvests were approximately 1 to 1.5 °C higher than in the reference period. Only in Upper Austria’s cooler climate there were no significant differences (data not shown) from the reference period. Here an under average cool May was more important than in the other provinces for bad harvests. Minimal temperatures for germination are 8–10 °C. Cold periods at that time can delay emergence and seedling development of maize considerably. In colder regions this has a greater affect than in warmer ones. In all provinces thermal deficits could be identified in October. Low temperatures (-2 °C) stop ripening immediately (DIEPENBROCK et al., 2005). In the case of concomitant high rainfall proper harvesting is endangered and fungal infections spread easier. Dry periods are dangerous for maize yield in the eastern provinces particularly in June, but also in July and August. HU and BUYANOVSKY (2003) report that for maize more rainfall and cooler-than-average temperatures are key features in the anthesis and kernel-filling periods from June
103
58 (1–4) 2007
A.-M. Soja and G. Soja
through August. The sensitivity assessments of Table 4 show that maize in Lower Austria also may suffer from too high temperatures in July and too low precipitation in August. Sunshine duration (data not shown) gives further evidence for the dry regions in the East that unusually sunny summers are often accompanied by lower grain yields. Maize as a C4-crop has a comparably low transpiration coefficient, but for production of high yields the water requirements are considerable (DIEPENBROCK et al., 2005). A deficit in rainfall reduces the yield of maize more than exceedingly high solar radiation which the C4-crop can utilise more efficiently than C3-crops. Generally maize is sensitive to drought periods in combination with high temperatures in summer in spite of its better water use efficiency. This must be considered especially in the East of Austria. Too cold springs can exert lasting negative effects on maize development. Adverse weather in October is a significant risk for bad harvests.
3.4 Effects on Potato Production In the beginning of the investigation period potato yields were at about 5 t.ha-1and increased till World War I especially in Upper Austria up to 20 t.ha-1. In the interwar years when early and late potatoes were differentiated yields regionally also rose till 20 t.ha-1. After a temporal break down because of World War II yields rapidly soared to today’s level of approximately 40 t.ha-1 (Upper Austria and Styria) and 35 t.ha1in Lower Austria (Table 2). 13 bad harvest years were identified for Lower Austria (Table 3), 8 for Upper Austria and 11 for Styria. Only 1926 was a low yield year for all provinces because of its cool and humid weather. Potato is sensitive to these conditions because of its susceptibility to fungal diseases. According to newspapers of that time there was also the threat of cock chafer grub and potato beetles. Lower and Upper Austria resp. Styria had two resp. four bad harvest years in common. In Upper Austria and Styria two years showed an extremely low harvest of late potatoes for the same years. The selected years were characterized especially in Lower Austria by lower temperatures than the average of the reference period (Figure 2c). Particularly in April and May potatoes were susceptible to low temperatures because of delayed sprouting and development. At planting time the effect of temperature was significant, whereas at flowering stage and during the period of starch accumulation in the tubers precipitation is more important (DIEPENBROCK et Die Bodenkultur
al., 2005). Cool and humid summers can also be disadvantageous for Upper Austria and Styria. Too much precipitation was generally a problem in Lower Austria and Styria. On an average wet years were disadvantageous for potato production, but in all of the three provinces the bad harvest years of the last decade were caused by drought periods. This gradual shift in the main problems for potato is also caused by the minor importance of fungal threats because of standard application of fungicides.
3.5 Effects on Sugar Beet Production Sugar beet was cultivated in Lower Austria in the 19th century on a large scale with yields between 10 to 20 t.ha-1. Not until World War I resp. II sugar beet production was extended to Upper Austria resp. Styria. In the last years yields reached approximately 70 t.ha-1 in all of these provinces (Table 2). There existed no bad harvest year common for all provinces (Table 3). This can partly be attributed to the shorter observation period together. There were identified 14 bad harvest years in Lower Austria, 10 in Upper Austria and 6 in Styria. Lower Austria had one year with Upper Austria and two years with Styria in common, in Upper Austria three years were also observed as bad years for Styria. Temperature minima lower than average were a problem for the development of satisfying yields especially in Lower Austria (Figure 3a) when occurring in May, but in Styria only from July to October (SOJA and SOJA, 2003). The minimal temperature for germination of sugar beet is 5 °C, during subsequent growth 15 to 25 °C are optimal, but by the end of August temperatures should not exceed 20 °C at day and 17 °C at night (DIEPENBROCK et al., 2005). In Upper Austria there was no influence of temperature minima or maxima observed. In Lower Austria on the contrary temperature maxima (Figure 3a) were too low in the first half of the vegetation period and/or too high during August and September in bad harvest years. In Styria the trend was reversed from August till October, because the temperature maxima were 1 to 2 °C too low (data not shown). Concerning precipitation, in all three provinces April was too moist in bad harvest years (Figure 3a) and therefore sowing was delayed or the development of the seedlings retarded by these adverse conditions. DIEPENBROCK et al. (1999) also mention that sugar beet is endangered by too much precipitation in March and April. In Styria high amounts of rainfall in July showed adverse affects on yield. In Lower and Upper
104
58 (1–4) 2007
Effects of weather conditions on agricultural crop production in Austria between 1869 and 2003 b)
2 1 0 -1 -2
Tmin
-3 -4 JUN
JUL
AUG
SEP
1 0 -1 -2
Tmin
-3 -4
OCT
OCT
NOV
DEC
JAN
FEB
MAR
3 2 1 0 -1 -2
Tmax
-3 -4 APR
MAY
JUN
JUL
AUG
SEP
AUG
SEP
0 -1 -2
Tmin
-3 -4 JAN
OCT
FEB
MAR
APR
MAY
0 -1 -2
Tmax
-3 -4 OCT
NOV
DEC
JAN
FEB
MAR
APR
Prec
50 0
MAY
JUN
JUL
AUG
SEP
AUG
SEP
OCT
100
Prec
50 0 NOV
DEC
JAN
FEB
MAR
AUG
SEP
OCT
2 1 0 -1 -2
Tmax
-3 -4 JAN
FEB
MAR
APR
MAY
APR
Month
JUN
JUL
AUG
SEP
OCT
Month
150
OCT
JUL
3
OCT
200
Month
JUN
Month
1
% deviation from 1961-1990
% deviation from 1961-1990
100
JUL
JUL
1
Month
150
JUN
JUN
2
OCT
200
MAY
MAY
3
Month
APR
APR
2
Month
°C deviation from 1961-1990
°C deviation from 1961-1990
Month
°C deviation from 1961-1990
MAY
2
3
% deviation from 1961-1990
APR
c)
3
°C deviation from 1961-1990
°C deviation from 1961-1990
°C deviation from 1961-1990
a) 3
MAY
JUN
JUL
AUG
SEP
OCT
200 150 100
Prec
50 0 JAN
FEB
MAR
APR
MAY
JUN
JUL
AUG
SEP
OCT
Month
Figure 3:
Sugar Beet (a), Vine (b) in Lower Austria and Apple (c), Styria. Deviation from standard (1961–1990) of mean monthly minima (Tmin) and maxima of temperature (Tmax) (upper graphs) resp. of precipitation sums (Prec) (lower graphs) of years with bad harvests in °C resp. in %. Values and antennae are means of bad harvest years ± 95 % confidence interval Abbildung 3: Zuckerrübe (a), Wein (b) in Niederösterreich und Apfel (c) in der Steiermark. Abweichung der mittleren monatlichen Temperaturminima (Tmin), Temperaturmaxima (Tmax) (oben), bzw. der Niederschlagssummen (Prec) (unten) der Missjahre vom Standard (1961–1990) in °C bzw. in %. Werte und Antennen sind die Mittel der Missjahre ± 95 % Konfidenzintervall
Austria weather was too dry in August and September, in Styria only August was affected. Sugar beet is sensitive to dry periods in late summer, because the beet should have its greatest biomass accumulation at this time. Sunshine duration was too low in bad harvest years in Lower Austria (SOJA and SOJA, 2003) in May (affecting youth development negatively) and in August and September too high (side effect of enduring high pressure area with drought). Concludingly sugar beet is very sensitive in its sowing month, which should not be too wet. Youth development needs sufficient temperatures for rapid growth. In all provinces, also in the more humid ones, drought during summer reduces beet yield considerably. Sugar yield on the other hand, is not reduced as much, because in drought stressed beets sugar concentration often increases. For this parameter data of a sufficiently long time series were not available.
3.6 Effects on Vine Production In the official statistics only quantitative harvest results are documented for vine, qualitative evaluations are lacking. Analysis of ingredients for the characterization of grape quality has been introduced just a few decades ago. ThereDie Bodenkultur
fore long term quality data series for our investigation were not available. It is well-known that for vine production the harvested amount of grapes is not exclusively important and therefore also not the primary aim of breeding. This can also be seen from the much smaller increase of yield compared to the field crops in the course of the investigated years (Table 2). Before World War II production in Lower Austria was approximately 31 hl.ha-1 unfermented grape must, after the war 48 hl.ha-1. In Styria there was an increase from 22 to 43 hl.ha-1 of must for this time range. In Upper Austria grapevine is not established because of unsuitable climatic conditions. There were 11 bad harvest years for grapes in Lower Austria and in Styria (Table 3). Four bad harvest years for the two provinces were in common. In three of these years (1876, 1907, and 1981) the reason for the calamities was frost damage, in 1910 cold, wet weather during the flowering period and a wet summer were responsible for the losses. On average too cold and too wet years became bad harvest years in both provinces (Figure 3b). Especially in February grapevines in Lower Austria were endangered by frost. Temperature minima and maxima from May to October were too low in Lower Austria in unfavourable years; in Styria this trend was not so specific (data not shown). High-
105
58 (1–4) 2007
A.-M. Soja and G. Soja a)
6
Frequency
5 4 3 2 1
15 51 -1 56 0 15 71 15 16 91 11 -2 0 16 3 16 1 51 -6 0 16 71 16 17 91 11 -2 0 17 17 31 51 -6 0 17 71 17 18 91 11 -2 0 18 18 31 51 -6 0 18 71 18 19 91 11 -2 0 19 3 19 1 51 -6 0 1 19 9 7 91 1 -2 00 2
0
Frequency
9 8 7
b)
6 5 4 3
15 51 -1 56 0 15 71 15 16 91 11 -2 0 16 3 16 1 51 -6 0 16 71 16 17 91 11 -2 0 17 17 31 51 -6 0 17 71 17 18 91 11 -2 0 18 18 31 51 -6 0 18 71 18 19 91 11 -2 0 19 3 19 1 51 -6 0 1 19 9 91 71 -2 00 2
2 1 0
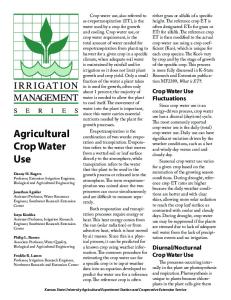
Frequency of occurrence of extremely bad harvest years for vine (a: “very low” yield in the qualitative sources and 5th percentile in the years after 1870; b: “low yield” in the qualitative sources and 5th percentile in the years after 1870) in decades between 1551 and 2002 in Lower Austria Abbildung 4: Häufigkeit des Auftretens von extremen Weinmissjahren (a: „sehr geringer“ Ertrag im verbal beschriebenen Abschnitt und 5. Perzentil im quantifizierbaren Abschnitt (ab 1870); b: „geringer“ Ertrag im verbal beschriebenen Abschnitt und 10. Perzentil im quantifizierbaren Abschnitt (ab 1870)) innerhalb von 10 Jahren zwischen 1551 und 2002 in Niederösterreich
Figure 4:
er than average rainfalls from April till harvest caused lower yields in Lower Austria, in Styria only April and May (before flowering) and September were affected. Sunshine duration (data not shown) in bad harvest years was too low in June, the month of flowering. Vine is a crop which in Lower Austria is near the northern border of its cultivation range because of climatic conditions. Therefore it is particularly sensitive to stress conditions causing yield fluctuations. Data from viticulture such as yield or vintage date can be used as indicators for possible climatic changes (LANDSTEINER, 1990). Using sources for Lower Austria going back till the middle of the 16th century (ANONYM, 1803; BITTMANN, 1879; LÖSCHNIG and STEFL, 1935; STRÖMMER, 2003) the frequency of bad harvest years over a long period was investigated. Years with bad harvests characterised in the chronicles by the terms “very low”, “very bad”, or “failure”. For the situation after 1870, years with a deviation in the 5th percentile from the normalised mean are shown in Figure 4a. Die Bodenkultur
Between 1811 till 1920 there could be noted more extremely bad years. For these years more sources were available than earlier and it must be taken also into consideration that in 1850 powdery mildew, 1872 phylloxera and 1878 downey mildew were first observed in Austria as new threatening pest and diseases (SVEJDA, 1948). In Figure 4b a presentation of years with low, small or minor yield or after 1870 years with a deviation in the 10th percentile from the normalised mean is displayed for comparison with the more stringent threshold used for classification in Figure 4a. It clearly can be observed that the number of years with bad harvests has declined dramatically in the course of time. Between 1560 and 1650 there were seven out of ten years with low harvests. Between 1680 and 1880 only four years per decade were selected. After World War II there was only one year out of ten with bad harvests. The decline in numbers over the years is not supposed to be a result of a different classification scheme in the sources with verbal description in contrast to the quantitative measurement of the
106
58 (1–4) 2007
Effects of weather conditions on agricultural crop production in Austria between 1869 and 2003
federal statistics after the year 1870 because in the overlapping period from 1870 till 1933 there could be found a high degree of conformance: only three out of 15 years with low yield in this period were not recognized by the method of the 10th percentile, these are 5 % of the 63 years in this era. When the reasons for the bad years in grape yield were classified, most damage was caused by frost, cold or wet weather (80 % of the years for which an explanation could be found in the sources mentioned earlier). Only 10 % of the years were considered as bad because of drought or heat. As during the last years drought episodes were increasing and frost damages were not occurring so often, viticulture could benefit. But it must be mentioned that the higher stability of yield is caused not only by changing weather conditions but to a great deal also by measures such as plant protection, plant breeding or irrigation.
can be seen that in the last 30 years there did not occur a single year with an extreme bad apple harvest (5th percentile) in Styria (Table 3). Many of the causes for yield losses in the 15 bad harvest years were compensated for by better management of the orchards and breeding of cultivars. Too high temperatures in March are unfavourable for apple production. In February, April and September lower temperature maxima than average endanger the harvest. If precipitation sums in April and May (flowering) and July (perhaps because of higher danger of hail) are too high, apple harvests can be lowered (SOJA and SOJA, 2003).
3.8 Differences in meteorology of “bad” and “super” yield years
Of all species studied extensively cultivated apple showed the least increase of yield during the years, but the period of investigation because of data availability was shorter than for the other crops (Table 2). To extend the period to the year 1874 data from the official statistics for pomes were used. It
For winter wheat and vine we analyzed differences between the weather of “bad” (deviations from the yield mean in the 10th percentile) and “super” (deviations from the yield mean in the 90th percentile) years. These comparisons were all performed against the weather of the standard reference period (1961–1990) of the WMO. Mean values of the meteorological parameters for the whole growing period showed no differences between years with good or bad harvests. Only if individual months were
a)
b)
3
°C deviation from 1961-1990
°C deviation from 1961-1990
3.7 Effects on Apple Production
2 1 0 -1 -2 -3 -4 OCT
NOV
DEC
JAN
FEB
MAR
APR
MAY
JUN
3 2 1 0 -1 -2 -3 -4 NOV
JUL
DEC
JAN
FEB
MAR
APR
200 150 100 50 0 OCT
NOV
DEC
JAN
FEB
MAY
JUN
JUL
AUG
SEP
OCT
Month
% deviation from 1961-1990
% deviation from 1961-1990
Month
MAR
APR
MAY
JUN
JUL
200 150 100 50 0 NOV
Month
DEC
JAN
FEB
MAR
APR
MAY
JUN
JUL
AUG
SEP
OCT
Month
Figure 5:
Winter wheat (a), Vine (b) in Lower Austria; Deviation from standard (1961–1990) of mean monthly minima of temperature (upper graphs) resp. precipitation sums (lower graphs) of years with bad or super harvests in °C resp. in %. Values and antennae are means of bad (䊉) or super (䉭) harvest years ± 95 % confidence interval Abbildung 5: Winterweizen (a), Wein (b) in Niederösterreich; Abweichung der mittleren monatlichen Temperaturminima (oben), bzw. der Niederschlagssummen (unten) der Miss- oder Superjahre vom Standard (1961–1990) in °C bzw. in %. Werte und Antennen sind die Mittel der Miss- (䊉) oder Superjahre (䉭) ± 95 % Konfidenzintervall
Die Bodenkultur
107
58 (1–4) 2007
A.-M. Soja and G. Soja
examined there could be found differences (Figure 5a). Extraordinarily high yields in winter wheat could be achieved if February was warmer, and/or May and June were colder. With lower temperatures dissimilation losses are minor, the green leaf area duration increases and hence yield is higher. Also typical for these years with higher harvests were lower precipitation sums in October, November, February, June, or July. In viniculture temperatures were significantly higher, precipitation less, and sunshine longer in May in good years, this seems to be important for flowering and therefore for the fertility and subsequent grape development. Quality parameters of the wine were not considered in these investigations. The differences in weather between the years with extremely high or low yields were only evident at critical periods; however the average values were very similar. Therefore it is important to use a timely differentiation of at least months when studying the relations between yield and meteorological conditions.
3.9 Long-Term Trend For checking the existence of a long-term trend in weather extremes, bad years (10th percentile) for winter wheat in Lower Austria (Table 5) were split into three study periods: 1st (1869–1914), 2nd (1915–1959), and 3rd (1960–2003) period. No clear difference could be recognized between bad and average years on the basis of the mean for the whole vegetation period. However, observing single months in bad harvest years instead of the whole vegetation period gave differentiated results: during the first and second period, before 1960, winter wheat suffered most from cold temperatures and high precipitations in October and from April to June whereas in the 3rd period temperatures were generally higher and precipitation in April and May often not sufficient (Figure 6a). Phenological studies during 50 years by ZAMG (2006) show that sowing time has become earlier only since the last few years for winter wheat in Austria (data for smaller regions are not available for longer periods), but flowering and ripening have accelerated since the 1990ies. The data of Table 4 also confirm the increasing importance of high summer temperatures for winter wheat, spring barley and maize during the course of the observation period.
b)
3
°C deviation from 1961-1990
°C deviation from1961-1990
a) 2 1 0 -1 -2 -3 -4 OCT
NOV
DEC
JAN
FEB
MAR
APR
MAY
JUN
3 2 1 0 -1 -2 -3 -4
JUL
NOV
DEC
JAN
FEB
MAR
APR
200 150 100 50 0 OCT
NOV
DEC
JAN
FEB
MAY
JUN
JUL
AUG
SEP
OCT
Month
% deviation from 1961-1990
% deviation from1961-1990
Month
MAR
APR
MAY
JUN
200 150 100 50 0 NOV
JUL
DEC
JAN
FEB
MAR
APR
MAY
JUN
JUL
AUG
SEP
OCT
Month
Month
Figure 6:
Winter wheat (a), Vine (b) in Lower Austria; Deviation from standard (1961–1990) of mean monthly minima of temperature (upper graphs) resp. precipitation sums (lower graphs) of years with bad harvests in different periods in °C resp. in %. Values and antennae are means from harvest years 1869 to 1959 (1st+ 2nd period) (䉭), from 1960 to 2003 (3rd period) (䊉) ± 95 % confidence interval Abbildung 6: Winterweizen (a), Wein (b) in Niederösterreich; Abweichung der mittleren monatlichen Temperaturminima (oben), bzw. der Niederschlagssummen (unten) der Missjahre in verschiedenen Perioden vom Standard (1961–1990) in °C bzw. in %. Werte und Antennen sind die Mittel der Erntejahre 1869 bis 1959 (1. + 2. Periode)(䉭) und von 1960 bis 2003 (3. Periode) (䊉) ± 95 % Konfidenzintervall
Die Bodenkultur
108
58 (1–4) 2007
Effects of weather conditions on agricultural crop production in Austria between 1869 and 2003 Table 5:
Average temperature minima, -maxima, and sums of precipitation ± standard deviation from January to July in “bad” years and normal years for winter wheat in Lower Austria from 1869 to 1914 (1st period), from 1915 to 1959 (2nd period) and from 1960 to 2003 (3rd period) Tabelle 5: Durchschnittliche Temperaturminima, -maxima und Niederschlagssummen ± Standardabweichung von Jänner bis Juli in Jahren mit Missernte bei Winterweizen oder normalen Jahren in Niederösterreich von 1869 bis 1914 (1. Periode), von 1915 bis 1959 (2. Periode) und von 1960 bis 2003 (3. Periode) period
year
1869–1914
1915–1959
1960–2003
temperature minimum (°C)
temperature maximum (°C)
precipitation sum (mm)
“bad”
5.4 ± 0.6
13.4 ± 0.6
473 ± 114
normal
5.2 ± 0.7
13.4 ± 0.8
385 ± 73
“bad”
5.5 ± 1.3
14.0 ± 1.5
404 ± 91
normal
5.5 ± 1.0
13.8 ± 1.2
402 ± 89
“bad”
6.2 ± 0.7
14.6 ± 1.2
401 ± 130
normal
6.2 ± 1.0
14.6 ± 1.2
361 ± 64
The correlation between yield and weather parameters for all years split in 30 years’ periods (shown for wheat in Table 6) was also investigated. If June was too wet, winter wheat yields were lower. After 1974 temperature maxima in May and June were sometimes too high for good wheat harvests. In spring barley this trend could be also observed. Too much rain in June often prevented high yields. The influence of too high temperatures in May and June became especially relevant in the last years. For grain maize high maximum temperatures in July and August could be also disadvantageous for high yields, in these months precipitation sum was often too low (results for spring barley and maize see SOJA et al., 2004). We also analyzed if there occurred a change of weather parameters in bad and normal years for vine over the course of the investigation period (Table 7). On an average years were colder, wetter and less sunny in the first period than in the second period, but “bad years” were even colder and sunshine duration was shorter. In February, May, August and
September temperatures were lower in years of the 1st period with low yields, months with higher precipitation in the early period were April, May and September (Figure 6b). The characteristic trait of a “bad” year changed in the 2nd period: damaging low temperatures had a lower frequency, but drought periods occurred more often. It must be taken into consideration that the range of varieties has changed: In 1878 red and rosé vines covered only 1 % of the vineyard area, till 1999 their portion rose to 20 % of the varieties. These varieties generally have a higher temperature optimum benefiting from the temperature increase. HARLFINGER et al. (2002) observed grapevine phenology in Krems, Eisenstadt and Vienna since 1965 and reported a trend of earlier onset of budbreak and begin of flowering of grapevine since the 1980ies. An increase of temperature of 1 °C in spring caused a shift in the phenological phases of the plant by 7 days. JONES (2004) also states that global warming can lengthen growing season for vine and improve wine quality in cooler climates.
Table 6:
Correlation between yield of winter wheat (deviation from 10 year’s mean) and meteorological parameters on a monthly basis for Lower Austria. Correlations in bold are significant at p < 0.05 Tabelle 6: Korrelation zwischen Winterweizenertrag (Abweichung vom 10-Jahresmittel) und meteorologischen Parametern auf Monatsbasis in Niederösterreich. Werte in Fettdruck zeigen eine signifikante Korrelation (p < 0.05) period month 1869–1899 1900–1929 1930–1959 1960–1989 1974–2003
Die Bodenkultur
precipitation sum (mm) Jan.-Mar. April May 0.00 -0.09 0.04 -0.48 -0.06 -0.04 0.11 0.11 -0.08 -0.28 -0.29 0.03 -0.17 0.12 0.18
June -0.13 -0.15 -0.38 -0.40 -0.26
Nov. -0.07 0.15 0.01 -0.01 0.06
109
Dec. 0.04 0.02 0.28 0.25 0.04
temp min (°C) Jan. -0.17 -0.21 0.28 0.27 0.31
Feb. 0.22 0.16 0.27 0.24 0.17
Mar. 0.13 0.41 0.37 0.09 0.00
temp max (°C) May June -0.20 -0.02 -0.31 -0.15 -0.38 0.00 -0.06 -0.31 -0.44 -0.48
58 (1–4) 2007
A.-M. Soja and G. Soja Table 7:
Average temperature minima, -maxima, sums of precipitation, and sunshine duration ± standard deviation from January to October in “bad” and normal years for vine in Lower Austria from 1869 to 1935 (1st period), and from 1936 to 2003 (2nd period) Tabelle 7: Durchschnittliche Temperaturminima, -maxima, Niederschlagssummen und Sonnenscheindauer ± Standardabweichung von Jänner bis Oktober in Jahren mit Missernte oder normalen Jahren bei Wein in Niederösterreich von 1869 bis 1935 (1. Periode) und von 1936 bis 2003 (2. Periode) period 1869–1935 1936–2003
year “bad” normal “bad” normal
temperature minimum (°C) 6.8 ± 0.6 6.8 ± 0.6 7.5 ± 0.8 7.3 ± 0.7
temperature maximum (°C) 15.0 ± 0.7 15.2 ± 0.7 15.7 ± 0.7 16.1 ± 1.1
4 Conclusions Seven agricultural crops (winter wheat, spring barley, corn, sugar beet, potato, grapevine, apple) were analysed for their yields in three provinces (Lower Austria, Styria, Upper Austria) from 1869 to 2003. Years with very low winter wheat yields showed two distinct characteristics which were common for all three regions: February temperatures were significantly below average and the precipitation sum in July was especially high. Additionally, individual parameters were only in one or two of the regions important: in Upper Austria May temperatures were lower than average, in both Styria and Upper Austria April and May were very humid. Spring barley showed high sensitivity to drought. Especially in the Pannonian region (Eastern Austria) this led to bad harvests if temperatures were above average, too. Much rain in the harvest month July was disadvantageous because it increased the possibility of lodging. Also corn was sensitive to drought periods in summer, especially in Eastern Austria. In the harvest month of October wet weather was a risk factor for a year to develop into a negatively extreme year because of the damage of fungal diseases. Bad years for potato generally were years with high precipitation sums. This was caused by increased infection and rapid propagation of fungal diseases in moist years. However, in recent decades negatively extreme years were sometimes also caused by drought, giving evidence for a shift in the main reasons for low yields. Sugar beet was especially sensitive to wet periods in April when most of the sowing is done. Seedling development required sufficient warmth for rapid growth. In summer, however, drought in all three regions, including the more humid ones, reduced yield significantly. Grapevine productivity suffered most from very cold temperatures in February and from moist and cool condiDie Bodenkultur
precipitation sum (mm) 622 ± 192 557 ± 191 539 ± 121 548 ± 196
sunshine duration (h) 1620 ± 130 1700 ± 130 1660 ± 110 1740 ± 130
tions during the summer months, including the month of anthesis (June). Heat or drought was of negligible importance. Recently the years with drought periods and less frost damage have become more frequent; it is suggested to consider grapevine as a possible winner when climatic conditions in Austria change. Apple production was adversely affected by high temperatures in March and by low temperatures in February and April. Additional risk factors were too wet conditions in April and May (during anthesis) and in July. Predictions of the risk of agricultural yield losses caused by weather extremes require the consideration of geographic region, species and timing of extremes. Better forecasts of the effects of climatic changes including economic assessments will be possible if the analyses presented in this project can be expanded to all important crop species and production areas and if such results can be related to meteorological data which are temporally better resolved than those available for this study. An extension of the analyses to the meteorological conditions of years with extremely high yields would also allow for a more comprehensive understanding of the chances and risks of future climatic developments.
5 Literature ANONYM (1803): Versuch einer hundertjährigen Weinfechsungsgeschichte Österreichs: von 1700 bis 1800 – Aus Urquellen, Schmidbauer, Wien. AUER, I., R. BÖHM, W. SCHÖNER (2001): Austrian longterm climate 1767–2000, Österreichische Beiträge zu Meteorologie und Geophysik 25, ZAMG. BLÖCHLIGER, H., F. NEIDHÖFER (1998): Klimaänderung Schweiz: Auswirkungen von extremen Niederschlagsereignissen, http://www.proclim.unibe.ch/OcCC/reports/ PDF/OcCCReport01D.pdf
110
58 (1–4) 2007
Effects of weather conditions on agricultural crop production in Austria between 1869 and 2003
BÖHM, R. (2006): Hat die Klimavariabilität im Alpenraum zugenommen. Eine Flash-Studie mit ~200-jährigen HISTALP-Daten, 9. Österreichischer Klimatag, Universität für Bodenkultur, Wien, 16.–17. 3. 2006. http:// www.austroclim.at/fileadmin/user_upload/ppt_9.Klima tag/V22-Boehm.pdf#search=%22Hat%20die%20 Klimavariabilit%C3%A4t%20im%20Alpenraum%20zuge nommen%22 BÖHM, R., I. AUER, M. BRUNETTI, M. MAUGERI, T. NANNI, W. SCHÖNER (2001): Regional temperature variability in the European Alps 1760–1998 from homogenised instrumental time series, Int. Jour. Clim. 21, 1779–1801 BITTMANN, J. (1879): Gedenkbuch und Weinchronik 1540–1879, Stiftsarchiv Klosterneuburg Hs.121. BMLFW (1919-1924): Anbauflächen und Ernteergebnisse im Gebiete der Republik Österreich im Jahre 1918–1923. Österreichische Staatsdruckerei, Wien. BMLFW (1925): Erntestatistik. Anbauflächen und Ernteergebnisse in der Republik Österreich im Jahre 1924. Österreichische Staatsdruckerei, Wien. BMLFW (1926 – 1937): Statistik der Ernte in der Republik (im Bundesstaate ab 1934) Österreich im Jahre 1925–1936. Österreichische Staatsdruckerei, Wien. DIEPENBROCK, W., F. ELLMER, J, LÉON (2005): Ackerbau, Pflanzenbau und Pflanzenzüchtung. Verlag E. Ulmer, Stuttgart. DIEPENBROCK, W., G. FISCHBECK, K.-U. HEYLAND, N. KNAUER (1999): Spezieller Pflanzenbau. 3. Aufl., Eugen Ulmer, Stuttgart. EITZINGER, J., J. ZALUD, Z. ZALUD, V. ALEXANDROV, C. A. VAN DIEPEN, M. TRNKA, M. DUBROVSKY, D. SEMERADOVA, M. OBERFORSTER (2001): A local simulation study on the impact of climate change on winter wheat production in north-eastern Austria. Bodenkultur 52, 279–292. FOELSCHE, U. (2003) Entwicklung extremer Wetterereignisse und regionale Auswirkungen auf Österreich, StartClim-Workshop: Extreme Wetterereignisse – Auswirkungen und Auswege für betroffenen Wirtschaftssektoren, Graz, 11.–12. 9. 2003. http://www.hdp-a.at/startclim/papers/regionale_auswirkungen.pdf#search=%22f oelsche%20startClim-Workshop%22 HARLFINGER, O., E. KOCH, H. SCHEIFINGER (2002): Klimahandbuch der Österreichischen Bodenschätzung. Klimatographie, Teil 2. Universitätsverlag, Wagner, Innsbruck, 185. HEIN, W. (2001): Getreidebau im Alpenraum: Möglichkeiten innerhalb natürlicher Grenzen. GetreidefachtaDie Bodenkultur
gung, 28. 6. 2001 BA für alpenländische Landwirtschaft Gumpenstein. JONES, G. (2004): Making wine in a changing climate, Geotimes, Aug. 2004. http://www.agiweb.org/geotimes/ aug04/feature_wineclime.html K.-K. ACKERBAUMINISTERIUM (1869-1870): Landwirthschaftliches Wochenblatt des K.-K. Ackerbauministeriums in Wien, Gerold, Wien, 1.1869–2.1870. K.-K. ACKERBAUMINISTERIUM (1871): Mittheilungen des k.k. Ackerbau-Ministeriums, Wien, Jahrgang 1–3. K.-K. ACKERBAUMINISTERIUM (1874–1914): Statistisches Jahrbuch des k.k. Ackerbau-Ministeriums für 1873– 1913. Verlag von Faesy & Frick/k.k. Hof- und Staatsdruckerei. K.-K. ACKERBAUMINISTERIUM (1915–1918): Anbauflächen und Ernteergebnisse der landwirtschaftlichen Bodenprodukte in den im Reichsrate vertretenen Königreichen und Ländern mit Ausnahme Galiziens und der Bukowina im Jahre 1914–1917. k.k. Hof- und Staatsdruckerei, Wien. KROMP-KOLB, H., H. FORMAYER (2005): Schwarzbuch Klimawandel. Wie viel Zeit bleibt uns noch? ecowin Verlag der TopAkademie, Salzburg. LANDSTEINER, E. (1990): Weinbau und Gesellschaft in Mitteleuropa – ein Interpretationsversuch am Beispiel des Retzer Gebietes (16. –18. Jahrhundert), In: Probleme des niederösterreichischen Weinbaus in Vergangenheit und Gegenwart, Studien u. Forschungen aus d. NÖ Inst. f. Landeskunde Bd. 13, Wien: Selbstverlag NÖ Inst. f. Landeskunde, 99–139. LÖSCHNIG, J., L. STEFL (1935): Geschichtliche Aufzeichnungen über die Weinjahre von 1551 bis 1933. In: Österreichischer Wein- und Obstbau-Kalender, 149–180. LUTERBACHER, J. D., DIETRICH, E. XOPLAKI, M. GROSJEAN, H. WANNER (2004): European seasonal and annual temperature variability, trends, and extremes since 1500, Science, 303, 1499–1503. ÖSTAT (1937/44, 1946/49, 1950–1998): Ergebnisse der landwirtschaftlichen Statistik im Jahre 1937/44, 1946/ 49, 1950–1998, Österreichische Staatsdruckerei, Wien. PASSARELLA, V., R. SAYIN, G. SLAFER (2005): Breeding effects on sensitivity of barley grain weight and quality to events of high temperature during grain filling, Euphytica, 141, 41–48. SANDGRUBER, R. (1978): Wirtschafts- und Sozialstatistik Österreich-Ungarns. Teil 2: Österreichische Agrarstatistik 1750–1918. In: Hoffmann, A., H. Mathis and M.
111
58 (1–4) 2007
A.-M. Soja and G. Soja
Mitterbauer (eds.): Materialien zur Wirtschafts- und Sozialgeschichte, Bd.2. Verlag für Geschichte und Politik, Wien. SANGAKKARA, U. R. (2001): Plant stress factors: their impact on productivity of cropping systems. In: Crop Science: Progress and Prospects, Nösberger, J., H.H. Geiger, and P.C. Struik (eds.), CABI, Oxon, New York. SCHELLING, K., K. BORN, C. WEISSTEINER, W. KÜHBAUCH (2003): Relationships between yield and quality parameters of malting barley (Hordeum vulgare L.) and phenological and meteorological data. Journal of Agronomy and Crop Science 189, 113–122. SCHORER, M. (2000): Trockenheit in der Schweiz – Workshopbericht, http://www.proclim.unibe.ch/OcCC/work shops/PDF/trockenheit.pdf SCHÖNER, W., I. AUER, R. BÖHM, S. THALER (2003): Qualitätskontrolle und statistische Eigenschaften ausgewählter Klimaparameter (Temperatur, Niederschlag, Schneehöhe) auf Tageswertbasis im Hinblick auf Extremwertanalysen. In: StartClim2003: Erste Analysen extremer Wetterereignisse und ihrer Auswirkungen in Österreich; H. Kromp-Kolb and I. Schwarzl (Eds.), 82, Inst. of Meteorology and Physics, BOKU, Vienna. http://www. boku.ac.at/austroclim/startclim/bericht2003/StCl_end_ Auflage2.pdf SOJA, G., A.-M. SOJA, J. EITZINGER, G. GRUSZCZYNSKI, M. TRNKA, G. KUBU, H. FORMAYER, W. SCHNEIDER, F. SUPPAN, T. KOUKAL (2004): Analyse der Auswirkungen der Trockenheit 2003 in der Landwirtschaft Österreichs – Vergleich verschiedener Methoden. StartClim2004. C In: Analyse von Hitze und Trockenheit und deren Auswirkungen in Österreich; H. Kromp-Kolb and I. Schwarzl (Eds.), pp. 68, Inst. of Meteorology and Physics, BOKU, Vienna. http://www.boku.ac.at/austroclim/start clim/bericht2004/StCl04C.pdf SOJA, G., A.-M. SOJA (2003): Dokumentation von Auswirkungen extremer Wetterereignisse auf die landwirtschaftliche Produktion. In: Startclim2003: Erste Analysen extremer Wetterereignisse und ihrer Auswirkungen in Österreich, H. Kromp-Kolb and I. Schwarzl (Eds.), Chapter 3b, pp. 106. Institute of Meteorology and Physics, BOKU, Vienna. http://www.boku.ac.at/austroclim/ startclim/bericht2003/StCl03b.pdf STATISTIK AUSTRIA (2001–2004): Statistik der Landwirtschaft 2000 ... 2003. Verlag Österreich, Wien. STATISTIK ÖSTERREICH (2000); Ergebnisse der landwirtschaftlichen Statistik 1999, Verl. Österreich, Wien.
Die Bodenkultur
STRÖMMER, E. (2003): Klima-Geschichte – Methoden der Rekonstruktion und historische Perspektive. Ostösterreich 1700 bis 1830. Hrsg.: Pils, S.C., Verein für Geschichte der Stadt Wien. Forschungen und Beiträge zur Wiener Stadtgeschichte, Bd. 39. Deutike, Wien. SVEJDA, F. (1948): Untersuchungen über den Rückgang des Weinbaus in Wien und Niederösterreich seit 1900. Dissertation Hochschule für Bodenkultur, Wien. ZAMG (2006): Phenology – Website, http://zacost.zamg. ac.at/phaeno_portal/no_cache/auswertungen/diagramme. html?list=1
Acknowledgements This study was a sub-project of the research programs “StartClim 2003” and “StartClim 2004”, which were generously supported by BMWA, BMLFW, BMBWK, Die Österreichische Hagelversicherung, Die Österreichische Nationalbank and Umweltbundesamt. Thanks to “Statistik Austria” for providing the harvest data and to ZAMG for the meteorological data. The authors gratefully acknowledge the coordination efforts of Helga Kromp-Kolb for “StartClim”.
Address of the authors Dipl. Ing. Dr. Anna-Maria Soja, PD Dipl. Ing. Dr. Gerhard Soja MSc, ARC Seibersdorf research, Abt. Umweltforschung, 2444 Seibersdorf, Austria Eingelangt am 20. September 2006 Angenommen am 31. Oktober 2007
112
58 (1–4) 2007