Effects of Aeration on the Quality of Popcorn Tu Tu Tran, G. S. Srzednicki and R.H. Driscoll 1
ABSTRACT Gentle in-store drying of popping corn may reduce the risk of stress fissures being generated, an effect which reduces popcorn expansion volume. In order to allow optimisation studies of in-store drying to be conducted, thermophysical properties of two current Australian popping corn varieties were measured in the range 30-50°C, at moisture contents from 12% to 20% wb. Models were developed for moisture isotherms, true density, bulk density, pressure drop and thin layer drying rate. Keywords: Popcorn, Thermophysical properties, Volume expansion.
INTRODUCTION The current production of popping corn in Australia is a small proportion of the total production of 371,000 t (FAO, 1997). There are several varieties grown at present, the main ones being Riverpop, Micropop and Snopop. Processors classify Riverpop as ‘mushroom’ type, whereas Micropop and Snopop are classified as ‘butterfly’ type popcorn. Riverpop and Snopop are microweavable. Popping corn is of commercial interest for growers, grown under contract with the processor, with the grower receiving incentives for supplying good quality crop. Quality is defined by two parameters, namely expansion ratio and popped ratio. Expansion ratio is the total volume of popped corn divided by the total weight of popcorn. Popped ratio is the weight of corn minus the unpopped portion, divided by the weight of corn. A popping test is usually carried out in a ‘metric weight volume tester’ at a temperature of 250°C. The minimum criteria for procurement of popping corn are an expansion ratio of 35:1 and a popping percentage of 85%. Expansion ratios above 38:1 and popping percentage above 95% percent are considered excellent. Popping tests are carried out at moisture contents (mc) between 12.5-14.5% wb, corresponding to the maximum values of the two ratios. It has been established (White et al., 1980) that the expansion volume of corn is affected by the drying conditions. It appears that high moisture content at harvest, high drying temperatures and the presence of stress cracks (White and al., 1981a) decrease the expansion ratio. Bemis and Huelsen (1955) have shown that drying too rapidly can cause stress cracks (endosperm fractures) in the kernels. Expansion volume is the most critical quality factor for popcorn. This is because the commercial buyer purchases the popcorn
1
Department of Food Science and Technology, The University of New South Wales, Sydney NSW 2052, Australia
by weight and sells it by volume. In addition, popcorn texture (tenderness and crispness) correlates positively with popping volume. In Australia, corn is usually harvested at a lower moisture content than in the United States or in Southeast Asia. Hence, deep bed drying using near-ambient air is an attractive option for reducing moisture to the desired level of 12-14%wb, giving uniform moisture distribution within the grain mass, and cooling grain after drying to reduce insect activity. Most of the drying studies on popcorn have been done using thin layer drying models (Ross and White, 1972; White et al., 1981b). White et al. (1981) reported that the exponential thin layer model was adequate for predicting popcorn drying rates and establishing the effect of drying air conditions on the fully exposed drying characteristics of popcorn. No work on Australian varieties was found. Relatively little information is available on the deep bed drying characteristics of shelled popcorn. Only limited deep bed drying models have been developed due to a number of difficulties. Shove (1971) indicated the possibility of developing a multiplezone drying system for drying deep beds such as fully loaded grain bins. However, further development was needed to overcome difficulties such as: improper air distribution resulting in uneven drying, pressure drop of air at different bed depths, determination of grain moisture content at different levels and positioning of the air distribution system. A two dimensional deep bed drying model has been developed (Franca et al., 1994) and has the capability of handling both non-uniform velocity profiles and material properties as a function of temperature and moisture content. The purpose of this study was to determine specific thermophysical properties and to fit suitable mathematical models for two Australian corn varieties of relevance to popcorn production. The properties determined were moisture sorption isotherms, bulk properties, airflow resistance and thin layer drying rates. In subsequent deep bed drying experiments, the effects of the drying strategy on the expansion volume of popcorn were then studied using these models. MATERIALS AND METHODS Corn Samples Two varieties of corn were used in this study: Micropop popping corn (M) (named for its potential as a microwaveable popcorn) and Snopop popping corn (S). Grain samples were received at a moisture content of (12.9+0.1)%, supplied by Allgold Food Pty Ltd from the production area in the Riverina region of New South Wales. The samples were stored in a thermostatically controlled cold storage (10+1)°C system prior to experiments. Grain samples were then divided into lots of 10 kg and remoistened to about 18- 20% moisture wet basis (wb), then stored at 40C for at least 4 weeks with weekly moisture content checks. Toluene in small jars with perforated caps was used to prevent mould growth in the grain during conditioning. Moisture Content Determination A moisture determination technique using an air convection oven and Mettler infrared (IR) dryer were used. After determining a suitable sample size, heating time and
lamp intensity in preliminary trial runs, calibration of the IR method against the oven method (ASAE, 1988) was carried out. The standard curve of IR result versus oven method result was constructed using linear regression. This standard curve was used in conjunction with the IR method for determining all reported moisture contents in this experiment. Moisture Sorption Isotherms The moisture sorption isotherm (MSI) defines moisture equilibrium with the air conditions to which the product is exposed and determines the bonding strength of water to the solid molecules as well as the availability of water for biological and physicochemical reaction (Cadden 1988), and determines the end point of drying. The corn sorption isotherms were determined using the static gravimetric method, due to its simplicity and cheapness as compared to the dynamic method (Hall 1980, Multon et al. 1980, Farmer et al. 1983). Data on the equilibrium relative humidity (ERH) of the saturated salts used were obtained from Greenspan (1977). The salts were put in the jars and water was added slowly with stirring, to give a saturated solution that only just covered the surface of a large excess of salt crystals. During equilibration, the saturated solutions were stirred whilst the samples were weighed, to prevent layering. Experiments were conducted at 30°, 40° and 50° C. The hygrostatic jars were positioned randomly in an incubator maintaining an air temperature within ±1°C, with the temperature being controlled by an on-off thermostat. Corn samples (variety M and S) were placed on petri dishes on glass tripods above the salt solutions before being placed randomly into incubators. All samples were weighed until the difference between subsequent weighing was less than 10 mg/g. A small glass bottle with approximately 2 ml toluene was placed inside the hygrostat at RH ≥ 70 % to prevent mould growth. At the end of equilibration, the moisture content was estimated by: W2 =
M1 W1 - 100Mw
(1)
M2 The salt solutions were also monitored, to ensure that all remained saturated (with excess salt in the solution) throughout the course of the study. The experimental MSI data were fitted into the modified Chung-Pfost equation (Do Sup Chung and Chong-Ho Lee, 1985): RH = 100 exp {[-a/(T + c)] exp(-bM)} Bulk Properties Bulk density(ρB) . The bulk density of corn was determined from its definition:
(2)
ρ
mass (kg/m 3 ) (3) B volume occupied 1000ml of corn in bulk, measured using a glass measuring cylinder, were weighed. The average ρB was then calculated based on the measured data. Since the density of food materials depends on temperature and composition, corn samples with different moisture contents were used to estimate ρB. The volume of the sample was chosen to be sufficiently large as to make edge effects negligible. Four data points only were measured for each variety. =
True density (ρT). True density is defined as the density of a pure substance, without pores or interstitial space. The true density of popcorn was determined by grinding the product at different moisture contents in a laboratory grinder, so as to exclude all internal pore spaces. The corn powder samples were sieved to give a uniform particle size of 0.4µm. The true density or specific gravity (SG) of the dry solid was then determined using a 25ml density bottle with toluene as the fluid (Lewis, 1987), and was calculated by:
ρ
T
=
weight of solid x specific gravity of fluid weight of equal volume liquid
(kg/m 3 )
(4)
Care was taken to ensure that surface wetting occurred and that no air bubbles were trapped. Bulk Porosity (εB). Porosity is a measure of the volume fraction of void space or air, both internal and external to the bulk product, and is calculated by:
ε
B
=1−
ρ ρ
B
(5)
T
Again, the relationship between the bulk porosity and moisture content was determined by regression. Resistance to airflow. The pressure drop apparatus was a 1-meter high steel pipe with an internal diameter of 0.15m, mounted above a plenum chamber. As moisture was not expected to be a major variable over the range of interest, two corn samples of 13.6% wb and 17.0% wb were loaded into the pressure drop apparatus. The air velocity was measured in the plenum chamber using a hot wire anemometer. For each sample, an average of 10 readings was taken as the inlet air velocity was varied. Variable airflow rates were achieved by adjusting a damper in the system, with a maximum possible velocity of 0.465 m/s. The pressure drop across the product samples 27.4-mm apart was measured using a differential manometer. The manometer responded quickly to changes in air speed and results were reproducible. The pressure taps were extended 50 mm into the sample
chamber using a rubber stopper with a copper tube to reduce wall effects. The pressure drop was recorded at different airflow rates from 0.179 m/s to 0.465 m/s. Analysis showed that airflow rate had a significant effect on pressure drop. An equation based on the airspeed dependence of the Ergun’s equation was used (Chung & Lee, 1985): ∆P = Vs (aF + bW +cVs +d) + e
(6)
Thin Layer Drying. The thin layer drying apparatus consisted of a drying chamber with an upward airstream. Before each treatment, the dryer was allowed to run without the corn sample, for at least 0.5 to 1h (depending on temperature and relative humidity), in order to achieve steady state conditions and the desired temperature set point, as determined by data logger. The actual sample was then placed in the thin layer drying apparatus. The initial moisture content of the corn sample was measured before drying commenced. About 200g of accurately weighed (to ±0.01g) conditioned corn at 22% db was spread evenly as a thin layer on a wire mesh tray, and dried in the thin layer drying apparatus. An initial measurement of the tray and the sample mass was performed. The weight change of the corn during drying was monitored until the weight change of the sample was less than 0.01g for 3 h. The drying parameters (air velocity, air temperature and RH) were controlled and maintained constant during the whole process. At the end of each run, samples were taken to determine the final average moisture content, by the IR method. The drying curve was then constructed as a plot of moisture against time. The two compartment model (Sharaf-Eldeen et al., 1980) can be used to predict temperature and moisture content distributions within the corn kernels dried in thin layers. To use this model for predicting the drying behaviour of kernels during thin layer drying, experimental data representing the average moisture content were collected according to the procedure described above. To simplify comparisons, the average moisture content was expressed in its nondimensional form as the average moisture ratio. The experimental data were fitted to Eq. 7 and Eq. 8 as follows: Two compartment model (Sharaf-Eldeen et al., 1980): MR = c1 exp(- k1 t) + c2 exp(- k2 t)
(7)
To include the effect of temperature on thin layer drying, a linear temperature dependence of constants k1 and k2 was assumed: MR = c3 exp[-(k3 + k4 T)t] + c4 exp[-(k5 + k6 T)t]
(8)
Regressions of the experimental and model data were then used to estimate the coefficients for the models. Arrhenius temperature dependence was also tested but was not as effective a model in this case. Deep bed drying. The deep bed drying apparatus consisted of a 1-metre steel column mounted above the plenum chamber. About 10 kg each of two variety of corn samples were loaded into the deep bed drying apparatus. The corn was dried at an air velocity of
5.0m/min. The temperature changes during drying at every 10cm depth of corn were monitored by thermocouples linked to a computerised data logger. The plenum temperature and relative humidity were monitored and collected by the temperature controller of the deep bed drying apparatus. 2 × 25g samples of corn were measured for moisture content before drying commenced and during the course of drying. Drying was completed when the moisture content of corn reached the range 12.5 to 14.5% wb. All of the drying parameters required for deep bed drying (bin size and shape, air velocity, air temperature and relative humidity, corn initial moisture content), and the modeled thermophysical properties (corn moisture sorption isotherms, corn bulk density and porosity, pressure drop across the corn bed and the thin layer drying model), were used as input to the deep bed drying simulation program. This program was then used to predict the drying performance of popcorn under different operating conditions. Popping test. About 30g of accurately weighed corn were poured into a domestic hot air corn popper (Black and Decker Hot’n Pop PC20) which was allowed to run for 2 minutes, until the popcorn completed popping. The expansion volume of corn was measured using a measuring cylinder up to approximately 1000ml. The unpopped material was also weighed. The expansion ratio and the popped ratio are calculated by: Expansion ratio =
Popped ratio =
total volume of popped corn total weight of popcorn
weight of corn - unpopped portion weight of corn
(9)
(10)
Commercial ratings of the popcorn, based on the expansion ratio are: < 30 - unsuitable for popping 30 - 31 - below average expansion 32 - 33 - average expansion 34 - 37 - good expansion quality 38 - excellent expansion quality
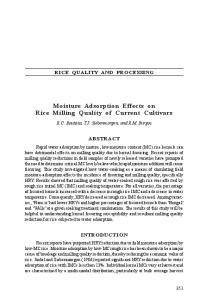
RESULTS AND DISCUSSION Moisture Sorption Isotherms The MSI for the two varieties of popcorn are shown in figures 1 and 2. According to Brooker et al. (1992), at constant RH the lower the temperature the higher the equilibrium moisture content of the corn. Figures 1 and 2 show agreement of experimental data with literature at RH above 80 %. There does not seem to be an obvious relationship between equilibrium moisture content and temperature at lower RH.
Comparison of the two varieties of popcorn show that the S variety has a slightly higher equilibrium moisture content than the M variety at the same conditions. Fitting of experimental EMC data to the modified Chung-Pfost model (Eq.11) gave: RH = 100 exp {[5770.6 / (T + 30.759)](- exp (-36.22M)]}
(11)
with a correlation coefficient of 0.9415 and a standard error of ±7%. The relationship between experimental data and the theoretical values calculated using the modified Chung-Pfost RH model is shown in Fig. 3. This indicates the linear relationship between the experimental and predicted RH, and suggests that the model can be used to predict the sorption behaviour of corn. Bulk Properties The bulk density of popcorn as a function of moisture is shown in figures 4a and 4b, showing that the bulk density increases with decreasing moisture content. This was in agreement with other grain products such as grain sorghum (Gunasekaran and Jackson, 1988) and millet (Visvanathan et al., 1990). The bulk density of popcorn regressed against moisture was: - for the M variety:
ρB = 1036.1 - 10.29W(%)
- for the S variety:
ρB =
986.2 - 6.33W(%)
The true density was: - for the M variety:
ρT = 1665.1 - 20.25W(%)
- for the S variety:
ρT = 1477.5 - 6.28W(%)
All equations show a negative correlation between density and moisture content, i.e. an increase in density upon drying. A significant variation in density was observed between the two varieties. The relationship between bulk porosity and moisture content was: - for M variety:
εB = 0.3753 - 0.00158W(%)
- for S variety:
εB = 0.3381 + 0.0129W(%)
However the variation with moisture for porosity is small. Neither of the two varieties demonstrated the expected decrease in bulk porosity during drying.
Resistance to Airflow Figure 5 shows the pressure drop of popcorn at various air velocities. The results indicated that moisture content has a slight effect on pressure drop. These results confirm findings reported in the literature. Gunasekaran and Jackson (1988), Sokhansanj et al. (1990) and Jayas et al. (1991) generalised that a lower moisture content resulted in higher bulk densities, and consequently a higher pressure drop at any given air flow rate. Fitting the pressure drop experimental data to Eq. 6, the pressure drop was: ∆P = Vs (0.17W + 11Vs +26) - 4.2 Figures 6a and 6b show a comparison between the experimental data and model, which had a correlation coefficient of 0.964 and standard error of 0.735. This suggested that the experimental data could be fitted using the modified Ergun model. At this stage, modelling of the equation constants in terms of porosity was not warranted due to the limited data set.
Thin Layer Drying Studies Experimental work done by different researchers on thin layer drying of corn showed that the data could be fitted to both the exponential and Page models (White et al. 1981b., Li & Morey, 1984). The two compartment model has not been tested for popcorn so far. However, satisfactory application of the model was reported for ear corn (SharafEldeen et al. 1980), wheat (Graham et al. 1983) and macadamia nuts (Palipane & Driscoll, 1994). Therefore, the authors of this study investigated whether the two compartment model was applicable to thin layer drying of popping corn. The EMC of corn samples as calculated by the Chung-Pfost model at the temperatures and RH’s used in the thin layer drying trials, are shown in table 1. A typical drying curve for thin layer drying of corn was plotted in Fig. 7 (data from run no. 2 at a drying temperature of 50°C, 14.6% RH, and initial moisture content of the corn was 21.8%db). Fitting data of run no. 2 to the two compartment model (Eq. 7) gave: MR = 0.349 exp(-0.0003 t) + 0.479 exp(-0.0041 t)
(12)
with a correlation coefficient of 0.995 and standard error of 0.05.
Table 1. The EMC of corn for thin layer drying
Run no.
(average Temp.
run RH(d.p)
conditions) MC (%)
2 3 4 5 6 7 8 11 12 14
49.9 45.0 39.9 35.0 29.8 60.0 70.0 50.1 38.8 68.7
0.146 0.188 0.247 0.257 0.240 0.057 0.038 0.179 0.374 0.112
4.2 5.4 6.8 7.4 7.6 1.1 -0.3 4.8 9.0 2.2
Individual analysis of data for each thin layer run showed satisfactory agreement between the experimental data and model. However, difficulties were experienced in modelling the effect of temperature on predictions of drying corn. To overcome this, a “super file” which combined all experimental data from all runs was created and analysed using the modified two compartment model (Eq.8). Fitting data to Eq.8 gave: MR=0.411 exp[-(0.000401+0.000247T)t] + 0.480 exp[-(0.00019+5.2E-06T)t]
with a correlation coefficient of 0.9858 and standard error of 0.034.
(13)
A comparison between experimental data and the model is shown in Fig.8. A nearly linear relationship between experimental data and the model over a range of temperatures is shown in Fig.9. These show reasonable agreement between the data and the modified two compartment model.
Deep Bed Drying A deep bed of product can be represented as a number of thin layers. The first layer acts as a true thin layer for constant inlet conditions. The second layer is affected by the outlet conditions of the first layer, resulting in a time delay before it is exposed to drying air. In this way, there will be a time delay dependent on depth before layers deep within the grain are exposed to the same conditions as the first layer. Application of the deep bed drying model using thermophysical experimental data can help in optimising the selected drying conditions and predicting the drying rate and drying time. Examples of deep bed drying conditions for a 70 cm bed of popcorn are shown in table 2. Figure 10 shows the drying curves as predicted by the deep bed drying model, using the thermophysical data obtained in earlier experiments. The purpose of the two drying runs was to demonstrate the effects of deep bed drying on popping quality of corn. More extensive studies have been planned for future field tests. Table 2. Run conditions for deep bed drying Run No. 1 2
Time (hours) 29.5 233.8
Initial M 17.4 17.4
T plenum (°C) 22.2 16.8
Airspeed m/min 5.5 5.5
RH plenum (%) 45.2 65.8
Run No. 2 lasted considerably longer than run No. 1 since the strategy chosen was to use continuous aeration. The long duration of the experiment was the result of changing ambient RH during the course of drying. A rigorous RH control strategy is required in order to reduce the duration of in-store drying. Such a strategy will be implemented in field trials testing the models developed in the course of this study. The predictions of the model were tested with laboratory drying of 70 cm grain depths and the speed of the temperature front was found to agree well with actual data (to within 5%). Based on these results, the model can be used for drying strategy development. In addition, field tests are currently being conducted to provide data for further validation of the model. Popping Test The data for popping are summarised in table 3. The results suggested that S variety has a higher expansion and popped ratio than M variety. This may be due to the higher final moisture content of S corn compared with M corn. The result also suggests that even though the moisture content of corn was out of the recommended range (12.3%
for M variety run no.2 and 14.8% for S variety run no.1), the popping quality was still very high (i.e. expansion ratio > 38). Table 3. Summary data for popping final mc (%wb) run no. 1 M corn S corn run no. 2 M corn S corn
tests
weight of expansion unpopped expansion corn (g) volume (ml) portion ratio
popped ratio
13.4 14.8
30.0671 30.1715
1248 1324
1.38045 0.8154
42 44
95 97
12.3 12.85
30.0571 30.0958
1202 1250
1.21254 0.60942
40 42
96 98
CONCLUSIONS The thermophysical properties of popping corn, raw material for popcorn, were experimentally determined and presented in appropriate mathematical models. The knowledge of these properties is essential for establishing the optimum drying conditions for the product as well as in the design and simulation of the drying process. The moisture sorption isotherms were determined using the static gravimetric method, employing salt solutions to maintain constant relative humidities at different temperatures. The modified Chung-Pfost equation adequately characterised the sorption isotherms of popcorn. The bulk properties of popcorn were determined experimentally and found to be moisture dependent. The pressure drop across the corn bed increased as moisture content decreased during the course of drying. The modified Ergun’s model was found to fit satisfactorily to the pressure drop data. A series of thin layer drying experiments was conducted to measure the rate of decrease of moisture content as a function of temperature. The two compartment model was fitted to the experimental data, assuming a single linear temperature dependence of the drying constants. It was suspected that moisture gradients established in the low moisture popcorn during the desorption process had not yet dissipated when the low temperature equilibrium measurements were made. The results support the conclusion that moisture gradients dissipate very slowly in low moisture popcorn which is undergoing desorption. Deep bed drying of popcorn was performed. The corn was dried to a satisfactory moisture content and resulted in very high expansion and popping ratios. The thermophysical properties of popcorn were used in the drying simulation program to derive the drying pattern of popcorn during deep bed drying. It has been established that continuous aeration with ambient air may result in extending the drying time. Hence a relative humidity based control system operating within strictly defined limits appears a more adequate drying strategy for near-ambient air aeration drying.
ACKNOWLEDGMENTS The authors of this study would like to acknowledge the financial support of the Australian Centre for International Agricultural Research (ACIAR) and the supply of materials and equipment by Allgold Foods Pty Ltd that made this work possible.
NOTATION a = constant b = constant c = constant c1..c4 = constant e = constant F = proportion of fine material (%) k1..k4 = constant M = grain moisture (decimal, dry basis) M1 = initial weight of corn sample (g) M2 = final weight of corn sample (g) Mw = M1 - M2 (g) MR = moisture ratio (moisture content at any time - equilibrium moisture content / initial moisture content - equilibrium moisture content) in %db RH = relative humidity (%) T = temperature (°C) t = drying time (hours) Vs = superficial air speed (m/s) W = wet basis moisture content (%) W1 = initial moisture content of corn (%wb) W2 = final moisture content of corn (%wb) εB = bulk porosity ρB = bulk density (kg/m3) ρT = true density (kg/m3) LITERATURE CITED ASAE, 1988. ASAE Standards 1988. Standards engineering practices data, 35th edition. ASAE, St Joseph, MI. Bemis, W.P. and Huelson, W.A., 1955. Dehydration and rehydration in relation to endosperm fracturing of popcorn. Proceedings of the American Society for Horticultural Science 65: 371-380. Brooker, D.B., Bakker-Arkema, F. W., and Hall, C. W., 1992. Drying and storage of Grains and Oilseeds. The Avi Book. NY. Cadden, A.N., 1988. Moisture sorption characteristics of several food fibres. J. Food Sci. 53(4): 1150 - 1155. Chung D.S. and Lee C.H., 1985. Physical and Thermal Properties of Grains. In: Champ, B.R., and Highley, E. eds., Preserving grain quality by aeration and in-store
drying: proceedings of an international seminar held at Kuala Lumpur, Malaysia, 9-11 October 1985. ACIAR Proceedings No. 15, 53-66. FAO, 1997. FAOSTAT Agriculture Data. On line at: http://apps.fao.org/cgi-bin/nphdb.pl?subset=agriculture Farmer, G.S., Brusewitz, G.H. and Whitney, R.W., 1983. Drying properties of blue stem grass seed. Trans. ASAE 26(1): 234-237. Franca, A.S., Fortes, M. and Haghighi, K., 1994. Numerical simulation of intermittent and continuous deep-bed drying of biological materials. J. Drying Technol., 12 (7): 1537-1560. Graham, V.A., Bilanski, W.K. and Menzies D.R., 1983. Adsorption grain drying using bentonite. Trans. ASAE 25(5): 1512-1515. Greenspan, L., 1977. Humidity fixed points of binary saturated aqueous solutions. Journal of research of the National Bureau of Standards. Vol. 81A(1): 89-96. Gunasekaran, S. and Jackson C.Y., 1988. Resistance to airflow of grain sorghum. Trans. ASAE 31(4): 1237-1240. Lewis, M.J., 1987. Physical properties of food and food processing system. Ellis Horwood, Chichester, West Sussex. Hall, P.E., 1980. Drying and Storage of Agricultural Crops. Avi Publishing Co., Inc., Westport. Jayas, D.S., Alagusundaram, K. and Irvine D.A., 1991. Resistance to airflow through bulk flaxseed as affected by the moisture content, direction of airflow and foreign material. Can. Agric. Engng 33(2): 279-285. Li, H. and Morey, R.V., 1984. Thin layer drying of yellow dent corn. Trans ASAE. 27(2) 581-585. Multon, J.L., Savet, B. and Bizot, H. 1980. A fast method for measuring the water activity of water in foods. Lebensm-wiss. U. Technol. 13(5): 271-273. Palipane, K.B., Driscoll, R.H., 1994. The thin layer drying characteristics of macadamia in-shell nuts and kernel. J. Food Engng. 23: 129-144. Ross, I.J. and White, G.M. 1972. Thin layer drying characteristic of white corn. Trans. ASAE: 15(1): 175-176. Sharaf-Eldeen, Y.I., Blaisdell, J.L. and Hamdy, M.Y., 1980. A model for ear corn drying. Trans. ASAE. 23(5): 1261-1265,1271. Shove, G.C., 1971. Simultaneous multilayer grain drying. Trans. ASAE 14 (1): 134-137. Sokhansanj, S. Falacinski, A.A., Sosulski, F.W., Jayas, D.S. and Tang J., 1990. Resistance of bulk lentils to airflow. Trans ASAE 33(4): 1281-1285. Visvanathan, R., Varadharaju, N. Gothandapani, L. and Sreenarayanan V.V., 1990. Effect of moisture content on angle of repose and bulk density of selected food grains. J. Food Sci. Technol. 27(3) 133-135. White, G.M., Ross, I.J., and Poneleit, C.G., 1980. Influence of Drying Parameters on the Expansion Volume of Popcorn. Transactions of the ASAE, 23, 5, 1272-1276. White, G.M., Ross, I.J., and Poneleit, C.G. 1981a. Stress Crack Development in Popcorn as Influenced by Drying Conditions. American Society of Agricultural Engineers Paper 81-3032, presented at the Summer Meeting of ASAE at Sheraton-Twin Towers, Orlando, Florida, June 21-24, 1981. White, G.M., Ross, I.J. and Poneleit, C. G. (1981b). Fully exposed drying of popcorn. Trans ASAE 24(2): 446-468.
35
mc (% db)
30
30 C 40 C
25
50 C
20 15 10 0
20
40
60
80
100
RH (%)
Figure 1. Moisture sorption isotherm of popcorn (M variety)
35
mc (% db)
30
30 C 40 C
25
50 C
20 15 10 0
20
40
60
80
RH (%)
Figure 2. Moisture sorption isotherm of popcorn ( S variety)
100
100
Model RH (%)
80 60 40 20 0 0
20
40
60 RH (%)
Figure 3. Chung-Pfost RH model
80
100
bulk density (kg/m3)
910 900 890 880 870 860 850 12
13
14
15
16
17
mc (%wb)
Figure 4a. Bulk density of popcorn (M variety)
18
bulk density (kg/m3)
910 900 890 880 870 12
13
14
15
16
17
mc(%)
Figure 4b. Bulk density of popcorn (S variety)
18
Pressure drop (Pa)
12 10 8 6
13.6 %wb 17 %wb
4 2 0 0
0.1
0.2
0.3
0.4
0.5
Air velocity (m/s)
Figure 5. Pressure drop of popcorn vs. air velocity
Pressure drop (Pa/m)
12 10 8 6 4 2 0 0
0.1
0.2
0.3
0.4
Air velocity (m/s)
Figure 6a. Comparison of pressure drop experimental data with model (13.6%wb corn)
0.5
Pressure drop (Pa/m)
12 10 8 6 4 2 0 0
0.1
0.2
0.3
0.4
Air velocity (m/s)
Fifure 6b. Comparison of pressure drop experimental data and model (17%wb)
0.5
moisture content (%db)
25 20 15 10 5 0 0
1000
2000
3000
4000
time (min) Figure 7. Thin layer drying of popcorn (run # 2)
0
ln(MR)
-0.5 0
1000
2000
3000
4000
-1 -1.5 -2 -2.5 -3 Time (min)
Figure 8. Comparison of data and model (run # 2)
5000
1 0.9
model
0.8 0.7 0.6 0.5 0.4 0.3 0.2 0.1 0 0
0.2
0.4
0.6
0.8
data
Figure 9. Comparison experimental data vs. model for thin layer drying of popcorn
1
1.2
temperature in deg. C
23 22
1st layer
21 20 19
3rd layer
2nd layer
4th layer 5th layer
18 17 16
6th layer Series7 8th layer
15 14
9th layer 10th layer
0
10
20
30
drying time in hours
Figure 10. Predicted deep bed drying model for run No. 1