AGRICULTURE AND BIOLOGY JOURNAL OF NORTH AMERICA ISSN Print: 2151-7517, ISSN Online: 2151-7525, doi:10.5251/abjna.2011.2.4.622.629 © 2011, ScienceHuβ, http://www.scihub.org/ABJNA
Effect of water management and nitrogen rates on iron concentration and yield in lowland rice Ethan S., A.C. Odunze, S.T. Abu and E.N.O. Iwuafor 1
National Cereals Research Institute Badeggi (NCRI), PMB 8 Bida, Niger State, Nigeria 2
Institute of Agricultural Research, Ahmadu Bello University PMB 1044 Zaria, Nigeria ABSTRACT In order to attain self-sufficiency of rice in Nigeria, production could be increased to feed the growing population. Water for irrigation is becoming scarce; iron toxicity is a major constraint in the production of lowland rice under waterlogged conditions. Loss of nitrogen through denitrification and leaching also mitigate against sustainable irrigated rice production in Bida area. A field trial was conducted in 2009 and 2010 to evaluate water and nitrogen management on concentration of iron as it affects yield of lowland rice in the NCRI research fields in Bida,Niger State. The results obtained show that there were significant differences in plant height, panicles number, straw and grain yield when compared with the control (farmers practice). There were no significant differences in grain yield between treatments three with values of 3.05 t ha-1 and four with 2.80 t ha-1. Yields generally increased with increasing levels of nitrogen and declined from 80 kg ha-1. Nitrogen use efficiency increased with increasing levels of nitrogen rates and was 4.78 kg at 80 kg N ha-1.There were also significant differences in plant tissue iron content but no significant differences in grain iron content. Iron concentration was higher in the control than treatments with higher levels of nitrogen as shown by iron toxicity score. Irrigation water was applied at soil moisture tension of -30 KPa. The total water applied was 1348 mm including rainfall and crop water use for the control that had flooding till harvest. The treatment that was drained four times at intervals saved 143 mm and water use efficiency was 4.78 kg mm1 .Appropriate water and nitrogen management could reduce the intensity of iron in rice to enhance sustainable yield increases of paddy rice in the lowland soils of Bida area. Keywords: Water Management, N-rates, Iron concentration in soils, Lowland rice.
INTRODUCTION Lowland rice is cropped on approximately 128 million hectares worldwide under irrigated and rain fed conditions (MacLean et al.,.,, 2002). In West Africa, lowland area is estimated at 19 million hectares (Malton et al.,.,, 1996; Diatta et al.,.,, 1998). Coupled with these figures, rice growth is affected by various constraints (Audebert, el al, 2006).Growth reduction in rice is caused by nutritional deficiencies and toxicities. Iron toxicity is one of the main nutritional disorders, which limits yield of lowland rice. Higher 2+ concentration of Fe in the rhizosphere also has antagonistic effects in the uptake of many essential nutrients (Fageria, et al.,2008). Among the toxicities, iron toxicity is acknowledged as a widespread disorder affecting growth of crops, principally lowland rice (Dobermann and Fairhust, 2002; Cheriff, et al., 2009). All types of lowlands (mangrove, irrigated, rainfed) with or without water control, can be affected by iron toxicity constraint in tropical zones. The poor
level of development of lowlands in West Africa, epitomized with bad water management, generates favorable conditions for occurrence of iron toxicity (Kosaki et al., 1986; Okusami, 1986; Audebert and Sahrawat, 2000). On acid soils it is considered one of the most significant constraints of rice production along with Zn deficiency (Neue et al., 1998; Becker and Asch, 2005). Iron toxicity in rice is generally associated with 2+ excessive quantities of ferrous ion (Fe ) reduced in the soil (in situ) or interflow from adjacent upland. This constraint can occur on large number of soils, but the general character of iron toxicity raises value of reduced iron, acid pH, low cation exchange capacity and low exchangeable K (Kirk, 2004; Ottow et al., 1993 Kirk, et al., 1993).These traits can be associated with Zn deficiencies as well as H 2 S toxicity.
Agric. Biol. J. N. Am., 2011, 2(4): 622-629
For iron toxicity to occur. Fe2+ must pass the oxidation barrier of the rhizosphere to be taken up by the plant. Rice root diffuse molecular oxygen into the root medium through aerenchyma which increases the redox potential of the rhizosphere over that of the growing media (Ando, 1983; Kirk, 2004). If Fe2+ is able to escape the oxidative barrier and permeate into the roots, part is retained in the roots and the reminder may be translocated to the shoots via the xylem after having passed the barrier of the casparian strip (Marschner, 1995).
(3)Flood with 5cm of standing water, drain 60 DAT; flood again after 7 days, and allow water to stand for 30 days; repeat the sequence. (4) Flood with 5cm of standing water, drain 90 DAT; flood again after 7 days; allow water to stand till harvest. The subplots -1 treatments imposed were: 40 kg N ha (control) -1 -1 farmers practice, 60kg N ha , 80 kg N ha , and 100 kg N ha-1. Phosphorus and potassium were applied as single super phosphate and K 2 O, at 45 kg P 2 O 5 ha-1 and at 45 kg K 2 O ha-1 respectively. The main plots were 12x5m2 and the subplots 5x3m2. The field plots were puddled and kept continuously flooded and drained at determinate intervals from transplanting till 2 weeks before harvest, when the fields were finally drained. The water depth was initially 5 cm and gradually decreased to 2 cm when water is again applied to bring the depth to 5 cm for the plots that have standing water. Field plots were drained at intervals for a period of 7days and again water was applied to bring up the depth to 5 cm. Reflooding the fields after 7 days was equivalent to soil water potential of -30 KPa . This threshold for soil water tension was similar with results from research in alternately submerged-nonsubmerged systems (Bouman and Tuong, 2001; Belder et al., 2004). Plastic sheets were installed down to 40 cm in the bunds of all subplots in order to control the mobility of nitrogen from one subplot to another. Irrigation water was supplied to the field plots through orifices of 1m long with a diameter of 7.62cm (PVC pipe). The discharge was calculated as the cross- sectional area of the orifice multiplied by velocity.
The yield loss induced by the iron toxicity is frequently associated with low nutritional status. Consequently, iron toxicity can be defined as a multiple nutritive disorder further increased by P, K, and Zn deficiencies through excesses of H 2 S (Ottow et al., 1993;Fageria, et al.,2008). Symptoms of iron toxicity in rice results from excessive uptake of ferrous ions by the roots and their acropetal translocation through xylem outflow to the aerial parts. The typical symptoms linked to this are the bronzing or yellowing processes of the leaves (Becker and Asch 2005). Yield losses associated with the occurrence of iron toxicity symptoms generally range from 15-50%. In the case of serious toxicity however; total harvest loss can occur (Abifarin, 1988; Audebert and Sahrawat, 2000). The objectives of this study include, (1) evaluating the effect of water management and nitrogen rates on iron concentration and yield of lowland rice and (2) to develop water management techniques and nitrogen rates suitable for low iron content rice production for the ecology.
Twenty one-day old seedlings from wet – bed nursery of FARO 35 (susceptible to iron toxicity), 140 days variety lowland rice were transplanted with three seedlings per hill at a spacing of 20x 20 cm. Fertilizer was applied seven days after transplanting as basal application this include the whole of single superphosphate and potassium, urea was applied in 3 splits as 44, 66, 87 and 112g N/plot according to the N-treatments. The application of urea was in three equal splits (7 DAT, maximum tillering, and at panicle initiation stages). Weeding was done 2 times for the plots with continuous standing water and 3 times for the ones that were drained at intervals.
MATERIALS AND METHODS Experimental site: The experiment was conducted at the National Cereals Research Institute Badeggi, 0 ’ 0 Edozighi research farm (lat. 9 06 N and long. 5 ’ 59 E). Soils of the area were classified as dystric gleysol, silt-loam and iron-toxic ( Narteh and Sahrawat,1999).The climate is characterized by a distinct wet season from April to November with average rainfall of about 1200mm and dry season from November to March. Experimental design: The experiment was laid out in a split plot design with four replications. Four water management treatments were implemented as the main plot: (1) Flood with 5cm of standing water from transplanting to harvest. (2)Flood with 5cm of standing water, drain 30 days after transplanting (DAT); flood again after 7 days and allow water to stand for 30 days; repeat the sequence up to harvest.
Measurements: The amount of irrigation water applied was monitored at each irrigation by measuring the amount of water that passed through the orifices (1m long with a diameter of 7.62cm); and it took about 15 minutes to attain 5cm height. Vacuum gauge tensiometers were installed at 35 cm for daily measurement of the soil moisture tension in
623
Agric. Biol. J. N. Am., 2011, 2(4): 622-629
the drained plots. The groundwater table depth was measured at weekly intervals, using one meter long piezometers which were halfway perforated (50 cm) and installed in the soil. Sixteen hill/ plant samples were taken at 30, 60, and 90 DAT. for all treatments to determine tissue iron and nitrogen content. The samples were oven dried at 70 0 C and then finely ground to pass through a 0.5 mm sieve. Nitrogen uptake was calculated from the nitrogen concentration of the grains and straw. Grain and straw weight were taken from 12 m2 in the centre of the plots.
(2008). Submerged lowland soils mobilize large 2+ concentration of Fe into soil solution which displace cations such as Ca, Mg, and K from the soil exchange complex, and increases their concentration in the soil solution. Ponamperuma (1972) and Fagaria et al.,(2008) also reported increase in soil and solution pH as a result of submergence and this is attributed to the consumption of protons during reduction processes. Narteh and Sahrawat (1999) in their study of West African flooded lowland soils indicated that flooding affects electrochemical and chemical processes which, in turn, affect soil fertility in a dynamic manner. The main electrochemical changes that affect soil fertility include a decrease in redox potential and changes in soil solution pH. These changes are mainly controlled by organic matter and reducible-Fe contents of soils. The chemical changes influenced by flooding include the release of macro-and micronutrients which depend on soil characteristics, especially texture, organic matter and reducible-Fe.
Soil samples (20 cm depth) were collected air-dried, crushed with porcelain pestle and mortar and sieved to remove materials greater than 2mm for physical and chemical analysis. Soil pH was measured by a glass electrode using soil to water ratio of 1:2.5. Particle size analysis was made using hydrometer method (Gee and Bauder, 1986). Organic carbon was determined by the Walkley-Black method (Nelson and Sommers, 1982), and total N was determined as described by Bremmer (1965). Extractable P was determined as described by Olsen and Sommers (1982). Cation exchange capacity (CEC) was determined as described by Chapman (1965). Exchangeable bases and Al in soil samples were also determined (Jackson, 1967).
Table 1. Physical and chemical characteristics of the soil. Parameter
Water use efficiency was calculated as the ratio of biological yield (grain + straw) and total water applied. Nitrogen use efficiency is the ratio of nitrogen content in the grain and straw and the nitrogen applied (Bouman et al., 2005). Meteorological data collected at the site included rainfall, evaporation, wind speed, minimum and maximum temperatures. Evaporatranspiration (water used) was calculated using class A pan evaporation method: 0.70 x E pan (FAO 2010). Standard evaluation of rice (IRRI 1988) was used to score iron toxicity, (1-not severe, 9- severe).
dystric gleysol
Texture
silt-loam
pH (H 2 O)
4.50
pH (KCl)
3.15 -1
Organic C (g kg )
P Bray1
6.30 -1
CEC
(cmol kg ) -1
(mg kg )
4.23 342
-1
Mn (mg kg ) -1
Zn (mg kg ) Al (mg kg )
76.00
K (cmol kg-1)
0.14 -1
Ca (cmol kg )
The soil which was silt-loam in texture was generally acidic in reaction, had net negative charge at the natural soil reaction as indicated by the fall in pH between water and KCl. The soil was deficient in crop nutrients such as P, K, Ca, Mg and low CEC (Table 1). In addition, the soil was high in organic carbon, extractable iron and low Zn. This is the characteristics of waterlogged lowland soils as reported by Ponamperuma (1972) and Fagaria et al.,
-1
Mg (cmol kg ) -1
Na cmol kg ) Eh(mV)100to100(Patrick&Reddy(1978)
624
12.17 2.00
-1
RESULTS AND DISCUSSION
5.60
-1
Fe (mg kg )
Statistical analysis was done using S.A.S system mixed model (S.A.S.Institute, 1994).
Classification
0.8 0.23 0.15
Agric. Biol. J. N. Am., 2011, 2(4): 622-629
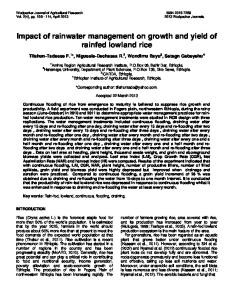
Water management: Increasing water scarcity during the off-season and increasing adverse subsoil water levels necessitates the development of techniques that require less water than traditional flooded rice. Researchers are developing water saving technologies, such as alternate wetting and drying (Bouman and Tuong, 2001; Belder et al., 2004; Tinh, et al.,2000), and continuous saturation (Borell et al., 1997). The total water applied was 1438 mm; including rainfall and crop water use was 505 mm for treatment 1 that had continuous flooding. The treatment that was drained four times during the crops life cycle (treatment 2) had the least water input of 1295 mm and the water use was 362 mm (Fig.1). This means that draining at thirty day- interval for seven days, four times in the crops life cycle saved 143 mm when compared with continuous flooding.
The advantages of draining the waterlogged soil are enormous. Firstly, it oxidizes the soil and precipitates 2+ 3+ Fe to Fe which is insoluble. Iron oxidization allows microbes to gain energy. The ferric ion produced, physically protects the microorganisms. Iron is a good electron acceptor; oxygen and nitrate suppress iron reduction (Mullilab, 2008). Water management had actually increased yield. Treatment 3 with continuous standing water for 60 days, drained for seven days; re-flooded for 30 days and drained again for seven days and re-flooded for 30 days was superior in yield to treatment 1 that had continuous flooding from transplanting to harvest, as shown in Table 2. This was probably due to high iron concentration in treatment 1 and low N – input (farmers practice). Water used efficiency was 4.80 kg -1 mm .
Fig1. Water applied and water used in lowland rice.
Nitrogen management: Nitrogen management had significantly influenced plant tissue iron content. The control (farmers practice) had the lowest N-rate application and the highest plant tissue iron concentration. Treatment 4 which had the highest Nrate also had the lowest iron concentration (Fig.2). The plant tissue iron concentration was between 216.81 and 287.25 mg kg-1 across the treatments. Nitrogen content in grain was however not significant. These values indicate that the more the nitrogen content in soil solution the less the ferrous (Fe2+) concentration in plant tissues and consequently higher yields. The results corroborated with the
findings by Sahrawat (2002); Sahrawat (2005); Fageria et al., 2001; and Srivastava, et al.,2009). When a soil is flooded followed by several circles of wetting and drying conditions, oxygen in flooded soils is rapidly depleted. This may inhibit nitrification, allowing NH 4 + - N to remain the dominant form of nitrogen available to the rice crop. When the soil is aerated as was drained for seven days intervals, ammonium formed from mineralization of the applied urea would oxidize into nitrate which would be taken up by the plant. Rice plant growth and yield are generally improved when plants absorb their nitrogen
625
Agric. Biol. J. N. Am., 2011, 2(4): 622-629
as a mixture of NO 3 and NH 4 + compared with growth on either source on its own (Kirk and Kronzucker,2005) Re-flooding the soil may leach NO 3 -N and could be denitrified (Ponnamperuma, 1984; Kirk, 2004). Different lowland soils flooded may greatly differ in their capacity to release ammonium and thus may need different amounts of external N to achieve a target yield (Sahrawat, 2005).
influences bacteria activity and thus, oxidationreduction conditions around the root. Fig.3. Regression analysis of nitrogen rates and grain yield.
Fig.2. Plant tissue iron content and N-rates in lowland rice.
Growth and yield components of lowland rice: In this study water management and N-rates significantly increased grain yield. The highest yield was obtained from treatment 3 that had flooding for 60 days and was drained three times; with nitrogen rate of 80 kg ha-1. Grain yields ranged from 1.24t ha-1 to 3.05t ha-1 across the treatments. Rice plant height was also significantly affected by the iron concentration as seen from the iron toxicity score (Table 2).Rice plant height increased with increase in N-levels, and ranged from 52 to 89 cm. Panicle number (per m2) were significantly influenced by the treatments, and they also increased with increase in N-rates. Panicle number (per m2) ranged from 202 to 302; treatment 3 had a value of 302 panicle number and treatment 4, 300 and these were not significantly different. Straw weight was affected by the iron concentration significantly, but treatment 3 with a value of 3.83 t/ha was not significantly different from treatment 4 with a value of 3.94 t/ha. The straw weight ranged from 2.02 to 3.94t ha-1across the treatments. One thousand rice grain weights were significantly affected; treatment 1 had the lowest Nrate and also the lowest grain weight. Iron toxicity scores based on normal symptoms were generally lower in treatments 3 and 4 where N-application was higher.
Yields were significantly increased by increasing the nitrogen levels and declined when the N-rates were more than 80 kg ha-1.This implies a reduced uptake of nitrogen at more than 80 kg ha-1 application by the rice crop. There was a linear correlation between nitrogen levels and grain yield (R2= O.77) as seen in (Fig.3). The variability in yield was partly due to iron concentration in the plant tissue and differences in nitrogen rates. Nitrogen use efficiency (NUE) was 4.78 kg for treatment 3 and the highest, when compared with treatment 1 with a value of 2.27 kg. Treatments 2 and 4 had NUE values as 3.53 and 4.70kg respectively. A long term nitrogen fertilizer trial (Trolldenier, 1977) under lowland conditions revealed that an abundant supply of nitrogen can decrease redox potential. Redox potential was highest in soils near the plants than in soils away from the plants (Trolldenier, 1977; Fagaria, et al., 2008). Total number of bacteria and iron reducing bacteria increased almost parallel to the decrease in redox potential and increase in iron reducing power (Trolldenier, 1977;Begg, et al.,1994; Liesack, et al.,2000). These relationships showed that the nutritional status of the rice plant essentially
626
Agric. Biol. J. N. Am., 2011, 2(4): 622-629
Table 2. Grain yield and yield components of lowland rice Treatments
Plant
Panicles 2
Straw
grain
1000
Iron toxicity
(Kg N/ha)
height (cm)
(m )
weight (t/ha)
(t/ha)
grains weight (g)
score
40 (control)
52.00 c
202.00 c
2.02 c
1.24 c
13.81 c
6a
60
66.00 b
251.00 b
3.03 b
2.05 b
15.64 b
4b
80
89.31 a
302.00 a
3.83 a
3.05 a
17.45 a
2c
100
89.50 a
300.00 a
3.94 a
2.81 a
17.81 a
2c
S.E
0.307
0.290
0.009
0.030
0.008
0.182
C.V
2.37
1.50
3.54
5.29
0.20
24.90
WM
ns
**
**
**
ns
ns
NM
**
**
**
**
**
**
WM*NM
**
**
**
**
**
ns
CONCLUSION
The convergence of soil pH of acid soils to neutrality following submergence of soils as studies have shown (Ponnamperuma,1972.; Narteh and Sahrawat,1999) benefits lowland rice crops through + better availability of nutrients such as NH 4 , P, K and exchangeable cations, which are mobilized in soil solution. In aerobic conditions Fe2+ precipitates to Fe3+ this gives rise to nitrification and eventual uptake of NO 3 - ions. Combination of aerobic and anaerobic conditions in iron-toxic soils increased grain yield of lowland rice and saved water.
The study showed that the soil had high organic carbon and extractable iron, low exchangeable bases, pH and cation exchange capacity (CEC) and was deficient in crop nutrients P, K, and Zn. This is the characteristics of waterlogged lowland rice soils. Submerged soils mobilize large concentration of Fe2+ into soil solution which displace cations such as Ca, Mg, and K from the soil exchange complex, and increases their concentration in soil solution. Flooding affects electrochemical and chemical processes which in turn, affect soil fertility in a dynamic manner. The main electrochemical changes that affect soil fertility include a decrease in redox potential and changes in soil and solution pH .These changes are mainly controlled by organic matter (organic carbon) and reducible-Fe contents of soils. The chemical changes influenced by flooding include the release of macro-and micronutrients which depend on soil characteristics, especially texture, organic matter and reducible-Fe.
Water and nitrogen management minimized the toxic effect of excess iron on grain yield. When nitrogen fertilizer was applied in the iron-toxic lowland, results obtained show that there were significant differences in plant height, panicles number, straw and grain yield, these differences manifested in increased yield. There was decrease in iron concentration in the rice plant tissue with increase in N-level. We also observed that there was increase in grain yield with increase in N-levels. This was consistent until there was a decline in yield -1 beyond 80 kg N ha application rate; however, this was not significant. Nigerian farmers, especially those living in the study area though resource poor should adopt application of 80 kg N ha-1,45kg P 2 O 5 ha-1 and 45 kg K 2 O and drain their rice fields at least 3 times during a cropping season.
Nitrogen and water interactions under irrigated systems are often similar to dry land systems, except the interactions operate at higher yield levels. Fertilizer is one of the controllable factors influencing water use in irrigated soils. When N is deficient, increasing N fertilization will increase yield, total water use and water use efficiency. The availability of free water on the soil surface and draining at intervals produce a more conducive environment to rice roots, availability, and accessibility of nutrients through diffusion and mass flow to plant roots.
REFERENCES Abifarin, A.O.1988. Grain yield due to iron toxicity. WARDA Tech. Newsletter 8 (1) 1-2.
627
Agric. Biol. J. N. Am., 2011, 2(4): 622-629
Fagaria, N.K.; N.A.B.Santos; M.P.Barbosa; and C.M.Quimanqes,2008. Iron toxicity in lowland rice. J. Plant Nutr. 31(9) 1676-1699.
Ando, T.1983. Nature of oxidizing power of rice roots. Plant Soil 72, 57-71. Audebert, A.; K.L. Sahrawat, 2000. Mechanism for iron toxicity tolerance in lowland rice. J. Plant Nutr. 23, 1817-1885.
Food and Agricultural Organization (FAO), 2010. F A O corporate document repository. International Rice Research Institute (IRRI).1988. Standard Evaluation System of rice. Manila Phlippines.
Audebert, A.; L.T. Narteh; P Kiepe; D. Millar and B.Beks. 2006. Iron toxicity in rice-based systems in West Africa. Africa Rice Center (WARDA) Cotonou, Benin.pp 175.
Gee,G.W.and J.W. Bouder, 1986.Particle size analysis. In: Klute, A. (Ed). Methods of soil analysis Part 1.Agron.vol.9. Am.Soc. Agron. Madison WI pp 383411.
Becker,M.and F. Asch, 2005. Iron toxicity in rice-conditions and management concept. J. Plant Nutr. and Soil sci.110: 47-57.
Jackson, M.L.1967. Soil chemical analysis. Prentence Hall,New Delhi, India. pp 498.
Begg,C; G.J.D. Kirk; A.F. Mackenze and H.U.Neue 1994. Root-induced iron oxidation and pH changes in lowland rice rhizosphere. New Phytol. 128,469-477.
Kirk, G.J.D. 2004. The Biogeochemistry of submerged soils. Chichester,U.K. John Wiley and sons. P 291.
Belder, P.; B.A.M. Bouman; R. Cabangon; G.Lu; E.J.P. Quilang; Y. Li; J.H.J. Spiertz; and .T.P.Tuong2004. Effect of water saving irrigation on rice yield and water use in typical lowland conditions in Asia.Agric. water manage. 65,193-210.
Kirk, G.J.D.; C.M.B. Begg and J.L. Solivas, 1993. The chemistry of lowland rice rhizosphere. Plant and Soil, 155-156: 83-86.
Borell,A.;A.Garside and S. Fukai,1997. Improving efficiency of water for irrigated rice in semi- arid tropical environment. Field Crops Res.52,231-248.
Kirk,G.J.D. and H.J. Kronzucker, 2005.The potential for nitrification and nitrate uptake in the rhizosphere of wetland plants: A modeling study. Annals of botany 96 (4) 639 – 646.
Bouman,B.A.M.and T.P.Tuong,2001. Field water management to save water and increase its productivity in irrigated rice. Agric. Water manage. 49.11- 30.
Kosaki, T. and A.S.R. Juo, 1986. Iron toxicity in inland valleys: a case study from Nigeria. In: Wetlands and rice in sub- Saharan Africa.(A.S.R. Juo and J.A. Lowe Eds) Ibadan, Nigeria. IITA p 167-172.
Bouman, B.A.M.; S. Peng; A.R. Castaneda, R.M.Visperas, 2005.Yield and water use of irrigated tropical aerobic rice systems. Agric. Water manage.74,87-105.
Liesack,W.; Shnell, S.; Revsbech, N.P. 2000. Microbiology of flooded rice bodies. Microbiol. Rev.24, 625-645. Maclean, J.L.; D.C. Dowe; B. Hardy and G.P. Hettel, 2002. Rice almanac. Wallingford U.K.CABI Publishing p 253.
Bremmer,J.M.1965.Total N In: Black, C.A. et al., (Eds) Methods of soil analysis.Agron.vol.9.Am.Soc. Agron., Madison WI pp 1149-1178.
Malton, P.; T.Randolph; and R.Gule,1996. Impact of rice research in West Africa, International Conference on impact of rice research 3-5 June 1996. Bankok, Thailand IRRI P 313-323.
Chapman,H.D.1965. Cation exchange capacity. In: Black, C.A. et al., (Eds). Methods of soil analysis. Agronomy, vol.9. Am. Soc. Agron., Madison WI,pp 891-901.
Marschner, H.1995. Mineral nutrition of higher plants. Functions of mineral nutrients: Micronutrients. Academic press London pp313-323.
Cheriff, M.; A. Audebert; M.Fofana and M.Zouzou,2009.Evaluation of iron toxicity on lowland irrigated rice in West Africa.Tropicultura 27: (2) 88-92.
Mullilab, H. 2008. Manufacturers of microbiology products. New Delhi India.
Diatta, S.; A. Auderbert; K.L. Sahrawat and K. Traore 1998. Lutre contre la toxicite ferreuse du riz dans les basfonds. Acquis de ADRAO dans la zones des savanes en Afrique.Sikaso, Mali CIRAD-CA p 363-371.
Narteh, L.T. and K.L. Sahrawat, 1999. Influence of flooding on electrochemical and chemical properties of West African soils. Geoderma 87,178-2007.
Dobermann,A. and T.H. Fairhust, 2002. Rice nutrient disorders and nutrient management. Manilla. The Philippines. Int. Rice Res. Inst.p.191.
Nelson, D.W. and L.E.Sommers,1982. Total carbon, organic carbon, organic matter. In: (A.L. Page Ed). Method of soil analysis, part 2 Agronomy 9: 539-579.
Fagaria, N.K.; and V.C. Baligar,2001. Lowland response to nitrogen fertilization. Comm. in soil Science and plant analysis. 32,(9) 1405-1429.
Neue,H.U.; C. Quijaho; D. Senadhira; and T. Setter, 1998. Strategies for dealing with micronutrient disorders and salinity in lowland rice system. Field crops Res.56: 139-155.
628
Agric. Biol. J. N. Am., 2011, 2(4): 622-629
Statistical package S.A.S, model,S.A.S. Insitute.
Okusami, T.A.1986. Properties of some hydromorphic soils in West Africa. In : wetlands and rice in sub-saharan Africa.(E.S.R.Juo and J.A. Lowe Eds) Ibadan, Nigeria. IITA p 167-179.
1994.
S.A
.S.
mixed
Sahrawat, K.L.2000. Elemental composition of the rice plant as affected by iron toxicity under field conditions. Comm. Soil Sci. Plant Anal. 31, 2819-2827.
Olsen, S.R. and L.E.Sommers, 1982. Phosphorus. In: Page, A.L. et al.,., ( Ed). Methods of soil analysis Part 2. Agron. Vol. 9 (second ed) Am. Soc. Agron. Madison WI.403-427.
Sahrawat, K.L.2005. Iron toxicity in wetland rice and the role of other nutrients. J. Plant Nutr. 27 (8) 1471-1504.
Ottow, J.C.; K. Prade; W. Bertendreiter; and V.A. Jacq, 1993. Iron toxicity mechanisms of flooded rice in Senegal and Indonesia. Manpeller, France p 231-291.
Srivastava, A.K.; K. Claude and T.Gaiser, 2009. Response of lowland rice to iron toxicity at different slope positions. A case study in upper Queme Basin, Benin Republic. Agricultural journal 4: (5) 226-230.
Patrick, W.H.Jr.and C.N. Reddy, 1978. Chemical changes in rice soils. In: Soils and rice. International Rice Research Institute (IRRI),Manila, Philippines, pp 361379.
Tinh,T.K.; I. Nilsson; Thu Houng, H.T. 2000. Effect of the depth of water submergence on rice performance and soil solution chemistry. J.Soil Use Manage. 1, 26-31.
Ponnamperuma, F.N.1972. The chemistry of submerged soils. Advances in agronomy 24,29-96.
Trolldenier,G. 1977.Mineral nutrition and reduction processes in rhizosphere of rice. Plant and soil 47, 193-202.
Ponnamperuma, F.N. 1984. Effects of flooding in soils. In: Flooding and plant growth. (Koslowski, T. ed) Academic press, New York pp 9-45.
629